Article

Using the Normalized Difference Water Index (NDWI) within a Geographic Information System to Detect Swimming Pools for Mosquito Abatement: A Practical Approach

Department of Geography, California State University Fresno, Fresno 2555 E. San Ramon Ave, MS SB69, Fresno, CA 93740, USA
Remote Sens. 2013, 5(7), 3544-3561; https://doi.org/10.3390/rs5073544
Submission received: 28 May 2013 / Revised: 16 July 2013 / Accepted: 16 July 2013 / Published: 19 July 2013

Abstract

:
Mosquito-borne diseases affect millions of people worldwide. In the United States, since 1999, West Nile Virus (WNV) has infected 36,801 people and has caused the deaths of 1,580. In California, since 2002, nearly 3,600 people have been infected with WNV with an additional 124 fatalities. Analyses of remotely- and spatially-based data have proven to facilitate the study of mosquito-borne diseases, including WNV. This study proposes an efficient procedure to identify swimming pools that may serve as potential mosquito habitat. The procedure derives the Normalized Difference Water Index (NDWI) from high resolution, multi-spectral imagery to detect the presence of surface water, and then incorporates vector-based data layers within a GIS to identify residential land parcels with detectable water. This study compared the parcels identified as having water (535) with parcels known to have swimming pools (682) resulting in an accuracy of 78.4%. Nineteen of the 147 land parcels with swimming pools had backyards with enough vegetation to obscure the presence of a swimming pool from the satellite. The remaining 128 parcels lacked enough surface water for the NDWI to indicate them as actually having surface water. It is likely then that swimming pools, associated with such parcels, may have enough water in them to provide adequate habitat for mosquitoes, and so field inspection by mosquito abatement personnel would be justified.

1. Introduction

Mosquito-borne diseases affect many people throughout the world. In 2010, the World Health Organization (WHO) estimated that there were approximately 219 million cases of malaria and an estimated 660,000 fatalities [1], and from 1 to 50 million cases of dengue, including about 20,000 fatalities every year [2]. Cases of malaria and dengue in the United States of America (USA) remain low in number (279 and 64, respectively, for 2012) [3], but another mosquito-borne disease, West Nile Virus (WNV) (family Flaviviridae, genus Flavivirus), has continued to persist since its introduction in 1999 [4,5]. According to the Centers for Disease Control and Prevention, a cumulative total of 36,801 cases of WNV infections and 1,580 fatalities were reported in the USA from 1999 to 2012 in every state (including the District of Columbia) except for Alaska and Hawaii [3]. In the state of California, there were 3,598 cases of WNV infections and 124 fatalities from 2002 to 2012 [3]. Mosquito species responsible for the spread of WNV in California and include six species of culex (Cx. pipiens, Cx. quinquefasciatus, Cx. stigmatosoma, and Cx. tarsalis) and may be present in urban/suburban waters [6]. In 2008, Riesen et al. [7] noted that urban sources of mosquito production could include neglected swimming pools. Mosquito production is controlled in swimming pools, not by the presence of chemicals, such as chlorine, but rather by the filtration of the water, which removes the eggs [8]. Culex mosquitoes typically lay between 100 and 300 eggs at a time, and are arranged to fit together in such a manner that the collection of eggs forms a raft which floats on the water surface. A raft of eggs may be produced every third night during a female mosquito’s lifespan of a few weeks. Larvae emerge within 24 to 48 h [9]. Swimming pools at unoccupied homes may not have their water filtered as they should, and accumulated rainwater from winter rains, and decomposing leaves, would not have been removed from the pool, thus providing ideal habitat for mosquitoes to live and reproduce. Under such circumstances, tens of thousands of mosquitoes could be produced from a single pool every night. Riesen et al. [7] also noted that the presence of fences or gates could impede mosquito control personnel from conducting proper surveillance and treatment of swimming pools. Riesen et al. reported that swimming pools and Jacuzzis were easily identified from an aerial photograph, including those that appeared green and which were likely producing mosquitoes. This supports the concept of using remote sensing, either from aerial platforms, or from satellites, to facilitate the detection of suspect pools. In fact, many have used remote sensing and geographic information systems (GIS) as tools to study and control mosquitoes at varying spatial scales.
Much of the research into the application of remote sensing technologies to the study of mosquito-borne diseases has focused on using satellite data with the highest spatial resolution that is available. In 2003, Masuoka et al. compared the Landsat 7 Enhanced Thematic Mapper (ETM)+, with a spatial resolution of 30 m, to IKONOS imagery, which has a spatial resolution of 4 m, to determine their respective effectiveness in malaria control [10]. They found that both the Landsat 7 ETM+ and IKONOS imagery could be used to reasonably estimate habitat area, but only the IKONOS imagery could detect the presence of smaller ponds, which could be a significant source of water in which mosquitoes could breed. In 2007, Brown et al. compared data from three sensors—Hyperion with 30 m resolution and hyperspectral capability, the Landsat Thematic Mapper (TM) with 30 m resolution and multi-band capability, and the Advanced Space-borne Thermal Emission and Reflection Radiometer (ASTER) with between 15 and 90 m resolution and multi-band capability—in the identification of habitat suitable for mosquito production [11]. They found that the higher spectral sensitivity of Hyperion and the higher spatial resolution of ASTER yielded better results than the Landsat TM. Diuk-Wasser et al. found that Landsat 7 ETM+ was effective at identifying mosquito habitats in non-urban environments, but attempted no comparison with higher resolution image data [12]. Research employing data at resolutions that are equal to, or higher than, the 30 m available from the Landsat series has been extensive. In 2007, Lacaux et al. used Système Pour l’Observation de la Terre (SPOT) data at 10 m resolution to effectively study mosquito habitats in their investigation of Rift Valley Fever in Senegal [13]. In 2008, Stoops et al. compared the effectiveness of ASTER data (green, red, near infrared wavelengths) at 15 m resolution and data from the DigitalGlobe® satellite QuickBird (blue, green, red, and near infrared wavelengths) at 2.44 m resolution in their ability to identify mosquito habitat [14]. Their findings included that, although both did well in their ability to identify mosquito habitats, the less expensive ASTER data performed well enough to be used instead of the more costly QuickBird data.
Many studies have integrated remote sensing with GIS technologies in an effort to detect possible mosquito habitat, both in non-urban and urban settings. Zou et al. combined Landsat TM and ETM+ image data from 1999 to 2004 within a GIS to detect potential larval habitats of Cx. tarsalis associated with coalbed methane development with a 72.1% success rate [15]. Cleckner et al. employed Landsat ETM+ data from 2002, along with historical data of mosquito trap counts and climatic data for 2003, within a GIS to develop a spatial model that would identify mosquito habitats, and also predict mosquito abundance in coastal Virginia, USA [16]. The R2 values for the models ranged from 0.270 to 0.405, but the authors noted that, among other considerations, the distribution of the traps could have been better, and that improving their distribution in future work may increase the effectiveness of their models. In 2011, Hartfield et al. explored the fusion of aerial multispectral NAIP (National Agricultural Imagery Program) data with Light Detection and Ranging (LiDAR) data to classify the land-cover into eight urban classes which could impact mosquito habitat [17]. The data were processed at one meter spatial resolution and classes representing herbaceous, trees/shrubs, bare ground, pool, water, structures, and shadow were created. The best result was achieved using the four-band NAIP imagery, Normalized Difference Vegetation Index (NDVI)—generated from the NAIP imagery—and LiDAR, and which yielded an overall accuracy of 89.2% and a Kappa coefficient of 0.88. In 2011, Kim et al. used GeoEye-1® imagery to detect swimming pools in Bakersfield, CA, USA for the purpose of supporting WNV control efforts [18]. The approach first involved pan-sharpening the four-band visible/near-infrared multispectral data at 4 m resolution with the included panchromatic band with a spatial resolution of 1 m. The pansharpened multispectral data was then subjected to a geographic object-based image analysis (GEOBIA) to extract private swimming pools from the imagery. Kim et al. asserted that this approach would yield better results than more conventional pixel-based classification procedures because it considered spatial attributes such as size, shape, spectral values for each object, and contextual information in the thematic classification [18]. They observed that features such as roads and rooftops had spectral reflectances similar to those of swimming pools, and it was their assertion that the approach using GEOBIA would provide better discrimination between these surfaces. They used the Normalized Difference Water Index (NDWI) to extract swimming pools from other landscape features. The NDWI was first proposed by McFeeters in 1996 to identify non-urban surface water associated with wetlands [19]. Kim et al. used eCognition® Developer to segment the NDWI imagery and also to derive the relevant spectral and spatial attributes for each image object. They used Google Earth® imagery to verify the identification of swimming pools. They varied several parameters in their investigation, but the best results that they achieved were an overall classification accuracy of 92.2% and a Kappa coefficient of 0.86. Kim et al. demonstrated that it is possible to integrate remote sensing and GIS and apply object-based image analysis to detect and isolate swimming pools from other surfaces [18]. However, such an approach would require additional software, and additional training for a technician, before such analyses could be implemented.
The goal of this study was to develop an efficient procedure that would allow a GIS technician to integrate remote sensing, and assess its capability with a GIS of detecting surface features, spatially analyze data, and identify swimming pools that may not be properly maintained, which potentially provide habitat for mosquitoes to breed. It should be noted that although mosquitoes may breed in even very small amounts of water [8,9], the present study is limited to swimming pools as they are more easily detectable using high resolution imagery.

2. Study Area and Data
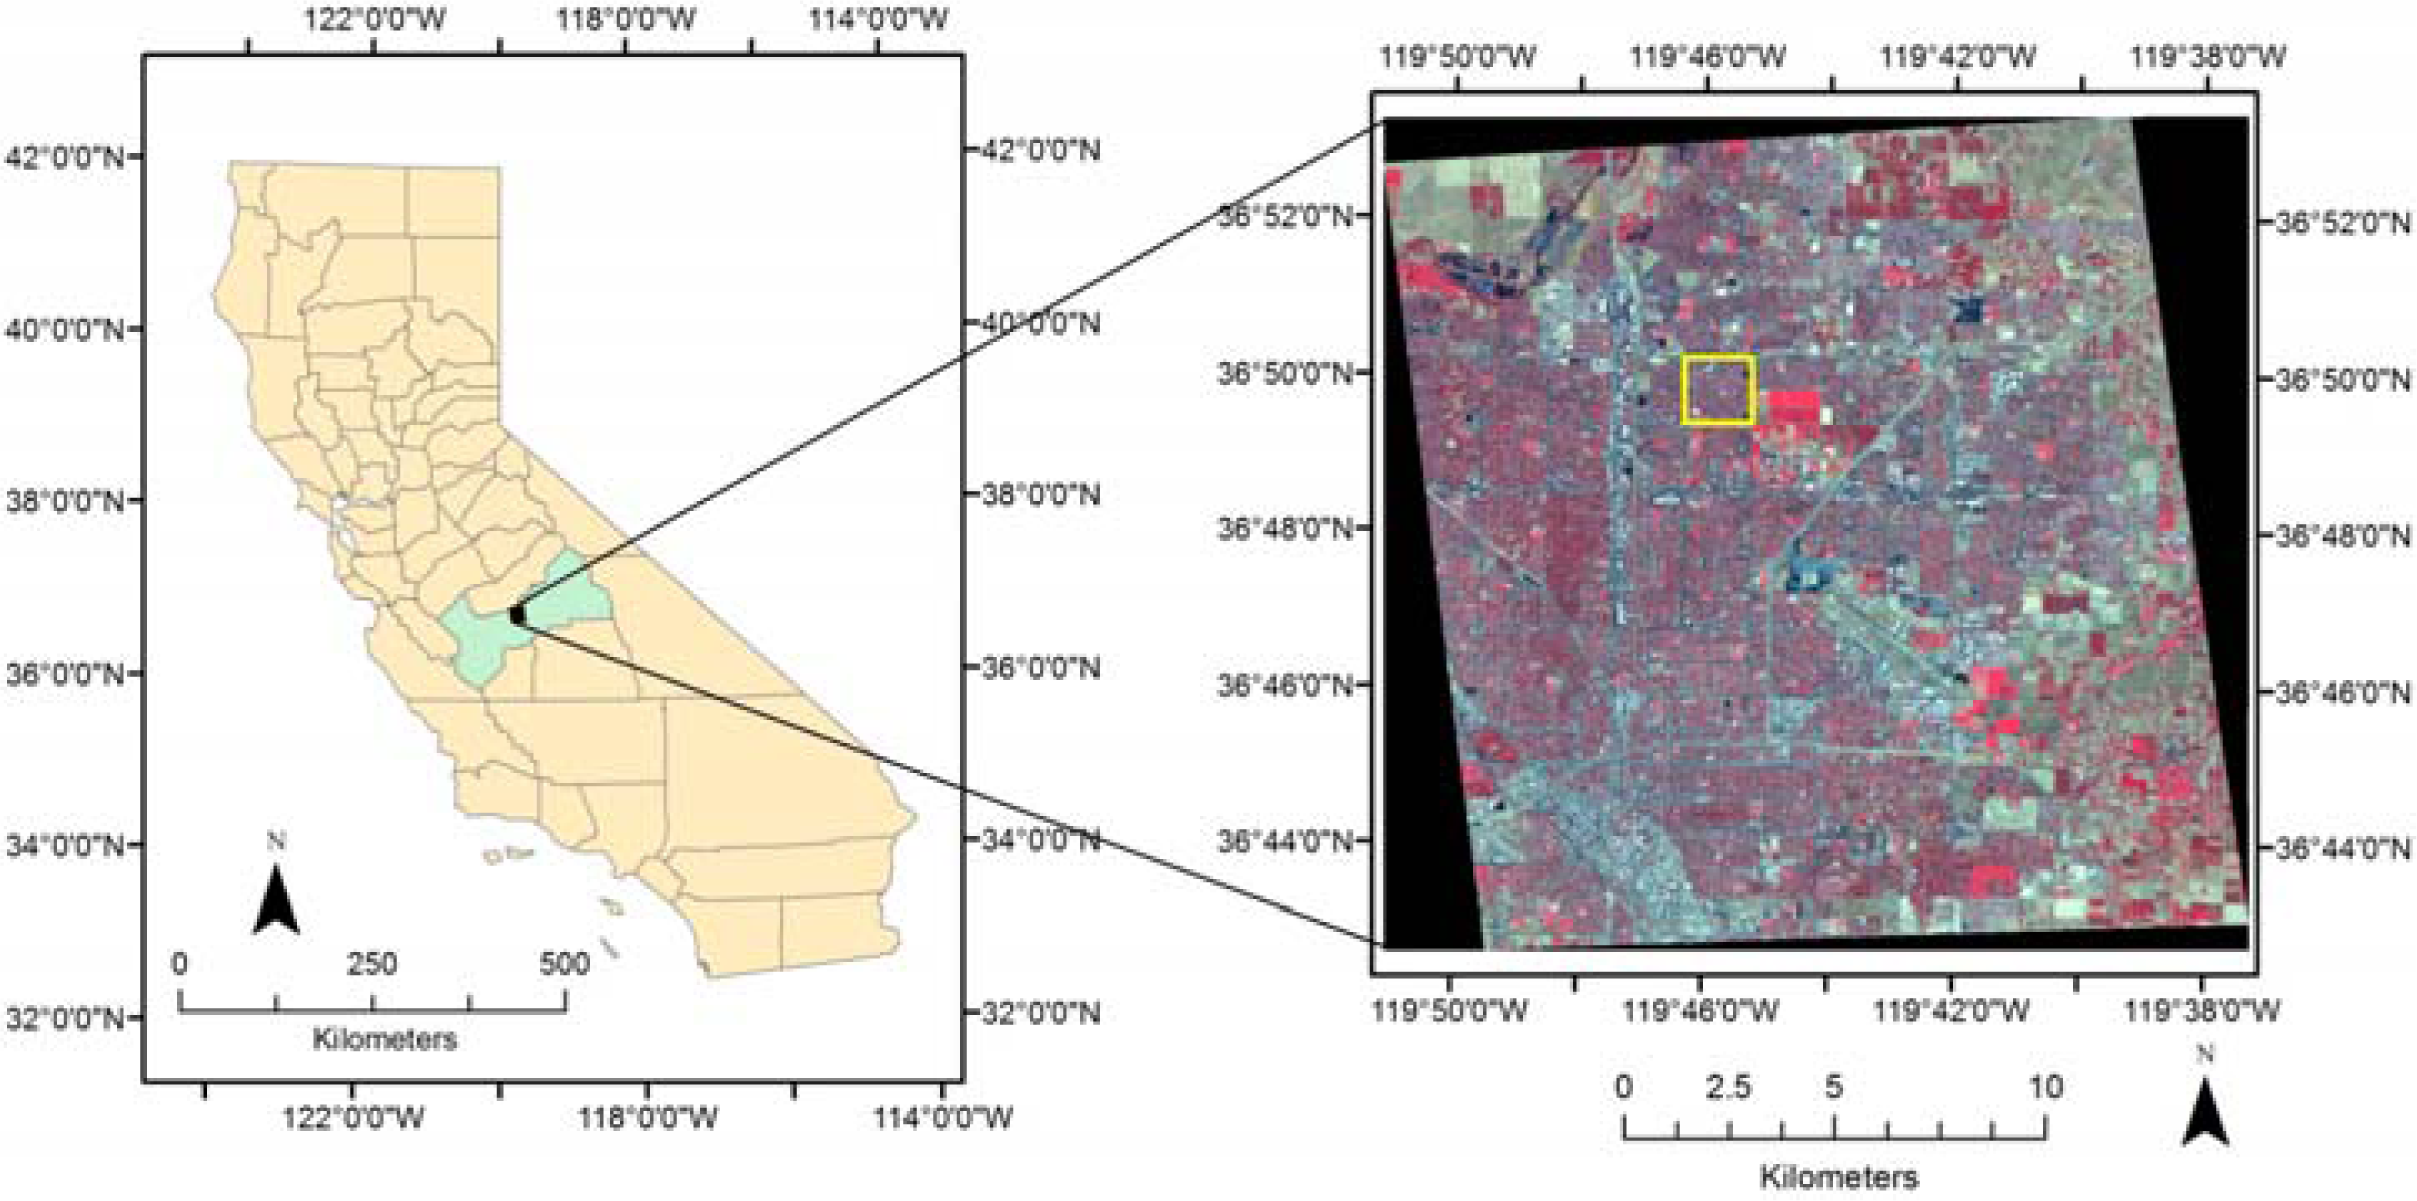
2.1. Study Area

The 1.6 by 1.6 km2 study area is located within the City of Fresno, Fresno County, California (Figure 1). The population of the city was 494,665 in 2010, and is the fifth largest city in the state of California [20]. From 2004 to 2012, Fresno County had a total of 146 confirmed cases of WNV, and six fatalities [6]. The study area was selected because of its proximity to the Department of Geography, California State University, Fresno, and because of the author’s previous association with the Consolidated Mosquito Abatement District (ConMAD), one of two agencies providing mosquito abatement services to the City of Fresno. The areal extent of the study was selected to be consistent with the area studied by Kim et al. [18], and likewise, the area was examined and parcels with significant tree cover were identified, but were not removed in this investigation.

2.2. Satellite Sensor and Image Selection

Archived four-band multispectral QuickBird imagery acquired on 26 July 2007 at 1926 UTC by DigitalGlobe® was obtained by, and supplied to the study, by ConMAD. The image acquisition date was selected to coincide with the production of large numbers of mosquitoes that would be associated with high daytime temperatures in Fresno during July [21]. Table 1 details the spatial resolutions and spectral resolutions of the image [22].

2.3. Reference Shapefiles of City of Fresno

Street and land parcel shapefiles were downloaded for the study from the City of Fresno’s Information Services Department (ISD) [23]. The street shapefile contained line features with the name of the street as an attribute. The land parcel shapefile contained 191,085 polygons delineating property line boundaries, but did not include polygons that comprised the city right-of-way. The city right-of-way includes roads and sidewalks, and the medians which lay between them [24]. It was necessary to create a single polygon that enclosed the parcel layer in order to create enclosed polygons of the city right-of-way. The outer boundary file was created and then merged with the parcel shapefile so that there were no unenclosed areas in the final parcel shapefile. This was necessary for the zonal statistical analysis and pixel comparisons that would be performed later in the procedure. A subset was made of the parcel file that included only those parcels within the study area.

2.4. Identification of Swimming Pools

The study used GoogleEarth®, and the included viewing feature, Historical Imagery®, to identify the presence of in-ground swimming pools on land parcels that were identified as being land parcels zoned as “single family residential districts” [23]. The attribute table of the shapefile of land parcels was edited and that information was added into the file.

3. Methods

3.1. Image Pre-Processing

The QuickBird imagery was imported into an ArcGIS® Raster Dataset with a 32-bit format. The street and land parcels layers downloaded from the ISD were reprojected from NAD 1983 California State Plane Zone 4, with units of feet added into the same projection in units of meters using ArcGIS®. The Georeferencing® toolbar was used to georeference the image data using the shapefile of land parcels as the reference layer in order to minimize errors due to mis-registration.
The image data was radiometrically corrected by DigitalGlobe® and supplied to ConMAD in an otherwise unprocessed form. The four-band multispectral image data was converted to top-of-atmosphere (TOA) spectral reflectance using the procedure detailed by DigitalGlobe®[22]. The first step was to convert the radiometrically corrected image pixels (counts) into TOA spectral radiance using Equation (1):
L λ Pixel , Band = K Band × Q Pixel , Band Δ λ Band
where LλPixel,Band are the TOA spectral radiance pixels (W × m−2 × sr−1 × μm−1), KBand is the absolute radiometric calibration factor (W × m−2 × sr−1 × count−1) for a given band, and QPixel,Band are the radiometrically corrected image pixels (counts), and Δ λBand is the effective bandwidth [μm] for a given band. The second step is to convert the TOA spectral radiance, LλPixel,Band, into TOA spectral reflectance using the procedure detailed by DigitalGlobe® [24], and shown in Equation (2):
ρ λ Pixel , Band = L λ Pixel , Band × d ES 2 × π E sun λ , Band × cos ( θ s )
where LλPixel,Band are the TOA spectral radiance pixels (W × m−2 × sr−1 × μm−1), dES is the Earth-sun distance in astronomical units, Esunλ,Band is the band-averaged solar spectral irradiance (W × m−2 × μm−1), and θs is the solar zenith angle. Values for the Earth-sun distance in astronomical units and of Esunλ,Band, or the methods to calculate them, are detailed by DigitalGlobe® [22]. The data were imported into ArcGIS® 10.0 and Equations (1) and (2) were used to generate the TOA reflectance data using the extension Spatial Analyst®. The result was four grid-based files of TOA reflectance images.

3.2. Surface Water Detection

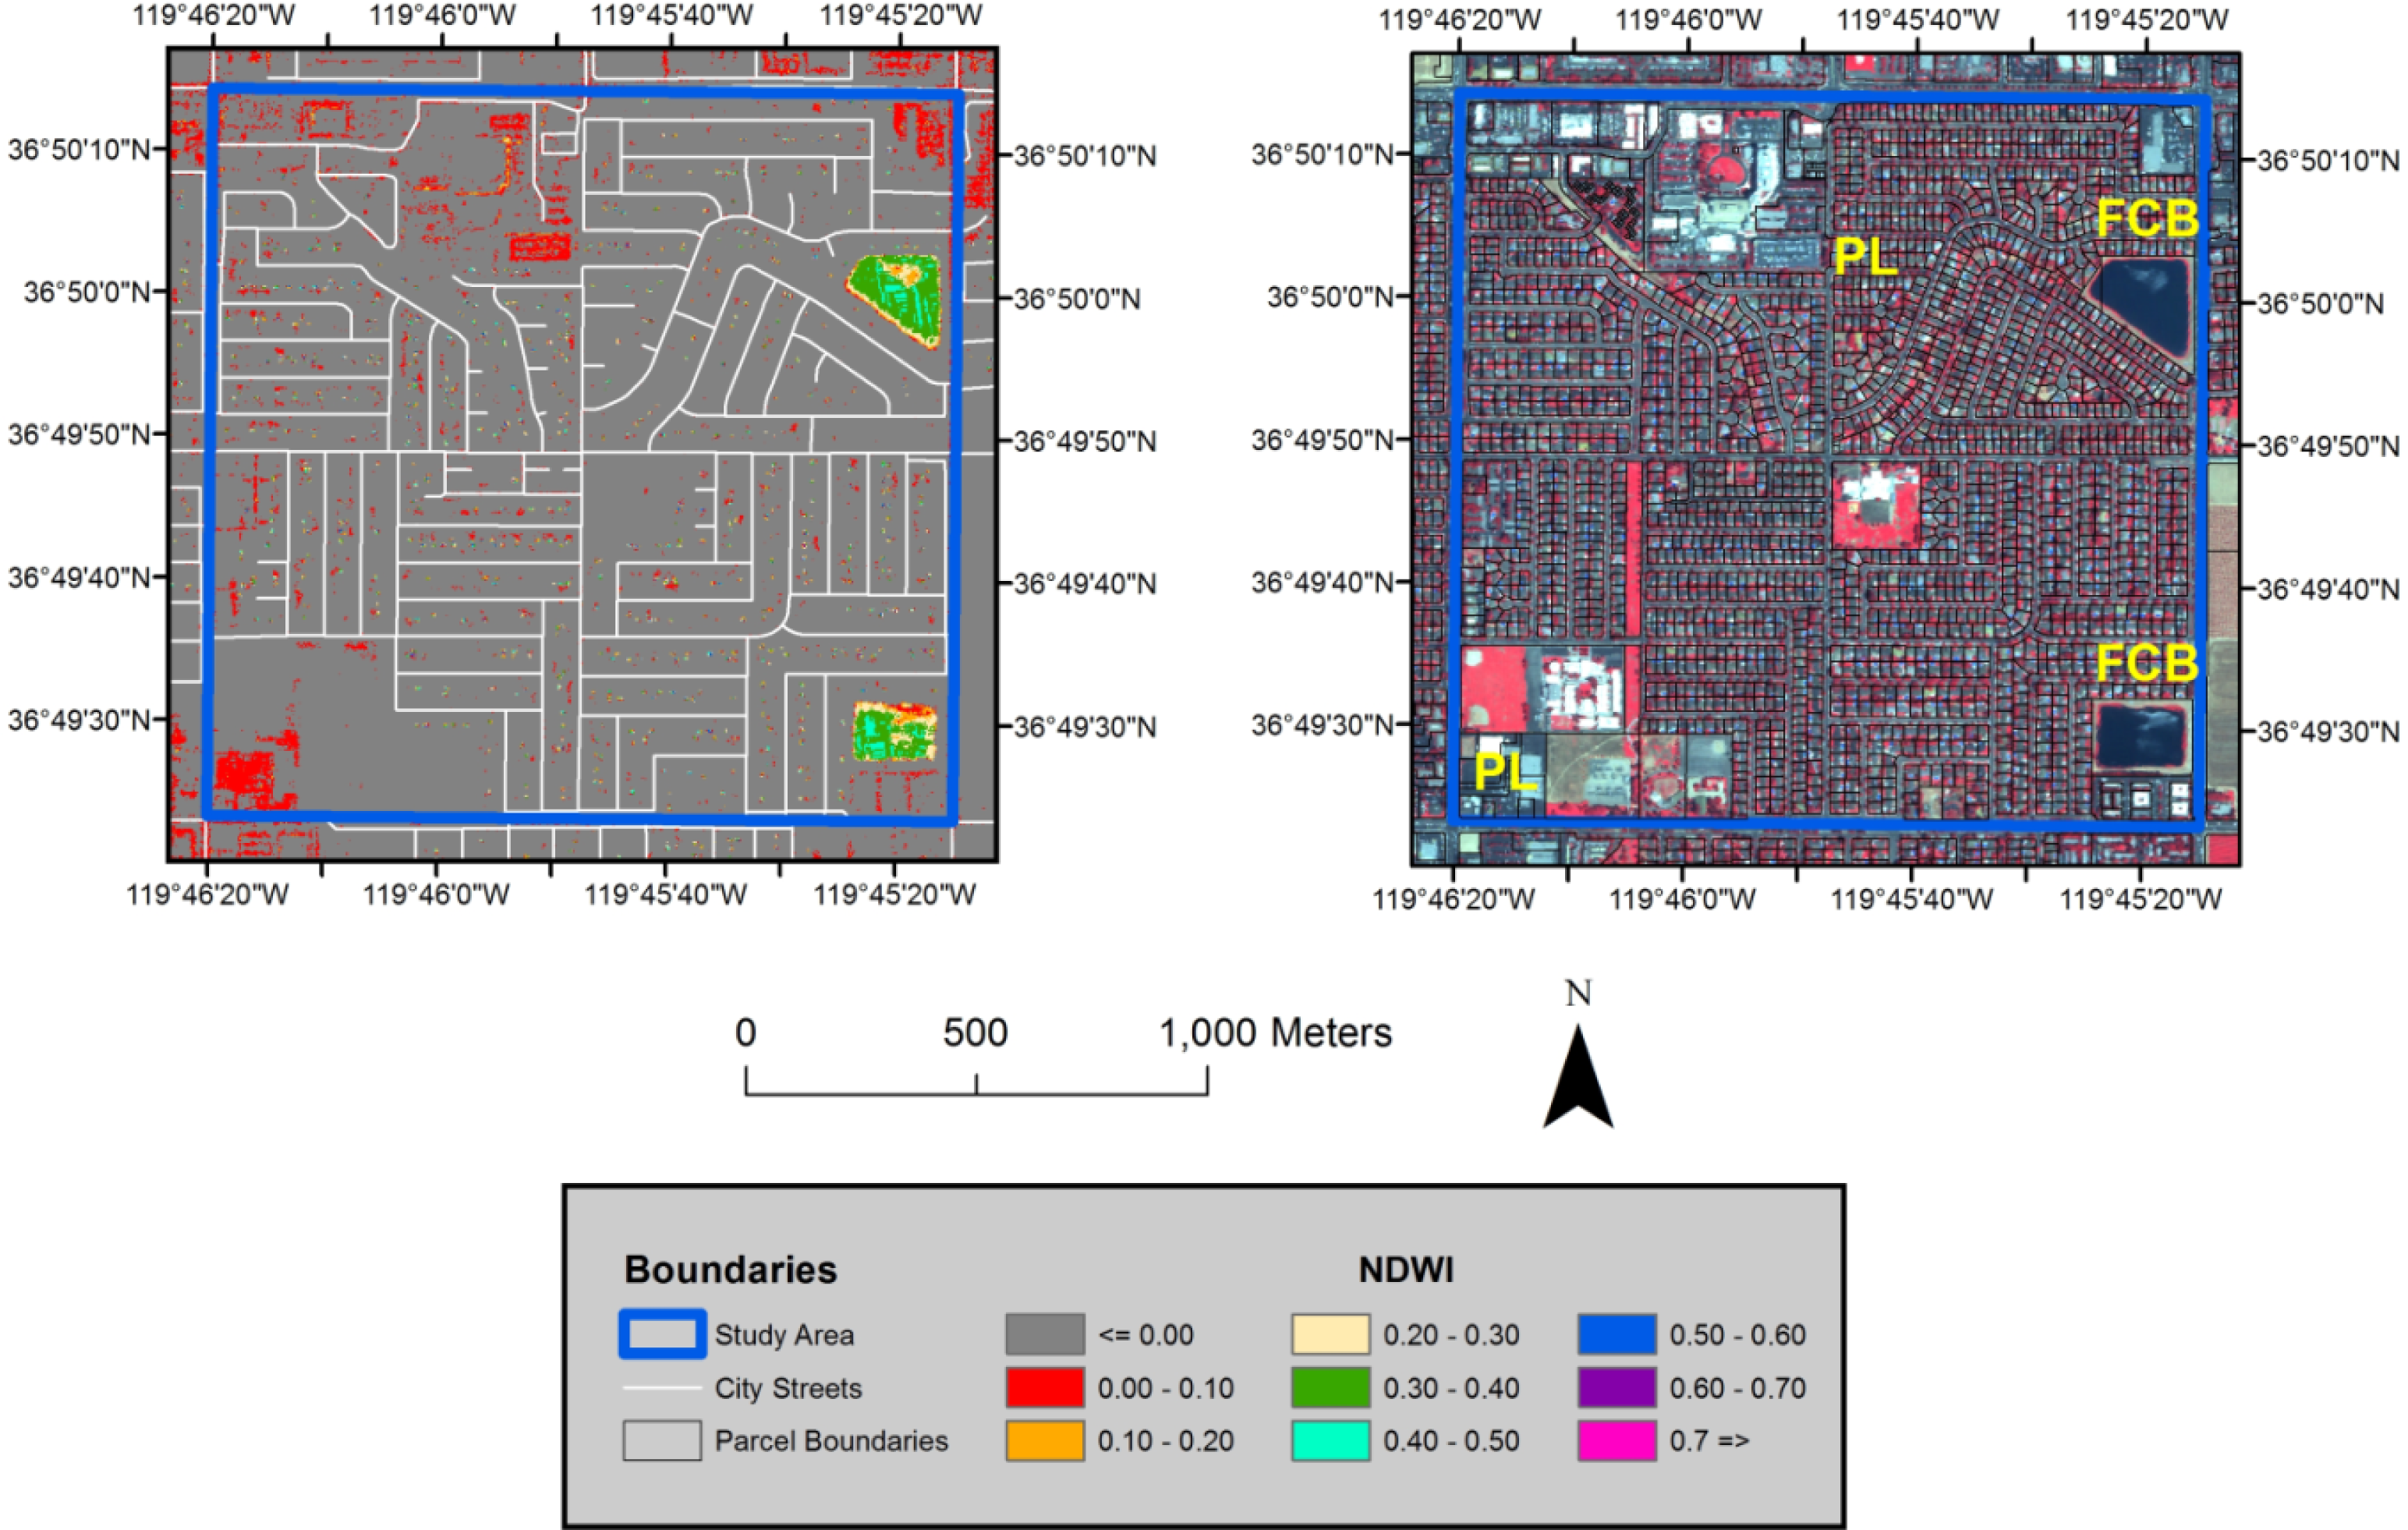
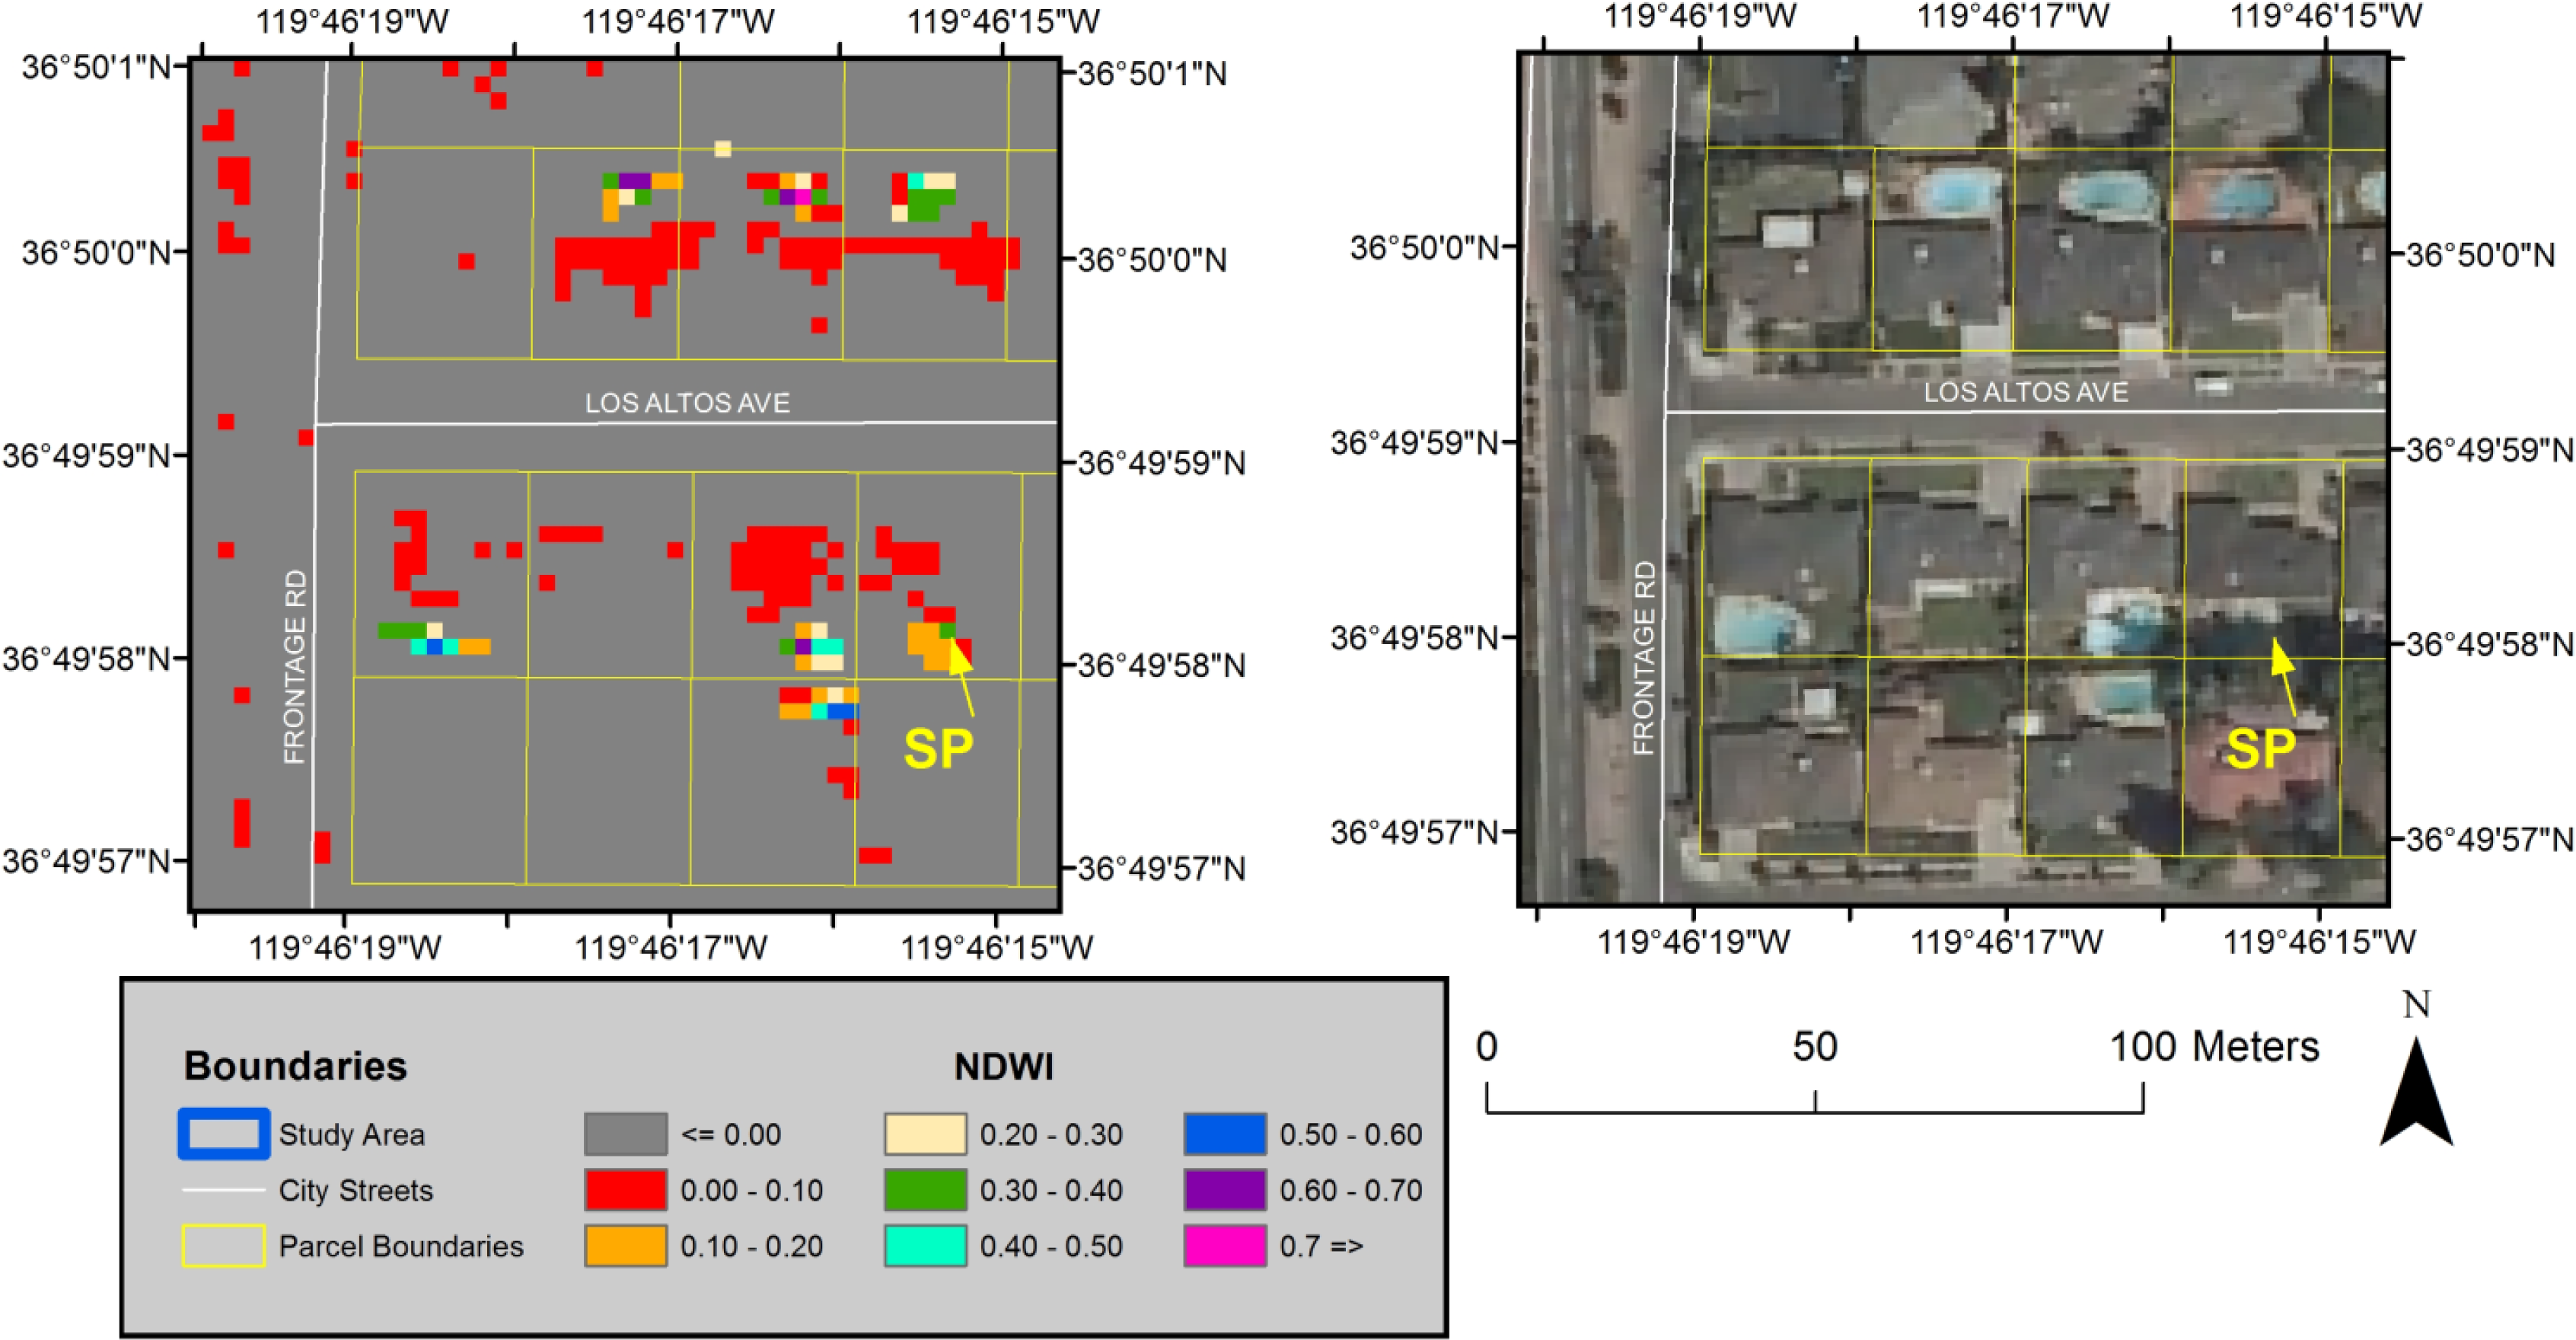
3.2.1. Calculation of NDWI

The Normalized Difference Water Index (NDWI) was first proposed by McFeeters in 1996 to detect surface waters in wetland environments and to allow for the measurement of surface water extent [19]. Although the index was created for use with Landsat Multispectral Scanner (MSS) image data, it has been successfully used with other sensor systems in applications where the measurement of the extent of open water is needed [2529]. The NDWI is calculated using Equation (3):
NDWI = ( Band 2 Band 4 ) ( Band 2 + Band 4 )
where Band 2 is the TOA green light reflectance and Band 4 is the TOA near-infrared (NIR) reflectance. McFeeters [19] asserted that values of NDWI greater than zero are assumed to represent water surfaces, while values less than, or equal, to zero are assumed to be non-water surfaces. Values of NDWI were calculated from the QuickBird image using Equation (3) in the Raster Calculator® tool in the Spatial Analyst® extension in ArcGIS® 10.0. The result was a single band gray-scale floating point grid file that was color-coded to facilitate analysis (Figure 2).

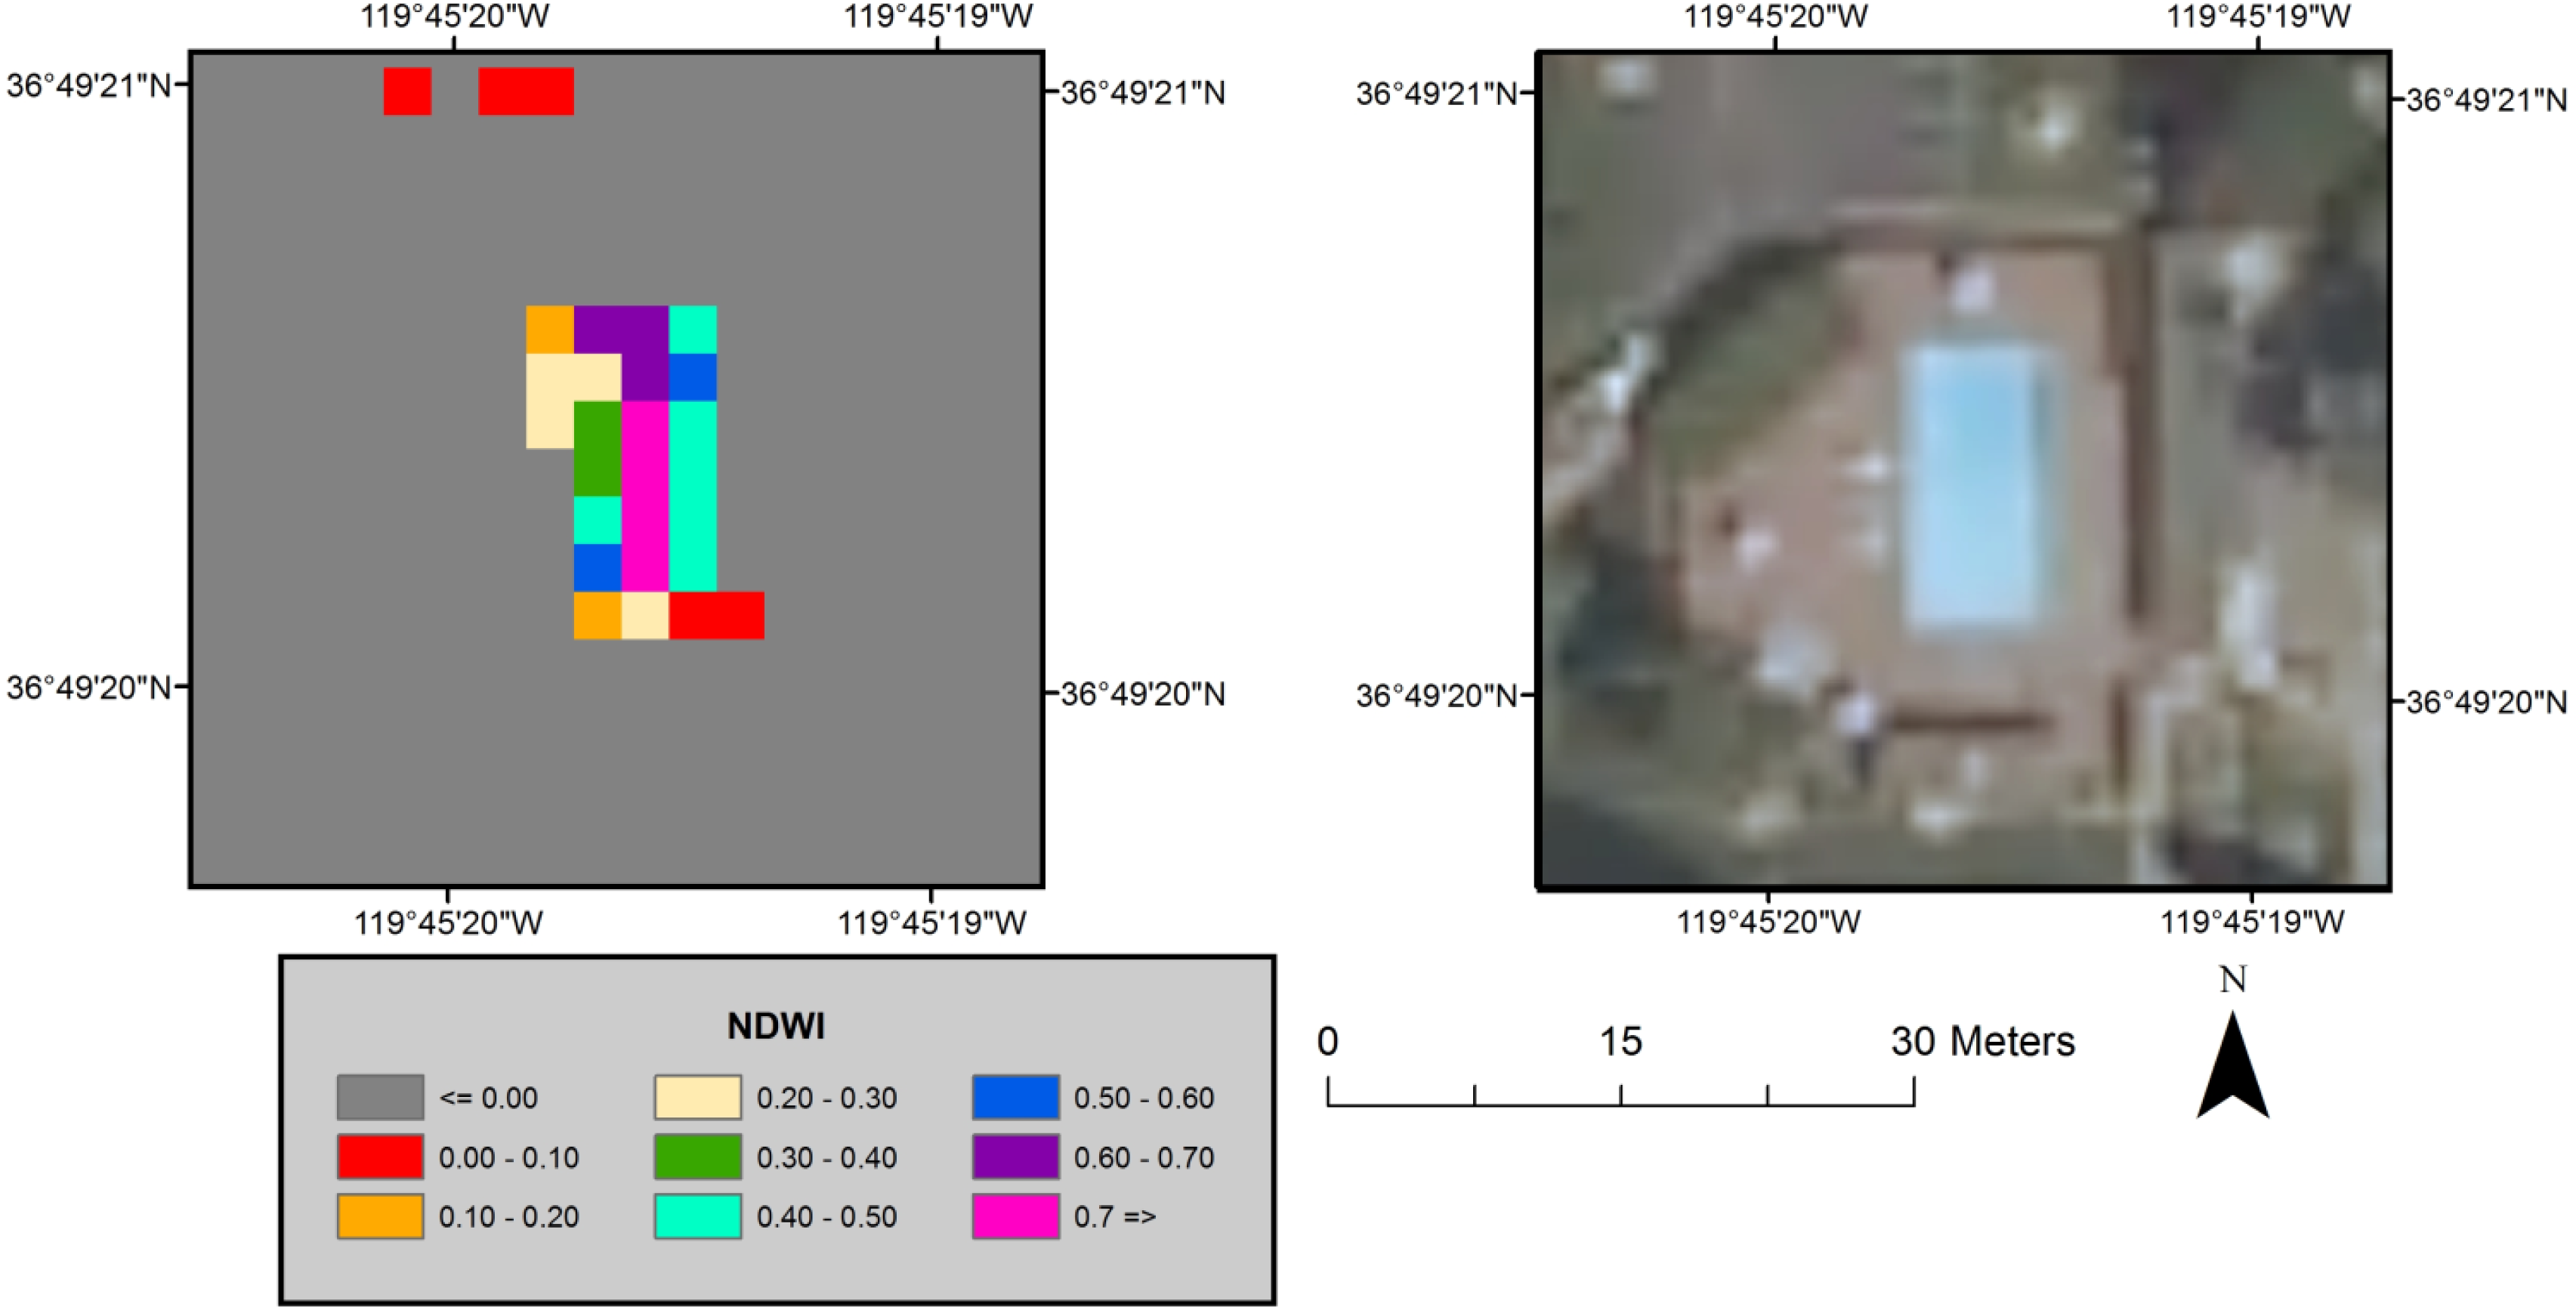
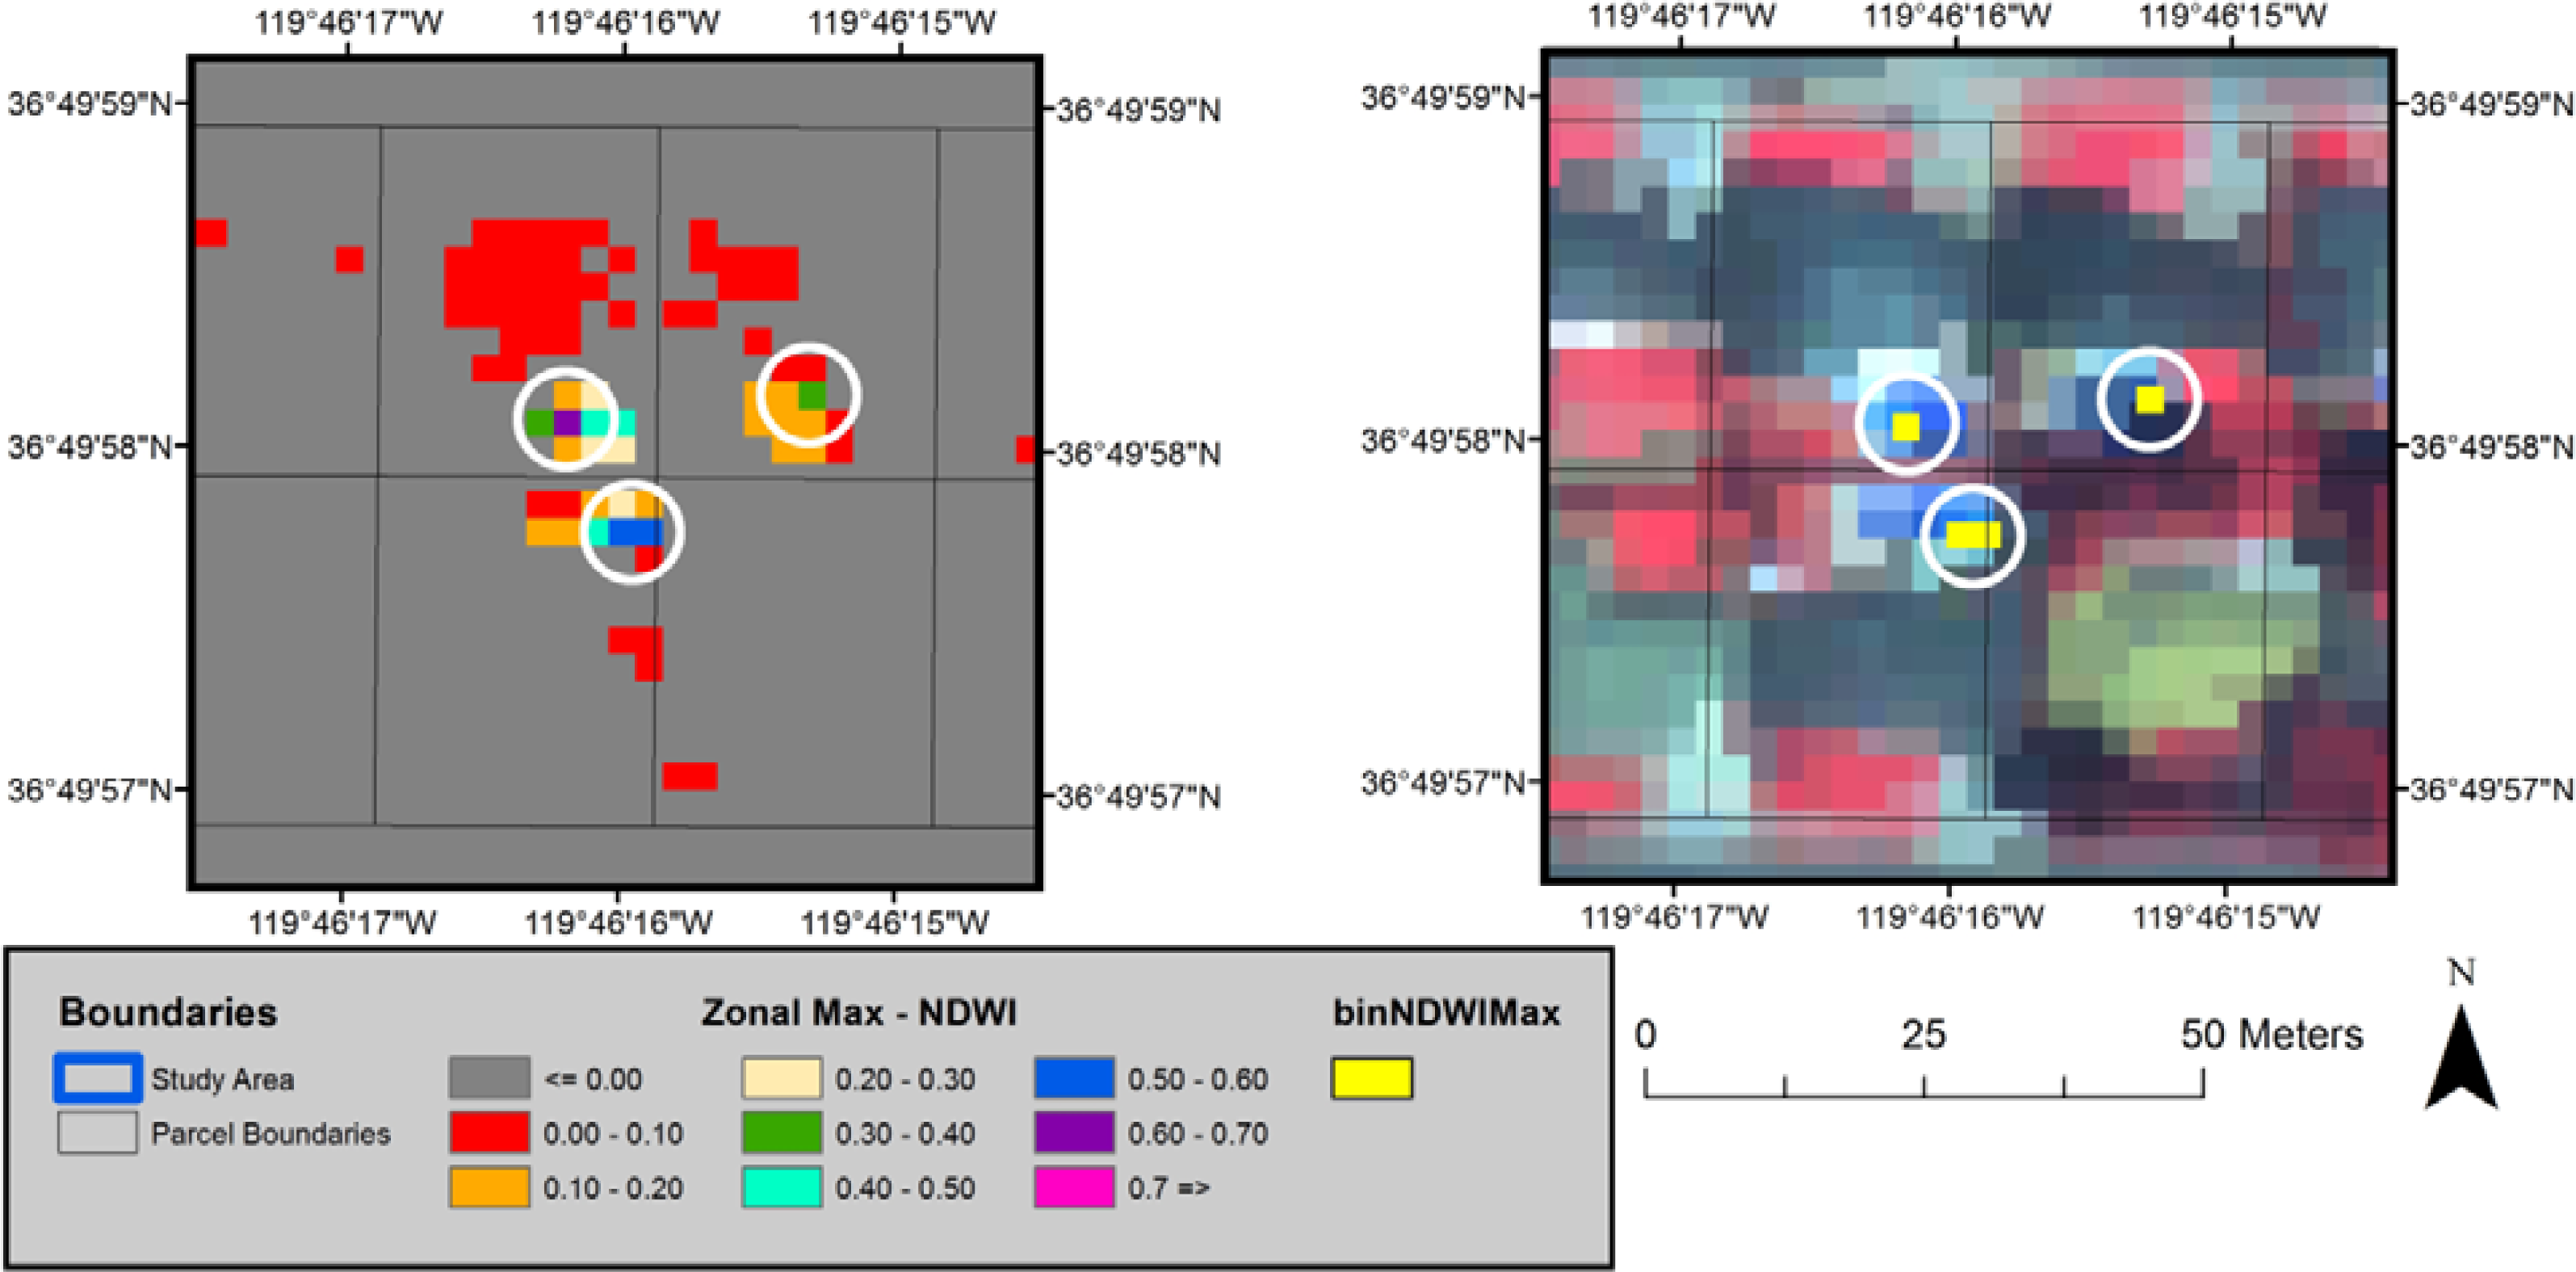
3.2.2. Isolation of Water Pixels

Detailed examination of the NDWI image revealed that there were many mixed pixels comprised of a mixture of water and pool decking, and possibly mixtures of soil and vegetation, or even fences in those instances where pools were located adjacent to them. A clear example of such mixed pixels associated with a swimming pool at an apartment complex is shown in Figure 3. Although the images are from different dates, it is clear that the pixels along the periphery of the pool are a combination of water and pool deck surfaces. The presence of the pool deck, along with its reflectance properties, causes the calculated NDWI to be lower along the periphery, when compared to the center of the pool where the pixels are pure water.
It was noted, throughout the study area, that although shadows cast upon swimming pools caused the NDWI values associated with the water surface to be lower than pools without shadows, there were still some pixels that could be detected (Figure 4).
To attempt to minimize errors of commission attributed to mixed pixels around the swimming pools and other low reflectance targets, only those pixels that had the highest NDWI value within the parcel would be identified and used to create a polygon shapefile that would then be used to select residential parcels with detectable water. This was accomplished by using the Zonal toolset in Spatial Analyst®. The Zonal Statistics tool calculates the statistics on values within zones of another vector- or raster-based dataset. A data field was created in the land parcels data layer and filled with a unique integer identification number so that the layer could be used as the zone input layer. The NDWI grid file was used as the input raster file. The output is a grid-based file in which the cell values are the maximum NDWI that was present within each land parcel (Figure 5).
A comparison of the NDWI image with the QuickBird image revealed that not all positive values of NDWI were surfaces with detectable water. It was observed that some residential rooftops and other surfaces had positive values of NDWI as water surfaces did, but were lower in magnitude than the water surfaces. In this study, a threshold value of 0.3 was applied to the NDWI image to better isolate surfaces without detectable water (NDWI less than 0.3) from those with detectable water surfaces (NDWI greater than or equal to 0.3).
The pixels comprising the water surfaces were isolated by performing a pixel-by-pixel comparison of the NDWI grid to the Zonal max NDWI grid in a conditional statement that would both threshold the result, and eliminate pixels with NDWI values below 0.3. The Raster Calculator tool in the Math Toolset of Spatial Analyst® was used to implement both the thresholding, and the pixel-by-pixel comparison, by using an expression similar to that shown in Equation (4) that employs the conditional test expression “Con”.
binNDWIMax = Con ( ( Con ( NDWI 0.3 , NDWI , 10 ) ) = = " Zonal Max NDWI " , 1 , 0 )
If the inner expression, “NDWI ≥ 0.3” is true, then the value of NDWI is carried forward to the next part of the expression. If it is not true, then a value of −10 is carried forward to the next part of the expression. The selection of −10 for the carry forward value for the false result guarantees that only NDWI values greater than or equal to 0.3 are ever considered in the analysis. The carry forward value is then compared to the value of the Zonal Max NDWI. If the expression is true, a one is placed into the corresponding cell of the output grid, but if the expression is false, a zero is placed into the grid cell. The output becomes a binary file, binNDWIMax, in which the value of one is in the cell of the maximum NDWI value within the parcel, while pixels that do not satisfy the expression are given a value of zero. The result of the aforementioned analysis is shown in Figure 6 and the location of the pixels containing the highest NDWI values have been isolated from all other pixels within each of the parcels.

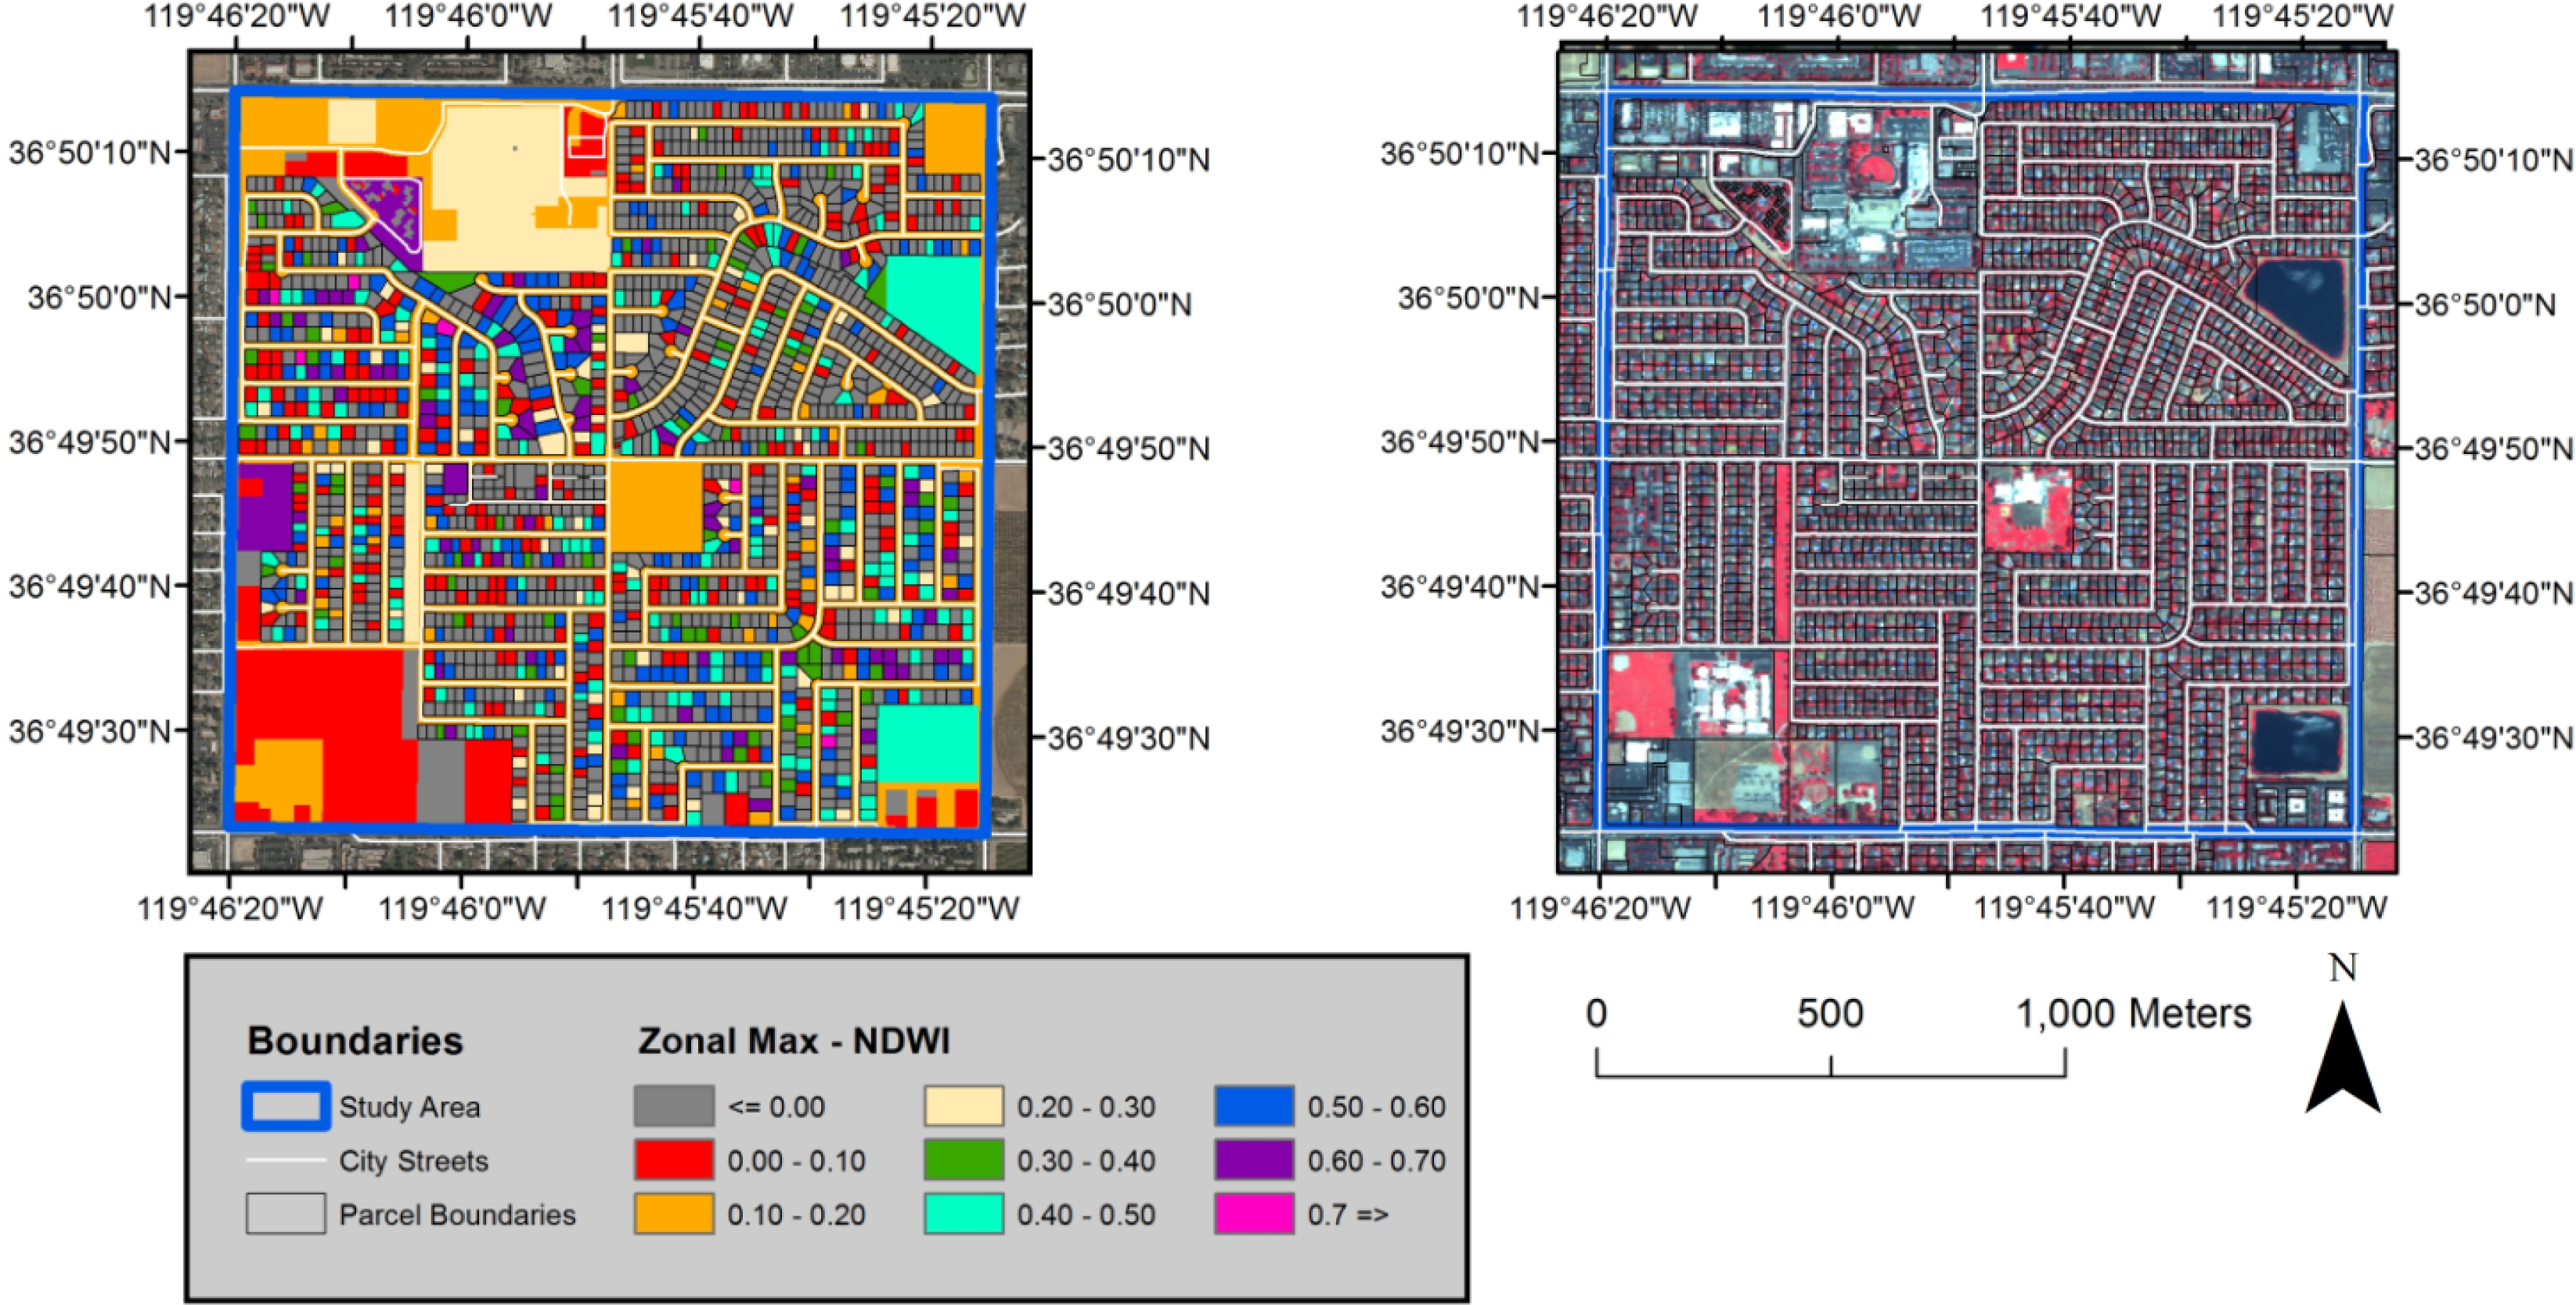
3.2.3. Identification of Residential Parcels with Swimming Pools but No Surface Water Present

The first step in the identification of residential parcels in which no surface water is present was the creation of a polygon data file of land parcels that are zoned as either being low- or medium- density residential [30]. This procedure removed many asphalt surfaces of roads and high-density residential parcels from the study. Asphalt surfaces are low reflectance targets [31] and low NDWI values would result when calculated for these surfaces. Such a situation would result in many false positive water surfaces (Figure 2) and make the identification of true water surfaces more difficult. Residential parcels that included apartment complexes were omitted from consideration because they would also contain asphalt road surfaces and parking lots. Although many apartment complexes contain swimming pools that would be detectable, apartment management is required to comply with State of California public health codes for the maintenance of water quality within the pools so that:
“Floating scum, sputum or debris shall not be allowed to accumulate in the pool. Skimmers, where provided, and water levels shall be maintained and operated to remove such material continuously.”
[6].
Since such maintenance procedures would filter out mosquito egg rafts on a continuous basis, it was not necessary to include these swimming pools in the investigation.
The second step was to convert the grid file binNDWIMax into a vector-based file, binNDWIMaxPoly, in ArcGIS® using the Raster to Polygon tool and deselecting the “Simplify Polygon” option. The polygons in the resulting shapefile either represent water pixels, which have an attribute value of one, or background pixels, which have an attribute value of zero.
The third step was to select the polygons by attribute value, in binNDWIMaxPoly, that represent water, and to use the selected polygons of water to select the residential parcels that intersected them. A data field, DETECTED, was added to the land parcel layer. A value of one was added to the DETECTED attribute in the selected polygons to represent the detection of surface water within the residential parcel, presumably attributed to the presence of a swimming pool with enough water to be detected.
The fourth step was to then query the attribute table to isolate only those residential land parcels which have the DETECTED attribute set to one, and generate a list for further investigation. This investigation included an examination of the QuickBird image and a comparison with the images available on GoogleEarth® to determine which parcels were obscured by vegetation, and which were not. Parcels with swimming pools, whose backyards were not obscured by vegetation, and which have not been identified as having detectable water, are presumptively judged to have swimming pools capable of providing habitat for mosquitoes to breed.

3.2.4. Accuracy Assessment

Accuracy assessment was accomplished by the use of a confusion matrix [32]. The generation of the matrix would determine how well the study was able to isolate residential parcels that had detectable levels of surface water from those that did not. The overall, user’s, and producer’s accuracy measures of the swimming pool detection method were derived in the confusion matrix by comparing the reference data derived from Google Earth® with the parcels having detected water.

4. Results and Discussion

Remotely-sensed data were analyzed and integrated with vector-based data layers within a GIS to identify which residential land parcels had detectable surface water present, and which did not, for the purpose of facilitating mosquito abatement procedures.
The overall classification accuracy of the identification of residential parcels that actually had swimming pools was 91.2%, with a user’s accuracy of 98.0%, a producer’s accuracy of 78.4%, and an overall Kappa coefficient of 0.806 (Table 2). The high level of overall accuracy, may be attributed to the elimination of non-residential areas from consideration, the thresholding of the NDWI image, and the use of the maximum NDWI value to select parcels with detectable water. Examining only residential parcels eliminated large areas of asphalt surfaces, such as roads and parking lots, which have reflectance properties that are similar to water [31], and which would have otherwise increased the error of commission. It was apparent that although NDWI was effective at identifying water surfaces, the index, originally designed for use in non-urban settings [19], must be thresholded for use in urban settings. Thresholding the NDWI values eliminated rooftop pixels and other non-water surfaces from the areas contained within the residential parcels themselves. The use of the maximum NDWI value to select parcels resulted in few errors of commission. The 11 errors of commission appear to have been caused by slight mis-registration differences between the image data and the parcel shapefile. The amount of overlap of a pixel from a parcel that actually had a swimming pool to one that did not was most often less than one meter.
While the analysis of the data correctly identified 535 residential parcels that have swimming pools as having detectable surface water (out of 682), the analysis failed to identify 147 residential parcels that actually have swimming pools, resulting in an error of omission of 21.6%. Examination of the image data available using Google Earth® and its Historical Imagery® feature revealed that of the 147 residential parcels, 19 had enough vegetation in the backyards of the parcels to prevent the determination as to whether there was even a swimming pool present. The remainder had no such obstructions from the view of the satellite. Therefore, the remaining 128 omissions are most likely due to there being no detectable water present within the parcel. Swimming pools that were either completely dry, or else, which contained too little water to be detected at the selected NDWI threshold, would not have been identified. This is an important consideration because many in-ground residential swimming pools have a shallow area at one end of the pool with the bottom gradually sloping downward to a greater depth. Water may have collected in the deeper end from winter rains and remained throughout the summer in the swimming pools of homes that have either been abandoned by their occupants, or at homes in which the occupants were not diligent in properly maintaining their swimming pools. In either situation, water may have been present, but not in sufficient quantities to detect using the aforementioned methodology. Such a situation would imply that water filtration was not taking place, and that any mosquito egg rafts present, would not be filtered out of the water. The study has demonstrated that it is possible, within a GIS, to identify land parcels which are known to have swimming pools, but which do not have detectable water present. The identification of those parcels would allow for the creation of a list of the addresses associated with those parcels, and which could then be used by mosquito abatement field personnel to perform on-site examinations of the suspect parcels.
Although the present study did not employ pan-sharpened source data, nor was the GEOBIA analysis method used, the findings of this study were similar to those of Kim et al. [18] and are compared in Table 3. The results suggest that the GEOBIA methodology employed by Kim et al. was better at identifying swimming pools than the present study; however, the producer’s accuracy of 78.4% in the present study resulted from a water-detection index not being able to detect surfaces comprised of either too little water, or no water at all. Although this could be addressed by lowering the NDWI threshold, it is not advised to do so. While such a course of action would allow for additional pixels to be identified as being water surfaces, and potentially identifying more swimming pools, and which would result in an increase in the producer’s accuracy, the user’s accuracy would likely decrease because pixels associated with rooftops and shadows would likely create false water surfaces, possibly increasing the error of commission. It should be noted that, while it was necessary in this study to use a threshold value of 0.3 for the NDWI to better discriminate between water and non-water surfaces, such a threshold value may vary from scene to scene, or from one date to another, because of varying sun-target-satellite geometry, or it may not be necessary at all. The decision to use a thresholding value for NDWI should be based upon the spectral responses of residential rooftops and other surfaces as compared to the water surfaces of maintained public swimming pools. It must also be noted that there are other factors that could contribute to increased errors of commission and errors of omission and therefore increased uncertainties in the identification of swimming pools that are not properly maintained.
One factor that could affect the accuracy of the previously described procedure is the variable look angle that is inherent in the QuickBird satellite, and which may vary ±45° from nadir [33]. Variation in the look angle may influence how shadows are cast over backyard swimming pools, thus affecting the detectability of water in unforeseeable ways. On one date, the look angle may allow for some swimming pools to be viewable by the satellite, while others may not be due to shadows cast by buildings or by trees, while on another date, the situations may be reversed. Other factors that might create additional uncertainty in the identification of improperly maintained swimming pools would be related to the swimming pools themselves. Examination of the NAIP imagery reveals that swimming pools in the study area vary in size, shape, and geographic orientation. These variations may make it difficult to isolate a water signal from the swimming pool due to the pool decking, and mixtures of soil and vegetation that also may surround the water forming mixed pixels. The 2.44 m spatial resolution of QuickBird’s multispectral image data may not be high enough to isolate pixels comprised of water from surrounding mixed pixels.
Whatever analytical methods are undertaken to detect potential unmaintained swimming pools, the utility of such methods ultimately depends upon whether or not they may be applied by mosquito abatement personnel, and not by research scientists. Analytical procedures, similar to those employed by Kim et al. [18], although effective, may be too complex for mosquito abatement personnel, employed as GIS technicians, to apply to data from their districts in a timely fashion. According to Joseph Conlon, Technical Advisor for the American Mosquito Control Association, there are 734 mosquito abatement districts which are members of the association. Of these, approximately 600 of them may possess some level of GIS capability, with perhaps an additional 1,105 smaller entities, comprised mostly of municipalities, which do not have the financial resources to employ GIS technologies at any level [34]. Given the number of WNV cases and fatalities that have occurred in the USA since its introduction in 1999, and that new cases and fatalities continue to occur [3], it is imperative that analytical procedures effective in combating WNV be made available to as many mosquito abatement districts with GIS capability as possible. The successful deployment of such procedures could serve as the justification for funding requests to expand the GIS capability of those districts currently using GIS, or to create such a capability where none currently exists. This study has developed an efficient procedure that would allow for the identification of residential parcels whose swimming pools may be unmaintained and which would likely provide habitat for mosquitoes to breed, and it is posited that mosquito abatement personnel, who have technician-level GIS expertise, should be able to employ the procedure in their district offices.

5. Conclusions

The integration of remote sensing and geographic information system (GIS) technologies has greatly facilitated the detection of mosquito habitats in both urban and non-urban settings [13,15,35]. The use of high resolution imagery has made the identification of potential mosquito habitats more effective [14,36,37].
In the present study, the Normalized Difference Water Index (NDWI) [19], a well-established means of detecting surface water [2529], was applied to high-resolution satellite image data within a GIS to identify residential land parcels that could have improperly maintained swimming pools that could be capable of providing habitat in which disease carrying mosquitoes could breed with a high degree of accuracy. There were 682 parcels that were known to have swimming pools. The procedure identified 535 residential land parcels that had detectable water and resulted in an overall accuracy of 78.4%. Only 1.0% of the parcels were incorrectly identified as having swimming pools where none existed, and only 2% were identified as having no swimming pools when they actually did. Examination of the high resolution imagery revealed that 19 of the 147 residential parcels that were known to have swimming pools had backyards with enough vegetation present to obscure the presence of the swimming pools from being detected. The remaining 128 parcels lacked sufficient amounts of surface water to be detected by the NDWI. This finding is significant because the inability to detect water where there ought to be water suggests that the procedure of employing a water detection index is a unique and effective means to identify residential parcels where water ought to be present, but is not. The identification of such parcels would enable mosquito abatement personnel to schedule field inspections at the parcels for possible mosquito abatement procedures.
It is important to note that multispectral, high resolution imagery may be acquired by mosquito abatement districts and analyzed by GIS technicians employed by those districts. There procedure can be applied to any urban or non-urban area as long as cloud free image data is available. Further investigations of this procedure will focus on the automated characterization of the presence of vegetation within a residential parcel, with the goal to use that information to identify such parcels for field inspection.

Supplementary Information

remotesensing-05-03544-s001.pdf

Acknowledgments

The author wishes to thank Steve Mulligan, District Manager of the Consolidated Mosquito Abatement District for supplying the QuickBird image data used in this research. The author also wishes to thank C.K. Leung, Professor of Geography at California State University Fresno, for his very insightful comments and his very helpful suggestions in the preparation of this manuscript. The author also wishes to acknowledge support for the research from the College of Social Sciences, California State University, Fresno. The author also wishes to thank the journal editorial staff for their very kind assistance throughout the submission process, and also three anonymous reviewers who gave of their time, and who provided several very useful comments and suggestions that improved the manuscript.

Conflict of Interest

The author declares no conflict of interest.

References and Notes

  1. World Health Organization (WHO). World Malaria Report 2012. Available online: http://www.who.int/malaria/publications/world_malaria_report_2012/report/en/index.html (accessed on 27 April 2013).
  2. World Health Organization. Neglected Tropical Diseases, Dengue: The Fastest Growing Mosquito-Borne Disease in the World; 29 October 2010. Available online: http://www.who.int/neglected_diseases/integrated_media/integrated_media_2010_Dengue_vs_malaria/en/ (accessed on 27 April 2013).
  3. Centers for Disease Control and Prevention (CDC). Morbidity and Mortality Weekly Report; 3 May 2013. Available online: http://www.cdc.gov/mmwr/preview/mmwrhtml/mm6217md.htm?s_cid=mm6217md_w#tab2 (accessed on 8 May 2013).
  4. Reisen, W.; Lothrop, H.; Chiles, R.; Madon, M.; Cossen, C.; Woods, L.; Husted, S.; Kramer, V.; Edman, J. West Nile Virus in California. Emerg. Infect. Dis 2004, 10, 1369–1378. [Google Scholar]
  5. Gubler, D.J. The continued spread of West Nile Virus in the western hemisphere. Clin. Infect. Dis 2007, 45, 1039–1046. [Google Scholar]
  6. California Department of Public Health (CDPH). California Mosquito-Borne Virus Surveillance & Response Plan. Available online: http://www.cdph.ca.gov/HealthInfo/discond/Documents/2013CAResponsePlan.pdf (accessed on 10 April 2013).
  7. Reisen, W.K.; Takahashi, R.M.; Carroll, B.D.; Quiring, R. Delinquent mortgages, neglected swimming pools, and West Nile virus, California. Emerg. Infect. Dis 2008, 14, 1747–1749. [Google Scholar]
  8. San Joaquin County Mosquito & Vector Control District (SJCMVCD) Mosquito Control & Other Vectors: Preventing Mosquitoes in Your Backyard. Available online: http://sjmosquito.org/mosquito-control-and-other-vectors/preventing-mosquitoes.htm (accessed on 10 April 2013).
  9. American Mosquito Control Association (AMCA). Available online: http://www.mosquito.org/biology (accessed on 17 February 2013).
  10. Masuoka, P.M.; Clabornb, D.M.; Andrec, R.G.; Nigroc, J.; Gordond, S.W.; Kleine, T.A.; Kime, H.C. Use of IKONOS and Landsat for malaria control in the Republic of Korea. Remote Sens. Environ 2003, 88, 187–194. [Google Scholar]
  11. Brown, H.E.; Diuk-Wasser, M.A.; Guan, Y.; Caskey, S.; Fish, D. Comparison of three satellite sensors at three spatial scales to predict larval mosquito presence in Connecticut wetlands. Remote Sens. Environ 2008, 112, 2301–2308. [Google Scholar]
  12. Diuk-Wasser, M.A.; Bagayoko, M.; Sogoba, N.; Dolo, G.; TourÉ, M.B.; TraorÉ, S.F.; Taylor, C.E. Mapping rice field anopheline breeding habitats in Mali, West Africa, using Landsat ETM+ sensor data. Int. J. Remote Sens 2004, 25, 359–376. [Google Scholar]
  13. Lacaux, J.P.; Tourre, Y.M.; Vignolles, C.; Ndione, J.A.; Lafaye, M. Classification of ponds from high-spatial resolution remote sensing: Application to Rift Valley Fever epidemics in Senegal. Remote Sens. Environ 2007, 106, 66–74. [Google Scholar]
  14. Stoops, C.A.; Gionar, Y.R.; Shintaz, P.S.; Sismadi, P.; Rachmat, A.; Elyazar, I.F.; Sukowati, S. Remotely-sensed land use patterns and the presence of Anopheles larvae (Diptera: Culicidae) in Sukabumi, West Java, Indonesia. J. Vector Ecol 2008, 33, 30–39. [Google Scholar]
  15. Zou, L.; Miller, S.N.; Schmidtmann, E.T. Mosquito larval habitat mapping using remote sensing and GIS: Implications of coalbed methane development and West Nile virus. J. Med. Entomol 2006, 43, 1034–1041. [Google Scholar]
  16. Cleckner, H.L.; Allen, T.R.; Bellows, A.S. Remote sensing and modeling of mosquito abundance and habitats in coastal Virginia, USA. Remote Sens 2011, 3, 2663–2681. [Google Scholar]
  17. Hartfield, K.A.; Landau, K.I.; van Leeuwen, W.J.D. Fusion of high resolution aerial multispectral and LiDAR data: Land cover in the context of urban mosquito habitat. Remote Sens 2011, 3, 2364–2383. [Google Scholar]
  18. Kim, M.; Holt, J.B.; Eisen, R.J.; Padgett, K.; Reisen, W.K.; Croft, J.B. Detection of swimming pools by geographic object-based image analysis to support west Nile virus control efforts. Photogramm. Eng. Remote Sensing 2011, 77, 1169–1179. [Google Scholar]
  19. McFeeters, S.K. The use of the Normalized Difference Water Index (NDWI) in the delineation of open water features. Int. J. Remote Sens 1996, 17, 1425–1432. [Google Scholar]
  20. California Department of Finance (CDF). Redistricting Data, Rankings of Total Population, Percent Change, and Numerical Change. Available online: http://www.dof.ca.gov/research/demographic/state_census_data_center/census_2010/#PL94 (accessed on 9 May 2013).
  21. Mulligan, S. Personal Communication. 16 August 2007.
  22. DigitalGlobe®. Radiometric Use of QuickBird Imagery. Available online: http://www.digitalglobe.com/downloads/QuickBird_technote_raduse_v1.pdf (accessed on 11 April 2013).
  23. City of Fresno (COF) Department of Information Services. Downloadable Layers. Available online: http://auth.fresno.gov/Government/DepartmentDirectory/InformationServices/GIS/Layers.htm (accessed on 19 April 2013).
  24. Woodcock, K. MCRP, AICP, Woodcock Planning and Environmental Services, Fresno, CA; Personal Conversation with S.K. McFeeters; 14 December 2012.
  25. Chowdary, V.M.; Vinu Chandran, R.; Neeti, N.; Bothale, R.V.; Srivastava, Y.K.; Ingle, P.; Ramakrishnan, D.; Dutta, D.; Jeyaram, A.; Sharma, J.R.; et al. Assessment of surface and sub-surface waterlogged areas in irrigation command areas of Bihar state using remote sensing and GIS. Agr. Water Manag 2008, 95, 754–766. [Google Scholar]
  26. Environmental Protection Agency (EPA). Wetland Mapping and Classification Methodology—Overall Framework—A Method to Provide Baseline Mapping and Classification for Wetlands in Queensland, Version 1.2; Queensland Government: Brisbane, QLD, Australia, 2005. [Google Scholar]
  27. Murray, N.J.; Phinn, S.R.; Clemens, R.S.; Roelfsema, C.M.; Fuller, R.A. Continental scale mapping of tidal flats across East Asia using the Landsat archive. Remote Sens 2012, 4, 3417–3426. [Google Scholar]
  28. Panigrahy, S.; Murthy, T.V.R.; Patel, J.G.; Singh, T.S. Wetlands of India: Inventory and assessment at 1:50,000 scale using geospatial techniques. Curr. Sci 2012, 102, 852–856. [Google Scholar]
  29. US Geological Survey (USGS) and US Department of the Interior. Normalized Difference Water Index (NDWI). Available online: http://deltas.usgs.gov/fm/data/data_ndwi.aspx (accessed on 3 May 2013).
  30. Fresno County. Chapter 1. General Provisions, Sections 800-803.19 of the Ordinance Code of the County of Fresno—Part VII, Land Use Regulation and Planning Division VI, Zoning Division. Available online: http://www.co.fresno.ca.us/DepartmentPage.aspx?id=19723 (accessed on 14 December 2012).
  31. Jensen, J. Remote Sensing of the Environment: An Earth Resource Perspective, 2nd ed; Pearson Prentice-Hall, Pearson Education, Inc: Upper Saddle River, NJ, USA, 2007. [Google Scholar]
  32. Lillesand, T.M.; Kiefer, R.W.; Chipman, J.W. Remote Sensing and Image Interpretation, 6th ed; John Wiley & Sons, Inc: Hobokan, NJ, USA, 2008; pp. 585–587. [Google Scholar]
  33. DigitalGlobe_Core_Imagery_Products_Guide; p. 12. Available online: http://www.digitalglobe.com/downloads/DigitalGlobe_Core_Imagery_Products_Guide.pdf (accessed on 11 July 2013).
  34. Conlon, J. Personal Communication. 8 May 2013.
  35. Pope, K.; Masuoka, P.; Rejmankova, E.; Grieco, J.; Johnson, S.; Roberts, D. Mosquito habitats, land use, and malaria risk in Belize from satellite imagery. Ecol. Appl 2005, 15, 1223–1232. [Google Scholar]
  36. Troyo, A.; Fuller, D.O.; Calderón-Arguedas, O.; Beier, J.C. A geographical sampling method for surveys of mosquito larvae in an urban area using high-resolution satellite imagery. J. Vector Ecol 2008, 33, 1–7. [Google Scholar]
  37. Hassan, A.N.; El Nogoumy, N.; Kassem, H.A. Characterization of landscape features associated with mosquito breeding in urban Cairo using remote sensing. Egypt. J. Remote Sens. Space Sci. 2013. [Google Scholar] [CrossRef]
Figure 1. The State of California, USA with the County of Fresno shaded in green (left). Near infrared (NIR), red, and green false color composite (represented by red, green, and blue color layers) of the QuickBird image (copyright 2013) containing the study area represented by the yellow box (right). The image was acquired on 26 August 2007 at 1926 UTC.
Remotesensing 05 03544f1
Figure 2. Color-coded Normalized Difference Water Index (NDWI) image of the study area (left). QuickBird image (copyright 2013) showing the near infrared (NIR), red, and green false color composite of the study area (right). Parking lots (PL), which have asphalt surfaces, show lower NDWI values, while flood control basins (FCB), which have water surfaces, show higher NDWI values. Vegetation, and other non-water surfaces, such as rooftops (excluding asphalt), have NDWI values equal to, or below, zero and are color-coded gray.
Remotesensing 05 03544f2
Figure 3. Color-coded NDWI image of an apartment complex swimming pool (left). True color NAIP image of same location acquired on 27 June 2009 (right).
Remotesensing 05 03544f3
Figure 4. Color-coded NDWI image of residential neighborhood (left). True color NAIP image acquired on 27 June 2009 (right). Low NDWI values are easily associated with non-water features such as rooftops and asphalt roads. The feature in both images labeled SP (shaded pool) is an example of where shadowing effects can cause low NDWI values for water surfaces. Note the large number of low value NDWI pixels associated with some rooftops.
Remotesensing 05 03544f4
Figure 5. Color-coded Zonal Max NDWI image of residential neighborhood (left). QuickBird image (copyright 2013) showing the near infrared (NIR), red, and green false color composite of the study area (right). Parcels with asphalt and vegetated surfaces, and which do not have water surfaces, have low values of NDWI assigned to them, while parcels with water surfaces have higher values assigned to them.
Remotesensing 05 03544f5
Figure 6. Color-coded NDWI image of four residential parcels (left). QuickBird image (copyright 2013) showing the near infrared (NIR), red, and green false color composite, and the location of the pixels composed of the maximum NDWI values of the file binNDWIMax which are represented as yellow squares (right). The white circles show the locations in both images.
Remotesensing 05 03544f6
Table 1. Spatial and spectral resolution of the QuickBird imagery.
Image TypeBandSpatial Resolution (m)Spectral Resolution (μm)
MultispectralBlue2.440.45–0.52
Green2.440.52–0.60
Red2.440.63–0.69
NIR2.440.76–0.90
Table 2. Confusion matrix for the method of identifying residential parcels that contain swimming pools for a threshold of NDWI ≥ 0.3. The matrix shows the actual and classified parcels in the columns and rows. The Producer’s Accuracy refers to the accuracy of the analytical procedure and the User’s Accuracy refers to the reliability of the analytical procedure.
Analyzed QuickBird Image
∑ UserUser’s Accuracy (%)Error of Commission (%)Error of Omission (%)
Parcels with PoolsParcels without Pools

Google
Earth
Reference
Image
Parcels with pools5351154698.02.021.6
Parcels without pools1471,1071,25488.311.71.0
∑ Producer6821,1181,642
Total Parcels1,800
Producer’s Accuracy (%)78.499.0
Overall Accuracy (%)91.2
Overall Kappa Coefficient0.805
Table 3. Comparison of error matrices of Kim et al. with the present study. The Producer’s Accuracy refers to the accuracy of the analytical procedure and the User’s Accuracy refers to the reliability of the analytical procedure.
Overall AccuracyUser’s AccuracyProducer’s AccuracyKappa Coefficient
Kim et al.92.2%90.4%93.9%0.840
Present Study91.2%98.0%78.4%0.806

