Article

The Use of Surveillance Cameras for the Rapid Mapping of Lava Flows: An Application to Mount Etna Volcano

1
Istituto Nazionale di Geofisica e Vulcanologia, Osservatorio Etneo, Piazza Roma 2, 95125 Catania, Italy
2
Università di Roma La Sapienza, Via Eudossiana 18, 00184 Rome, Italy
3
Survey Lab, Spinoff Sapienza University, Via Eudossiana 18, 00184 Rome, Italy
4
University of Applied Sciences and Arts Northwestern Switzerland FHNW, Gründenstrasse 40, 4132 Muttenz, Switzerland
*
Author to whom correspondence should be addressed.
Remote Sens. 2017, 9(3), 192; https://doi.org/10.3390/rs9030192
Submission received: 25 October 2016 / Revised: 13 February 2017 / Accepted: 20 February 2017 / Published: 25 February 2017

Abstract

:
In order to improve the observation capability in one of the most active volcanic areas in the world, Mt. Etna, we developed a processing method to use the surveillance cameras for a quasi real-time mapping of syn-eruptive processes. Following an evaluation of the current performance of the Etna permanent ground NEtwork of Thermal and Visible Sensors (Etna_NETVIS), its possible implementation and optimization was investigated to determine the locations of additional observation sites to be rapidly set up during emergencies. A tool was then devised to process time series of ground-acquired images and extract a coherent multi-temporal dataset of georeferenced map. The processed datasets can be used to extract 2D features such as evolution maps of active lava flows. The tool was validated on ad-hoc test fields and then adopted to map the evolution of two recent lava flows. The achievable accuracy (about three times the original pixel size) and the short processing time makes the tool suitable for rapidly assessing lava flow evolutions, especially in the case of recurrent eruptions, such as those of the 2011–2015 Etna activity. The tool can be used both in standard monitoring activities and during emergency phases (eventually improving the present network with additional mobile stations) when it is mandatory to carry out a quasi-real-time mapping to support civil protection actions. The developed tool could be integrated in the control room of the Osservatorio Etneo, thus enabling the Etna_NETVIS for mapping purposes and not only for video surveillance.

Graphical Abstract

1. Introduction

In volcanic areas, where it is often difficult to access the most critical zones to carry out direct surveys, digital photogrammetry techniques have remarkable potential for following the evolution of volcanic activity and monitoring deformation processes [1,2,3,4]. Aerial digital photogrammetry can acquire dense 3D data over large areas, thus it is suitable to observe rapid evolving and widespread phenomena. Digital photogrammetry processing is based on the application of matching procedures between overlapping images using autocorrelation algorithms capable of working at subpixel level [5]. Direct georeferencing or, at least, the use of a pre-established network of GCPs (Ground Control Points) has reduced the need for ground survey operations [6]. The outputs of digital photogrammetry are multi-temporal Digital Orthophotos and Digital Elevation Models (DEMs), that allow implementing a quantitative comparative analysis. The systematic acquisition of airborne photogrammetric datasets can be adopted for long-term volcano monitoring and hazard assessment [1,2]. During volcanic crisis, oblique digital images, frequently acquired by helicopter, can be processed, for example with the scientific tool Orthoview [7] that uses a straightforward photogrammetric approach to generate digital orthophotos. The processing, through photogrammetric software, of digital images taken from helicopter, light aircraft or ground can also be used to extract DEMs from points identified in multiple photos. The comparison of successive DEMs can be used to model the evolving morphology of a growing dome, as done for the 2004–2008 eruption of Mount St. Helens volcano, the 2009 eruption of Redoubt volcano, the active lava dome at Volcán de Colima, Mexico and the dome at the Soufrière Hills volcano on Montserrat from 1 August 2005 to 20 April 2007 [3,4,8,9]. Oblique stereo-pair time-lapse imagery acquired on the ground can also be processed by combining close-range photogrammetry and traditional stereo-matching software or by using a software based on structure-from-motion, to extract DEMs for analyzing active lava flows on Kilauea volcano, Hawaii and Mount Etna, Sicily [10].
In order to evaluate the temporal evolution of a lava flow field and estimate its effusion rate, thus enabling to perform analysis on the eruptive mechanism, a multi-temporal analysis is required. In the past, such analyses have been performed only on long-duration lava flows mainly using photogrammetric data, topographic maps and historical reports [11,12,13,14].
An almost continuous survey can be obtained during emergency phases by processing images constantly acquired from a ground network of sensors, to implement a quasi-real-time monitoring for supporting civil protection actions.
Previous works (discussed below) demonstrate that the routine and automatic application of photogrammetric techniques to process ground based images offers promising perspectives for operational applications, such as monitoring and early warning systems of natural disasters including volcanic eruptions, landslides, or analysis of glacier motion. Most of the previous applications were developed in support of portable video stations. More specifically, the approaches developed for landslides and glaciers monitoring are devoted to the extraction of single features displacement and velocity fields.
A real-time mapping system was previously developed to extract ortho-images by rectifying digital landscape images acquired by a single ground-based digital camera. The rectification was carried out by matching between the common skyline edge that appears in the image and in a reference one generated from a DEM. The mapping system was tested during a survey of the Mayon Volcano, Philippines [15]. Oblique photogrammetric techniques have also been adopted to process visible and thermal images acquired on the ground with portable cameras. A minimum of four 3D targets, having known positions, on each visible image and a DEM of the investigated area are required to extract camera orientation. Thermal images are taken at the same location of the visible ones to allow the estimation of a suitable projective transformation for obtaining georeferenced maps used for further analysis of lava-flow development this method was tested during the 2004–2005 eruption of Mount Etna, Sicily [16]. A similar approach has been applied to map Etna’s active flows on 27–29 September 2004 by moving a single pre-calibrated camera around the lava flow-fronts. A thermal image sequence was processed to analyze the flow of lava down a distal channel in order to assess flux and rheological properties [17]. A very-long-range terrestrial laser scanner was applied on active lavas at Mount Etna on 5–12 June 2009 [18]. To facilitate visualization and interpretation of the laser data, visible and thermal images were also acquired and processed as described in [16]. Visible imageries, acquired at the Mammoth Mountain (CA) fumarole area, were processed using the structure-from-motion photogrammetric method to create a DEM for orthorectifying and georeferencing thermal infrared imageries with the final aim of analyzing three-dimensional maps of apparent surface temperature and radiant hydrothermal heat flux [19].
A low-cost methodology to monitor the displacement of continuously active landslides from ground-based optical images was tested on the Super-Sauze landslide (South French Alps) over the period 2008–2009 [20]. The data were processed with a cross-correlation algorithm applied to the images in the acquisition geometry and the calculated 2D displacement field was orthorectified with a back projection technique using a high resolution DEM. The performance of the technique was assessed using differential GPS (Global Positioning System) surveys as reference.
Terrestrial photogrammetric surveys using monoscopic oblique images have been conducted to monitor the motion at the tongue of Jakobshavn Isbræ glacier in Greenland and at the front of the Glaciar San Rafael in the Northern Patagonia Icefield to evaluate their spatial-temporal velocity fields [21,22,23]. An open-source package to evaluate velocity field by tracking features between image pairs has been developed and tested on the Engabreen glacier in northern Norway [24].
This work presents a dedicated approach we have developed to orthorectify images acquired from the permanent ground NEtwork of Thermal and Visible Sensors located on Mt. Etna (Etna_NETVIS) with the aim of quantifying the temporal evolution of lava flows. The presented approach can easily be applied to similar ground networks for monitoring active volcanoes and natural disasters.
The work starts by analyzing the present configuration of Etna ground network of cameras with a view to its possible implementation to guarantee a complete observation of the summit area and of the slopes potentially inundated by lava flows. In particular, it investigates a number of locations for additional observation sites to be set up during emergency phases, thus supporting a rapid assessment of the most favorable locations.
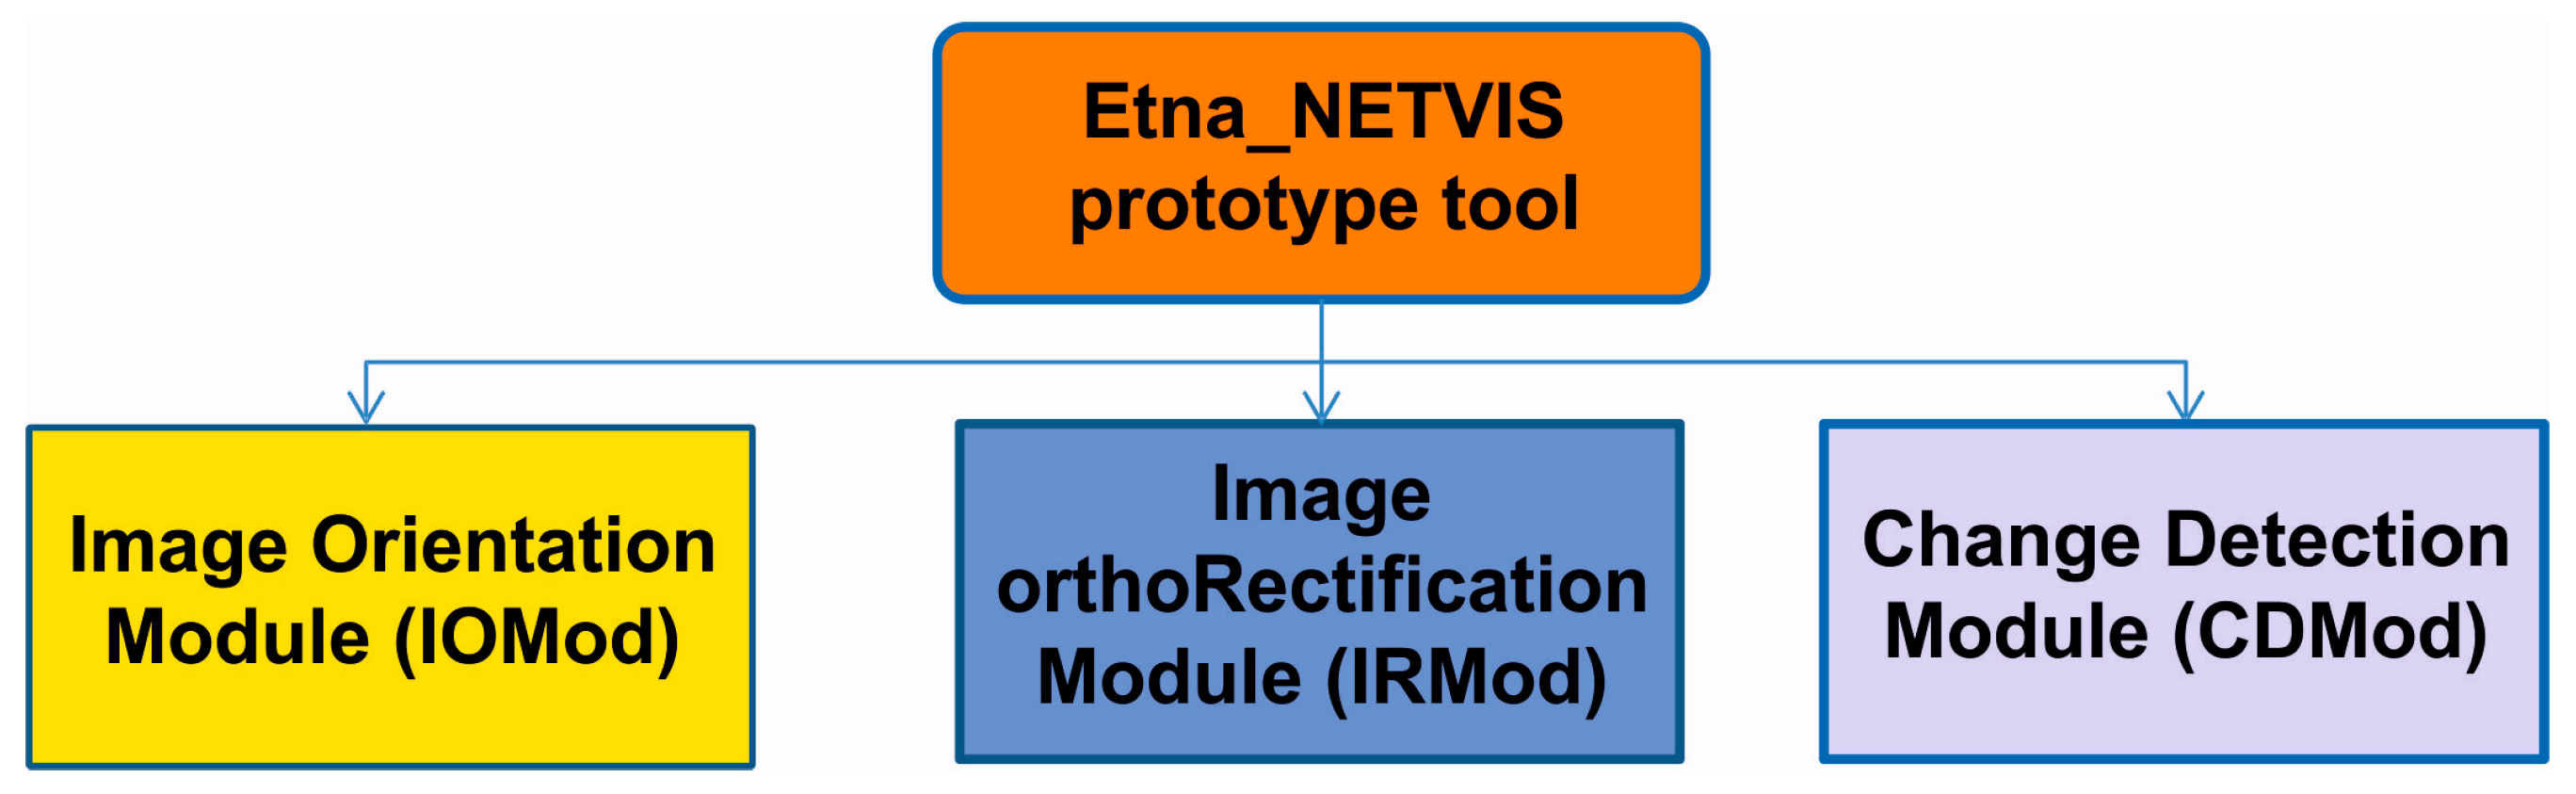
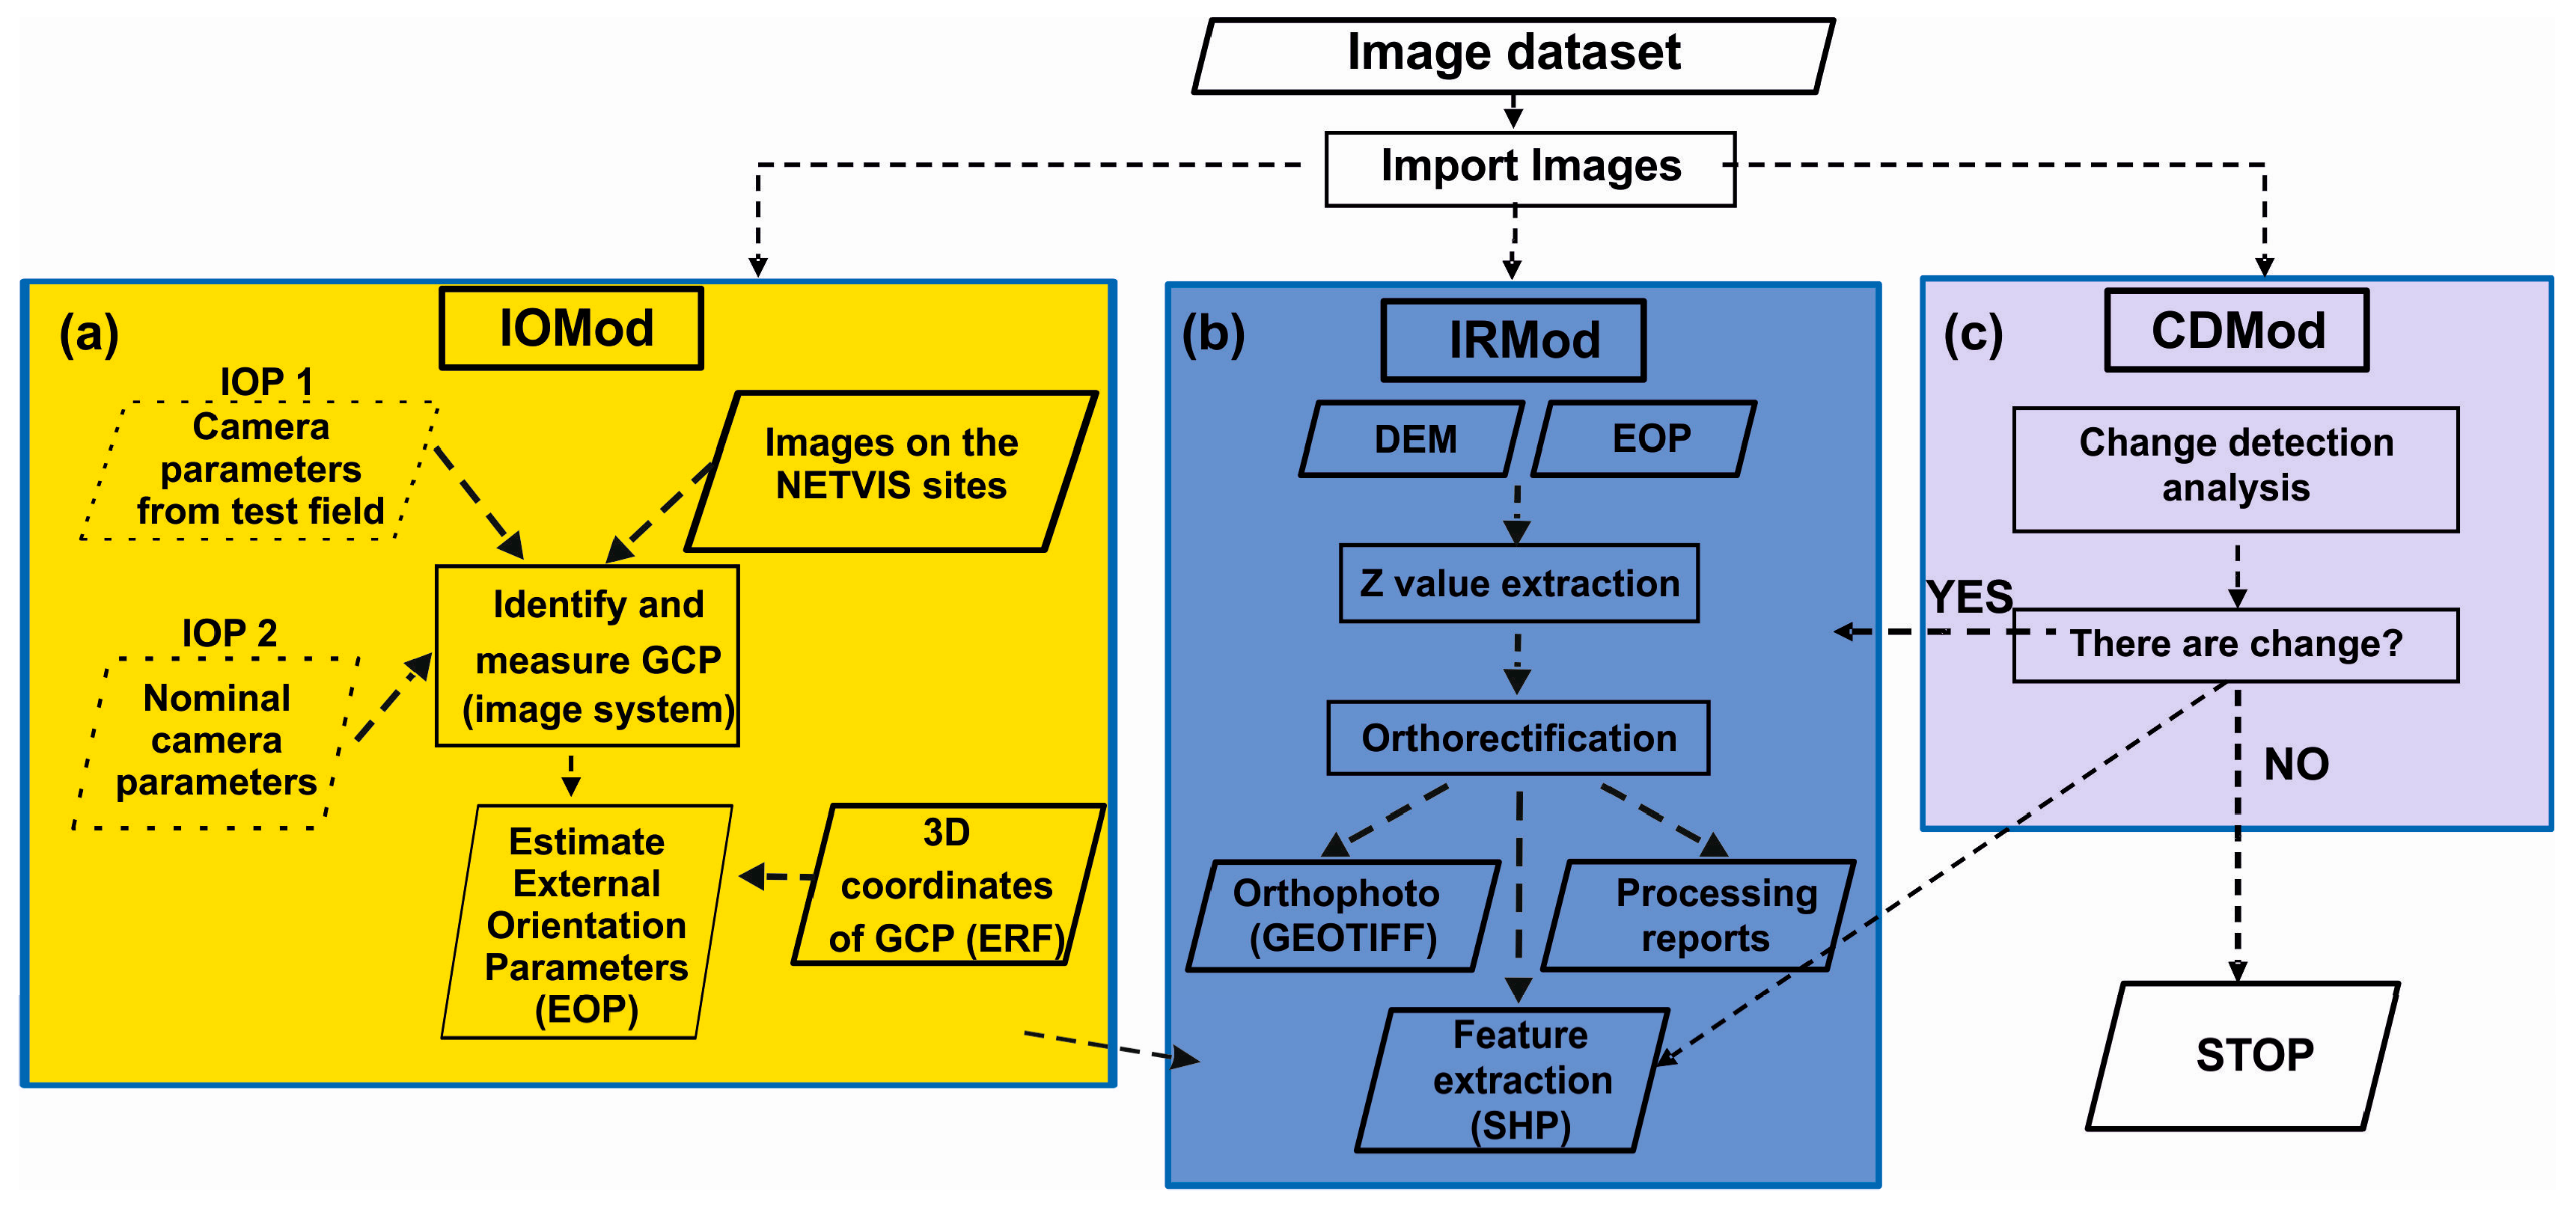
The main goal of the work is to develop an image-processing tool for extracting a coherent multi-temporal dataset of orthophotos from ground-acquired images, provided that a reference DEM is available. In this way, the Etna_NETVIS is implemented for mapping purposes and not only for surveillance functions. The processed datasets can be used for the extraction of 2D features such as the evolutions maps of an active lava flow, useful for rapidly estimating its direction and rate of advancement. The developed tool comprises three different modules: the Image Orientation Module (IOMod), the Image orthoRectification Module (IRMod) and the Change Detection Module (CDMod). The processing tool was initially evaluated on two ad-hoc test fields established at INGV (Istituto Nazionale di Geofisica e Vulcanologia) facility edifice in Nicolosi (CT) and at La Montagnola observation site. A number of images have been acquired during the two tests to evaluate the spatial and radiometric accuracy of the sensors and estimate the internal and external orientation parameters of the camera. Two more tests were performed using datasets acquired from Monte Cagliato thermal camera of Etna_NETVIS during the eruptive events on 12 and 29 August 2011 from the New South East Crater that were characterized by both explosive and effusive activity.
The 12 August 2011 eruptive event was previously analyzed to compare radiance estimates from data acquired with a long-range ground-based thermal camera and from SEVIRI (Spinning Enhanced Visible and InfraRed Imager) satellite images [25]. Images acquired by the thermal camera located at Monte Cagliato have been processed to generate georeferenced temperature maps, corrected for atmospheric effect and view angle. Images georeferentiation was performed through the approach presented in [16,17] that is by determining the camera orientation using measured GPS coordinates of the camera and by aligning a representative image with a projection of the 2005 Etna digital elevation model as viewed from the Monte Cagliato site.

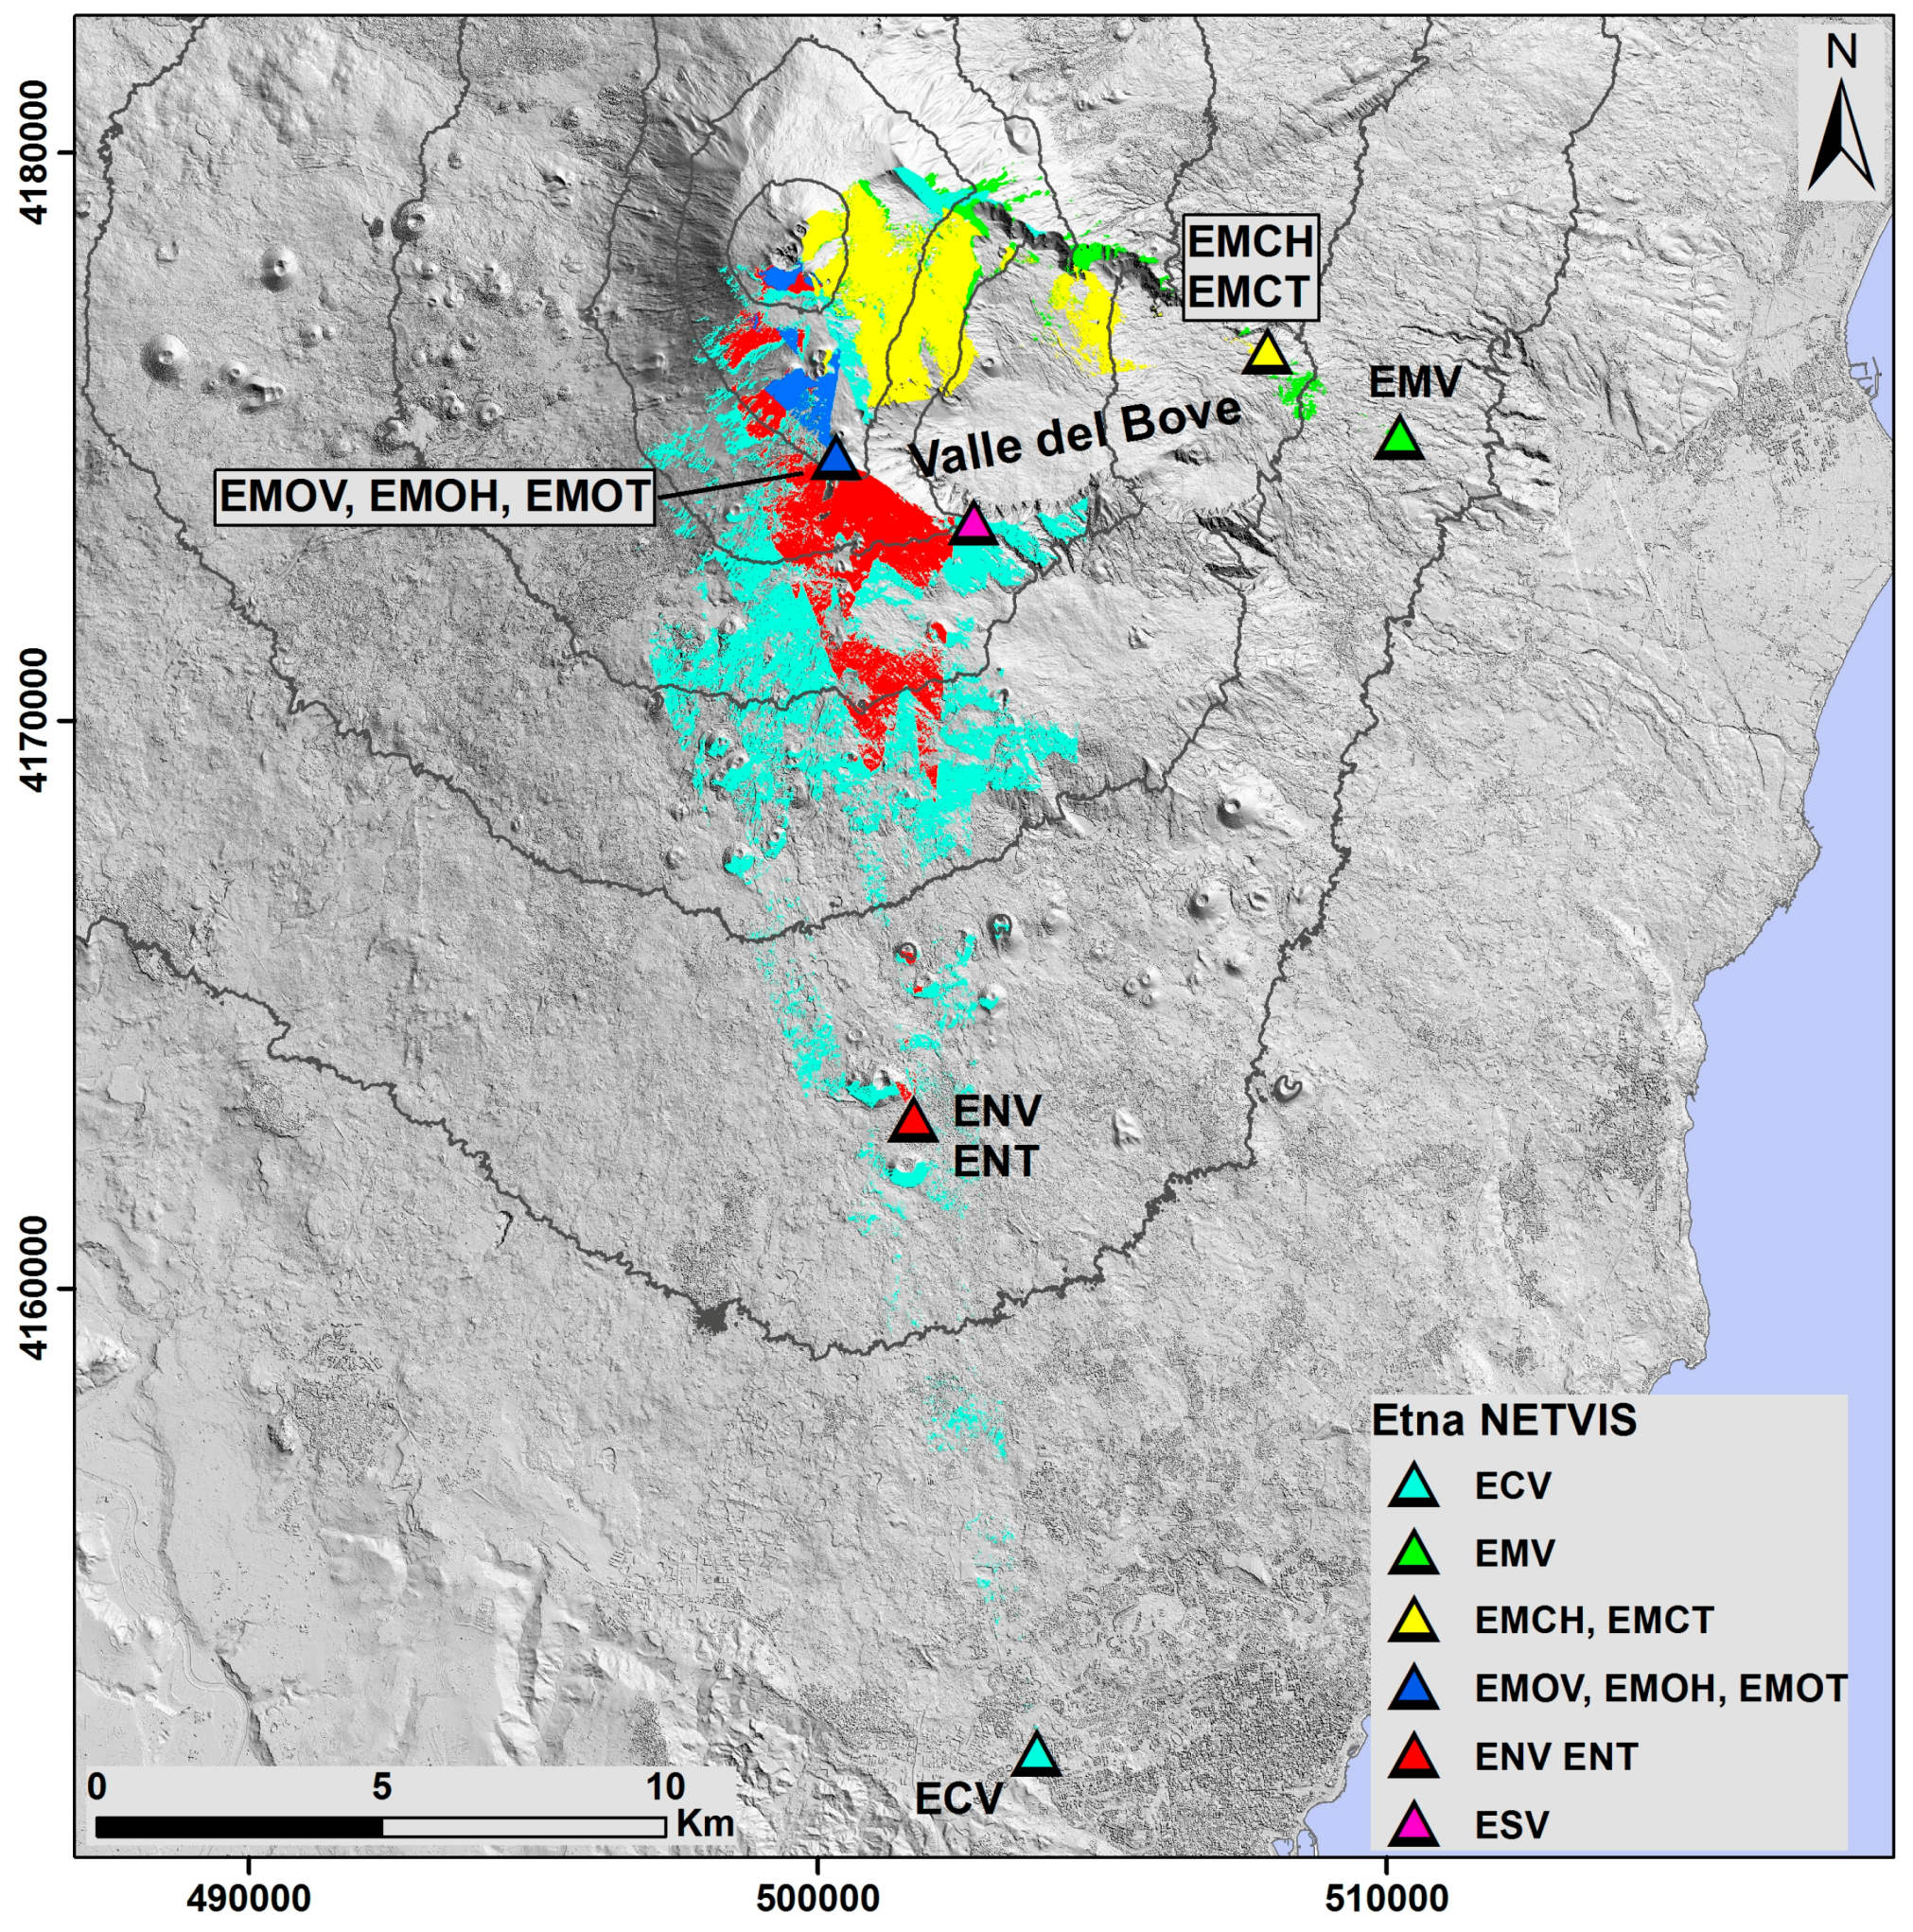
2. The Etna_NETVIS Network

The permanent ground NEtwork of Thermal and VIsible Sensors of Mt. Etna (Etna_NETVIS) comprises visible and thermal cameras located at different sites on Etna’s southern and eastern flanks. The network, initially with CANON VC-C4R Visible (V) and FLIR A40 Thermal (T) cameras installed at Etna Cuad (ECV), Etna Milo (EMV), Etna Montagnola (EMOV and EMOT), Etna Nicolosi (ENV and ENT) sites, has recently been updated (since 2011) by adding High resolution (H) sensors (VIVOTEK IP8172 and FLIR A320) at Etna Monte Cagliato (EMCT and EMCH) and Etna Montagnola (EMOH) sites (Figure 1).
An analysis of the current network configuration, focusing on the view geometry and on the sensor performances, was done to evaluate the observation capability of the different stations along the volcano slopes and on the summit area. This analysis was made in a 3D virtual environment using a DEM of Etna volcano and taking into account the sensor positions and orientations. Currently, the ground coverage of all sensors is limited to the summit portion of the volcano and to the high south and southeast flanks (Figure 1). The present network is effectively focused on monitoring the volcanic plume, generally produced by the summit craters.
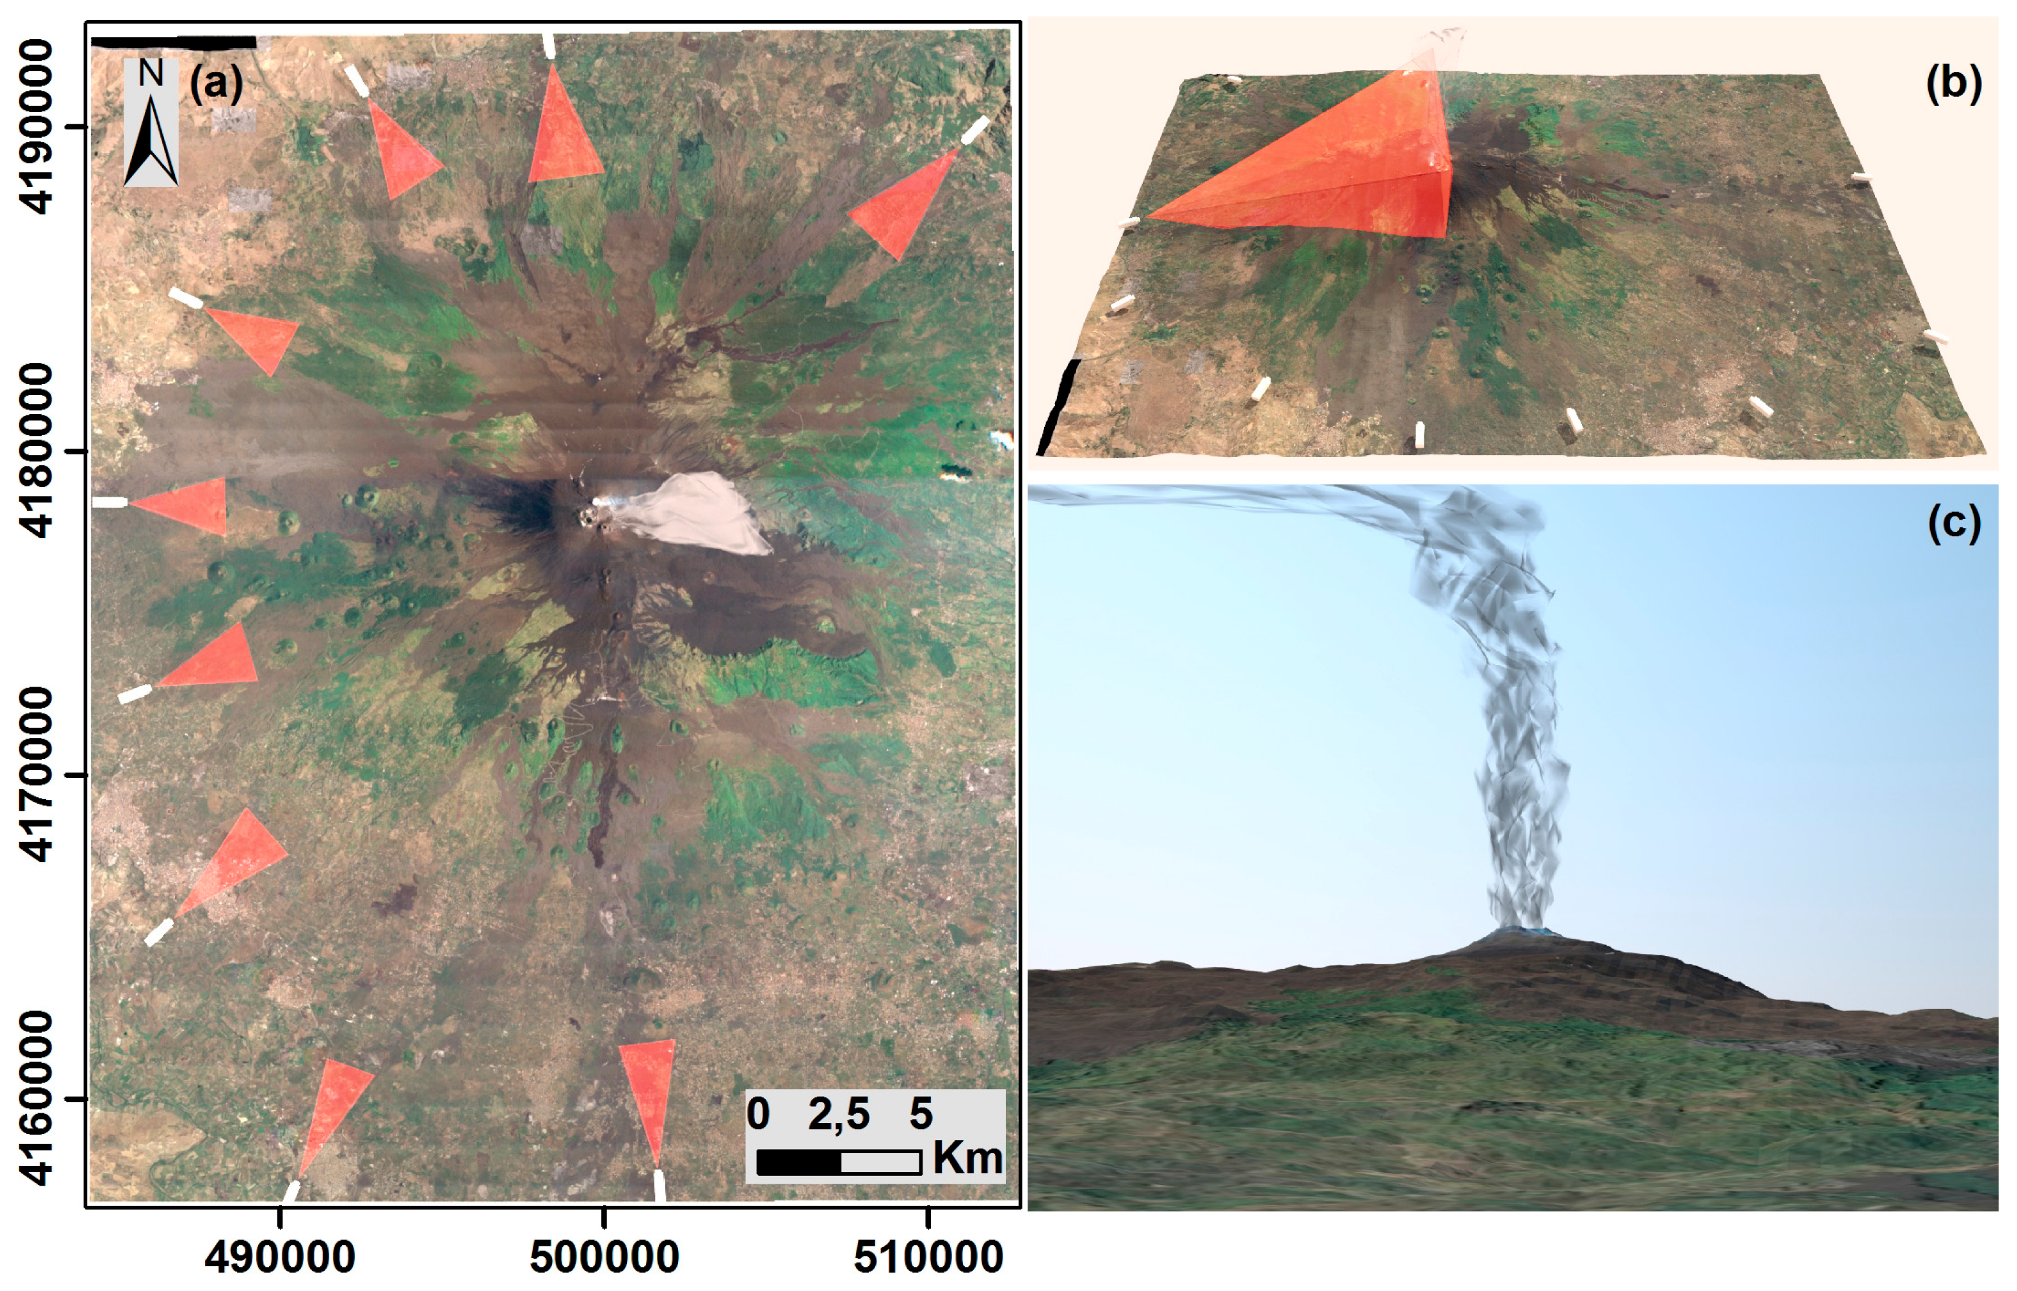
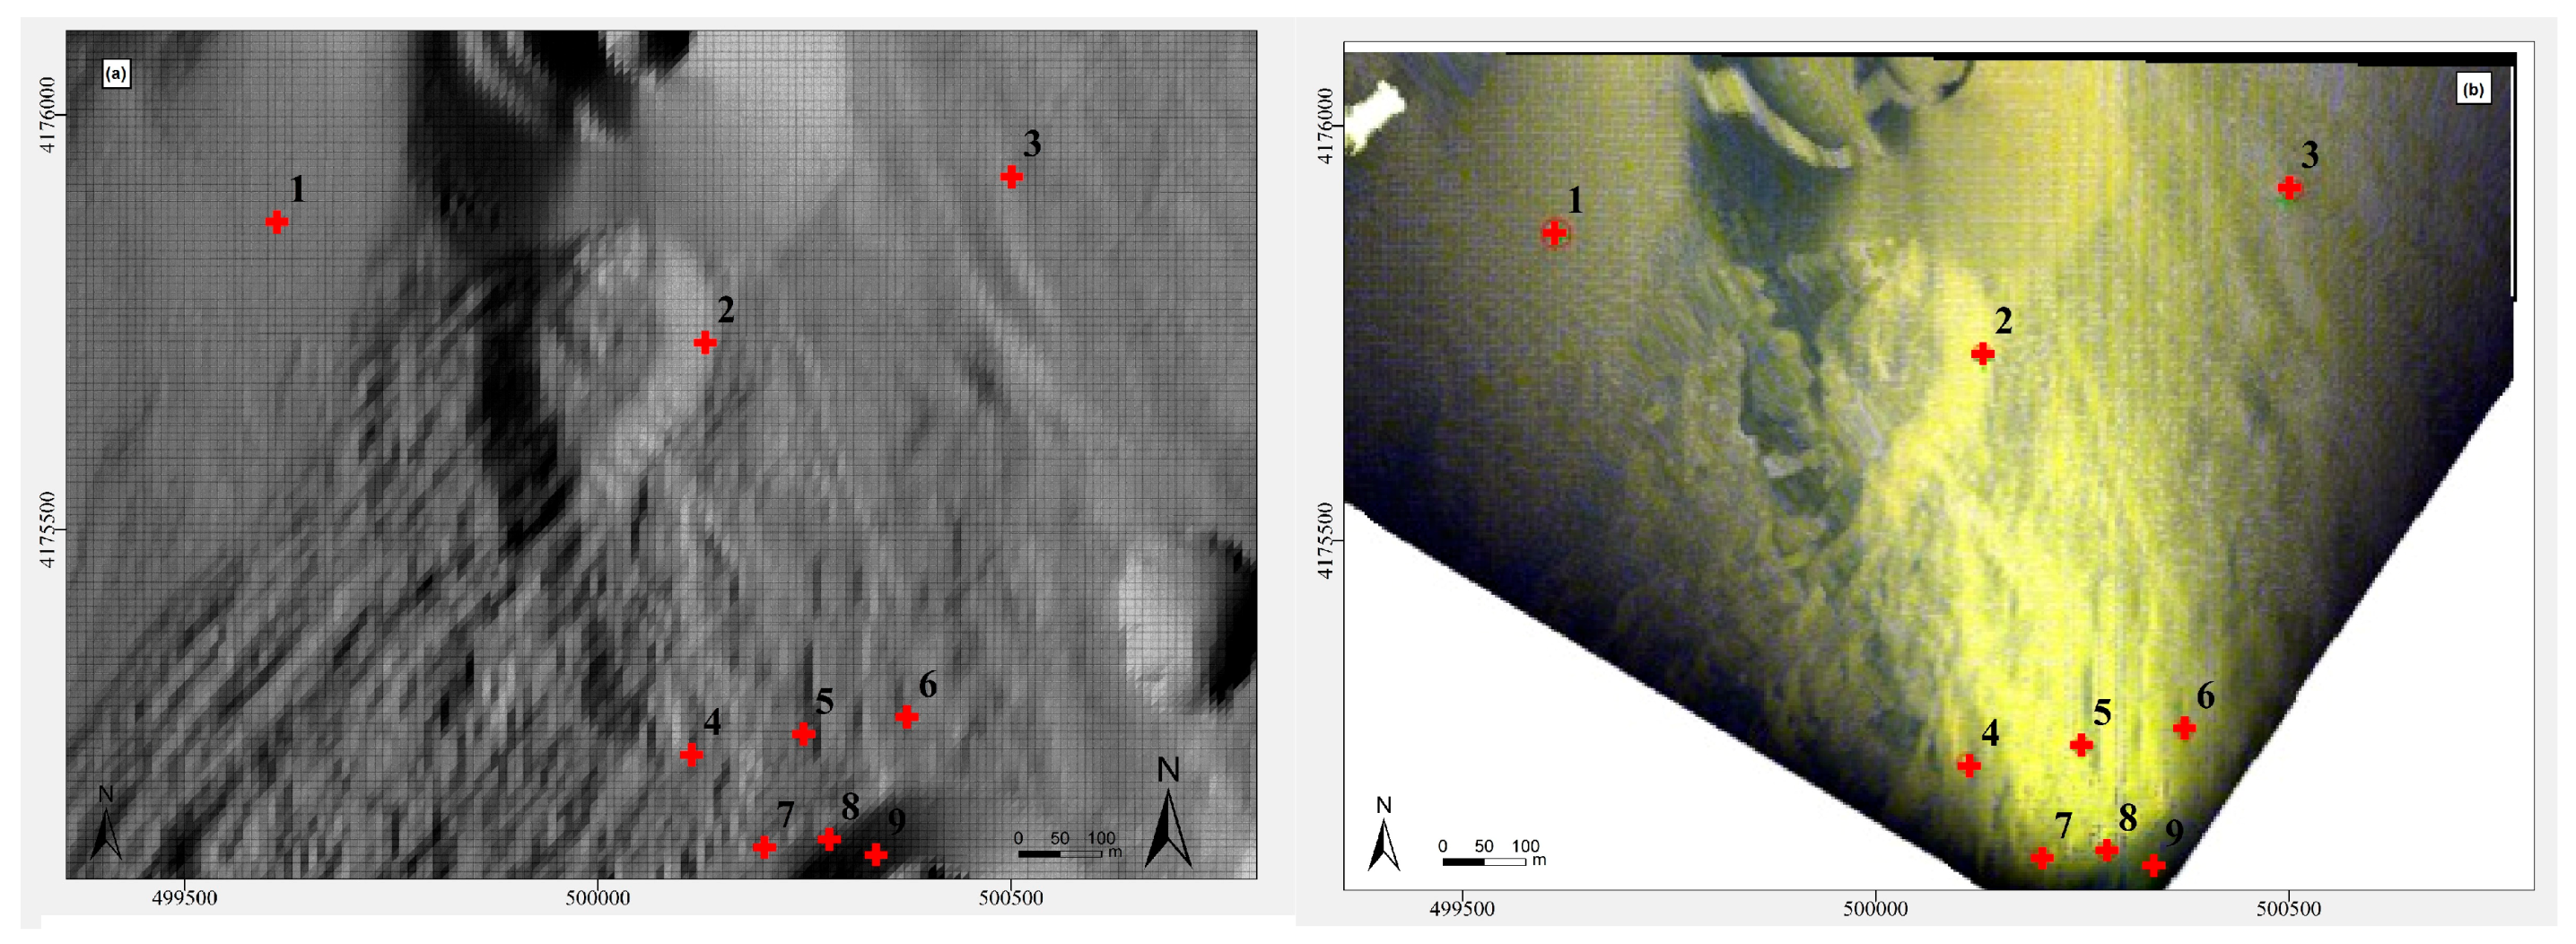
A possible implementation of the network was then investigated to improve the ground coverage and resolution. In order to optimize the configuration, for monitoring both the explosive and effusive activity, a simulation of an augmented network was performed by setting up a number of observation sites distributed evenly around the volcano base (Figure 2a). During emergency phases, mobile stations can be installed in the identified sites to improve the observation capability close to the area in which the eruption is expected to develop. The mobile stations can be equipped with high-resolution sensors such as the VIVOTEK IP8172 and FLIR A320 cameras investigated here. This wide configuration would allow monitoring the volcanic plume development, including its proximal dispersion (through visible sensors), and detecting and pinpointing fissure and vent openings at the onset of effusive episodes (using both thermal and visible sensors). Simulated views of the areas visible from the proposed new observation sites were also made (Figure 2b,c).
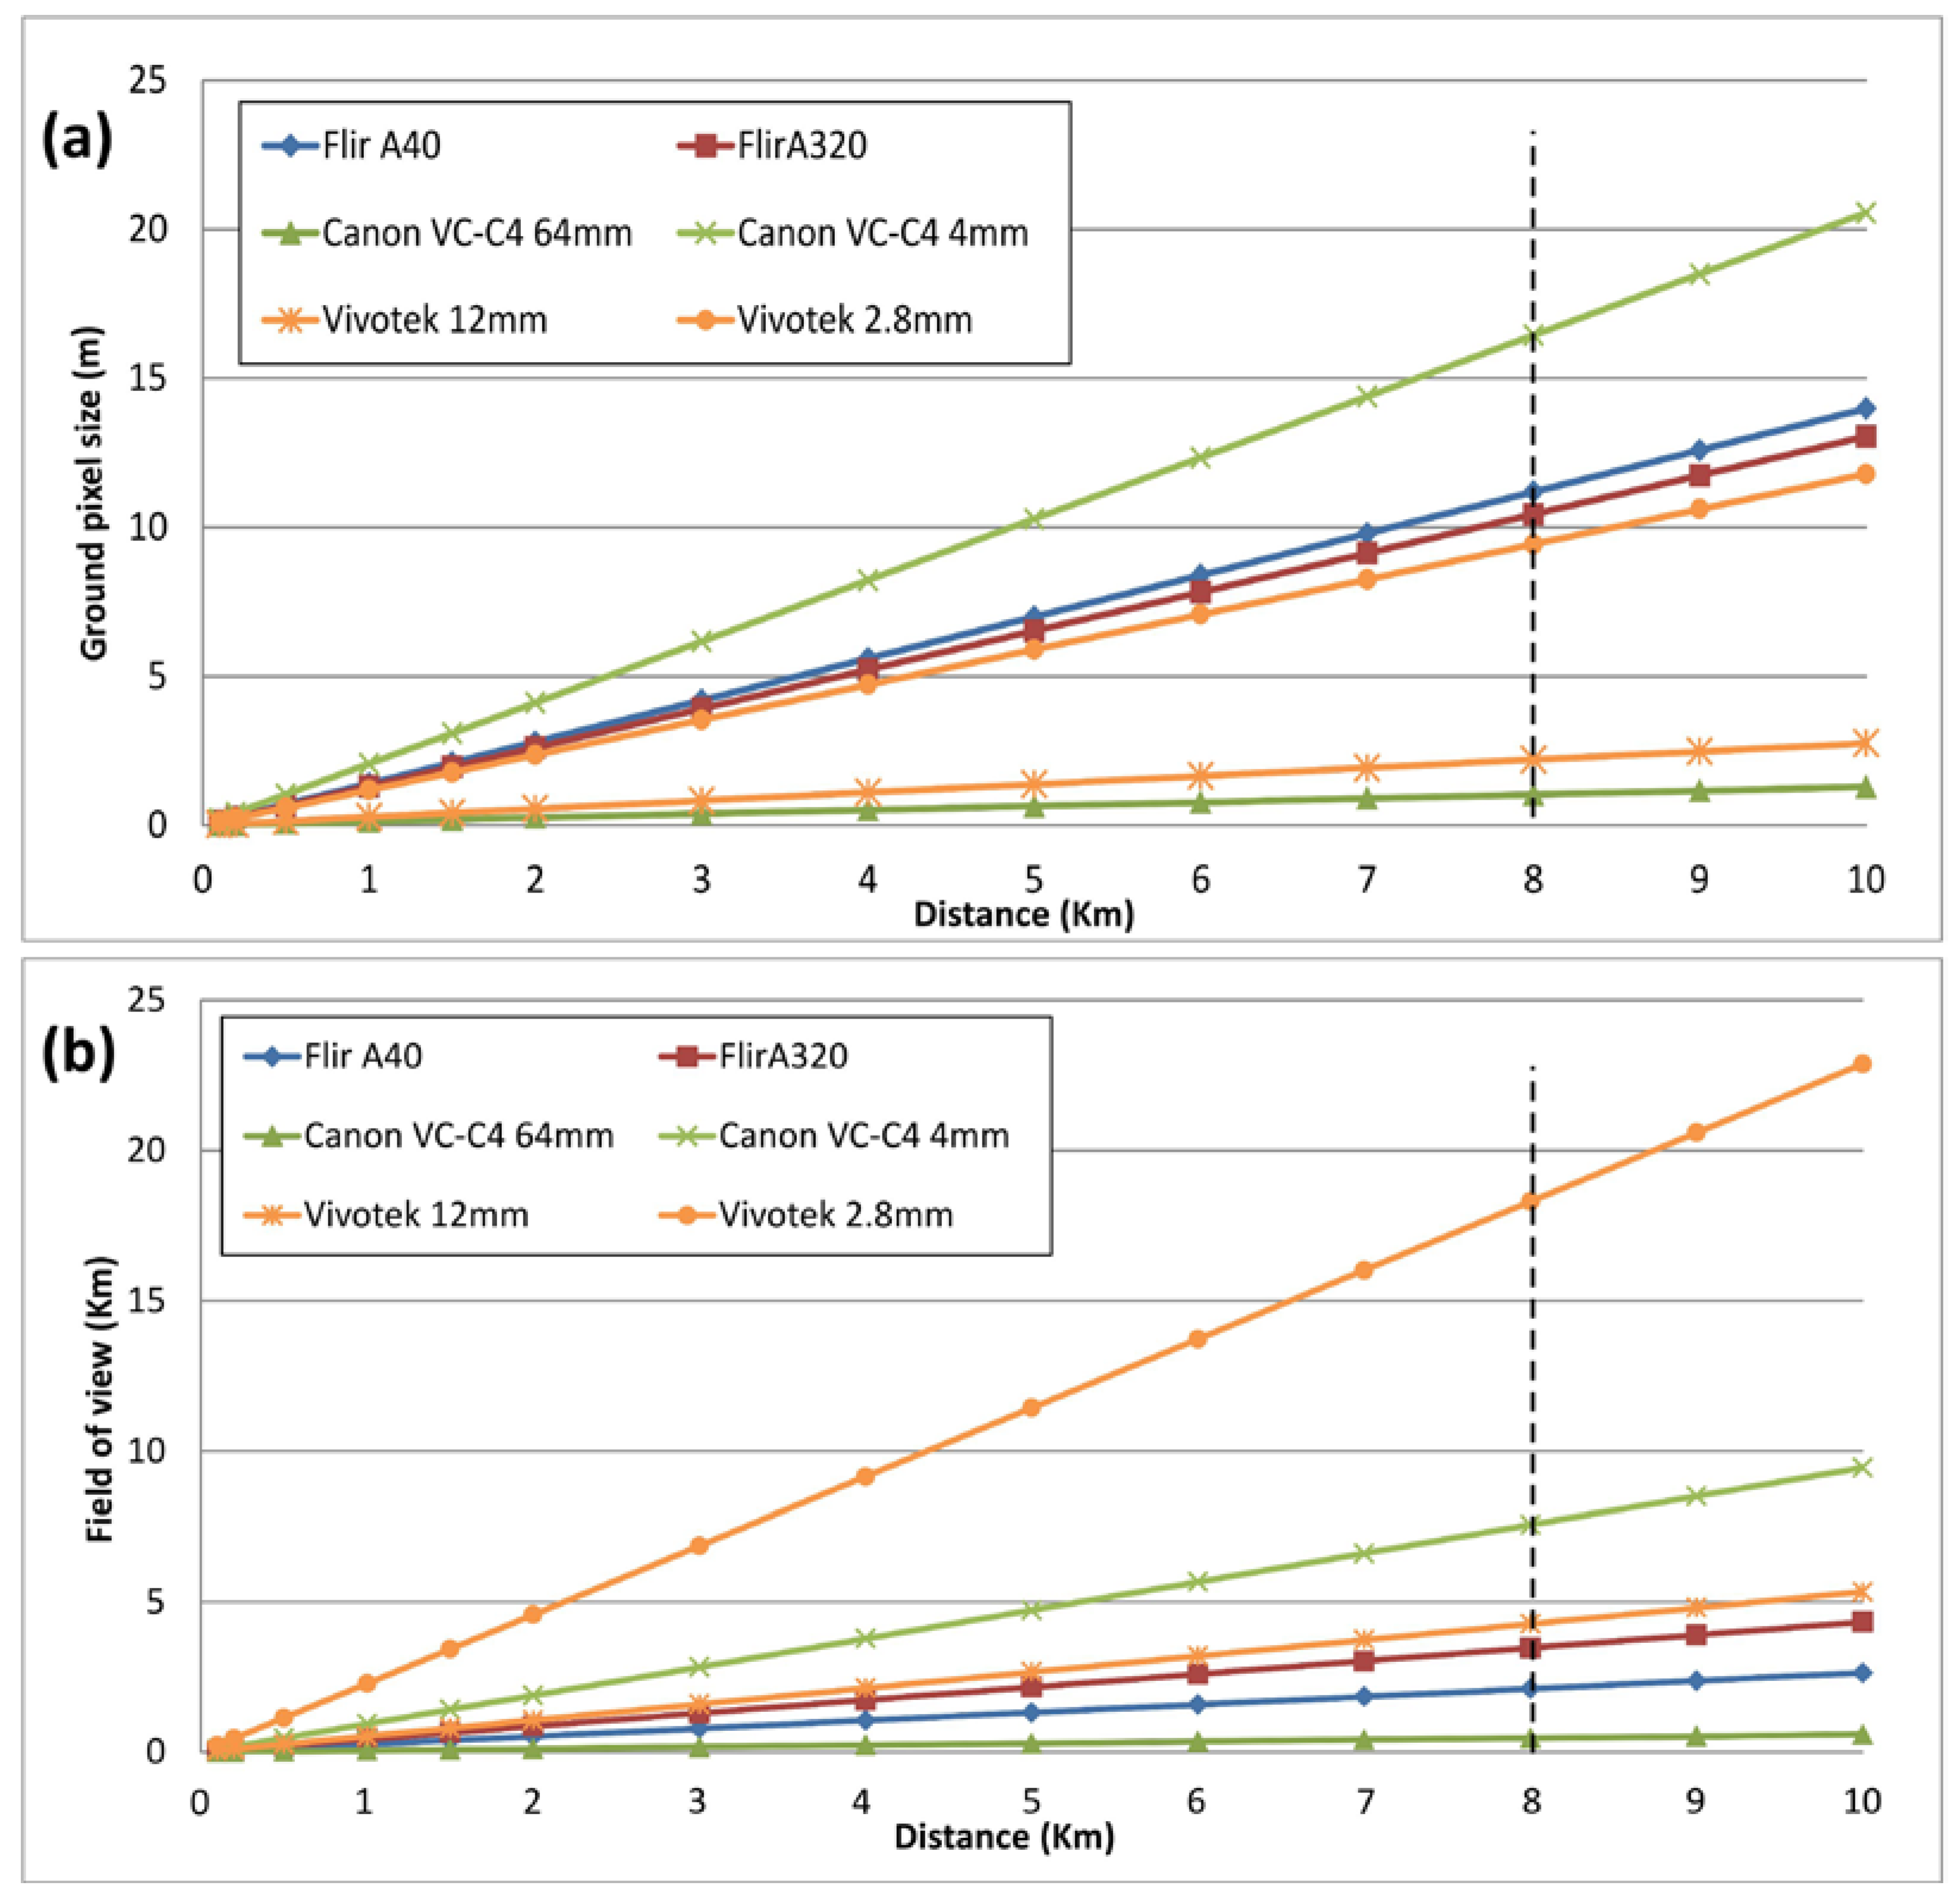
The technical specifications of the cameras operating today in Etna_NETVIS, including sensor dimension, pixel size, focal length and Horizontal and Vertical field of view (HFOV and VFOV), have been checked to evaluate their observation performance (Table 1). The variations of pixel size on the ground and of the maximum values of the Horizontal Field of View have been evaluated, for both the thermal and visible cameras, with respect to the distance (Figure 3).
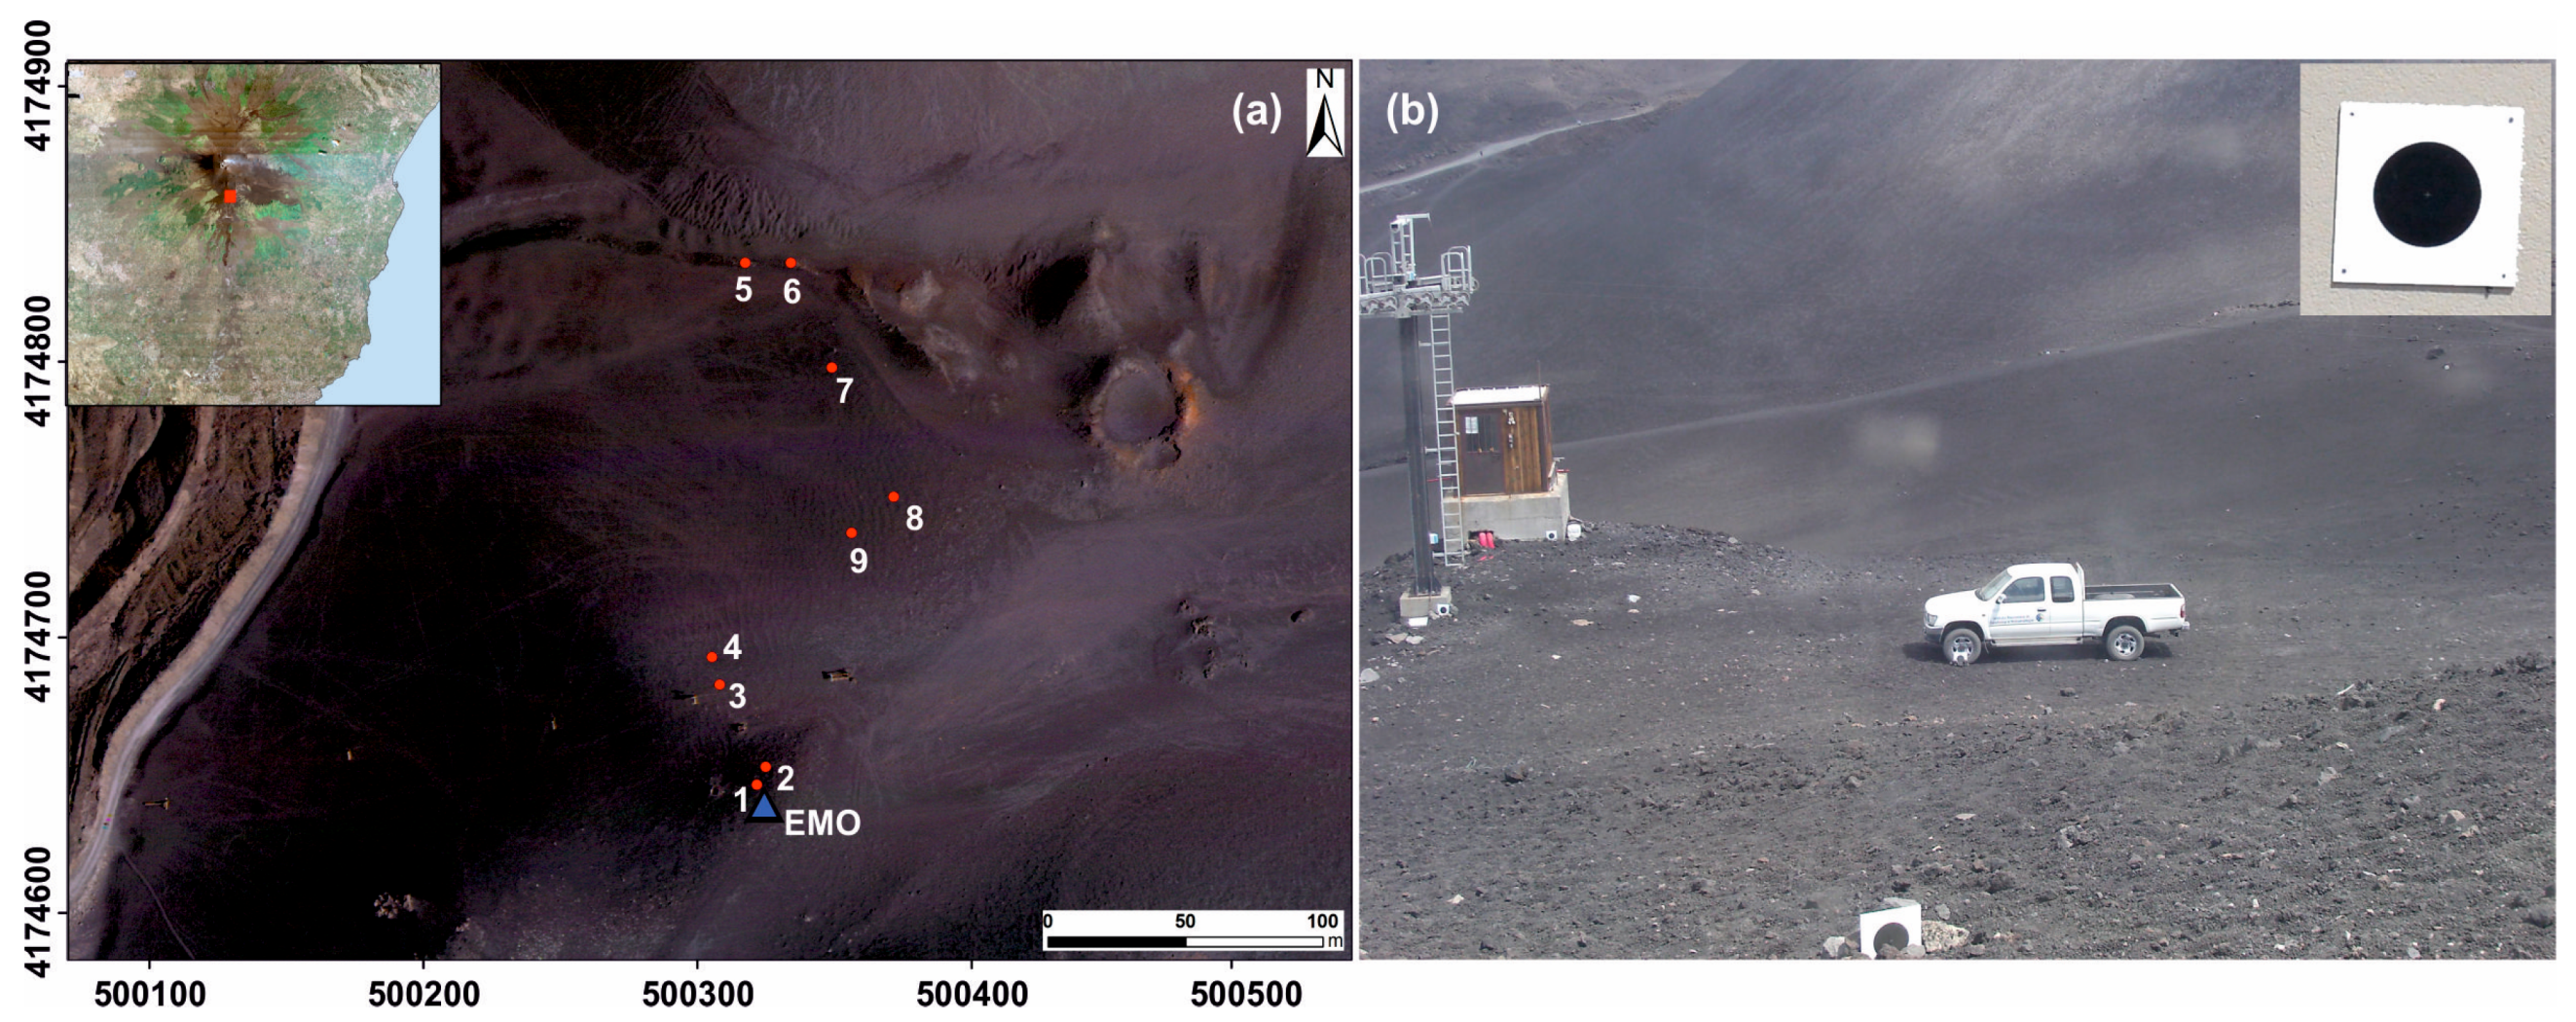
Two of the sensors belonging to Etna_NETVIS have been investigated in the field. The VIVOTEK IP8172 visible camera, currently installed at La Montagnola and Monte Cagliato sites (EMO and EMC in Figure 1), was used to conduct experimental tests on two test fields at the INGV facility in Nicolosi (CT) and at La Montagnola site (EN and EMO in Figure 1). The first test was to calibrate the sensor, and the second one was to estimate its external orientation when mounted on the observation site. The FLIR A320 thermal camera installed at Monte Cagliato (EMCT in Figure 1) was used to test the entire developed tool during operational phases, namely during eruptive episodes.
Since 2011, Etna eruptive activity has involved only the summit craters and in particular the New South-East Crater (NSEC). Eruptive events occurred at NSEC have been characterized by high lava fountains and the formation of lava flow fields inside the Valle del Bove (situated on Etna’s east flank, Figure 1). This portion of the volcano is partially observable from the visible camera located at Schiena dell’Asino (ESV) and more widely observable from the visible and thermal cameras installed at Monte Cagliato (EMCH and EMCT). It is therefore important to evaluate the capability of the two sensors installed at Monte Cagliato (VIVOTEK IP8172 and FLIR A320) to monitor eruptive phenomena at the summit area or in its proximity. Figure 3 enables assessing the ground pixel size and the field of view of each sensor in terms of its linear distance from a designed area. In particular, the linear distance between Monte Cagliato site and the New South-East Crater is about 8 km. At this distance, the minimum focal length of the VIVOTEK IP8172 camera (2.8 mm) gives a ground pixel size and a field of view of about 10 m and 18 km, respectively, while its maximum focal length (12 mm) gives a ground pixel size and a field of view of about 2 m and 5 km, respectively. At the same distance, the FLIR A320 camera gives a ground pixel size and a field of view of about 10 m and 4 km, respectively (Figure 3). Given the diameter of the whole crater area is approximately 1 km, we can conclude that the two sensors installed at Monte Cagliato site have a sufficient resolution and field of view to monitor eruptive phenomena at the summit area or in its proximity.

3. Camera Orientation

It is well known that the use of a camera, without considering the calibration parameters (radial and tangential distortion of the sensor and geometry of acquisition), will introduce large approximations leading to several errors in the image processing owing to a geometry that is quite different from an ideal central perspective projection [7]. A procedure for performing camera calibration (internal orientation) was experimented and a tool for defining the camera external parameters (position and attitude) in ERF (External Reference System) was implemented in the prototype version of the NETVIS tool as described below.

3.1. Analysis of Method for Estimating Internal Orientation Parameters/Sensor Calibration Procedure

A first test was performed to estimate the internal orientation parameters of the VIVOTEK IP8172 visible camera and to select the procedures to be implemented in the sensor calibration module. We developed a tool based on an open source library, that is the OpenCV package [26], which can be integrated in ad-hoc implemented software. Then, we performed a comparative analysis by processing the same dataset with the developed tool and the calibration module included in the commercial Halcon library package [27], which adopts a method based on the work of Heikillä [28].
A 3D calibration test field was made by distributing thirty-five artificial targets evenly on a wall and on the windows of the INGV facility in Nicolosi (CT) (Figure 4). The extent, size and spatial distribution of the targets have been designed to comply with the technical specifications (view angles, focal lengths, and pixel sizes) of the VIVOTEK IP8172 camera. In particular, the targets were set as black circles with a 0.15 m diameter, in order to be visible in the image by at least 10 pixels. The positions of the targets, to be used as Ground Control Points (GCPs), have been measured by a high-precision topographic survey performed, from three positions, with a total station Leica Viva TM50. The GCPs coordinates have been calculated using a least square adjustment algorithm that gave an overall accuracy of better than a millimeter.
During the test, a dataset of 24 images was acquired on the calibration field with the VIVOTEK IP8172 visible camera installed in different positions, at a mean distance of 10 m, and with rotations of 0°, +90° and −90° around the z axis of the camera (roll angle), using the maximum focal length of the camera (12 mm).
A full field calibration procedure was done by processing, with the two selected methods, the acquired image dataset using the same control point configuration and by fixing the height of the sensor in the adjustment. Table 2 reports the calibration results that show slight differences. In particular, the coordinates of the Principal Point and the Focal show differences of a few tenth of a millimeter between the OpenCV values and those obtained with Halcon (Table 2). In order to evaluate the distortions, both in the radial and tangential directions, the corrected pixel coordinates have been explicitly calculated and compared with the distorted one along a radial direction (Figure 5). The two curves show comparable trends and prompted selecting the OpenCV library, being the only open source library investigated, as the tool to be associated in future development to the NETVIS prototype.

3.2. Estimation of the External Orientation Parameters

The OpenCV library [26] has also been used for the module that estimates the External Orientation Parameters. The functions for the camera calibration use the so-called pinhole camera model where the scene view is formed by projecting 3D points into the image plane, using a perspective transformation (Equation (1)):
s m = A [ R | t ] M
where A is the camera model matrix that expresses the internal parameters of the camera (coordinates of the principal point PP and focal lengths); and [R|t] is the external parameter matrix operating the rotation–translation transformation to obtain the final coordinates.

4. The NETVIS Tool

The NETVIS (NEtwork of Thermal and Visible Sensors) tool we developed seeks to automatically pre-process high frequency data, acquired by a camera network, in order to extract geometrical and thermal parameters and track the evolution of a lava field. The tool is developed in Java, and comprises three modules: (i) Image Orientation Module; (ii) Image orthoRectification Module; and (iii) Change Detection Module (Figure 6 and Figure 7). The graphical and WebGIS (Geographic Information System) interfaces of the tool are developed using the Python code.
Firstly, all the images to be processed are uploaded into the tool and the camera name is selected from the list of sensors belonging to the network. The three modules can then be applied.

4.1. The Image Orientation Module (IOMod)

The Image Orientation Module (IOMod, Figure 7a) implements the procedure described in Section 3.2 to obtain the External Orientation Parameters (EOP). It can follow two different procedures depending on the possibility of carrying out a set-up step before each new camera installation for estimating the Internal Orientation Parameter (IOP) as described in Section 3.1. In this case, the estimated IOP are adopted as input data for the IOMod. Alternatively, nominal camera parameters are included in the procedure which is performed on the camera already mounted and operational. The procedure can be repeated in the case the camera mounting is modified provided that a sufficient number of Ground Control Points (GCPs), having known ERF coordinates, are deployed on the ground. To improve the performance of the orientation module, the GCP distribution should be uniform and they must be extended to the edges of the captured areas. The GCP positions are automatically detected in a reference image.

4.2. The Image orthoRectification Module (IRMod)

The Image orthoRectification Module (IRMod, Figure 7b) requires an image dataset, an updated DEM and external orientation parameters (obtained, in the ERF, from the IOMod) as inputs. The process is preceded by a comparison between each new image and the reference one to transfer the GCPs, on the base of their pixel coordinates, thus allowing the geometrical transformation of each pixel from the image coordinates to ground ones. A procedure to automatically identify the targets was tested on the image collected at the calibration test field but it is not fully implemented in the prototype thus, at the present, the GCPs are manually measured in the reference image. Z elevation values are extracted using the DEM to correct each pixel before applying the transformation to the external reference system (ERF) using the EOP. The module provides an orthophoto georeferenced in the ERF (GEOTIFF format) at a user selected spatial resolution and coverage.
The final accuracy of the orthophoto is influenced by different factors, such as the quality and resolution of the digital photos, the quality of internal and external image orientation and the DEM accuracy.

4.3. The Change Detection Module (CDMod)

The module dedicated to change detection analysis (Figure 7c) is designed to perform a semi-automated procedure on a multi-temporal image dataset aimed at mapping the eruptive products. The overall output of the process is a map of change evaluated between successive epochs.
The procedure is based on the regularized Iteratively Reweighted Multivariate Alteration Detection method (IR-MAD) to perform a canonical correlation analysis between two overlapping images taken at different epochs.
Canonical Correlations Analysis (CCA) investigates the relationship between two groups of variables and constructs new orthogonal variables from the original ones. It finds two sets of linear combinations of the original variables, one for each group. The first two linear combinations are the ones with the largest correlation and are called the first canonical variates. The second two linear combinations are the ones with the largest correlation subject to the condition that they are orthogonal to the first canonical and are called the second canonical variates. Because corresponding pairs of canonical variates are linear combinations of the original variables, ordered by correlation between pairs, a change detection scheme can be based on differences between these pairs of variates. These orthogonal differences contain maximum information on joint change in all variables (spectral bands) and are termed the MAD (Multivariate Alteration Detection) variates.
The MAD transformation of multispectral bitemporal images is an extension of traditional canonical correlations analysis [29]. The MAD transformation is the difference of the canonical variates of two sets of multivariate data in reverse order. Since all data are weighted equally, the method cannot detect changes isolated in one or a few images. The IR-MAD method is an extension of MAD that performs a series of iterations increasing focus on difficult observation, whose change status over time is uncertain. This is done by calculating a measure of no change based on the sum of squared standardized MAD variates in each iteration. This measure is used as a weighting function in the next iteration: large weights are assigned to observations that show little change, i.e., for which the sum of squared, standardized MAD variates is small, and small weights being assigned to observations for which the sum is large. This, in a series of iterations, is used to place increasing weight on the no-change observations to obtain an increasingly better background of no-change against which to detect changes [30,31]. The output of the IR-MAD method can be interpreted as a change probability index map. The detection of changed areas is performed by applying a configurable threshold on the change probability index in order to distinguish between areas of change and areas of no change.

5. Testing the NETVIS Tool

The procedure implemented on the NETVIS tool was validated on a purpose made test field at La Montagnola site, and on a simulated scenario obtained using a 3D modeling tool.

5.1. La Montagnola Test Field

The Montagnola site (EMO), located on Mt Etna at about 2600 m a.s.l., includes a VIVOTEK IP8172 visible camera (installed on July 2013) and a FLIR A320 thermal camera that are currently oriented to detect plumes emitted by the summit craters.
The Montagnola test field was set up on 10 July 2014 and enabled estimating the external orientation parameters of the VIVOTEK camera and checking the whole NETVIS tool. A series of measurable artificial ground control points (GCPs) were positioned in an area next to the site (less than 300 m away) and their XYZ coordinates were measured in a local reference frame using a Leica TM50 total station obtaining millimeter accuracy. In addition, a RTK GPS survey was made to georeference the GCPs in the UTM-WGS84 reference system (Figure 8a) in order to use their coordinates as known values for estimating the external orientation parameters of the VIVOTEK camera. During the test, the field of view of the camera was modified by rotating and tilting the sensor towards the area were the GCPs were positioned, to acquire a series of images (Figure 8b). In fact, this area is not visible from the operational position of the VIVOTEK IP8172 camera looking towards the summit craters.
The acquired images, which contain nine targets, have been processed to test the performance of the IOMod, to obtain an estimate of the camera position in the ERF, namely its external orientation parameters and to analyse the effect of the correction based on calibration parameters evaluated during the previous test performed on the INGV facility edifice in Nicolosi (CT). Figure 9a shows the orthophoto extracted using the IRMod and the results of the validation based on the residual observed between the target positions as measured on the ground and on the extracted orthophoto, which ranges between about 2 and 10 m (Figure 9b,c).

5.2. Test on the Simulated Scenario

Since Etna_NETVIS cameras are mainly oriented to detect the plumes emitted by the summit craters, it is quite difficult, with their actual fields of view, to identify natural features or establish artificial targets for use them as GCPs. For this reason, a test based on simulated view obtained using a 3D modeling tool and considering a camera with the nominal parameters of the VIVOTEK IP8172 positioned near the EMO site was carried out. Nine markers (3D virtual targets, having known coordinates in the ERF) were distributed evenly in the simulated dataset and represented as black and white 3 m × 3 m plates (Figure 10). The camera model, as well as the position and attitude in the ERF of the simulated dataset, have been extracted by an indirect approach based on the availability of an updated DEM and not on a network of GCPs. Virtual targets are also used during image processing through the NETVIS tool.
The simulated view has been processed using the NETVIS tool to extract the orthophoto shown in Figure 11, on which the nine targets are indicated with red crosses. The difference between the two sets of GCPs coordinates was also evaluated showing that the accuracy of the obtained orthophoto is a few meters, even at a large distance from the sensor (about 1 km) where the pixel size is about 2 m.

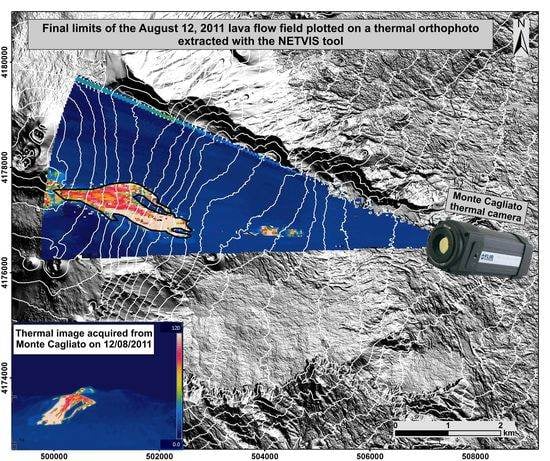
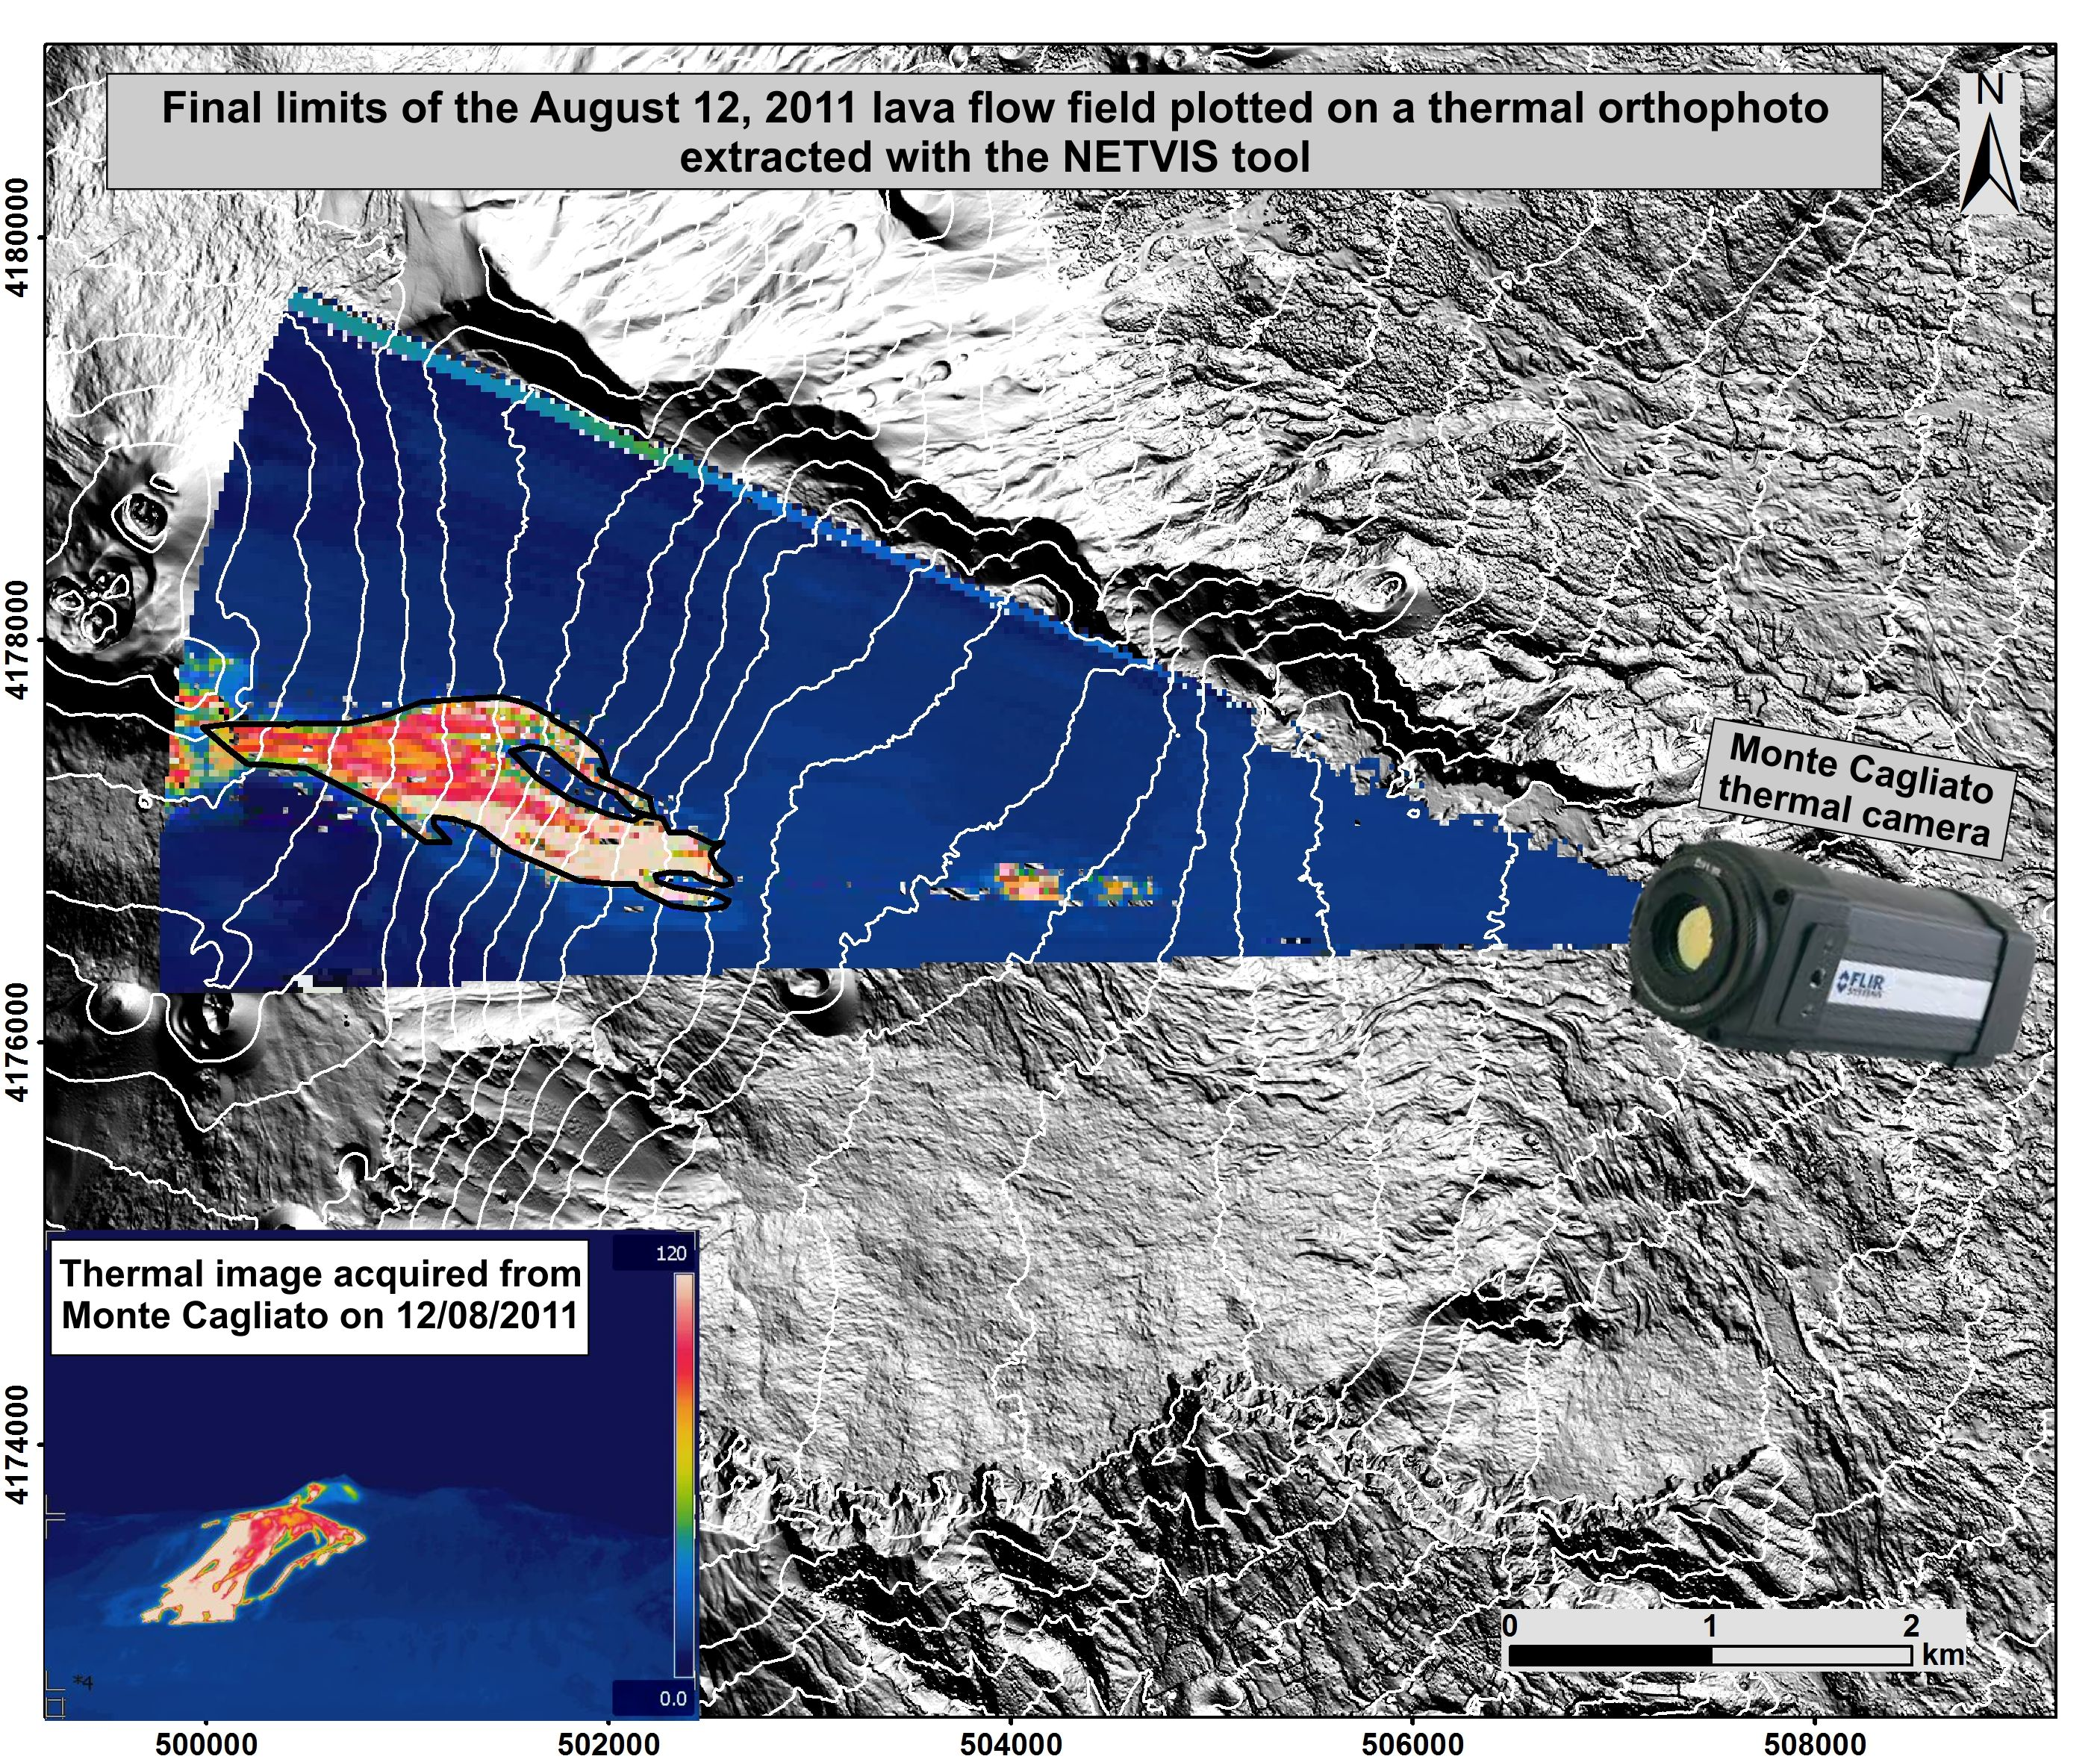
6. NETVIS Processing of Images Acquired During Effusive Activity

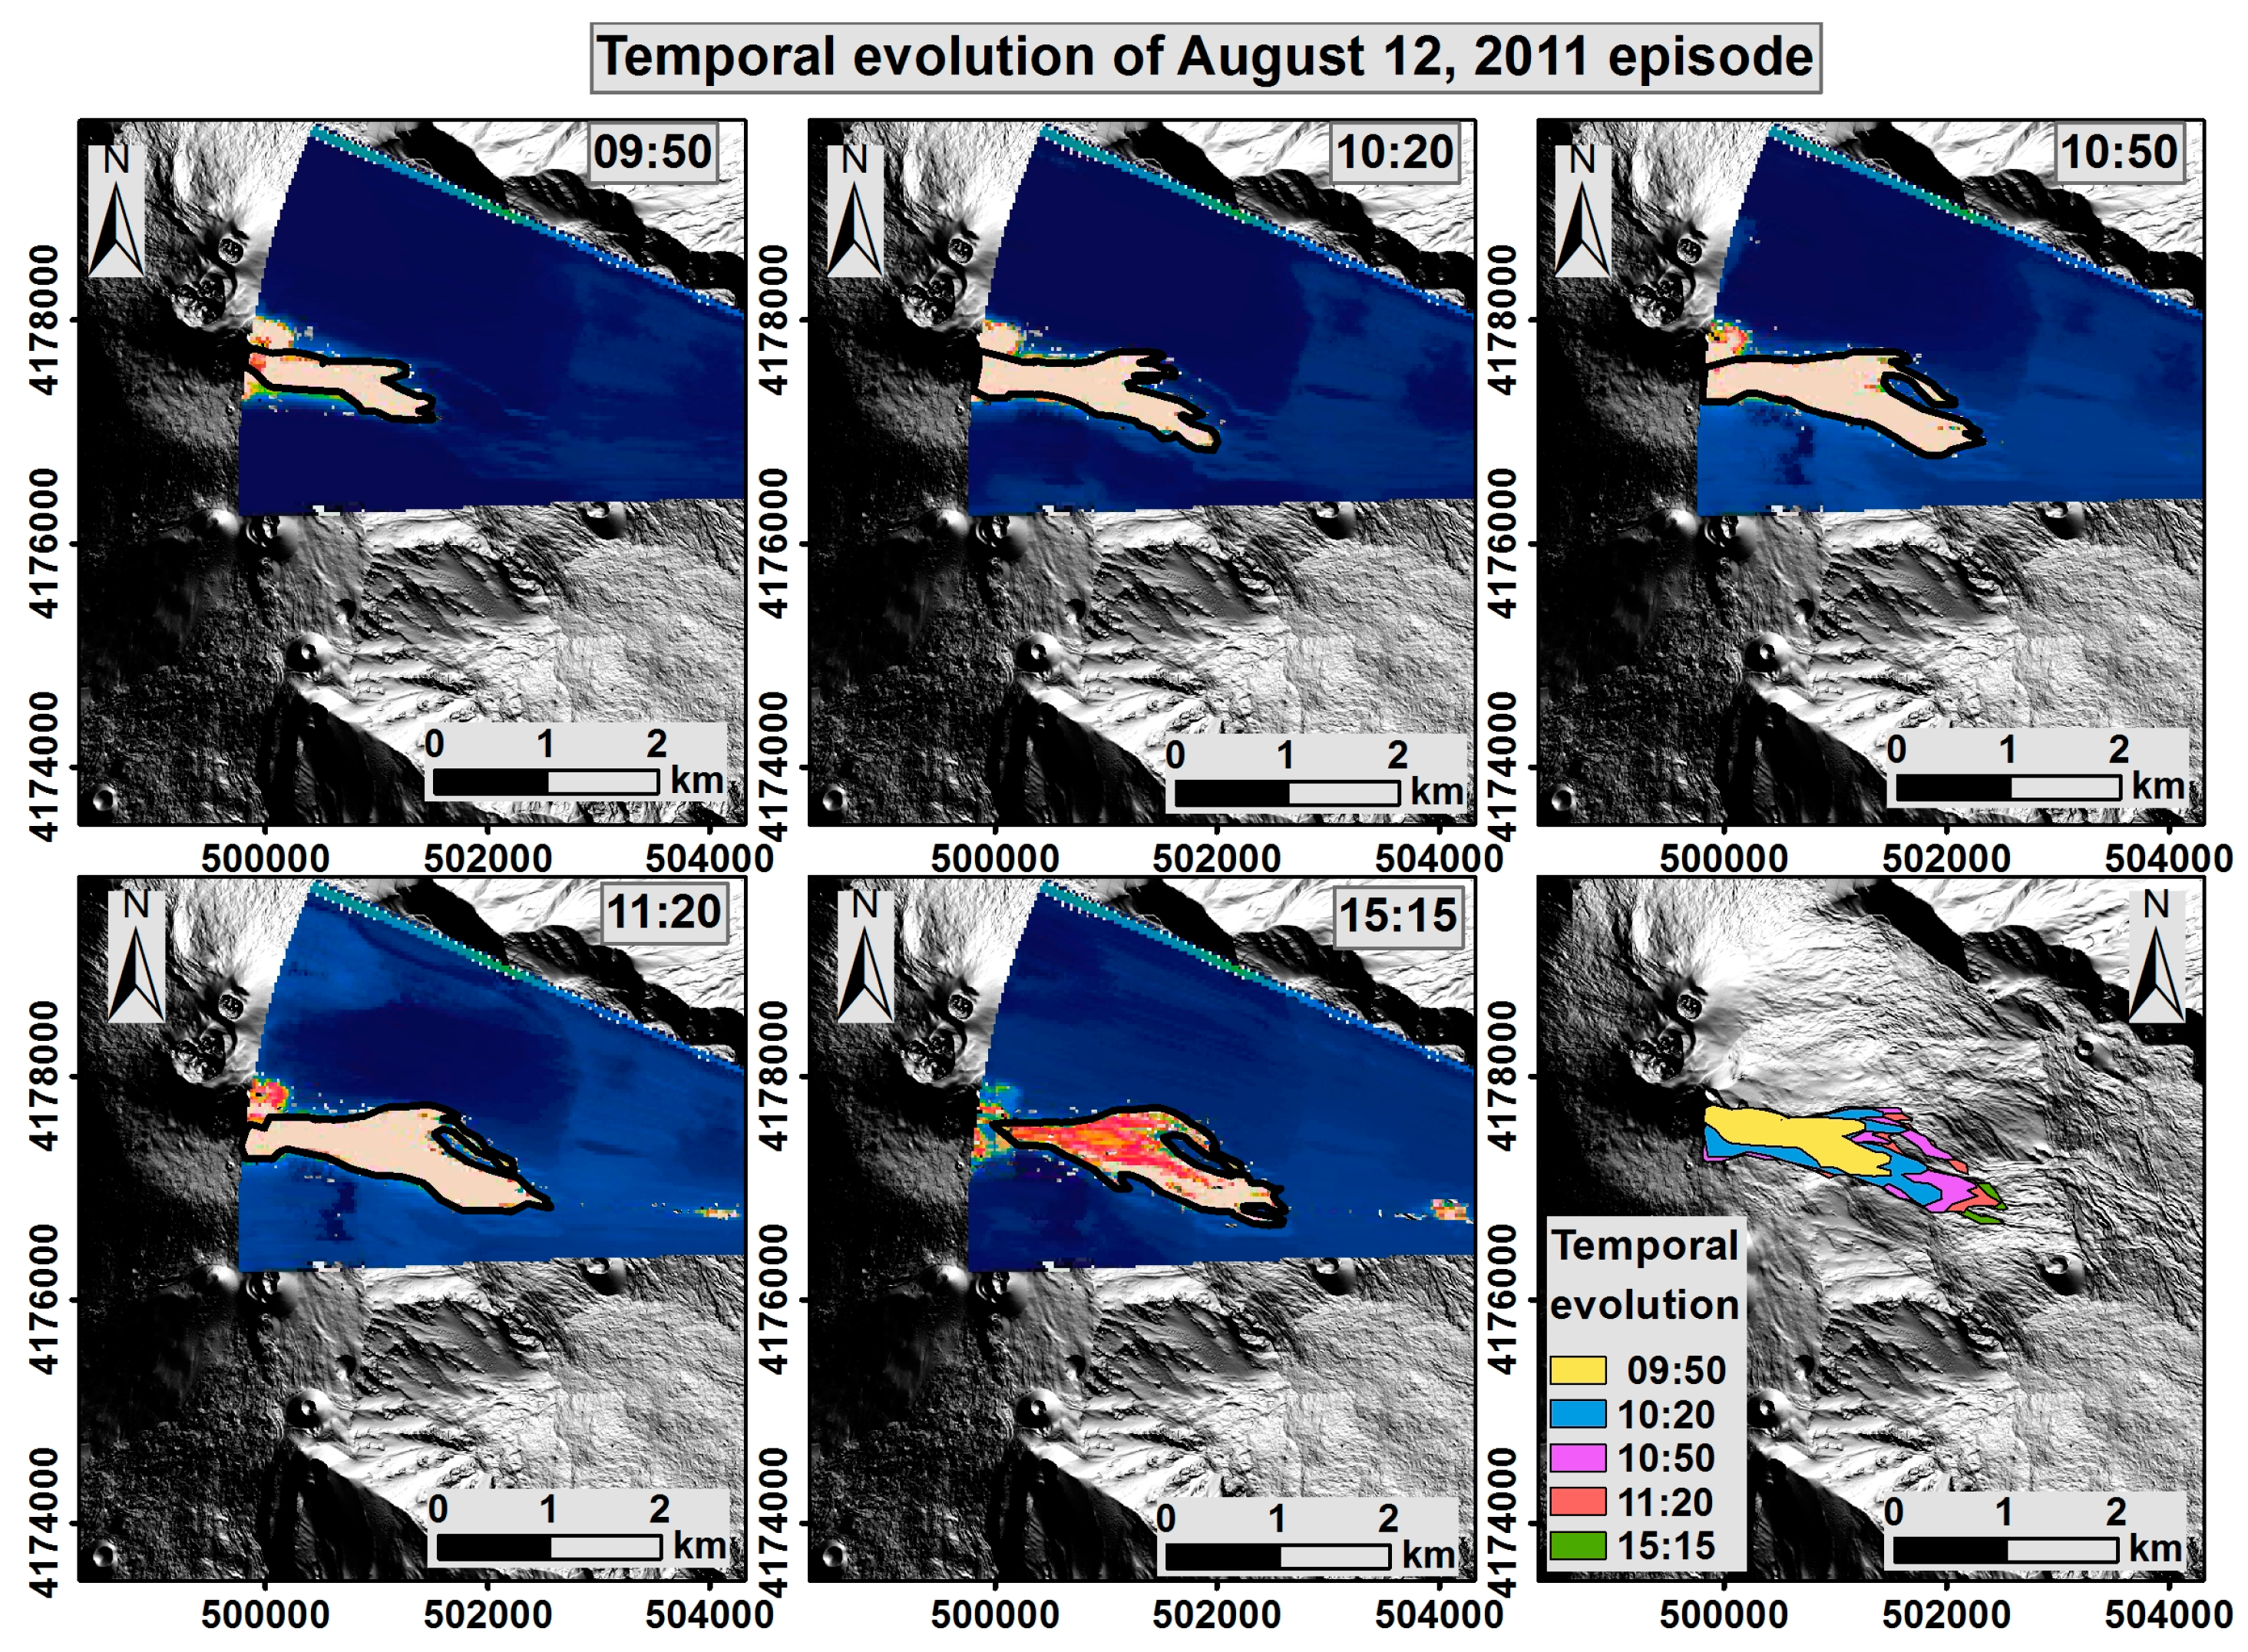
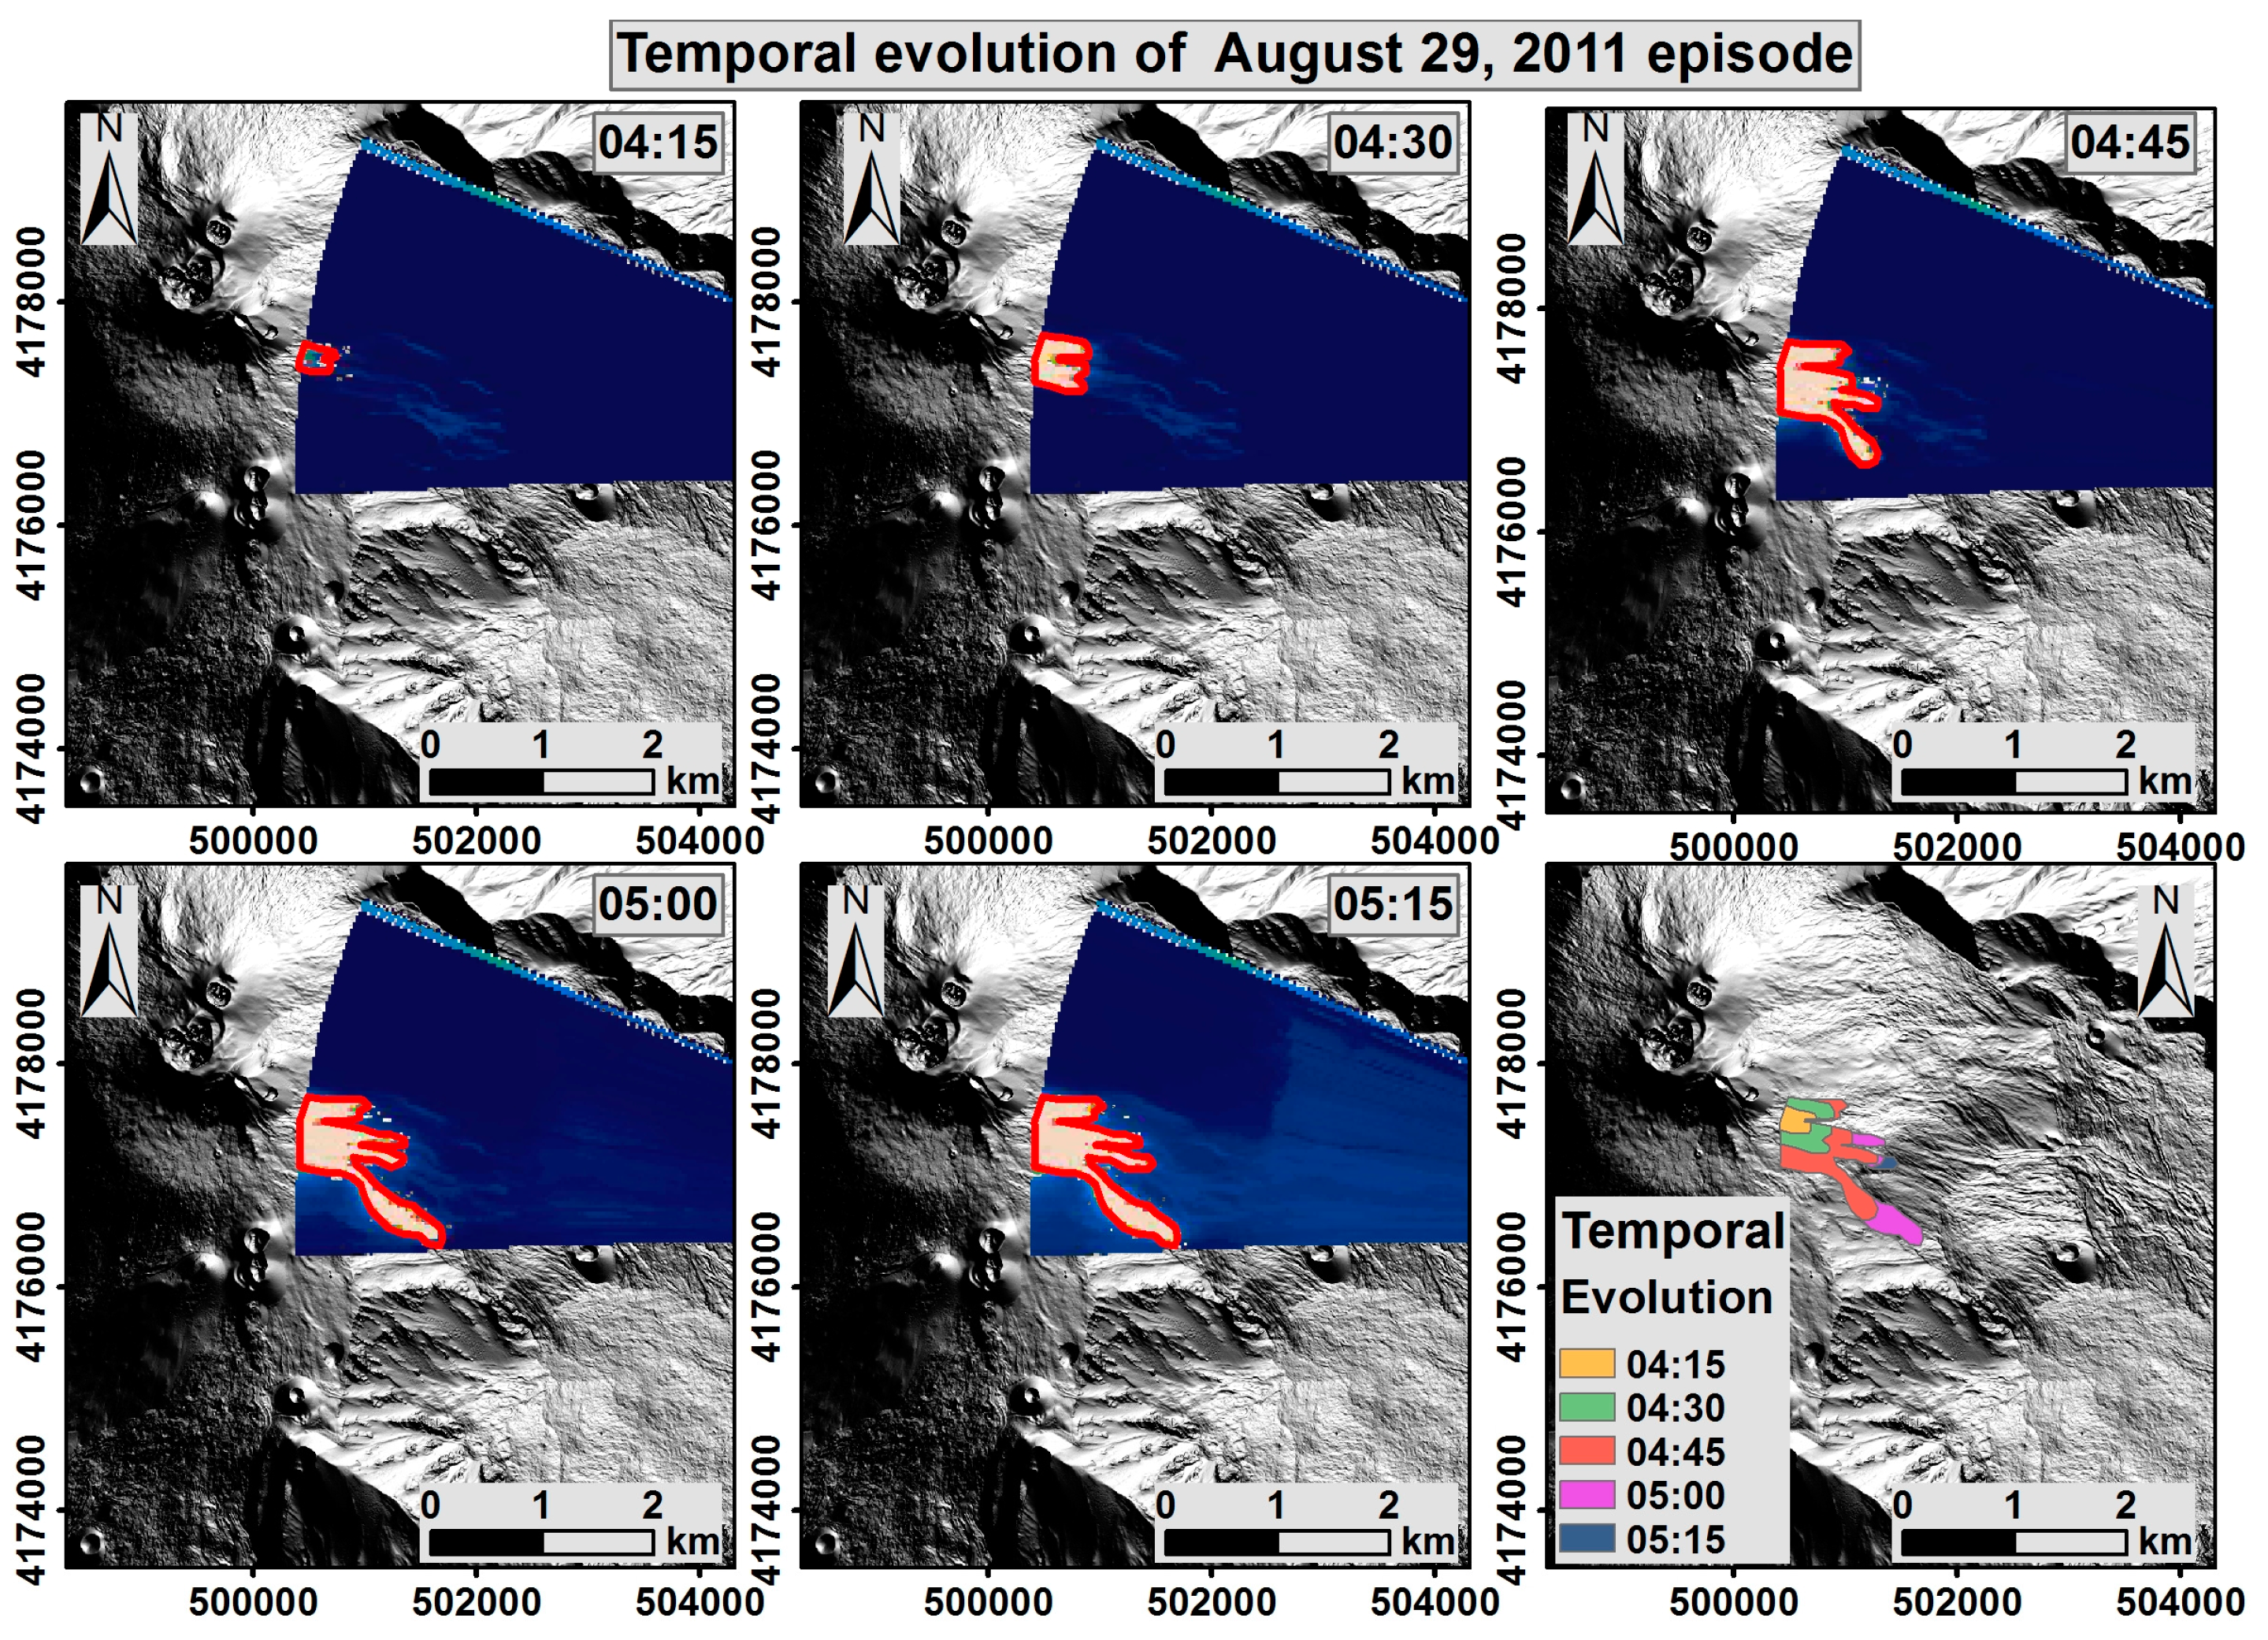
The performance of the NETVIS tool, in operational phases, was evaluated by processing images acquired by the FLIR A320 thermal camera installed at Monte Cagliato site (EMCT in 
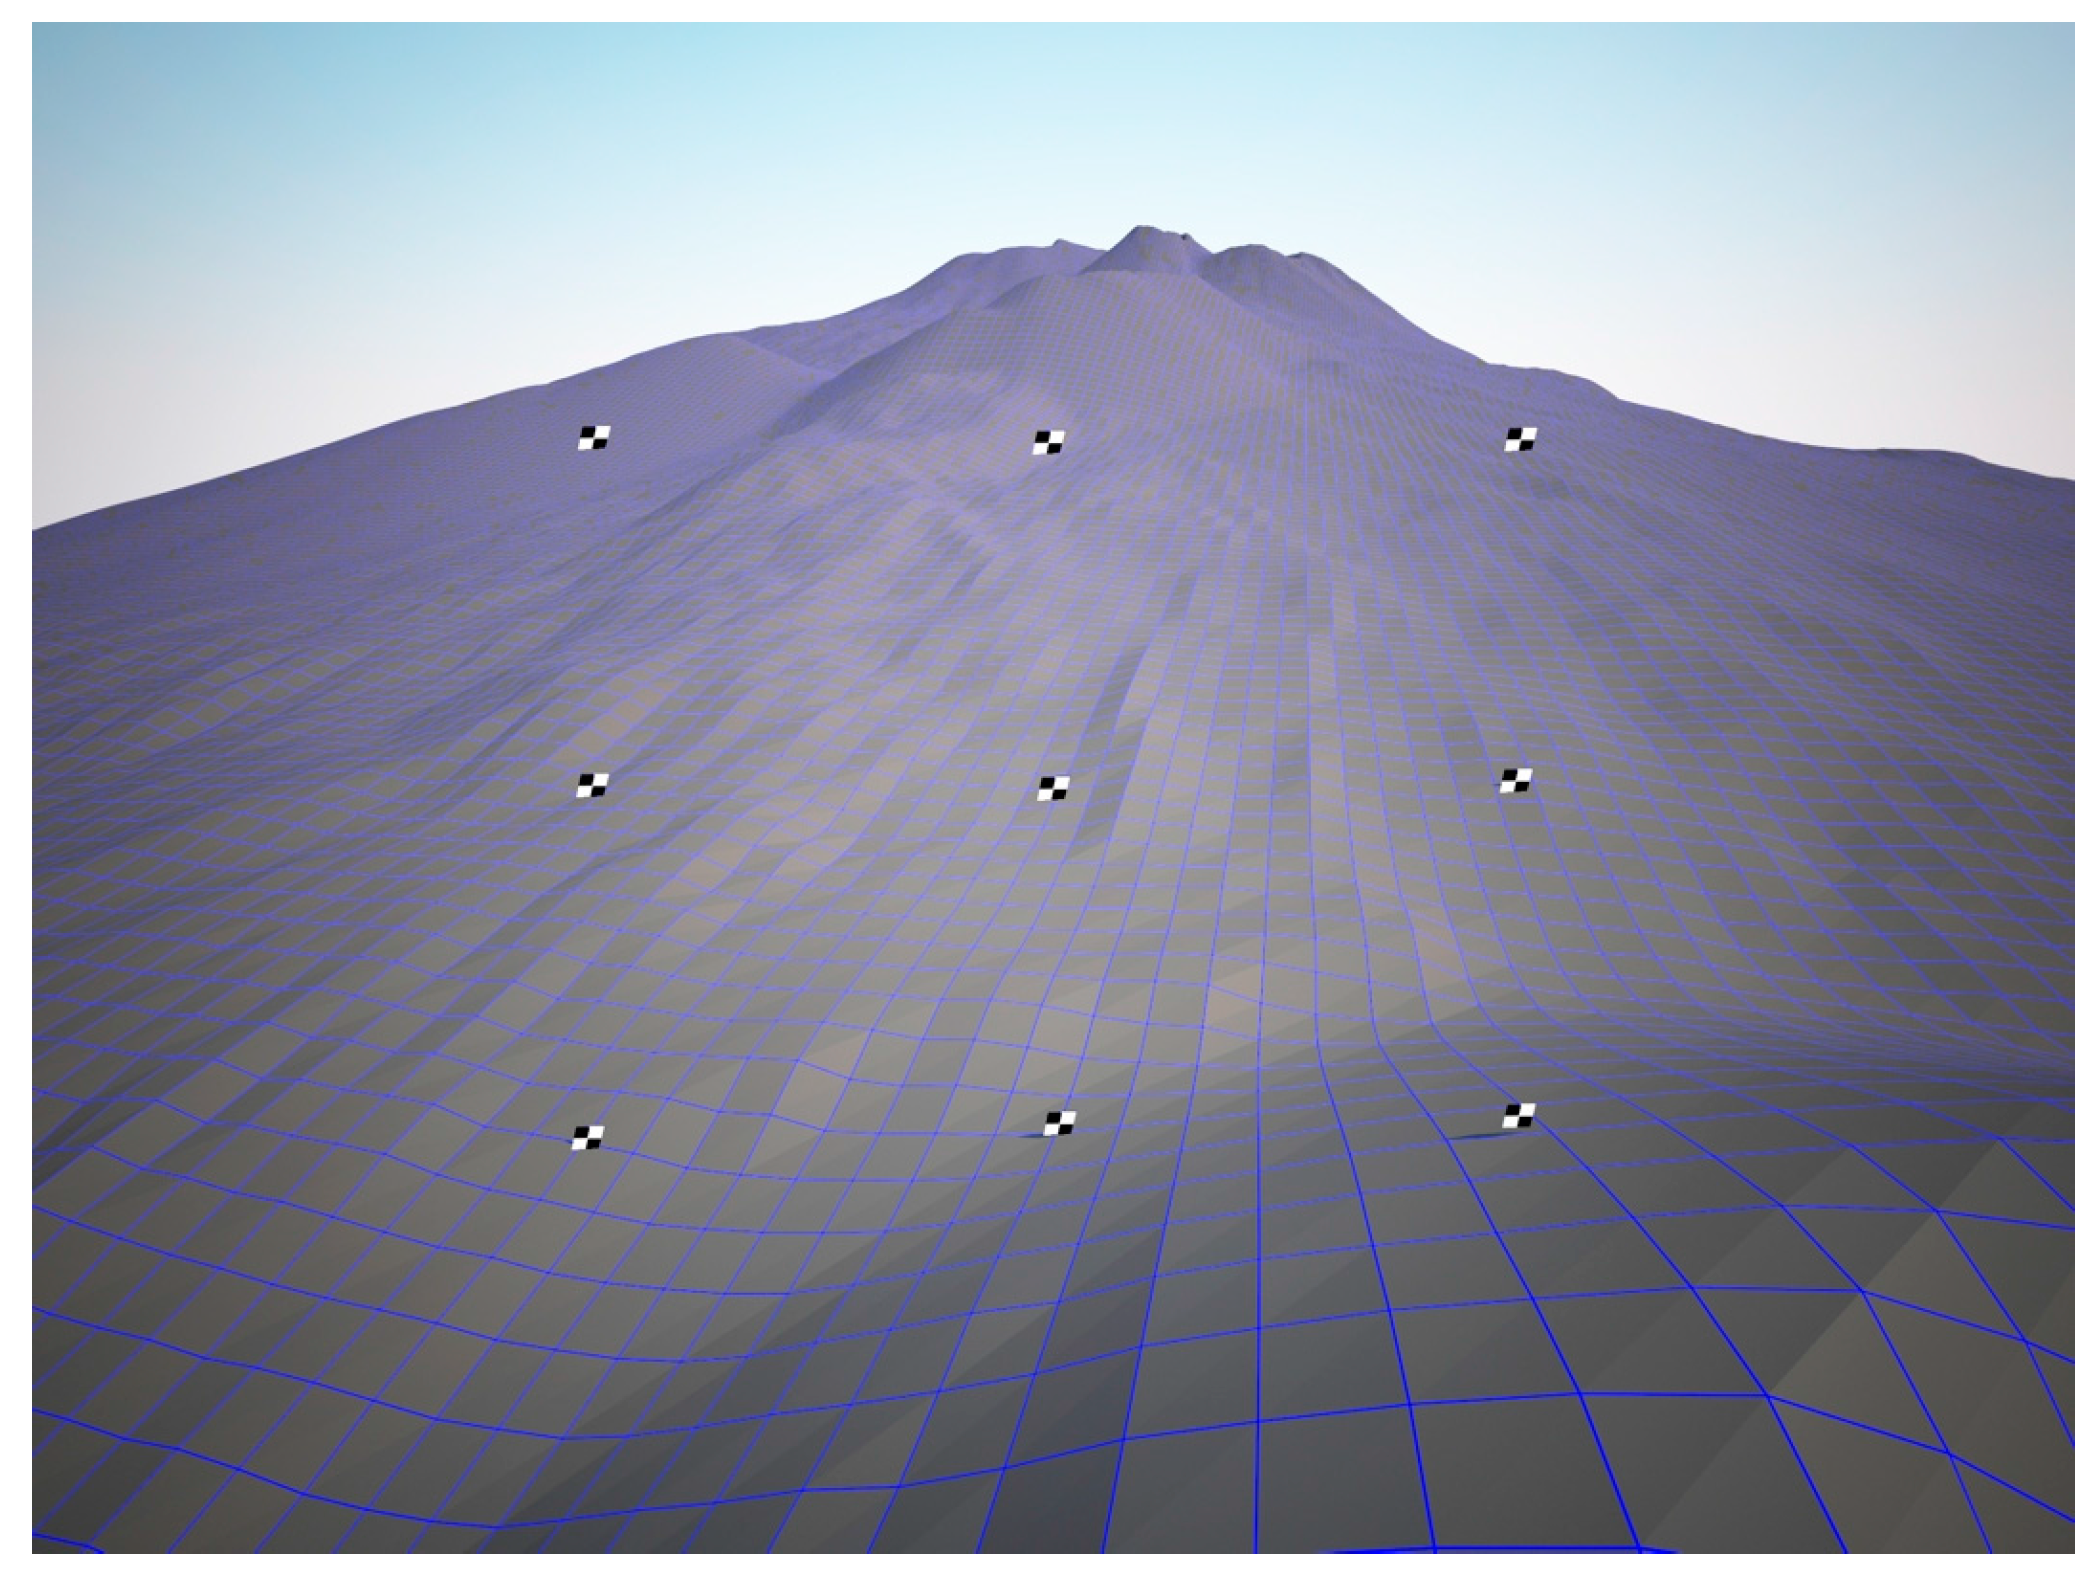
Figure 1) during two paroxysmal episodes of the New South East Crater on 12 August 2011 (07:50–15:15) and on 29 August 2011 (03:15–05:15). The two image datasets have been processed using nine virtual targets similar to the above-described simulated scenario, producing two time series of orthophotos (Figure 12 and 
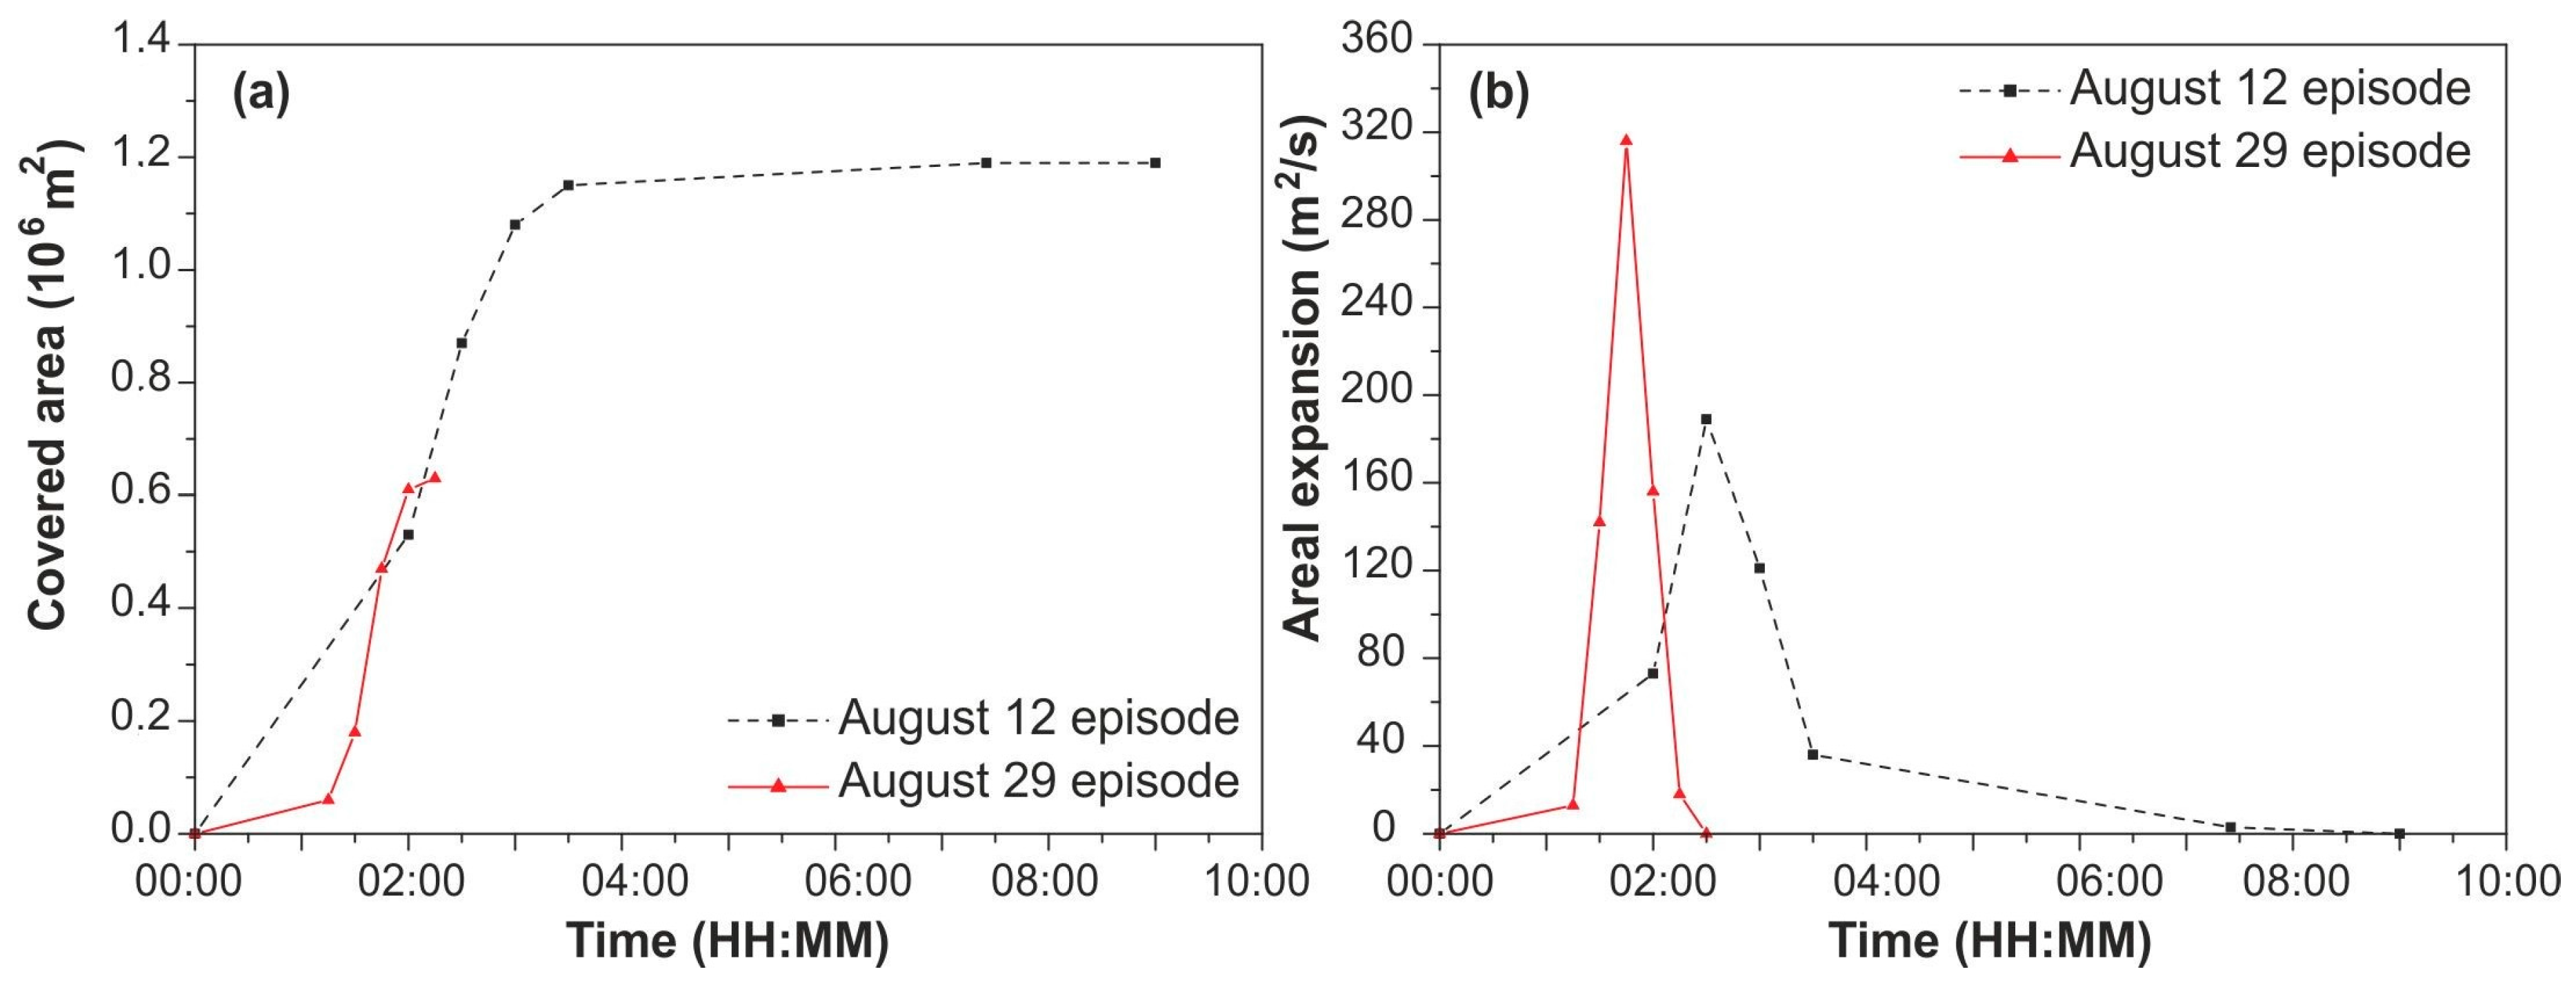
Figure 13). The temporal evolutions of the two lava flow fields, emplaced in Valle del Bove, were extracted by digitizing the flow limits on the orthophotos allowing estimating the covered areas and the corresponding rates of expansion (Figure 14). The final area and length of the flow fields resulted 1.10 × 10⁶ m2 and 2.75 km, for the 12 August episode, and 0.63 × 10⁶ m2 and 1.9 km for the 29 August episode. The two flows showed quite different behavior: on 12 August it rapidly expanded between 08:00 and 10:30 almost reaching its maximum area, while on 29 August it increased very slowly between 03:00 and 04:15 abruptly reaching its maximum area at about 05:00.
Our estimates for the final areas and lengths are in good agreement with those obtained integrating ground measurements and photo interpretation [32] that is 1.14 × 10⁶ m2 and 2.9 km for the 12 August episode and 0.65 × 10⁶ m2 and 2.7 km for the 29 August one. The discrepancy observed for the 29 August final length could be related to the fact that the flow overpassed the border of EMCT images. A further comparison was carried out against the results obtained for the 12 August flow by combining satellite images and georeferenced thermal maps extracted from a series of EMCT thermal images [25]. This approach allowed measuring the active flow area independently from the flow expansion, thus furnishing useful information on the overlapping and cooling processes. Conversely, our method, which evaluates the entire covered area, is more focused to estimate the rate of advancement/expansion of the flow, in support of hazard evaluation and mitigation. Consequently, the comparison between the two methods is satisfactory until the entire covered area increases. In particular, the total flow area evaluated in [25] is equal to 1.3 × 10⁶ m2, whereas our estimate (1.1 × 10⁶ m2) is lower because a portion of the flow front was not visible in the EMCT thermal images due to being obscured behind a local horizon.
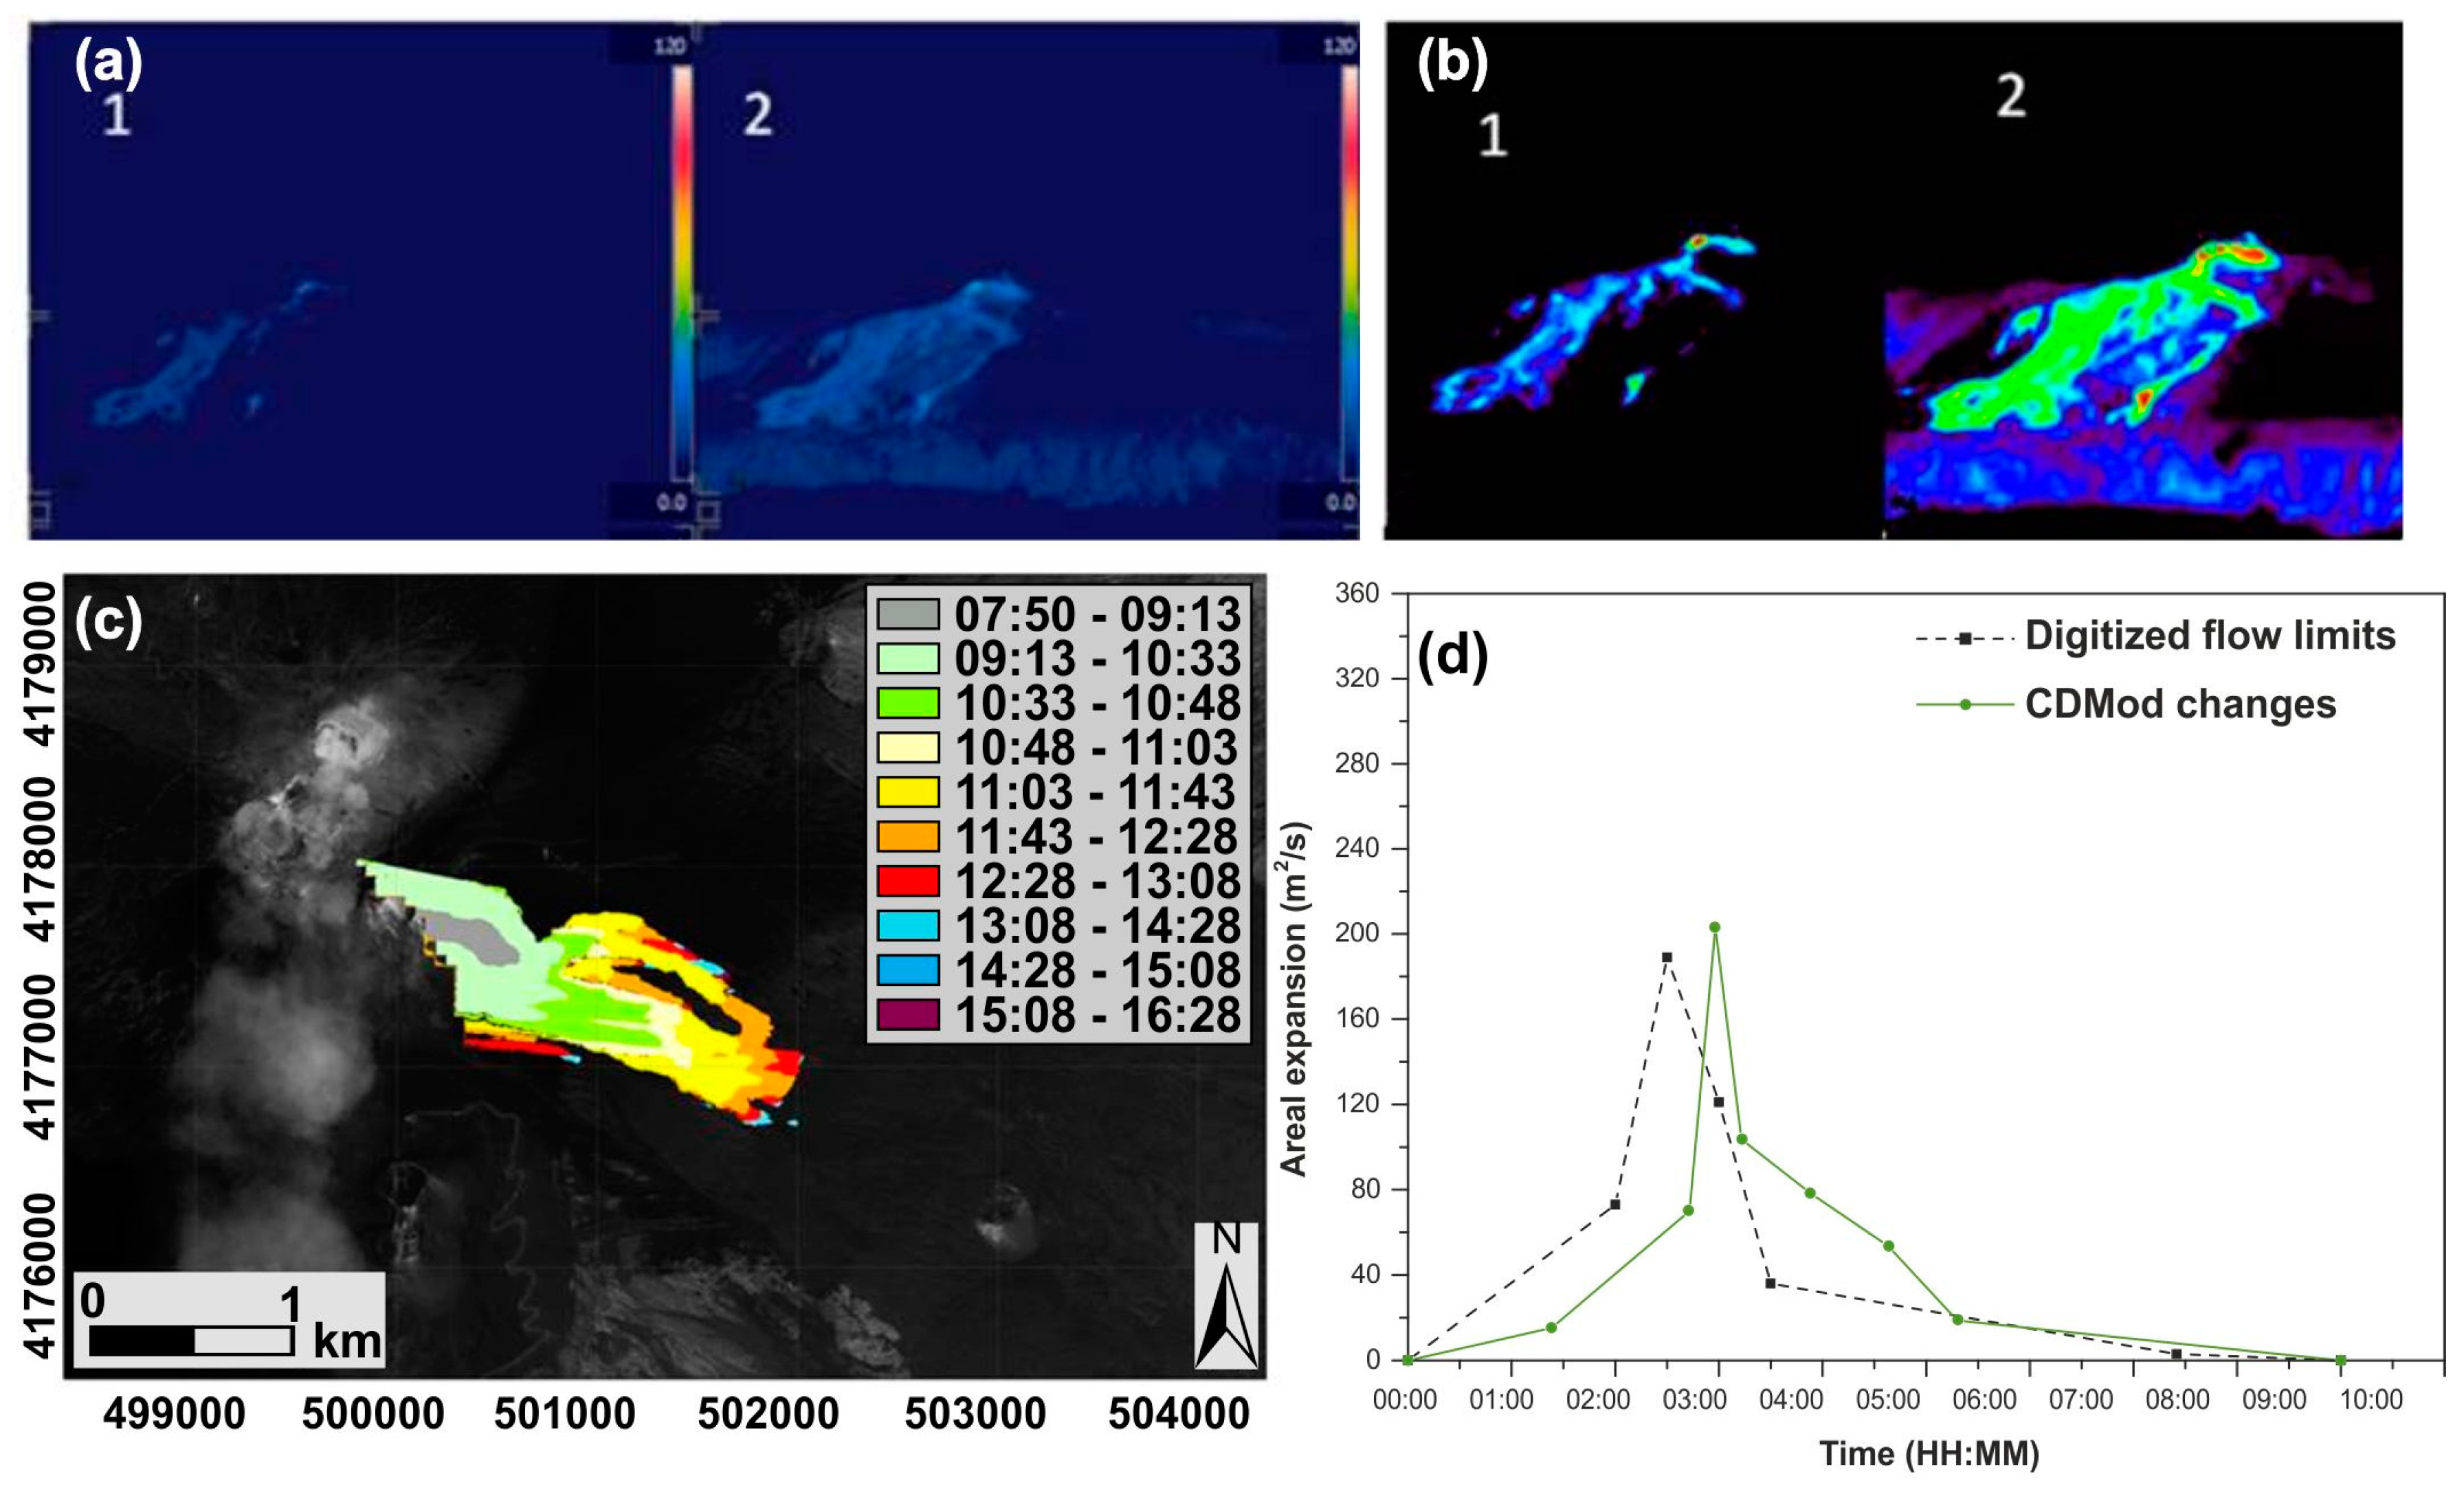
The sequence of thermal images acquired from Monte Cagliato thermal camera during Etna eruptive event of 12 August 2011 also allowed testing the Change Detection Module (Figure 15). Despite the fact that thermal images would require a radiometric calibration before performing a multi-temporal analysis, the CDMod results are adequate to extract, from the raw images, a clear signature of the temporal evolution of the lava flow field (Figure 15b) that represents the starting point for a subsequent, more accurate, feature extraction analysis. The application of the CDMod to pairs of subsequent thermal images allowed to automatically extract the relative changes of the area covered by the lava field and to map its temporal evolution (Figure 15c) from which the trend of the areal expansion has been estimated (Figure 15d). Figure 15d shows a good agreement among the areal expansion trends evaluated from the manually digitized flow field limits (Figure 12) and from the changes detected by the CDMod. The temporal shift between the two peaks is due to the use of different time intervals for the two available datasets.

7. Discussion

A dedicated tool for processing, in quasi real-time, multi-temporal image datasets acquired by permanent video surveillance camera networks was implemented. As primary outputs the tool provides a series of orthorectified and georeferenced images that can be used for implementing a multi-temporal analysis aimed at mapping the evolution of lava flow fields and extracting quantitative parameters.
The NETVIS tool has been specifically designed to process images acquired from a permanent camera network, it satisfies the needs for prompt map extraction using systematically acquired data and it does not require a skilled operator in the field. The extracted map can be rapidly transferred to a control room, such that operating at the Osservatorio Etneo.
The use of the NETVIS tool to process thermal images acquired during an eruptive episode can greatly increases the temporal resolution (up to few tenth of minutes) of the extracted lava flow maps usually obtained from pictures taken during aerial and helicopter surveys every one or more days [2].
The method requires the use of an updated DEM which, during and after an eruption, can be obtained through satellite or standard aerial surveys.
The complex morphology of the volcano and the possible presence of morphological obstacles can reduce the field of view of ground cameras; hence a portion of the monitored lava flow field cannot be shown in the analyzed images. This, for example, happened for the Monte Cagliato thermal images in the two analyzed events where a local horizon of the Valle del Bove had partially hidden the lava flows. This drawback can be overcome by using cameras with different fields of view on the observed eruptive event, which can be obtained by deploying mobile stations in the most suitable positions to observe the missing or hidden part. The analyses of additional site locations and sensor specifics, done in this work for an ideal camera network, can help to rapidly define the optimal locations for specific eruptive scenarios.
A disadvantage of the presented analysis is the impossibility of carrying out it in the case of prolonged bad weather conditions or in presence of the volcanic plume that hinders visibility of the eruptive scenario. Nevertheless, this is a problem common to all the sensors used for photogrammetric analysis from ground, aerial or satellite surveys. The use of fixed cameras, in continuous acquisition, enables having useful data captured in the case of short breaks in bad weather conditions, thus providing the imagery of the on-going event. This is not possible when using different sensors such as satellites, that have a pre-fixed revisiting time, or portable cameras temporarily deployed on the ground, which require a previous location planning and quite long installation times.
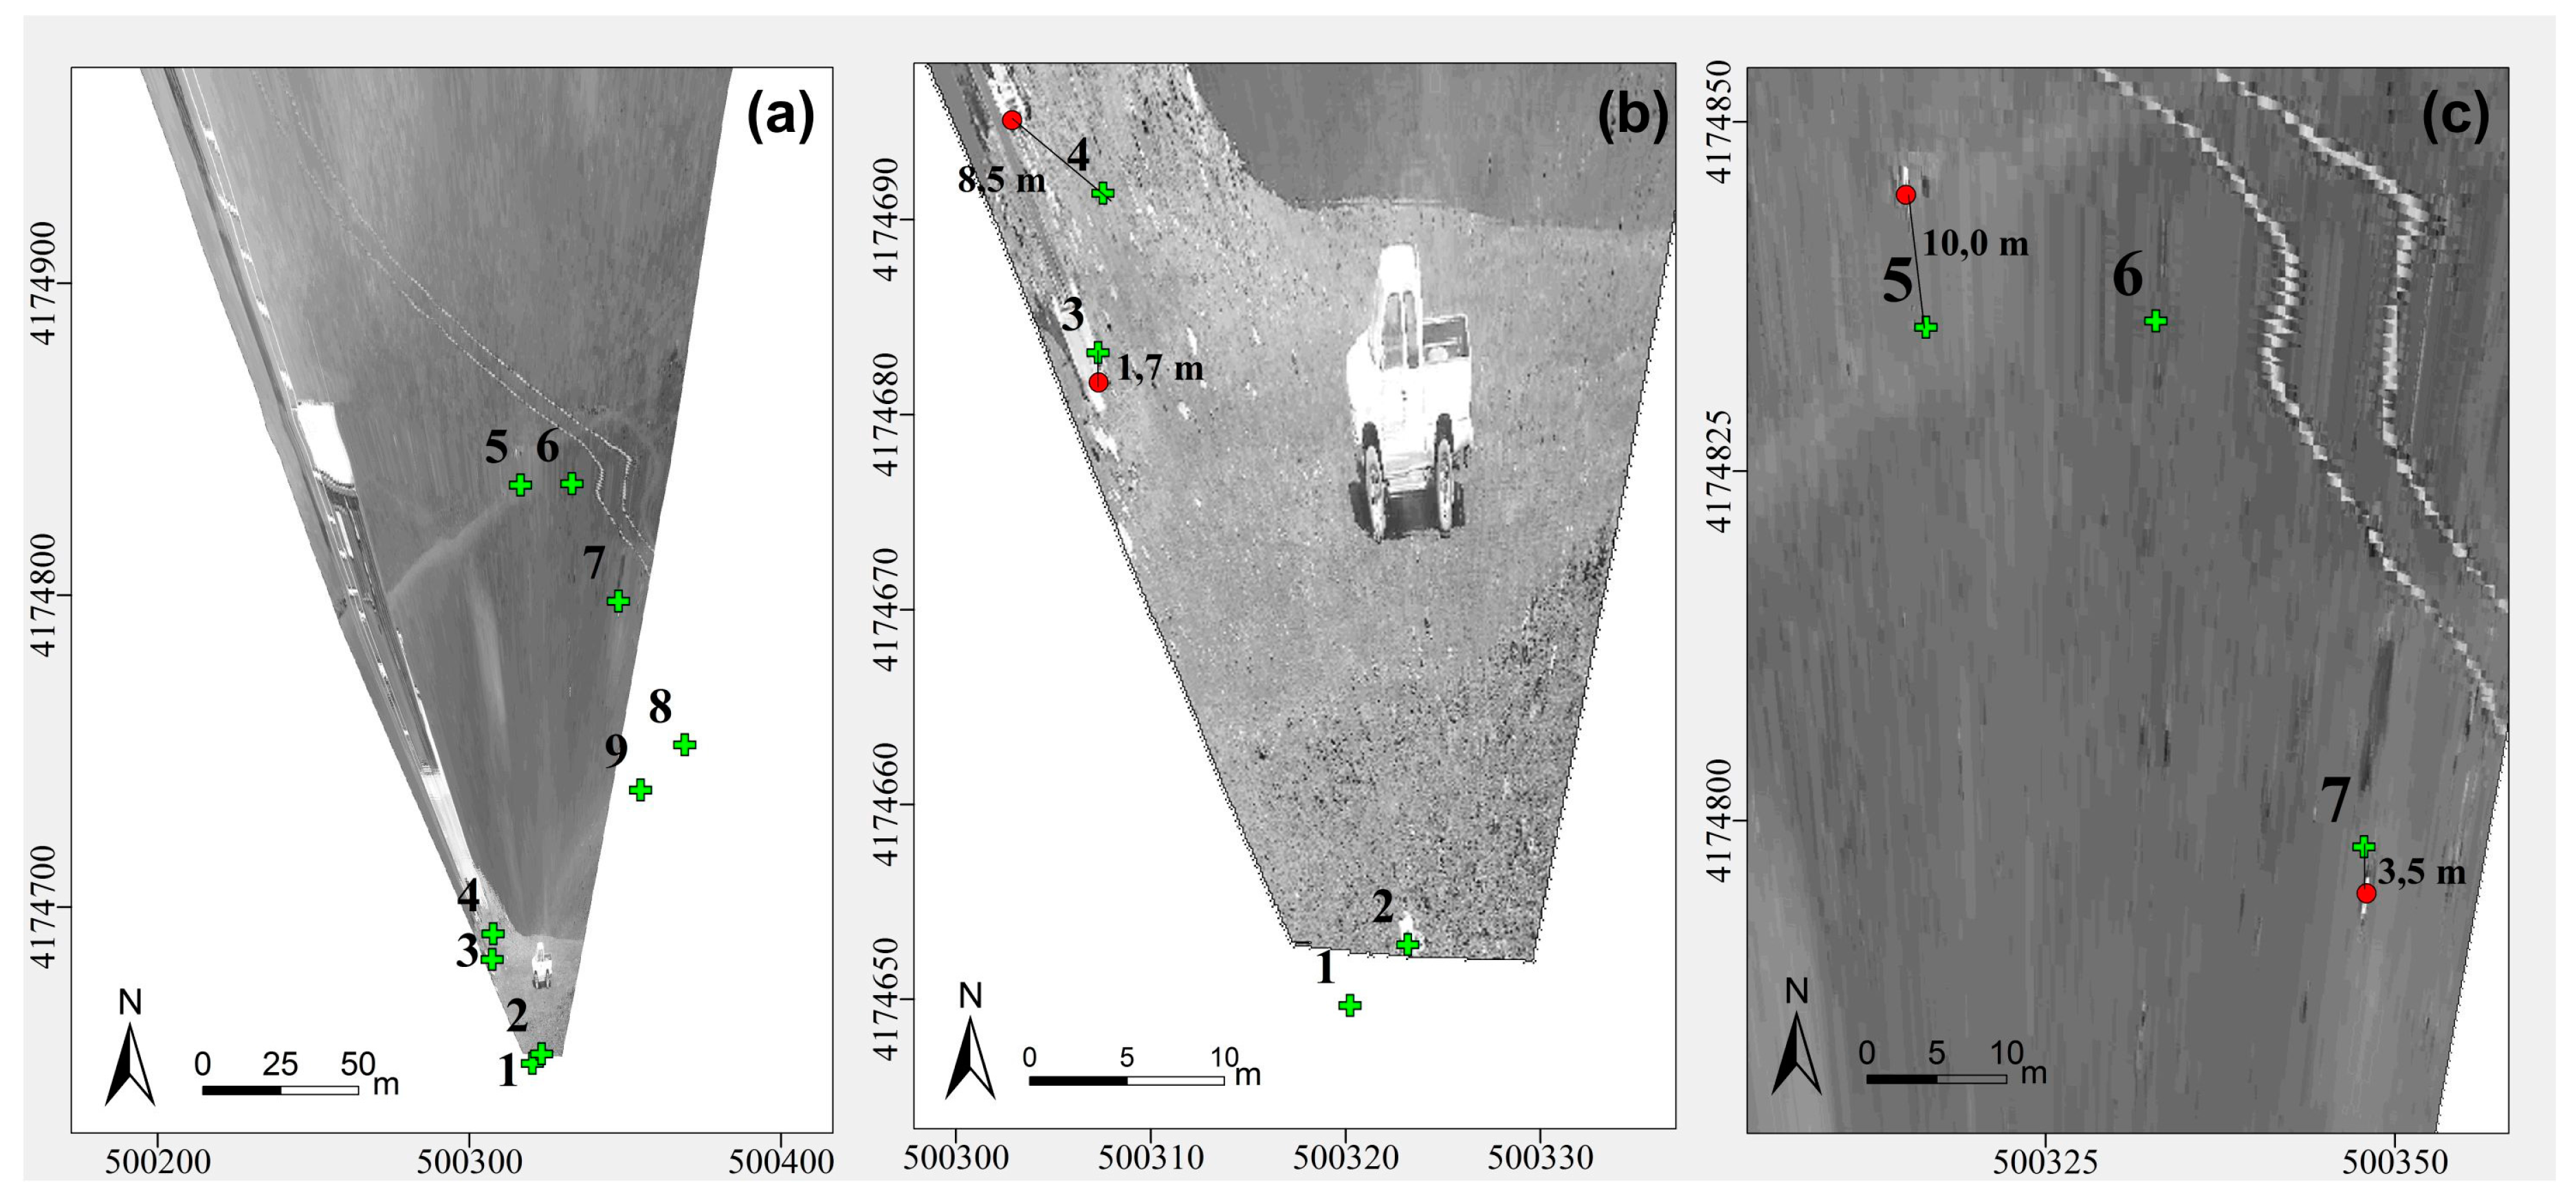
The tool was initially evaluated on a test field around La Montagnola camera (EMO) and then applied for an off-line processing of thermal image datasets acquired by the Monte Cagliato camera (EMCT) during two eruptive episodes in 2011. The tests provided suitable results on the temporal and spatial evolution of the lava flows. The short time required for the processing makes the procedure adequate to rapidly assess the evolution of lava flows, especially in the case of recurrent activity such as that observed at Mt. Etna between 2011 and 2015. Moreover, the La Montagnola test allowed assessing an expected resolution of a few meters for the extracted orthophoto. Finally, the application of the tool to the two thermal image datasets from Monte Cagliato allowed testing the entire procedure. The orthophotos extracted at the end of the two eruptive events allowed measuring the final areas and lengths that resulted 1.10 × 10⁶ m2 and 2.75 km, for the 12 August episode, and 0.63 × 10⁶ m2 and 1.9 km for the 29 August episode. The 12 August eruptive episode enabled to test the entire tool, including also the Change Detection Module. In fact, the temporal evolution of the corresponding lava flow has been evaluated by manually digitizing the flow field limits on the orthophotos extracted with the Image Orthorectification Module and by applying the Change Detection Module and the two areal expansion trends resulted in agreement.
The future implementation of the tool is to make it fully automated and to integrate it in the control room of the Osservatorio Etneo so that it can be automatically run once a new image is acquired or at pre-defined time intervals set from the control room operators. In this way, the images acquired by the thermal and visible cameras can be transformed in orthophotos. This would enable volcano monitoring to use the acquired images not only to observe and describe the ongoing phenomenon but also to extract quantitative information, such as the position and elevation of the most advanced flow front and its spreading, and to carry out a quasi-real-time mapping. Such data are necessary during an emergency phase when it is mandatory to provide quantitative information to the civil protection to support hazard evaluation and eventual mitigation actions.

8. Conclusions

In order to improve the use of the permanent ground NEtwork of Thermal and VIsible Sensors located on Mt. Etna (Etna_NETVIS), the first video-monitoring network installed on an active volcano, a photogrammetric approach for controlling syn-eruptive processes was developed. Previous studies on applications to volcanic eruptions, landslides and glaciers often adopted non-photogrammetric procedures and rely on the estimation of shift and rotation correction to obtain georeferenced images. The tool presented here comprises three modules able to orthorectify a multi-temporal image dataset acquired from a permanent camera surveillance network.
Experiments conducted on an test field to validate the develop approach provided orthophoto maps having at an accuracy of less than 10 m while on a real volcanic scenario permitted to quantify the temporal evolution of two lava flows generated by two short-lived eruptive episodes.
The implemented processing approach enhances the capability of a surveillance camera network, such as that operational at Mt. Etna, toward a quasi-real-time monitoring of lava flows rapidly expanding downhill. The frequent availability of georeferenced maps allows quantifying the expansion of the area inundated by the lava as well as to estimate the position and elevation of the most advanced flow front, thus contributing to a rapid assessment of hazardous scenarios for the zones where the lava flows can potentially propagate.

Acknowledgments

This study was funded by the MED-SUV project that has received funding from the European Union Seventh Framework Programme (FP7) under Grant agreement n° 308665.

Author Contributions

Mauro Coltelli, Maria Marsella and Carla Nardinocchi defined the tool configuration and validation; Peppe Junior Valentino D’Aranno, Emilio Pecora, and Marianna Scutti performed the tests; Roberto de Bonis, Josè F. Guerrero Tello, and Wissam Wahbeh implemented the tool; Cristina Proietti and Silvia Scifoni analyzed the volcanological data.

Conflicts of Interest

The authors declare no conflict of interest.

Abbreviations

The following abbreviations are used in this manuscript:
Etna_NETVISEtna NEtwork of Thermal and Visible Sensors
2Dtwo dimensional
3Dthree dimensional
GCPGround Control Points
DEMDigital Elevation Model
2Dtwo dimensional
GPSGlobal Positioning System
IOModImage Orientation Module
IRModImage orthoRectification Module
CDModChange Detection Module
INGVIstituto Nazionale di Geofisica e Vulcanologia
CTCatania
SEVIRISpinning Enhanced Visible and InfraRed Imager
ECVEtna Cuad Visible
EMVEtna Milo Vible
EMOVEtna Montagnola Visible
EMOTEtna Montagnola Thermal
ENVEtna Nicolosi Visible
ENTEtna Nicolosi Thermal
EMCTEtna Monte Cagliato Thermal
EMCHEtna Monte Cagliato High resolution
EMOHEtna Montagnola High resolution
FOVfield of view
HFOV and VFOVHorizontal and Vertical Field of View
ENEtna Nicolosi
EMOEtna Montagnola
ESVEtna Schiena dell’Asino Visible
ERFExternal ReFerence system
IR-MADIteratively Reweighted—Multivariate Alteration Detection
CCACanonical Correlations Analysis
MADMultivariate Alteration Detection
RTKReal Time Kinematic
UTM-WGS84Universal Transverse of Mercator-World Geodetic System 1984

References

  1. Baldi, P.; Coltelli, M.; Fabris, M.; Marsella, M.; Tommasi, P. High precision photogrammetry for monitoring the evolution of the NW flank of Stromboli volcano during and after the 2002–2003 eruption. Bull. Volcanol. 2005, 70, 703–715. [Google Scholar] [CrossRef]
  2. Marsella, M.; Proietti, C.; Sonnessa, A.; Coltelli, M.; Tommasi, P.; Bernardo, E. The evolution of the Sciara del Fuoco subaerial slope during the 2007 Stromboli eruption: Relation between deformation processes and effusive activity. J. Volcanol. Geotherm. Res. 2009, 182, 201–213. [Google Scholar] [CrossRef]
  3. Diefenbach, A.K.; Crider, J.G.; Schilling, S.P.; Dzurisin, D. Rapid, low-cost photogrammetry to monitor volcanic eruptions: An example from Mount St. Helens, Washington, USA. Bull. Volcanol. 2012. [Google Scholar] [CrossRef]
  4. Diefenbach, A.K.; Bull, K.F.; Wessels, R.L.; McGimsey, R.G. Photogrammetric monitoring of lava dome growth during the 2009 eruption of Redoubt Volcano. J. Volcanol. Geotherm. Res. 2013, 259, 308–316. [Google Scholar] [CrossRef]
  5. Heipke, C. State-of-the-art of digital photogrammetric workstations for topographic applications. ISPRS J. Photogramm. Remote Sens. 1995, 61, 49–56. [Google Scholar]
  6. Kraus, K. Photogrammetry; Dummler: Bonn, Germany, 1998. [Google Scholar]
  7. Marsella, M.; Nardinocchi, C.; Proietti, C.; Daga, L.; Coltelli, M. Monitoring active volcanos using aerial images and the Orthoview tool. Remote Sens. 2014, 6, 12166–12186. [Google Scholar] [CrossRef] [Green Version]
  8. James, M.R.; Varley, N. Identification of structural controls in an active lava dome with high resolution DEMs: Volcán de Colima, Mexico. Geophys. Res. Letts. 2012, 39, L22303. [Google Scholar] [CrossRef]
  9. Ryan, G.A.; Loughlin, S.C.; James, M.R.; Jones, L.D.; Calder, E.S.; Christopher, T.; Strutt, M.; Wadge, G. Growth of the lava dome and extrusion rates at Soufrière Hills Volcano, Montserrat, West Indies: 2005–2008. Geophys. Res. Letts. 2010, 37, L00E08. [Google Scholar] [CrossRef]
  10. James, M.R.; Robson, H. Sequential digital elevation models of active lava flows from ground-based stereo time-lapse imagery. ISPRS J. Photogram. Remote Sens. 2014, 97, 160–170. [Google Scholar] [CrossRef]
  11. Coltelli, M.; Proietti, C.; Branca, S.; Marsella, M.; Andronico, D.; Lodato, L. Analysis of the 2001 lava flow eruption of Mt. Etna from 3D mapping. J. Geophys. Res. 2007, 112, F02029. [Google Scholar] [CrossRef]
  12. Marsella, M.; Coltelli, M.; Proietti, C.; Branca, S.; Monticelli, R. 2002–2003 lava flow eruption of stromboli: A contribution to understanding lava discharge mechanism using periodic digital photogrammetry surveys. In The Stromboli Volcano: An Integrated Study of the 2002–2003 Eruption; Calvari, S., Inguaggiato, S., Puglisi, G., Ripepe, M., Rosi, M., Eds.; American Geophysical Union: Washington, DC, USA, 2008. [Google Scholar]
  13. Scifoni, S.; Coltelli, M.; Marsella, M.; Proietti, C.; Napoleoni, Q.; Vicari, A.; del Negro, C. Mitigation of lava flow invasion hazard through optimized barrier configuration aided by numerical simulation: The case of the 2001 Etna eruption. J. Volcanol. Geotherm. Res. 2010, 192, 16–26. [Google Scholar] [CrossRef]
  14. Coltelli, M.; Marsella, M.; Proietti, C.; Scifoni, S. The case of the 1981 eruption of Mount Etna, an example of very fast moving lava flows. Geochem. Geophys. Geosyst. 2012. [Google Scholar] [CrossRef]
  15. Honda, K.; Nagai, M. Real-time volcano activity mapping using ground-based digital imagery. ISPRS J. Photogramm. Remote Sens. 2002, 57, 159–168. [Google Scholar] [CrossRef]
  16. James, M.R.; Robson, S.; Pinkerton, H.; Ball, M. Oblique photogrammetry with visible and thermal images of active lava flows. Bull. Volcanol. 2006, 69, 105–108. [Google Scholar] [CrossRef]
  17. James, M.R.; Pinkerton, H.; Robson, S. Image-based measurement of flux variation in distal regions of active lava flows. Geochem. Geophys. Geosyst. 2007, 8, Q03006. [Google Scholar] [CrossRef]
  18. James, M.R.; Pinkerton, H.; Applegarth, L.J. Detecting the development of active lava flow fields with a very-long-range terrestrial laser scanner and thermal imagery. Geophys. Res. Lett. 2009, 36, L22305. [Google Scholar] [CrossRef]
  19. Lewis, A.; Hilley, G.E.; Lewicki, J.L. Integrated thermal infrared imaging and structure-from-motion photogrammetry to map apparent temperature and radiant hydrothermal heat flux at Mammoth Mountain, CA, USA. J. Volcanol. Geotherm. Res. 2015, 303, 16–24. [Google Scholar] [CrossRef]
  20. Travelletti, J.; Delacourt, C.; Allemand, P.; Malet, J.P.; Schmittbuhl, J.; Toussaint, R.; Bastard, M. Correlation of multi-temporal ground-based optical images for landslide monitoring: Application, potential and limitations. ISPRS J. Photogramm. Remote Sens. 2012, 70, 39–55. [Google Scholar] [CrossRef]
  21. Maas, H.G.; Dietrich, R.; Schwalbe, E.; Bäßler, M.; Westfeld, P. Analysis of the motion behaviour of Jakobshavn Isbrae Glacier in Greenland by monocular image sequence analysis. In Proceedings of the ISPRS Commission V Symposium ‘Image Engineering and Vision Metrology’ 2006, Dresden, Germany, 25–27 September 2006; Volume XXXVI, pp. 179–183.
  22. Dietrich, R.; Maas, H.G.; Baessler, M.; Ruelke, A.; Richter, A.; Schwalbe, E.; Westfeld, P. Jakobshavn Isbrae, West Greenland: Flow velocities and tidal interaction of the front area from 2004 field observations. J. Geophys. Res. Earth Surf. 2007, 112, F03S21. [Google Scholar] [CrossRef]
  23. Maas, H.G.; Casassa, G.; Schneider, D.; Schwalbe, E.; Wendt, A. Photogrammetric techniques for the determination of spatio-temporal velocity fields at Glaciar San Rafael, Chile. Photogramm. Eng. Remote Sens. 2013, 79, 299–306. [Google Scholar] [CrossRef]
  24. Messerli, A.; Grinstead, A. Image GeoRectification and feature tracking toolbox: ImGRAFT. Geosci. Instrum. Methods Data Syst. 2015, 4, 23–34. [Google Scholar] [CrossRef]
  25. Ganci, G.; James, M.R.; Calvari, S.; del Negro, C. Separating the thermal fingerprints of lava flows and simultaneous lava fountaining using ground-based thermal camera and SEVIRI measurements. Geophys. Res. Lett. 2013, 40, 5058–5063. [Google Scholar] [CrossRef]
  26. OPENCV. Available online: http://opencv.org (accessed on 27 July 2016).
  27. HALCON Embedded. Available online: http://www.halcon.com (accessed on 27 July 2016).
  28. Heikillä, J. Geometric camera calibration using circular control points. IEEE Trans. Pattern Anal. Mach. Intell. 2000, 22, 1066–1077. [Google Scholar] [CrossRef]
  29. Nielsen, A.A.; Conradsen, K.; Simpson, J.J. Multivariate alteration detection (MAD) and MAF postprocessing in multispectral, bitemporal image data: New approaches to change detection studies. Remote Sens. Environ. 1998, 64, 1–19. [Google Scholar] [CrossRef]
  30. Nielsen, A.A. The regularized iteratively reweighted mad method for change detection in multi- and hyperspectral Data. IEEE Trans. Image Process. 2007, 162, 463. [Google Scholar] [CrossRef]
  31. Nielsen, A.A.; Canty, M.J. A method for unsupervised change detection and automatic radiometric normalization in multispectral data. In Proceeding of the 34th International Symposium on Remote Sensing of Environment: The GEOSS Era: Towards Operational Environmental Monitoring. International Society for Photogrammetry and Remote Sensing, Sydney, Australia, 10–15 April 2011.
  32. Behncke, B.; Branca, S.; Corsaro, R.A.; de Beni, E.; Miraglia, L.; Proietti, C. The 2011–2012 summit activity of Mount Etna: Birth, growth and products of the newSE crater. J. Volcanol. Geotherm. Res. 2014, 270, 10–21. [Google Scholar] [CrossRef]
Figure 1. Location of the current Etna_NETVIS sites and areas visible from them (E at the start of all abbreviations stands for Etna; C: Cuad; M: Milo; MC: Monte Cagliato; MO: Montagnola; N: Nicolosi; S: Schiena dell’Asino; H, T and V at the end of all abbreviations stand for High resolution, Thermal and Visible sensors, respectively). Each color corresponds to the areas visible from the various sites as indicated in the legend.
Remotesensing 09 00192 g001
Figure 2. (a) Additional observation sites; (b) example of the area potentially observed from a simulated observation site; and (c) 3D lateral view from the observation site simulated in (b).
Remotesensing 09 00192 g002
Figure 3. (a) Nominal size on the ground of pixel with respect to the distance not considering the distortion effects; and (b) Horizontal Field of with respect to the distance. The dashed black lines approximate the distance between Monte Cagliato site and the summit craters.
Remotesensing 09 00192 g003
Figure 4. View of the 3D calibration test field devised on the INGV facility edifice in Nicolosi (CT). The thirty-five regularly distributed artificial targets are 0.15 m diameter black circles drawn inside white squares.
Remotesensing 09 00192 g004
Figure 5. Distortion curves, estimated for the VIVOTEK IP8172, that show the displacement from the corrected distances of image points from the optical axis plotted along the diagonal.
Remotesensing 09 00192 g005
Figure 6. Modules of the NETVIS tool.
Remotesensing 09 00192 g006
Figure 7. Flowchart of the three modules in the NETVIS tool: (a) Image Orientation Module; (b) Image orthoRectification Module; (c) Change Detection Module.
Remotesensing 09 00192 g007
Figure 8. (a) GCPs position on the 2005 DLR orthophoto map. The inset in (a) locates the test site on the whole volcano. (b) Example of an image acquired during the test. The inset in (b) shows an enlarged view of a GCP.
Remotesensing 09 00192 g008
Figure 9. (a) Orthophoto extracted by the IRMod and GCP positions on the ground (green crosses). (b,c) Differences between GCP position measured on the ground and on the orthophoto (red dots).
Remotesensing 09 00192 g009
Figure 10. Simulated view of a VIVOTEK-like camera observing at EMO site, the 3D virtual targets used as GCPs are also shown.
Remotesensing 09 00192 g010
Figure 11. Simulation test for a VIVOTEK-like camera at EMO site: (a) GCP measured on a reference map (shaded relief); and (b) GCPs distributed on the orthophoto extracted from the simulation.
Remotesensing 09 00192 g011
Figure 12. Orthophotos extracted by the NETVIS tool from EMCT images of 12 August 2011 and delimiting of the lava flow field evolution. The east and north coordinates evaluated in the UTM-WGS84 reference system are reported along the X- and Y-axes, respectively.
Remotesensing 09 00192 g012
Figure 13. Orthophotos extracted by the NETVIS tool from EMCT images of 29 August 2011 and delimiting of the lava flow field evolution. The east and north coordinates evaluated in the UTM-WGS84 reference system are reported along the X- and Y-axes, respectively.
Remotesensing 09 00192 g013
Figure 14. (a) Temporal evolution of the covered area manually digitized on the orthophoto extracted with the IOMod; and (b) temporal evolution of the areal expansion. In both figures, data related to the lava flow fields of the 12 and 29 August episodes are represented as black dashed line and squares and by red line and triangles, respectively. In the X-axis, 7 h and 50 min have been subtracted to the eruptive time of the 12 August episode, while 3 h and 15 min have been subtracted to that of 29 August for comparing the two trends.
Remotesensing 09 00192 g014
Figure 15. (a) Example of two subsequent EMCT thermal images acquired during the 8 December 2011 eruptive episode; (b) multi-temporal dataset; (c) representation of lava flow areal evolution obtained with the aid of the results of the change detection analysis; and (d) comparison between the temporal evolution of the areal expansion of the 12 August lava field evaluated by manually digitizing the flow field limits on NETVIS orthophotos (black dashed line and squares) or by applying the change detection module (green line and dots). In the X-axis 7 h and 50 min have been subtracted to the eruptive time of the 12 August episode.
Remotesensing 09 00192 g015
Table 1. Technical specifications of Etna_NETVIS cameras.
Camera ModelCanon VC-C4RVIVOTEK IP8172FLIR A40FLIR A320
Sensor width (mm)3.86.414.37.9
Sensor height (mm)2.94.810.85.7
Pixel width (µm)8.2~344.724
Pixel height (µm)8.2~345.024
Focal length (mm)4–642.8–1214.318.4
HFOV (°)3–47.533–932425
VFOV (°)2.25–35.6224–681818.8
Table 2. Results of the calibration of the VIVOTEK camera.
OpenCVHalconOpenCv-Halcon
Sensor W (mm)6.3106.0200.290
Sensor H (mm)4.8004.8000.000
Pixel (μm)3.103.18−0.08
Focal (mm)11.32011.2200.100
PP x (mm)2.8802.6000.280
PP y (mm)2.1901.9400.250

