Next Article in Journal
Convolutional Recurrent Neural Networks for
Hyperspectral Data Classification
Article

Preliminary Evaluation of the SMAP Radiometer Soil Moisture Product over China Using In Situ Data

1
State Key Laboratory of Simulation and Regulation of Water Cycles in River Basin, China Institute of Water Resources and Hydropower Research, Beijing 100038, China
2
Research Center on Flood and Drought Disaster Reduction of Ministry of Water Resources, China Institute of Water Resources and Hydropower Research, Beijing 100038, China
*
Author to whom correspondence should be addressed.
Remote Sens. 2017, 9(3), 292; https://doi.org/10.3390/rs9030292
Submission received: 27 November 2016 / Revised: 9 March 2017 / Accepted: 17 March 2017 / Published: 20 March 2017
(This article belongs to the Special Issue Remote Sensing Applied to Soils: From Ground to Space)

Abstract

:
The Soil Moisture Active Passive (SMAP) satellite makes coincident global measurements of soil moisture using an L-band radar instrument and an L-band radiometer. It is crucial to evaluate the errors in the newest L-band SMAP satellite-derived soil moisture products, before they are routinely used in scientific research and applications. This study represents the first evaluation of the SMAP radiometer soil moisture product over China. In this paper, a preliminary evaluation was performed using sparse in situ measurements from 655 China Meteorological Administration (CMA) monitoring stations between 1 April 2015 and 31 August 2016. The SMAP radiometer-derived soil moisture product was evaluated against two schemes of original soil moisture and the soil moisture anomaly in different geographical zones and land cover types. Four performance metrics, i.e., bias, root mean square error (RMSE), unbiased root mean square error (ubRMSE), and the correlation coefficient (R), were used in the accuracy evaluation. The results indicated that the SMAP radiometer-derived soil moisture product agreed relatively well with the in situ measurements, with ubRMSE values of 0.058 cm3·cm−3 and 0.039 cm3·cm−3 based on original data and anomaly data, respectively. The values of the SMAP radiometer-based soil moisture product were overestimated in wet areas, especially in the Southwest China, South China, Southeast China, East China, and Central China zones. The accuracies over croplands and in Northeast China were the worst. Soil moisture, surface roughness, and vegetation are crucial factors contributing to the error in the soil moisture product. Moreover, radio frequency interference contributes to the overestimation over the northern portion of the East China zone. This study provides guidelines for the application of the SMAP-derived soil moisture product in China and acts as a reference for improving the retrieval algorithm.

Graphical Abstract

1. Introduction

Soil moisture, a primary state variable of hydrology, plays an important role in the linkage between terrestrial water, energy, and carbon cycles, which control a variety of the hydro-meteorological, hydro-climatic, and biogeochemical processes at various spatial and temporal scales [1,2,3,4]. It is essential to obtain accurate information on soil moisture. Generally, the conventional approach for detecting the soil moisture content involves relatively accurate ground measurements at a point scale using site networks [5,6,7,8], such as the United States Department of Agriculture (USDA) Soil Climate Analysis Network (SCAN) across the USA. Due to the lack of ground measurement sites in some local regions, the availability of in situ measurement data is insufficient to accurately capture the spatial distribution of surface soil moisture at a continental or global scale.
Due to the advantage of remote sensing observations, many efforts have been dedicated to determining the surface soil moisture for regional or even global applications [9,10,11,12,13,14]. Early field experiments demonstrated that passive microwave emissions and active microwave scatter are a function of the dielectric constant of the surface soil layer, and that the dielectric constant is related to the soil water content. Thus, the soil moisture content of the surface soil can be retrieved using microwave remote sensing [12,13,14]. In the past, several soil moisture products have been derived from various operational satellite sensors with the required accuracy at different spatial resolutions (i.e., a few of kilometers), such as the Topical Rainfall Measuring (TRMM) Microwave Imager (TMI) [15], the Advanced Microwave Scanning Radiometer-Earth Observing System (AMSR-E) aboard Aqua [16,17,18], the Advanced Microwave Scanning Radiometer2 (AMSR2) aboard GCOM-W1 [19], the Soil Moisture and Ocean Salinity (SMOS) sensor [20,21], the Scatterometers aboard ERS-1/2 [22,23], and the Advanced Scatterometers (ASCAT) aboard MetOp-A [24,25]. Altogether, these datasets span the past 30 years, but the accuracy of the soil water retrievals remains uncertain due to the different inversion methods, frequencies, and principles.
To practically use the different soil moisture retrieval data, knowledge of both the quality of the different data and the error structure is critical. Generally, the footprint of a satellite encompasses a few kilometers of heterogeneous land surface, which differs from point-scale measurements of in situ observations. Hence, one of the lingering issues is how to determine the retrieval quality based on ground measurements or model-simulated products [26]. Until now, four main strategies have been used to validate and evaluate the accuracy and uncertainty of remote sensing-derived soil moisture products. The strategies include using dense in situ sites to validate the soil moisture retrieval at a footprint scale [26,27,28,29,30], using a sparse in situ network of sites to evaluate the spatial errors and consistency of the soil moisture products at a continental or global scale [8,25,31,32], comparing model-simulated data with soil moisture products derived from remote sensing techniques [14,33,34], and comparing the soil moisture products produced by different remote sensing sensors [35,36]. For example, Kerr et al. (2016) not only used dense in situ sites (located in four watersheds in the United States) and sparse in situ sites (the International Soil Moisture Network, ISMN), but also used model outputs and other satellite-based products to evaluate the quality of the SMOS soil moisture product.
Based on the aforementioned studies, the use of passive microwaves in the L-band seems to be the most promising method to more accurately retrieve soil moisture at continental and global scales, even though other approaches, including higher frequencies and active systems, have been used. In addition to SMOS operating in the L-band, the NASA Soil Moisture Active Passive (SMAP) mission uses an L-band radar instrument and an L-band radiometer to detect the surface soil water content [37]. Other satellite missions have retrieved soil moisture values using the C-band (AMSR-E, AMSR2, ERS-1/2, ASCT) and X-band (AMSR-E) [38]. Launched on 31 January 2015, SMAP is the first mission designed for and dedicated to soil moisture retrieval around the world, using an L-band radar instrument and an L-band radiometer [39]. The baseline soil moisture retrieval algorithm of SMAP has been repeatedly verified by several field experiments, with a target accuracy of 0.04 cm3·cm−3 [38,40]. However, few studies have evaluated the quality and accuracy of the SMAP soil moisture product over China before using the resulting data in scientific research and practical applications. The objective of this study is to pursue a preliminary evaluation of the SMAP passive microwave soil moisture product over China using in situ data collected by the Chinese Meteorological Administration (CMA) from 1 April 2015 to 31 August 2016, to provide guidance for practical applications. In the paper, we use the bias, root mean square error (RMSE), unbiased root mean square error (ubRMSE), and correlation coefficient (R), which were computed from the original soil moisture data and soil moisture anomaly data, as the metrics of assessment to evaluate the quality of the SMAP radiometer soil moisture product and to determine the error structure of the product over China.

2. Materials and Methods
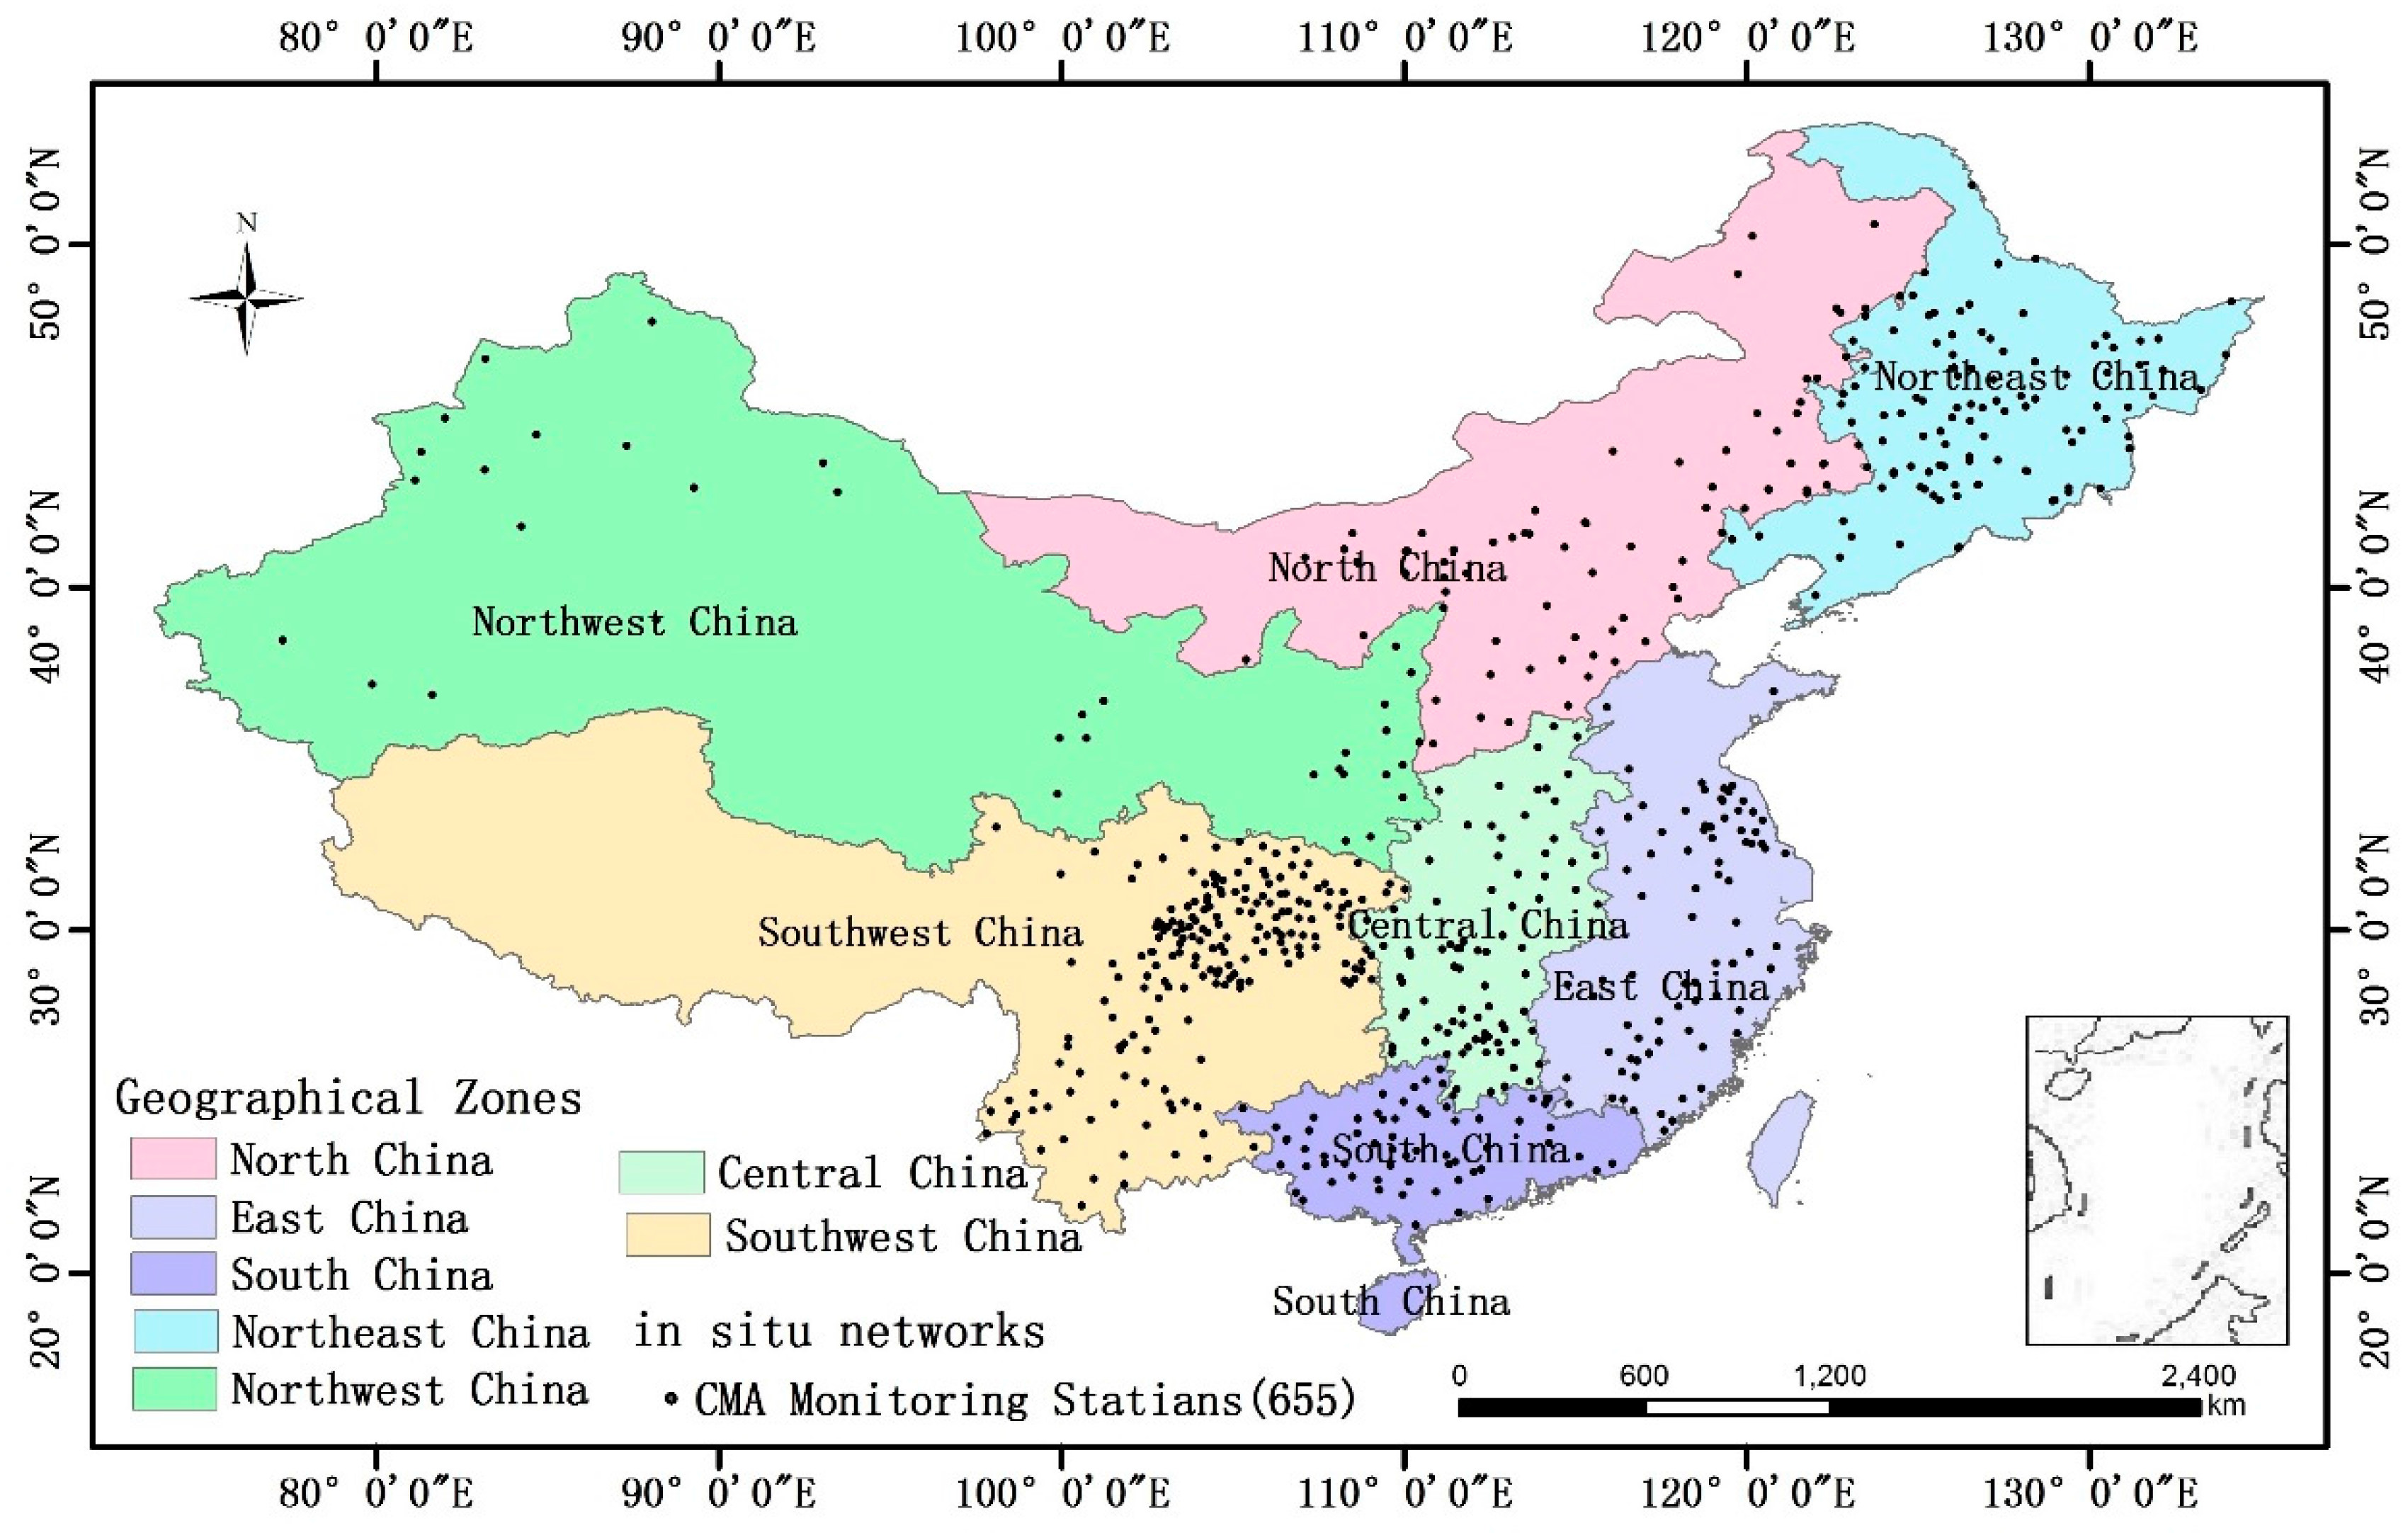
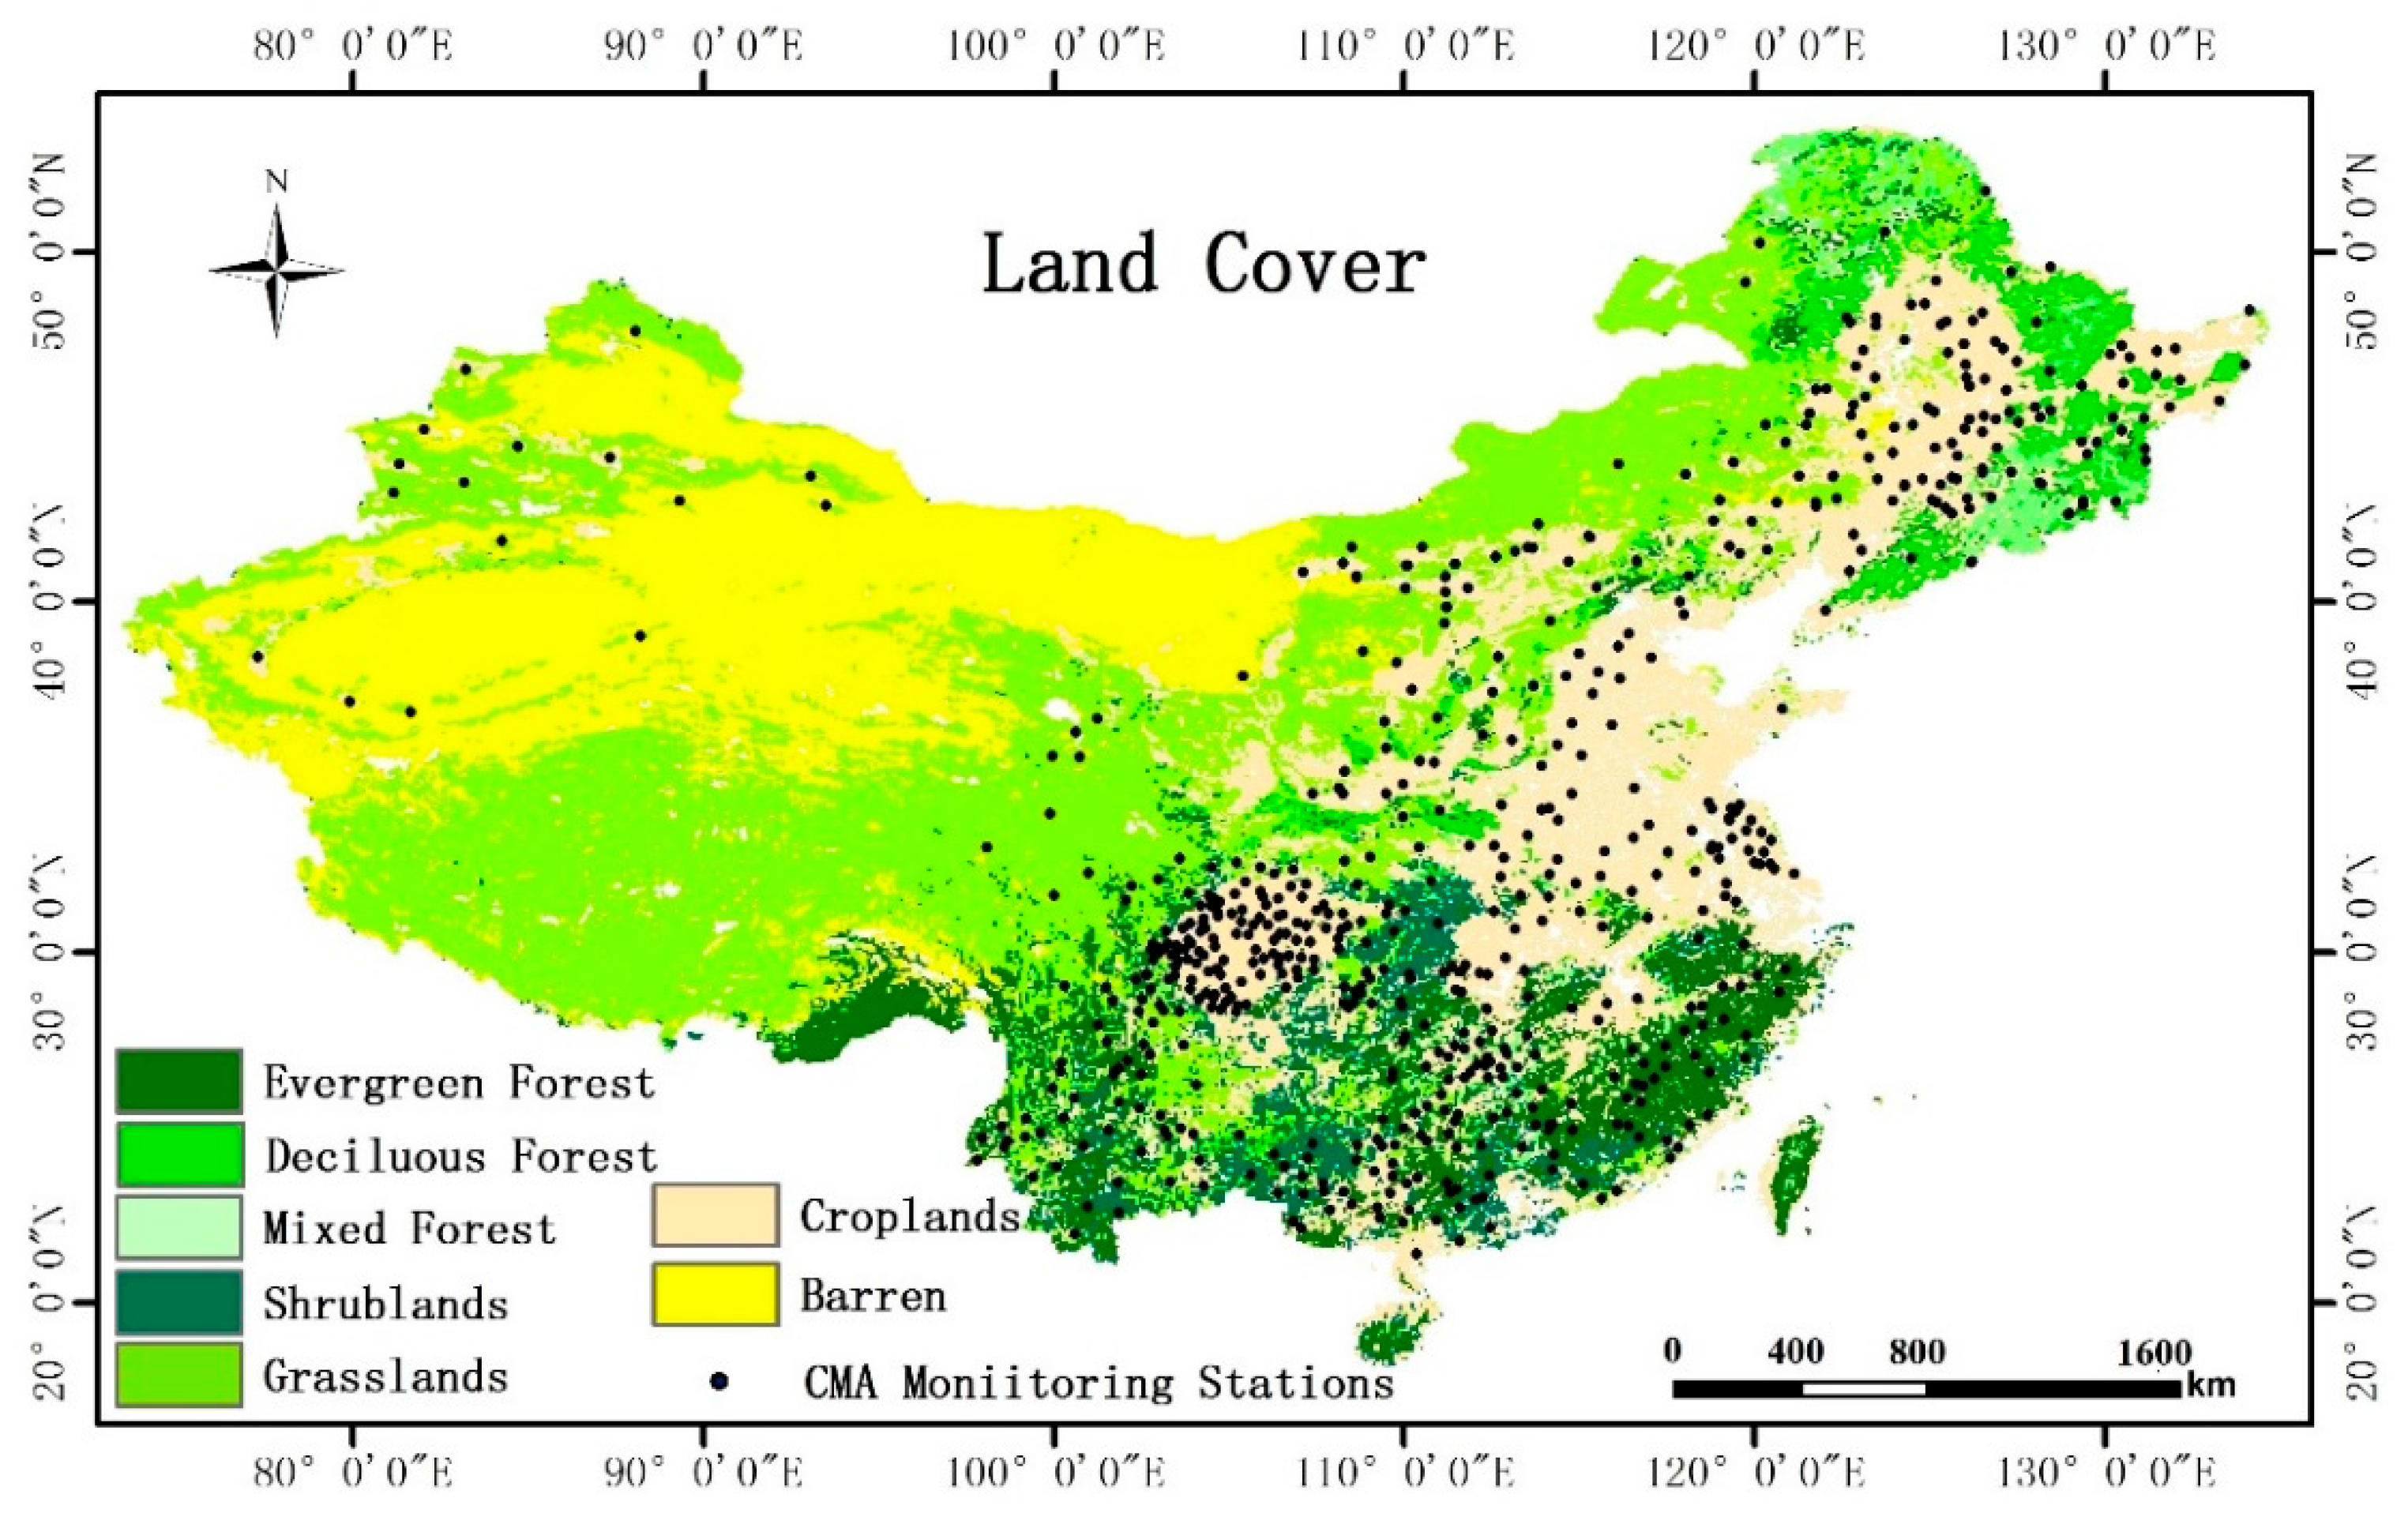
2.1. Study Area

China is located in eastern Asia (3°51′N–53°33′N, 73°33′E–135°05′E) and borders the western Pacific Ocean [8]. China spans a vast area, with a width of 5000 km and a length of 5500 km. The overall terrain is characterized by higher elevations in the west and lower elevations in the east. The Pamir-Tibet Plateau (with elevations above 4500 m) is in the west; the Mongolian, Loess, and Yun-Gui plateaus (with elevations of approximately 1000 m) occupy the central portion; and some plains and hills (with elevations of less than 200 m) are located in the east [41]. Continental China is also greatly influenced by continental and monsoon climates [8]. The annual cumulative precipitation and annual average daily temperature are 630 mm and 9 °C, respectively, but these parameters have significant spatial differences. In China, the northwestern region is generally arid, and the southeastern region is generally wet. The daily temperature of the northern region is lower than that of the southern region. Rainfall is abundant in the summer and scarce in the winter. In addition, precipitation and temperature play an important role in the growth of vegetation. Consequently, China can be divided into different vegetation-climate zones, including the Tibetan high cold plateau zone, the temperate desert zone, the temperate steppe zone, the tropical rainforest and monsoon forest zone, the subtropical evergreen broadleaf forest zone, the warm deciduous broadleaf forest zone, and the cold coniferous forest zone [42]. In this study, based on the complex natural geographical features, continental China is divided into seven large geographical zones, in order to analyze the spatial errors in the SMAP soil moisture product over China. These seven zones are the Northeast China zone (~0.8 million km2), Northwest China zone (~3 million km2), North China zone (~1.5 million km2), Central China zone (~0.6 million km2), East China zone (~0.8 million km2), South China zone (~0.5 million km2), and Southwest China zone (~2.3 million km2) (Figure 1). In addition, the two areas with no in situ soil moisture monitoring sites in Southwest China and Northwest China are located on the Pamir-Tibet Plateau and in a desert area, respectively. We did not evaluate the validity and reliability of the SMAP soil moisture product over these areas. However, to ensure the integrity and continuity of the study area in China, the Southwest and Northwest zones still include the areas with no in situ soil moisture monitoring sites.

2.2. Satellite-Based Soil Moisture Data

The Soil Moisture Active Passive (SMAP) mission launched on 31 January 2015, and is the first soil moisture mission by NASA to use an L-band synthetic aperture radar instrument (SAR, active microwave instrument operating at 1.22–1.3 GHz) and an L-band radiometer (passive microwave operating at 1.41 GHz) for concurrent, coincident measurements, integrated into a single observation system [37,39]. The SMAP makes coincident global measurements of soil moisture to a depth of 5 cm on a 685-km, near-polar, sun-synchronous orbit, with equator crossings at 6 am (descending) and 6 pm (ascending) local time. SMAP data will be used to enhance the understanding of the processes that link the hydrologic, energy, and carbon cycles, and to improve drought and flood forecasts and weather and climate prediction modes [37]. Four types of soil products are provided: a radiometer-based soil moisture product with a spatial resolution of 36 km, a radar-based soil moisture product with a spatial resolution of 3 km, a combined radiometer- and radar-derived soil moisture product with a spatial resolution of 9 km, and an assimilated moisture product with a spatial resolution of 9 km [39]. However, the radar instrument broke on 7 July 2015, leaving only the radiometer-derived and assimilated soil moisture products available following this date. The passive microwave soil moisture retrieval is based on the Single Channel Algorithm for vertical polarization (SCA-V), derived from the first-order radiative transfer model, which has been verified as an accurate method by airborne field experiments. The target accuracy of passive microwave soil moisture products is 0.04 cm3·cm−3 volumetric (1 sigma) at a spatial resolution of 36 km, with global coverage every three days, excluding regions of snow and ice, frozen ground, mountainous topography, open water, urban areas, and vegetation with a water content greater than 5 kg·m−2 [39]. Although many field experiments have confirmed that the inversion accuracy of the SCA-V met the goal requirement before the SMAP was launched, studies on the validation and evaluation of SMAP-derived soil moisture products at the continual scale are limited. Hence, we collected the SMAP Level 3 radiometer soil moisture product (SMAP L3 Radiometer Global Daily 36 km EASE-Grid Soil Moisture) time series between 1 April 2015 and 31 August 2016. In addition, to obtain daily soil moisture data with seamless coverage across China, SMAP soil moisture data over continental China were slide composited on a three-day step basis (Figure 2). First, based on three-day SMAP daily soil moisture products, three images were mosaicked into one composited SMAP daily soil moisture product, with seamless global coverage. Second, the composited SMAP daily soil moisture data over continental China was extracted using a shapefile of the administrative boundary of China.

2.3. In Situ Soil Moisture Data

The in situ soil moisture data were collected from the Chinese Meteorological Data Service System of the Chinese Meteorological Administration (CMA), depending on the delegated program. The data were measured automatically by time-domain reflectometers (TDRs) in three subsurface layers, i.e., at depths of 10 cm, 20 cm, and 40 cm, once every five days over the entirety of China. Because the L-band passive microwave-derived soil moisture product only represents the top 5 cm of soil, this study only used the in situ surface volumetric soil moisture data measured at the depth of 10 cm by the CMA meteorological stations, from 1 April 2015 to 31 August 2016. The installation quality of ground-based instruments was strictly controlled, and the rationality and reliability of the soil moisture results were examined. However, due to the complexity of the surrounding conditions, the representativeness of the in situ observations at the footprint scale varies. The in situ soil moisture measurements have to be screened based on certain criteria, such as the stability of a single measurement time series and the homogeneity of the surface land conditions. Finally, this study selected observations from 655 sites to evaluate the SMAP radiometer soil moisture product (Figure 1 and Figure 3).

2.4. Auxiliary Data

For land cover data in China, this study used the EASE-Grid and EASE-Grid 2.0 land cover data at a spatial resolution of 36 km from the National Snow & Ice Data Center (NSIDC) (ftp://sidads.colorado.edu/pub/DATASETS/nsidc0610_classification_ease2/global/). The EASE-Grid and EASE-Grid 2.0 include 17 land cover types derived from the Boston University MOD12Q1 V004 MODIS/Terra 1 km Land Cover Product [43]. In this study, we reclassified the 17 classes into eight new classes. The evergreen needleleaf forest and evergreen broadleaf forest were merged into the evergreen forest. The deciduous needleleaf forest and deciduous broadleaf forest were merged into the deciduous forest. The closed/open shrublands and woody savannas were merged into shrublands. The savannas were classified as grasslands. The cropland/natural vegetation mosaic was classified as croplands. Barren or sparsely vegetated regions were classified as barren. The permanent wetlands, urban and built-up areas, snow and ice, and water bodies were classified as other, and were masked in this study (Figure 3). The mixed forest type remained the same.

2.5. Methods

The soil moisture data from the CMA meteorological stations, which are part of a sparse in situ observation network, were used here and compared to the SMAP radiometer soil moisture product over continental China. Generally, the accuracy requirement of soil moisture retrievals is specified as a metric of the RMSE between the satellite-derived soil moisture and the true soil moisture. The “1 sigma” specification as the accuracy requirement is also a statistical measure adopted by the SMAP project [39]. However, there remain many important considerations when evaluating this statistic [39]. The most challenging issue with the validation is how the true surface soil moisture in a grid cell is estimated by the point-based ground measurements or other data. In the current literature, many previous studies [4,44,45] have focused on the evaluation and validation of satellite soil moisture retrievals based on in situ soil moisture measurements. In this study, every site in the CMA meteorological station network only corresponds to a grid cell in the SMAP radiometer soil moisture product, and the in situ soil moisture measurement is assumed to represent the true value of the grid cell. In addition, the most challenging issue with the validation is the representativeness of the in situ measurements in a grid cell. To obtain a more complete assessment of the accuracy of the soil moisture products, we used four statistical indicators/metrics—RMSE, bias, ubRMSE, and R [30,39]—to evaluate the accuracy of the SMAP radiometer-derived soil moisture. The RMSE is given by:
R M S E = E ( θ s m a p ( t ) θ t r u e ( t ) ) 2
where E · is the linear averaging operator, t is the time of the soil moisture measurement, θ s m a p ( t ) is the SMAP radiometer-derived volumetric soil moisture in a grid cell at time t, and θ t r u e ( t ) is the true soil moisture based on in situ volumetric soil moisture measurements in a grid cell at time t. The RMSE represents the absolute difference between the SMAP soil moisture retrievals and the in situ soil moisture measurements. Because the true soil moisture value in a grid cell is difficult to obtain, the upscaling error cannot be completely avoided in the ground measurement-based validation of SMAP retrievals. This RMSE calculated using Equation (1) is likely to be severely compromised and includes the RMSE of soil moisture retrievals relative to the true value and the upscaling error (RMSE of the estimated ground truth relative to the true value). The bias is calculated by:
B i a s = E θ s m a p ( t ) E θ t r u e ( t )
The bias describes the systematic difference between the SMAP soil moisture retrievals and the estimated true values based on in situ soil moisture measurements. The ubRMSE is calculated by:
u b R M S E = E ( ( θ s m a p ( t ) E θ s m a p ( t ) ) ( θ t r u e ( t ) E θ t r u e ( t ) ) ) 2
The ubRMSE removes the bias from the RMSE and characterizes the random errors at the grid cell level. Therefore, this statistic is more meaningful for describing the errors in the soil moisture retrievals. The R value between the SMAP radiometer-derived soil moisture values and the true values (the in situ soil moisture) is calculated by:
R = E ( θ s m a p ( t ) E θ s m a p ( t ) ) ( θ t r u e ( t ) E θ t r u e ( t ) ) σ s m a p σ t r u e
where σ s m a p is the standard variance in the SMAP radiometer soil moisture time series for a grid cell and σ t r u e is the standard variance of the estimated true time series based on in situ soil moisture measurements in the grid cell. R values show the temporal consistency and relative accuracy between SMAP soil moisture retrievals and the estimated true values based on in situ soil moisture measurements.
In addition, the SMAP radiometer-derived soil moisture product was evaluated via two schematic frameworks: the original data and anomaly data. First, the four metrics based on original SMAP soil moisture retrievals and original ground measurements were used to investigate errors in the SMAP radiometer-derived soil moisture product. Second, the four metrics based on the soil moisture anomalies of SMAP soil moisture retrievals and ground measurements were used to interpret the error structure of the SMAP radiometer-derived soil moisture product. The soil moisture anomaly, which is derived from mean seasonal soil moisture data, is computed by removing the seasonal cycle from the original data [4,30,44]. The soil moisture anomaly is defined as:
θ x a n o m a l y ( t ) = θ x o r i g i n a l ( t ) θ x o r i g i n a l ( t 15 : t + 15 ) ¯
The subscript x represents either SMAP or in situ data, based on SMAP or in situ measurements, respectively. Furthermore, θ x o r i g i n a l ( t ) is the original volumetric soil moisture at time t, θ x a n o m a l y ( t ) is the volumetric soil moisture anomaly at time t, θ x o r i g i n a l ( t 15 : t + 15 ) is a time series of θ x o r i g i n a l ( t ) from day t − 15 to day t + 15, and θ x o r i g i n a l ( t 15 : t + 15 ) ¯ is a 31-day average of the original volumetric soil moisture from day t − 15 to day t + 15. The soil moisture anomalies of the SMAP product demonstrate that the SMAP soil moisture product is able to capture short-term variability in soil moisture.

3. Results

Continental China occupies a vast, spatially heterogeneous area and has various hydro-climatic and hydro-meteorological characteristics. To accurately evaluate the SMAP radiometer-based soil moisture product, the four statistical indicators (bias, RMSE, ubRMSE, and R) were calculated for seven land cover types and seven geographical zones, using both the original data and the anomaly data. We selected 655 in situ site observations and compared them with the corresponding footprint-scale SMAP soil moisture retrievals from 1 April 2015 to 31 August 2016. The SMAP statistics for each land cover and geographic zone are shown in Table 1 and Table 2.

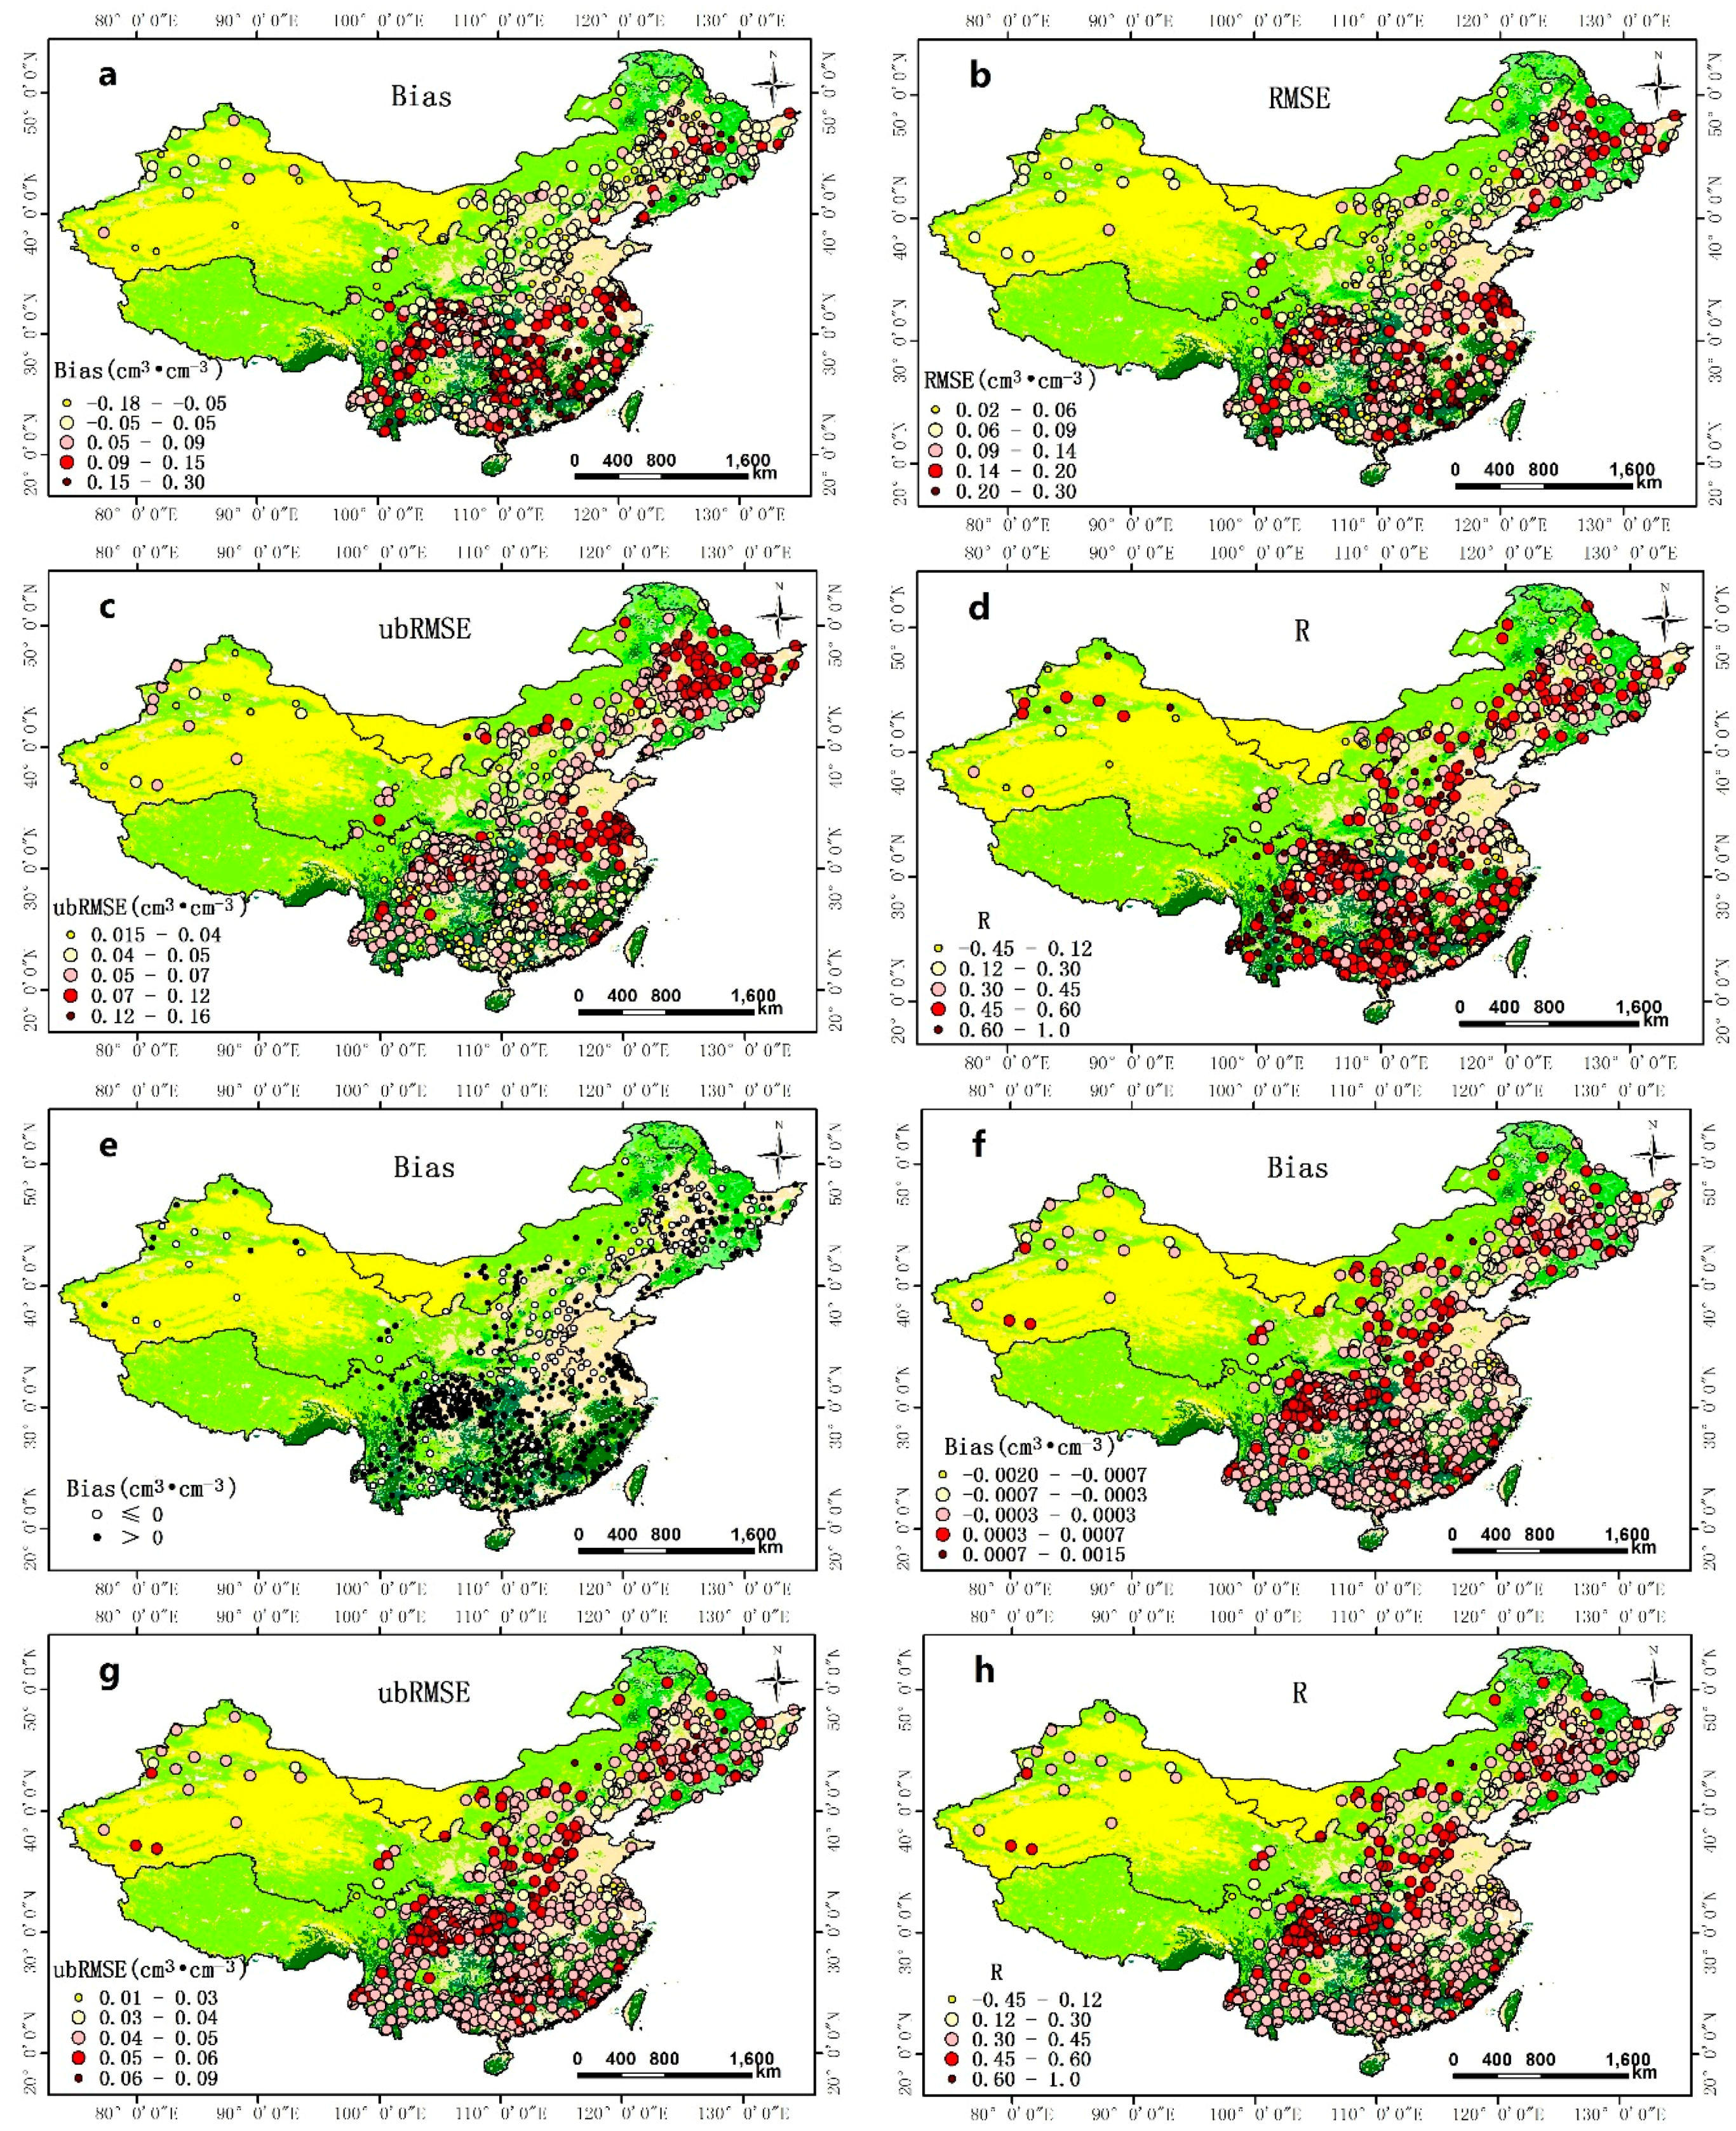
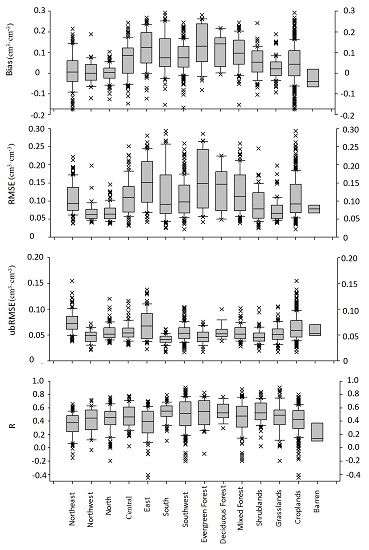
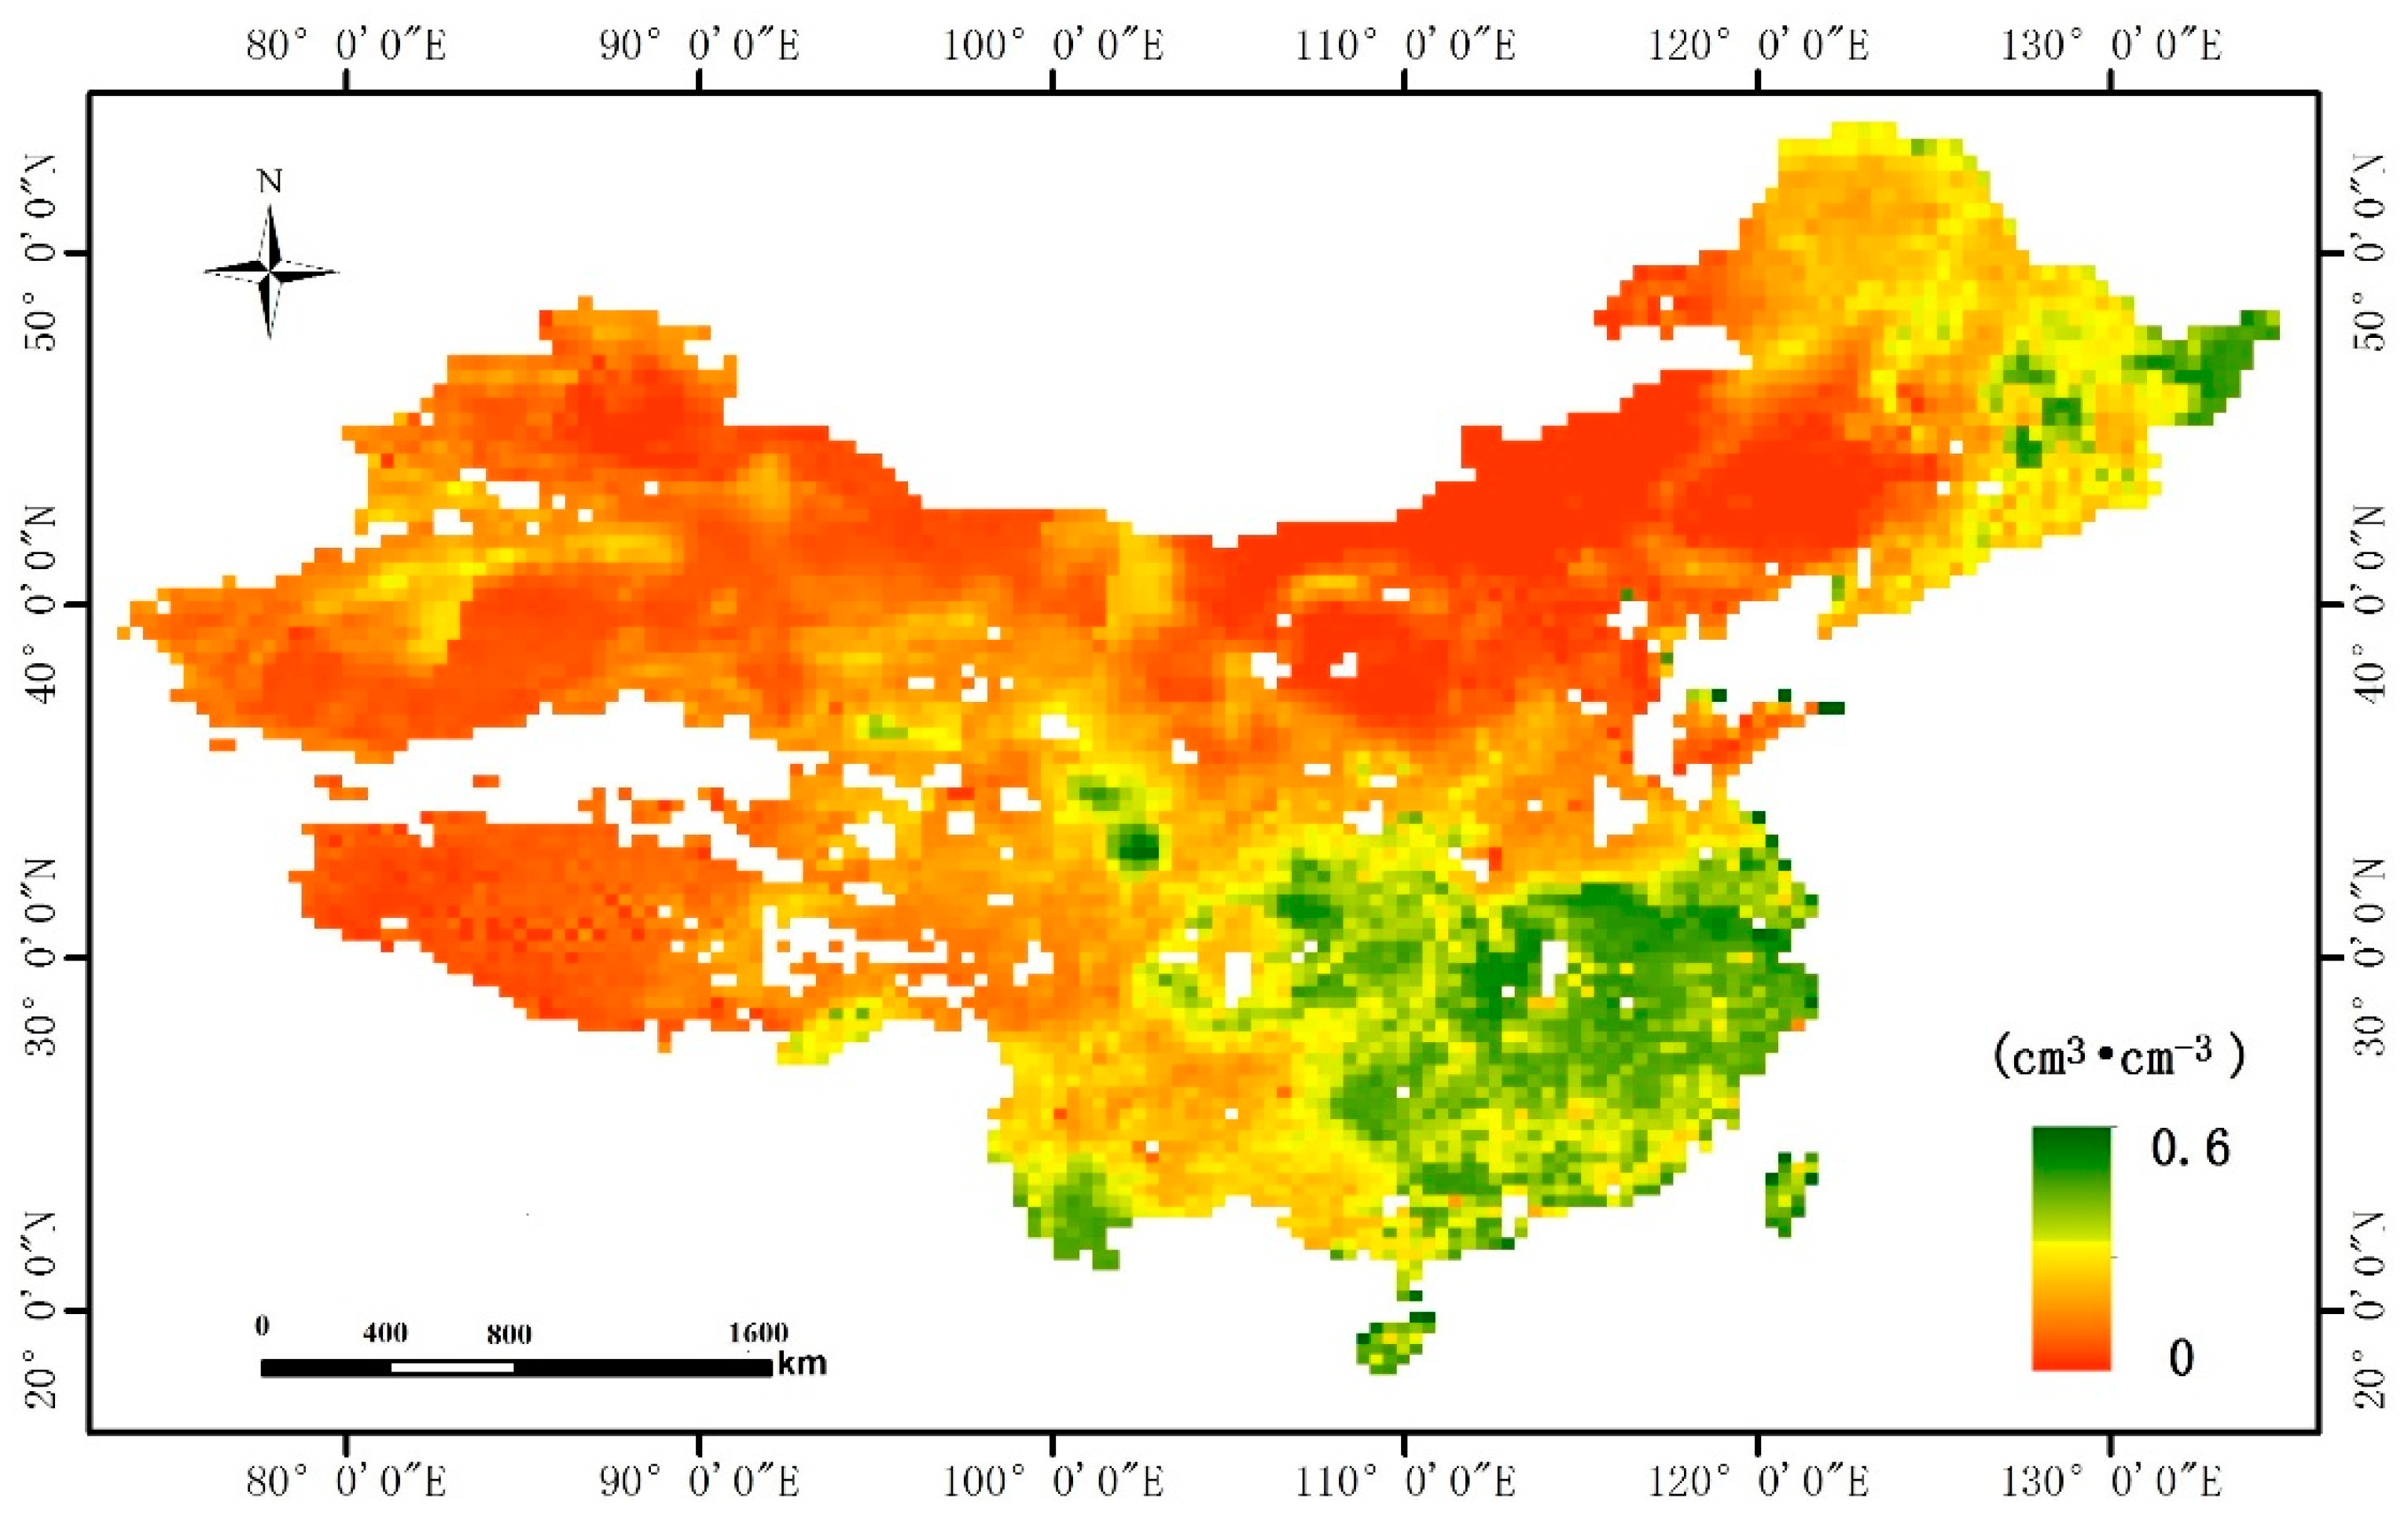
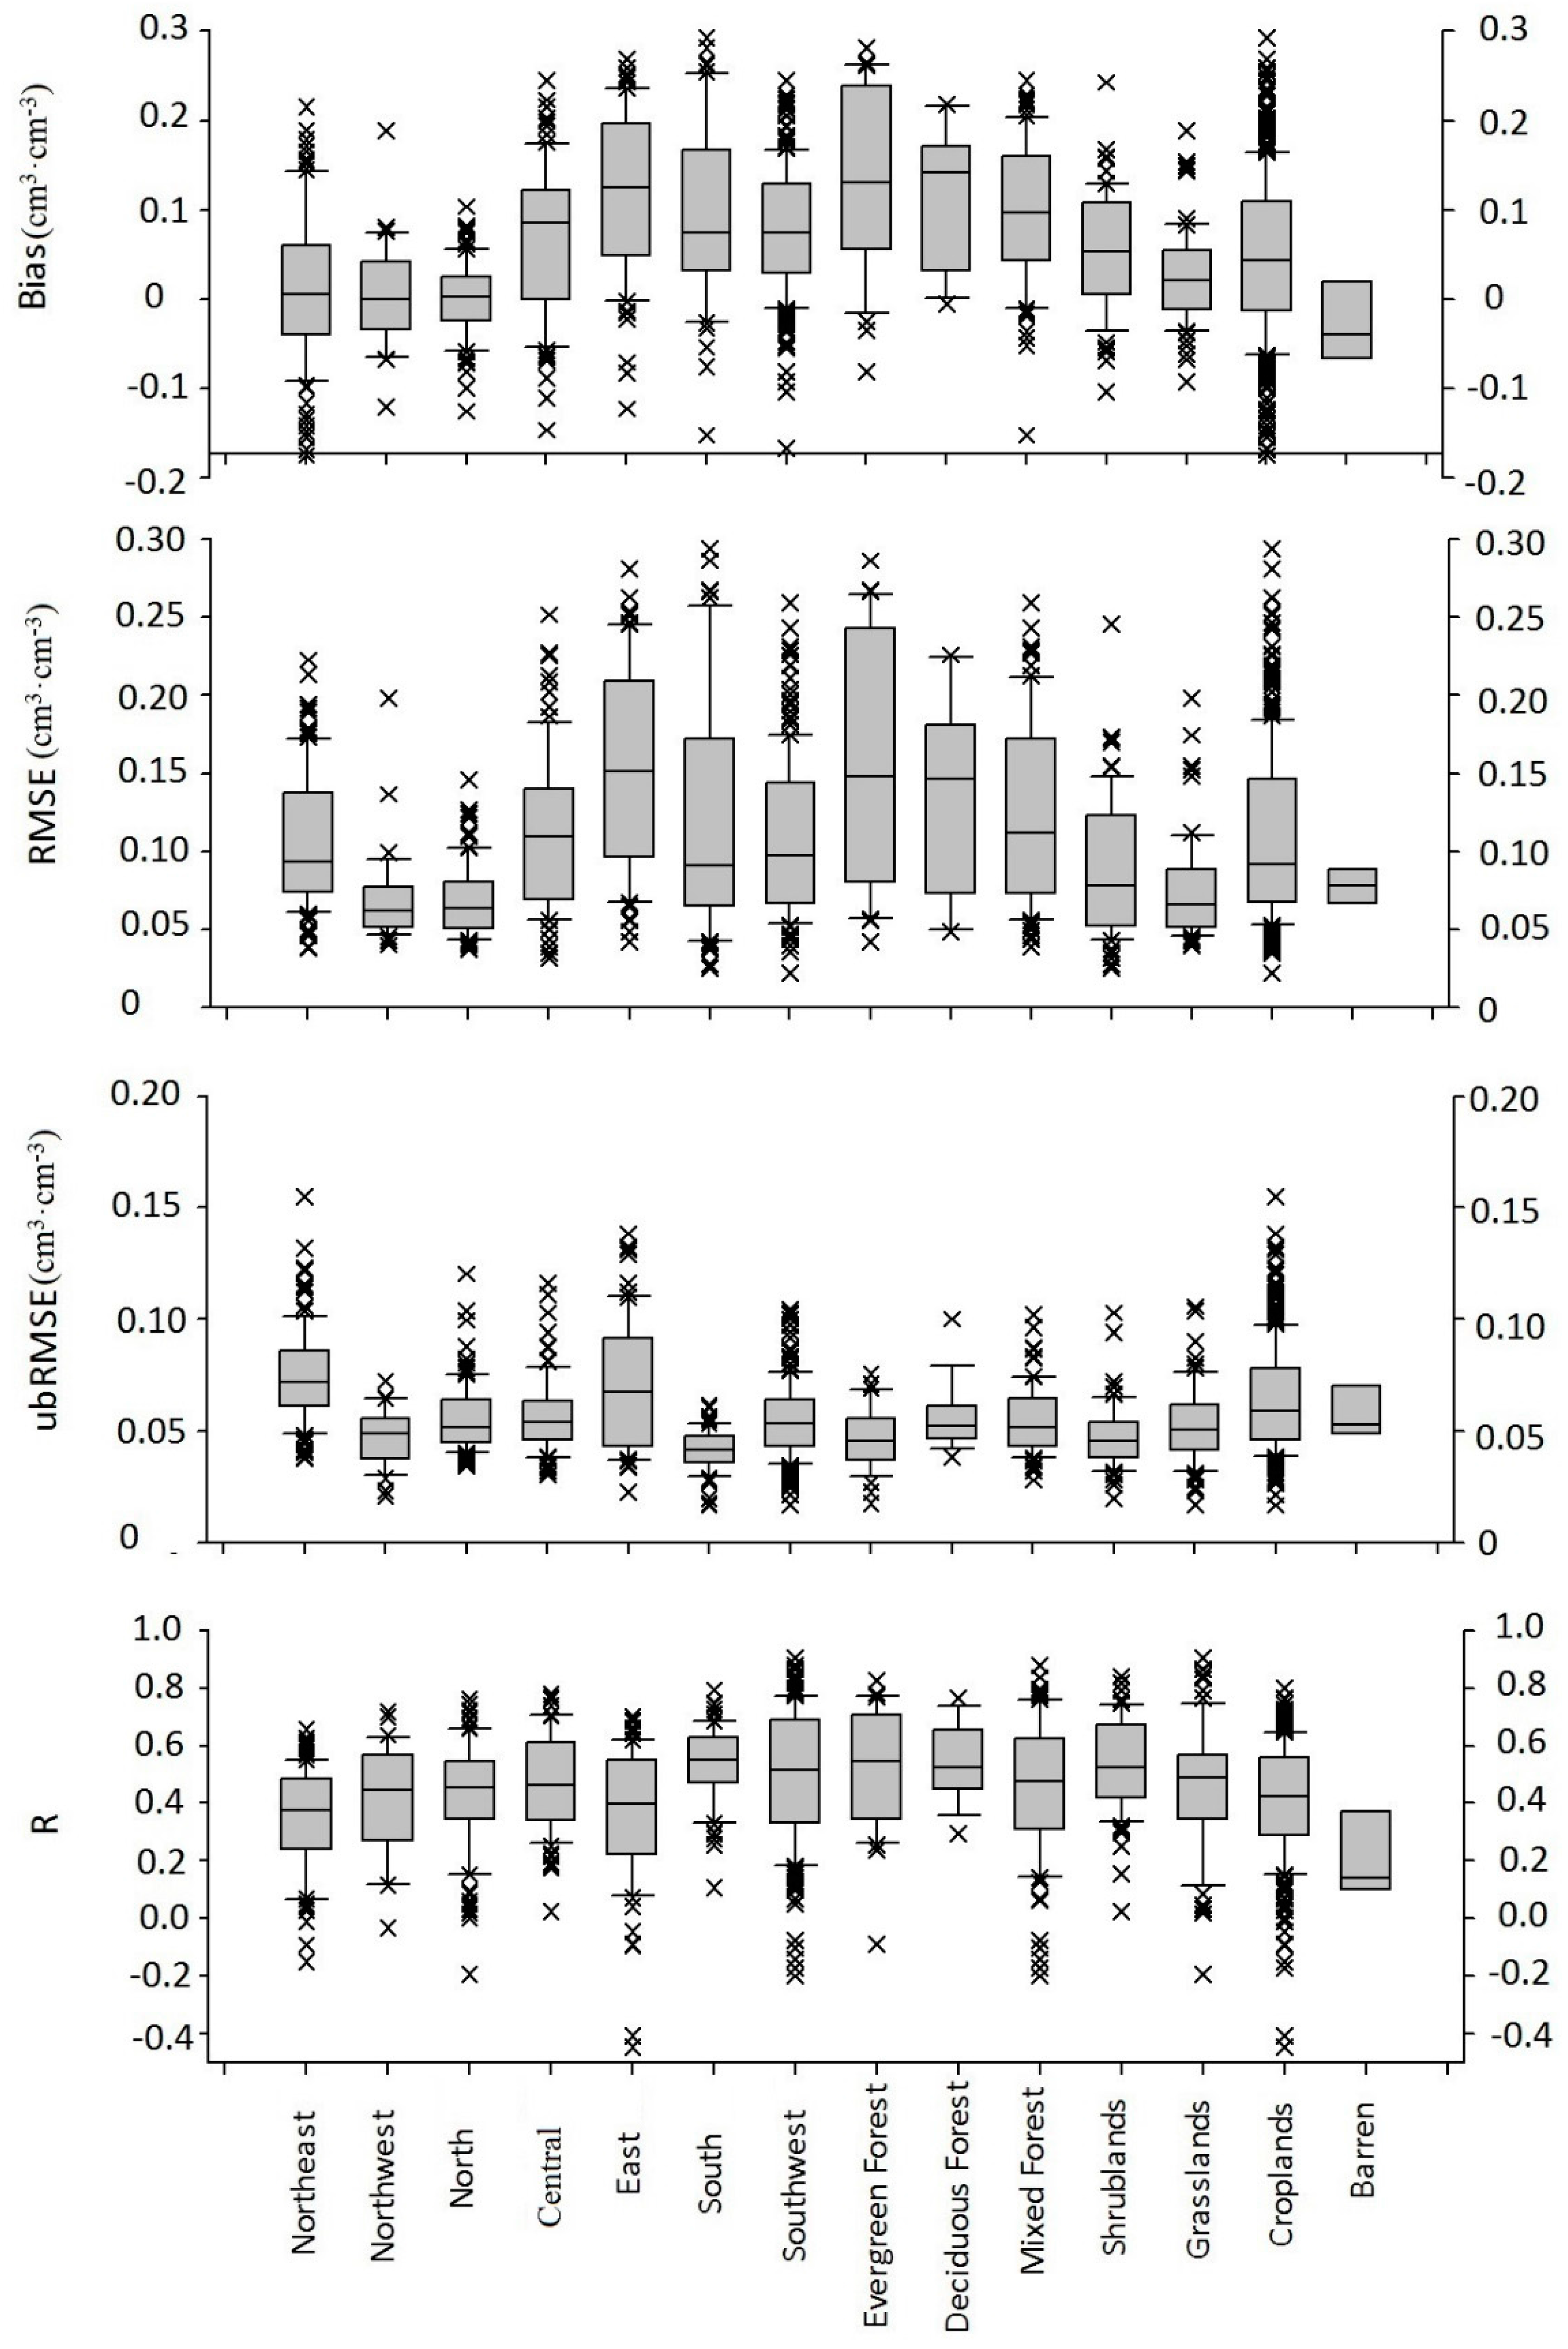
3.1. Comparison of Original Data from the SMAP Radiometer-Based Product and In Situ Observations

In this study, we compared the original SMAP soil volumetric water contents with the original in situ soil volumetric water contents (Figure 4, Figure 5 and Figure 6). As shown in Table 1, the average bias value between the SMAP soil moisture and in situ soil moisture over all of China is 0.0578 cm3·cm−3, which indicates that SMAP soil moisture retrievals have a positive deviation from the corresponding in situ observations. The positive bias indicates that the SMAP radiometer soil moisture retrievals likely overestimate the soil moisture in continental China (Figure 6a). Additionally, the average bias for each geographical zone ranged from 0 cm3·cm−3 to 0.121 cm3·cm−3, and the average bias for each land cover type ranged from −0.029 cm3·cm−3 to 0.136 cm3·cm−3. Furthermore, the average bias values of the East China zone, Central China zone, South China zone, and Southwest China zone were more than 0.06 cm3·cm−3, and the estimated soil moisture bias was especially high in the East China zone, with a value of 0.121 cm3·cm−3. The average bias of the other zones was less than 0.012 cm3·cm−3, and the lowest average bias was in the North China zone. According to the characteristics of the hydro-meteorological and hydro-climatic processes in China, the cumulative annual precipitation and the average daily temperature in humid southern China were higher than those of the semi-humid, semi-arid, and arid regions of northern and northwestern China. Thus, the SMAP radiometer-based soil moisture product exhibits overestimation issues in wet areas. Based on the bias boxplot (Figure 4), most bias values in the East China zone, Central China zone, South China zone, and Southwest China zone were greater than 0 cm3·cm−3 (Figure 6a,e), demonstrating that the soil moisture was overestimated in wet areas. In addition, the bias values vary among the land cover types in Table 1 and Figure 4. The average bias of the forest is the highest, up to approximately 0.13 cm3·cm−3, and the average bias of the grasslands is lowest, at only 0.02 cm3·cm−3. Compared with the in situ observations, the SMAP soil moisture retrievals over forest, shrublands, and croplands were significantly overestimated, and those over grasslands were somewhat overestimated. However, the average bias over barren land was negative, indicating that the soil moisture in the barren may have been underestimated.
In terms of RMSE, the average RMSE over the entirety of China was 0.108 cm3·cm−3, and the average RMSE values varied substantially among the different geographical zones and among the different land cover types, ranging from 0.068 cm3·cm−3 to 0.156 cm3·cm−3, and from 0.075 cm3·cm−3 to 0.158 cm3·cm−3, respectively (Table 1). The SMAP mission did not provide the specified absolute RMSE target for the accuracy of the SMAP radiometer-based soil moisture product, but the AMSR2 mission supplied the desired goal of 0.1 cm3·cm−3 for the RMSE accuracy. Therefore, if we perform an ancillary evaluation of the SMAP soil moisture product based on the required RMSE of 0.1 cm3·cm−3, the overall RMSE of 0.108 cm3·cm−3 over the entirety of China meets the required accuracy. Because the RMSE includes point-wise upscaling errors, the true accuracy of the SMAP radiometer soil moisture product over China is likely to be better than an RMSE of 0.1 cm3·cm−3. Furthermore, the average RMSE values of the Central China, East China, South China, Northeast China, and Southwest China zones were greater than 0.1 cm3·cm−3, with the RMSE of the East China zone being the greatest. In contrast, the RMSE values of the Northwest China and North China zones were less than 0.08 cm3·cm−3. The average RMSE values of the forest (evergreen, deciduous, and mixed) and croplands were greater than 0.1 cm3·cm−3, whereas the average RMSE values of shrublands, grasslands, and barren were similarly less than 0.09 cm3·cm−3. The different RMSE intervals of each geographical zone and each land cover type also reveal, to some extent, that there are absolute differences between the SMAP radiometer soil moisture retrievals and the in situ observations (Figure 4). In summary, in terms of RMSE, the errors in the soil moisture retrievals in the Northwest China and North China zones, grasslands, and barren areas were small, whereas the accuracies of the SMAP soil moisture product in the East China and South China zones and forests were the worst.
When a bias exists between the SMAP soil moisture product and in situ observations, ubRMSE is a relatively objective metric to evaluate the performance and better describe random errors in the SMAP soil moisture product. As presented in Table 1, the average ubRMSE over the entirety of China was 0.058 cm3·cm−3, and the average ubRMSE of the different geographical zones and land cover types ranged from 0.041 cm3·cm−3 to 0.075 cm3·cm−3, and from 0.047 cm3·cm−3 to 0.062 cm3·cm−3, respectively. The average ubRMSE value for the entirety of China was greater than 0.04 cm3·cm−3 (the desired accuracy of the SMAP mission). The average RMSE values of the Northeast China and East China zones were greater than 0.07 cm3·cm−3. Among all of the zones, the average ubRMSE values of the Northwest China and South China zones were the closest to 0.04 cm3·cm−3. In addition, we found that only croplands had an average ubRMSE value greater than 0.06 cm3·cm−3; the average ubRMSE values of other land cover types were approximately 0.05 cm3·cm−3. Figure 4 describes the different ubRMSE intervals of each geographic zone and land cover type and shows that, regardless of the upscaling errors, the SMAP soil moisture product still deviates relatively significantly from the true soil moisture. The errors in the soil moisture retrievals for the North China, Central China, South China, and Southwest China zones and the forest, shrublands, grasslands, and barren land cover types were relatively small, especially in the South China zone and the shrublands land cover type. The errors in the soil moisture retrievals for the Northeast China and East China zones and the croplands land cover type were relatively high, and the ubRMSE accuracy in East China was the worst. Figure 6c shows the distribution of ubRMSE values over continental China and reveals that errors exist in the SMAP soil moisture product.
In this study, we also calculated the R values between the SMAP soil moisture retrieval and the in situ observations for different geographical zones and land cover types. As shown in Table 1, Figure 4 and Figure 6d, the overall R value of the entirety of China was 0.39, and each average R value in the different geographical zones was approximately 0.4, except for South China, where the R was 0.52. In addition, each average R value for the different land cover types was between 0.3 and 0.5, except for the average R value for the barren land cover, which was only 0.16. According to the statistical results based on the R values, the correlation between SMAP soil moisture product and the in situ observations from northern to southern China increases, whereas the correlation decreases with decreasing vegetation from forest to croplands to barren land.

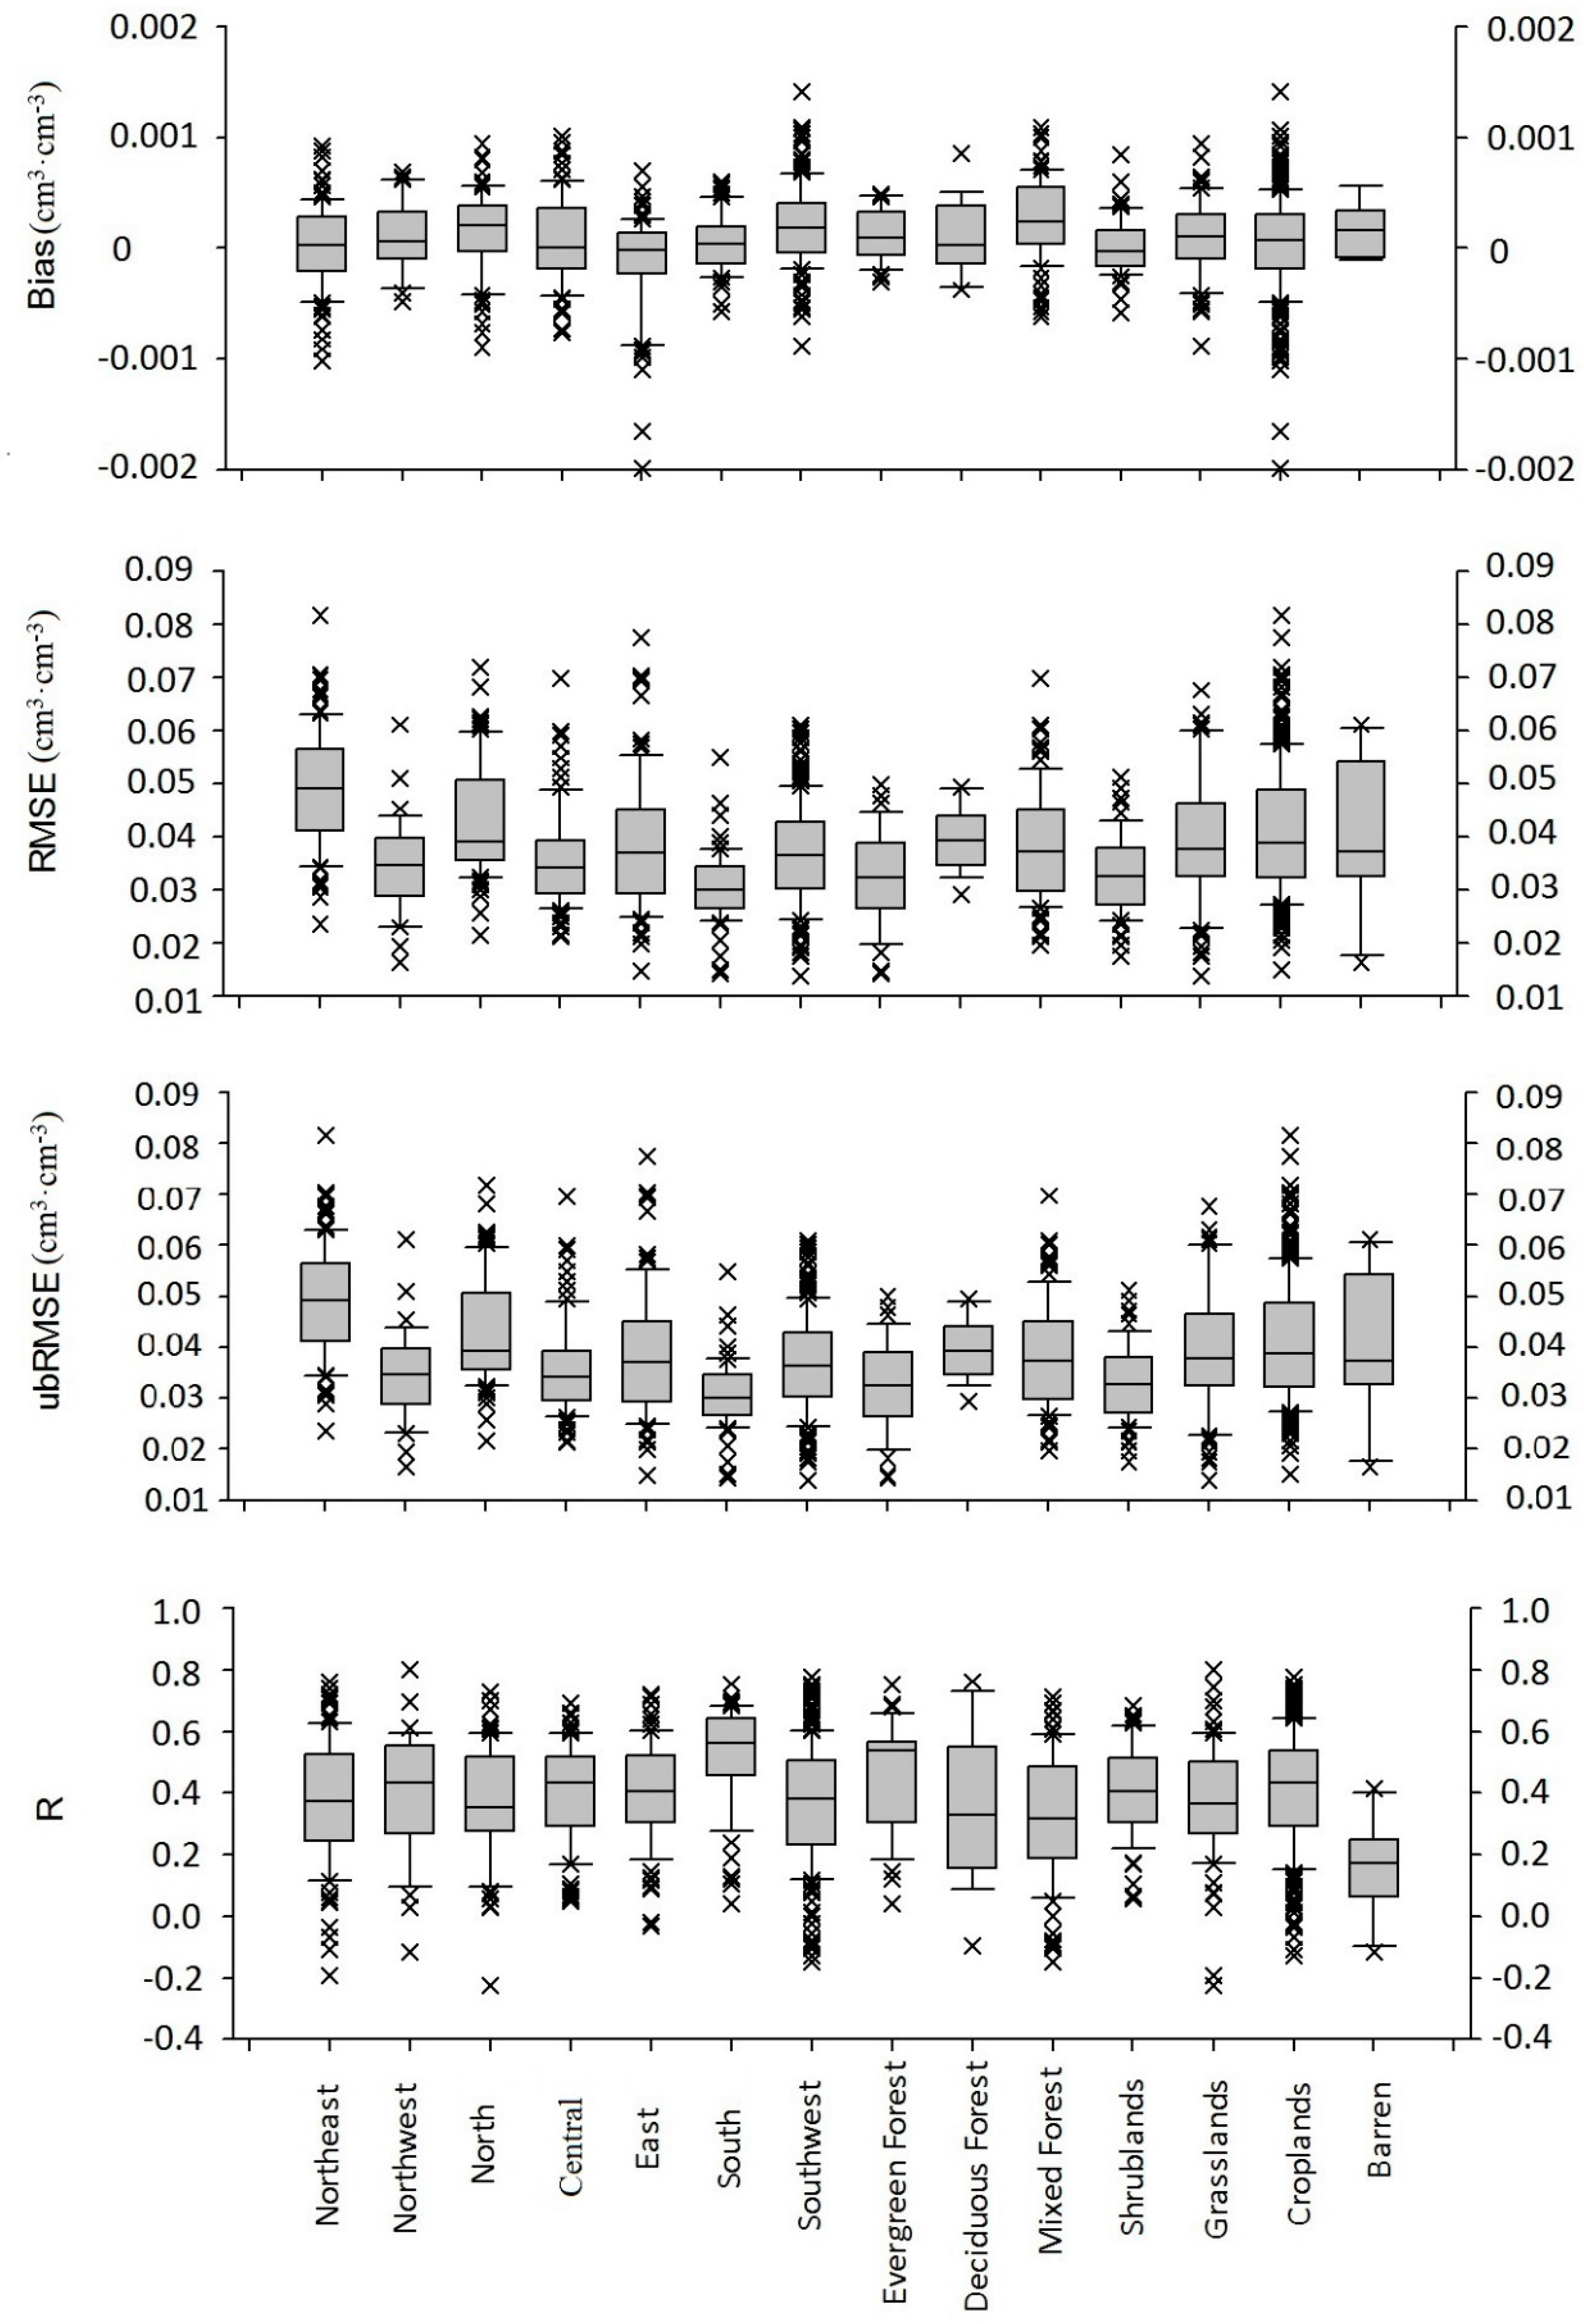
3.2. Comparison of the SMAP Radiometer Soil Moisture Product and In Situ Observations Based on Anomaly Data

The anomaly-based approach can be helpful in examining the ability of SMAP soil moisture products to capture individual wetting and drying events. For this purpose, the SMAP radiometer soil moisture product and in situ observations were compared using anomaly data. Table 2 and Figure 5 show that the absolute value of the bias calculated from the anomaly data was less than 0.0003 cm3·cm−3, and that few differences exist among the RMSE and ubRMSE values. Compared with the bias between the SMAP product and the in situ observations calculated from the original data, the bias values calculated from the anomaly data for different geographical zones and land cover types can be considered to be zero. Most strikingly, the average RMSE value for the entirety of China was only 0.039 cm3·cm−3 (Table 2), which meets the desired accuracy of the SMAP mission (0.04 cm3·cm−3). Compared with the average RMSE from the original data, the RMSE calculated from the anomaly data was lower. The average RMSE was 0.049 cm3·cm−3 in the Northwest China zone, 0.043 cm3·cm−3 in the North China zone, and less than 0.04 cm3·cm−3 in the other geographical zones. Thus, the SMAP radiometer soil moisture product has a good ability to capture individual wetting and drying events in the different geographical zones and the performance is best in the South China zone. The average RMSE values for the croplands and barren cover types were 0.041 cm3·cm−3, whereas the RMSE values for the other cover types were less than 0.04 cm3·cm−3. Thus, the SMAP radiometer soil moisture product can accurately capture short-term variability in soil moisture in different land cover types. The small range of the anomaly data with the seasonal cycle partly removed contributes to the low RMSE. Additionally, compared to the RMSE box plots based on the original data in Figure 4, the box plots based on the anomaly data in Figure 5 exhibit much less variation in box height among the different geographical zones and land cover types. In addition, compared to the ubRMSE values from the original data, the ubRMSE value of the East China zone from the anomaly data was relatively lower than the values of the other geographical zones (Figure 5 and Figure 6g). Thus, the SMAP soil moisture product in the East China zone has a relatively poor ability to estimate absolute soil moisture levels but can accurately capture short-term variability in the soil moisture in this area.
In terms of R values, Table 2 shows that the average R value from anomaly data for the entirety of China was only 0.39 and that, in different geographical zones and for different land cover types, the R values ranged from 0.37 to 0.52 and 0.16 to 0.46, respectively. Compared to the average R values from the original data, the R values from the anomaly data were consistently lower in different geographical zones and land cover types. However, the R values in Figure 4 and Figure 5 show a similar pattern. Notably, the R values from both the original data and the anomaly data were highest in the South China zone, which also shows that the SMAP soil moisture retrievals are in reasonable agreement with the in situ measurements in the South China zone. Figure 6h also shows that the high R values were mainly distributed in the South China zone. In addition, the R values from the original data and anomaly data were similarly low for the barren land cover, indicating that the SMAP soil moisture retrievals do not agree with the in situ measurements over areas of barren land. In addition, compared to the box height of the R data based on the original data, the box height of the R data from the anomaly data was higher in the deciduous forest (in Figure 5).

4. Discussion

To practically use the newly released SMAP soil moisture retrieval data, knowing the quality of the data and understanding the error structure are critical. In this paper, we examined the performance of the SMAP radiometer soil moisture product over China using sparse in situ measurements. However, the sparse in situ measurements from the CMA monitoring stations provide only one site (or possibly a few sites) within a satellite-based grid product. In general, using sparse networks to validate the accuracy of satellite-based soil moisture products is challenging, due to the need to transfer point-based ground measurements provided by in situ resources to the SMAP footprint scale. To solve this problem, a SMAP working group focused on providing systematic scaling guidelines for the SMAP Cal/Val program, based on sparse in situ networks [39,45]. Although we extracted 655 in situ observations based on the research results of the SMAP working group, the comparison between the SMAP soil moisture retrievals and the in situ observations is also faced with the following problems. First, there is a mismatch in the spatial scale: due to the spatial heterogeneity in the surface soil moisture, the point-based in situ measurements are not the true soil moisture values at a scale of 36 km. However, in this study, the point-based in situ observations were assumed to be the true values of the 36-km footprints. Second, there is a mismatch in the vertical representative depth: the SMAP L-band radiometer can detect soil moisture in the uppermost 5 cm of soil, whereas the CMA in situ observations are at a depth of 10 cm below the surface. In this study, the in situ observations were assumed to be representative of the soil moisture at a depth of 5 cm. In addition, compared to the true values of soil moisture at a point scale, the point-based in situ observations include errors [29,31]. To date, some studies have shown that the triple collocation method and other upscaling methods can limit the errors due to the mismatch of the spatial scale and vertical depth, leading to a precise evaluation of the quality of satellite-based soil moisture products [44,46,47]. Therefore, we should be cautious regarding the interpretation of the comparison between the SMAP product and in situ observations.
Table 1 and Table 2 and Figure 4 and Figure 5 show that the overall bias value between the SMAP soil moisture and in situ soil moisture over the entirety of China is 0.058 cm3·cm−3, and that the average biases for different geographical zones and land cover types are greater than zero, except for that for the barren land cover. Consequently, SMAP soil moisture retrievals may overestimate the soil moisture. Based on the known mismatch in the vertical representative depth between satellite retrievals and in situ measurements (i.e., the L-band radiometer detects soil moisture to a depth of 5 cm, whereas the CMA monitoring stations observe soil moisture at a depth of 10 cm), the biases between the SMAP soil moisture values and the CMA in situ soil moisture values are likely to be negative, while the statistical results are the opposite. Figure 6e shows detailed information on the spatial distribution of bias values: 170 biases are negative and are mainly associated with the croplands and grasslands in northern China, and 485 biases are positive and are mainly associated with the croplands and forest in southern China. Therefore, to some extent, the SMAP soil moisture product overestimates soil moisture in southern China (a relatively wet area). Chan et al. (2016) also found that the biases between the SMAP soil moisture product and sparse in situ site networks are positive for some land cover types. Entekhabi et al. (2014) mainly attributed the bias to the error in the estimate of the true surface soil moisture across a 36 km cell, but the study of Miernecki et al. (2014) used tower-based radiometer data over a vineyard field to show that the biases based on different soil moisture retrieval approaches varied greatly, indicating that the limitations of the soil moisture retrieval approach also contribute to the bias. The causes of the overestimation and underestimation of soil moisture over continental China are complicated, including mismatches in the spatial scale [48], the uncertainties associated with limited parameterizations affecting SMAP soil moisture retrievals [19,30], and the uncertainty associated with the ground-based measurement sensors [28]. Although the mismatches in the spatial scale and the uncertainties associated with the ground-based measurement sensors contribute to the bias, variations in soil moisture and temperature lead to the obviously non-uniform distributions in the positive and negative biases over continental China. The topsoil volumetric water content can affect the effective soil roughness and the soil temperature can affect parameters in the mixed dielectric models, which are not taken into account in the SMAP soil moisture retrieval approach. Thus, the soil moisture and temperature are two crucial factors leading to the overestimated soil moisture values in wet areas (in southern China), regardless of the different land cover types. In addition, the vegetation geometry and the vegetation water content (VWC) affect the accuracy of the soil moisture retrievals, due to the radiative transfer model in the vegetated area [29,49,50]. Generally, the geometry parameter of vegetation is difficult to estimate. Therefore, the vegetation geometry was not taken into account for the SMAP soil moisture retrieval approach. The VWC was estimated using MODIS-derived NDVI data, but the estimation of the VWC, especially for dense forest, was highly uncertain. These factors contribute to the relatively high biases of forest areas compared with the biases of other land cover types. Thus, the SMAP soil moisture retrievals are significantly overestimated over forest areas. Forests are mainly distributed in the East China, South China, and Southwest China zones, and the relatively high biases in the forest corresponds to the relatively high biases in the East China, South China, and Southwest China zones (Table 1 and Figure 4 and Figure 6). Further detailed analysis, including new field measurement experiments across China, is needed in the future.
In this study, the RMSE and ubRMSE values from the original data and anomaly data were calculated. The average RMSE and ubRMSE values from the original data over the entirety of China were 0.108 cm3·cm−3 and 0.058 cm3·cm−3, respectively. The RMSE between the SMAP soil moisture product and in situ moisture measurements from the original data represents the absolute difference in soil moisture levels, but includes the systematic errors associated with the mismatches in the spatial scale and vertical depth, among others. The ubRMSE from the original data, which involves the removal of the bulk of the systematic error, represents the absolute random errors in the soil moisture measurements. Table 1 shows that the average ubRMSE from the original data is greater than 0.04 cm3·cm−3 (the desired accuracy of the SMAP mission). The ubRMSE is the key metric to evaluating the accuracy of the SMAP soil moisture product. Considering that the upscaling error was not completely removed, the computed ubRMSE values are, to some extent, less than 0.06 cm3·cm−3, which could indicate that the SMAP radiometer soil moisture product captures the absolute soil moisture relatively well over continental China. Moreover, compared with the average ubRMSE values of other land cover types, the average ubRMSE value of croplands is the largest. Generally, the soil surface roughness of the croplands, which are affected by frequent tillage practices, changes over time. However, in this study, the soil surface roughness was assumed to be constant, contributing to the relatively high ubRMSE value for croplands. In addition, the average ubRMSE value from the anomaly data over the entirety of China is 0.039 cm3·cm−3, which is less than 0.04 cm3·cm−3. Therefore, the SMAP radiometer soil moisture product accurately captures short-term variability in soil moisture. Figure 6 shows that the sites with large differences between the SMAP soil moisture product and the in situ observations are mainly distributed in the Northeast China and East China zones. Generally, satellite-based soil moisture algorithms cannot accurately estimate the soil moisture under frozen conditions, due to the large changes in the dielectric constant of the soil [29,39]. Seasonally frozen soil exists in the Northeast China zone, which may be responsible for the large retrieval error in the SMAP radiometer soil moisture product in this area. Additionally, many studies have shown that L-band radio frequency interference (RFI) remains a challenging issue in the East China zone (e.g., Jiangsu and Zhejiang provinces) [29,51], and may be a major source of error contributing to the overestimation of the SMAP radiometer soil moisture product in this area.

5. Conclusions

This paper made a preliminary evaluation of the SMAP radiometer soil moisture product using sparse in situ measurements to offer a realistic understanding of the errors associated with the L-band SMAP satellite-based soil moisture product over continental China. The average ubRMSE value over the entirety of China from the original data was 0.058 cm3·cm−3, which is greater than 0.04 cm3·cm−3, but less than 0.06 cm3·cm−3. However, the ubRMSE value from the anomaly data was 0.039 cm3·cm−3. The SMAP radiometer soil moisture product performs relatively well at capturing the absolute soil moisture and short-term variability in soil moisture. In addition, the values of the SMAP radiometer soil moisture product were overestimated in wet areas (especially the South China, Southeast China, Southwest China, East China, and Central China zones). The surface soil effective roughness and the vegetation (especially dense forests) were the key factors contributing to the overestimation of the SMAP soil moisture product. Moreover, the error associated with the surface soil roughness is responsible for the low accuracy of the soil moisture product over croplands. Additionally, RFI is a potential error source contributing to the overestimation over the northern area of the East China zone, and seasonally frozen soils may be error sources contributing to the low accuracies over the Northeast China zone.
In the study, the sampling error was not fully removed, which, to some extent, impacts the precision of the validation of the SMAP radiometer soil moisture product. In future work, the validation of the SMAP soil moisture product will be performed in conjunction with dense ground measurements and model-based products, and a detailed error source analysis will be conducted.

Acknowledgments

This work was supported by High Resolution Earth Observation System Program of China under Grant 08-Y30B07-9001-13/15, the State Key Program of National Natural Science of China under Grant 51420105014, the Natural Science Foundation of China under Grant 41501415 and the Natural Science Foundation of China under Grant 41601569. The authors would like to thank the Jet Propulsion Laboratory and NSIDC for making the SMAP data publicly available, and providing land cover classifications derived from the Boston University MOD12Q1 V004 MODIS/Terra 1 km Land Cover Product.

Author Contributions

All authors have been involved in the discussions and participated in the writing of the manuscript. The specific contributions of each author in the paper are listed. Yayong Sun processed data and wrote the paper. Shifeng Huang contributed important ideas and considerations. Jianwei Ma provided the scientific direction, defined the structure of the manuscript, and edited it extensively. Jiren Li provided scientific counseling. Xiaotao Li contributed to the discussion and provided insight into the next steps to be taken. Hui Wang, Sheng Chen, and Wenbin Zang provided quality-controlled data from the CMA monitoring stations, generated pictures, and edited the manuscript.

Conflicts of Interest

The authors declare no conflict of interest.

References

  1. Entekhabi, D.; Rodrigueziturbe, I.; Bras, R.L. Variability in large-scale water balance with land surface atmosphere interaction. J. Clim. 1992, 5, 798–813. [Google Scholar] [CrossRef]
  2. Jackson, T.J. Passive microwave remote sensing of soil moisture and regional drought monitoring. In Monitoring and Predicting Agricultural Drought: A Global Study; Oxford University Press: Oxford, UK, 2005. [Google Scholar]
  3. Drusch, M. Initializing numerical weather prediction models with satellite-derived surface soil moisture: Data assimilation experiments with ECMWF’s integrated forecast system and the TMI soil moisture data set. J. Geophys. Res. Atmos. 2007, 112. [Google Scholar] [CrossRef]
  4. Wu, Q.; Liu, H.; Wang, L.; Deng, C. Evaluation of AMSR2 soil moisture products over the contiguous United States using in situ data from the International Soil Moisture Network. Int. J. Earth Obs. 2016, 45, 187–199. [Google Scholar] [CrossRef]
  5. Dorigo, W.A.; Wagner, W.; Hohensinn, R.; Hahn, S.; Paulik, C.; Xaver, A.; Gruber, A.; Drusch, M.; Mecklenburg, S.; Van Oevelen, P.; et al. The International Soil Moisture Network: A data hosting facility for global in situ soil moisture measurements. Hydrol. Earth Syst. Sci. 2011, 15, 1675–1698. [Google Scholar] [CrossRef]
  6. Dorigo, W.; Xaver, A.; Vreugdenhil, M.; Gruber, A.; Hegyiová, A.; Sanchis-Dufau, A.; Zamojski, D.; Cordes, C.; Wagner, W.; Drusch, M. Global automated quality control of in situ soil moisture data from the International Soil Moisture Network. Vadose Zone J. 2013, 12. [Google Scholar] [CrossRef]
  7. Schaefer, G.L.; Cosh, M.H.; Jackson, T.J. The USDA natural resources conservation service soil climate analysis network (SCAN). J. Atmos. Ocean. Technol. 2007, 24, 2073–2077. [Google Scholar] [CrossRef]
  8. An, R.; Zhang, L.; Wang, Z.; Quaye-Ballard, J.A.; You, J.; Shen, X.; Gao, W.; Zhao, Y.; Ke, Z. Validation of the ESA CCI soil moisture product in China. Int. J. Earth Obs. 2016, 48, 28–36. [Google Scholar] [CrossRef]
  9. Leng, P.; Song, X.; Li, Z.L.; Ma, J.; Zhou, F.; Li, S. Bare surface soil moisture retrieval from the synergistic use of optical and thermal infrared data. Int. J. Remote Sens. 2014, 35, 988–1003. [Google Scholar] [CrossRef]
  10. Leng, P.; Song, X.; Duan, S.B.; Li, Z.L. A practical algorithm for estimating surface soil moisture using combined optical and thermal infrared data. Int. J. Appl. Earth Obs. 2016, 52, 338–348. [Google Scholar] [CrossRef]
  11. Leng, P.; Song, X.; Duan, S.B.; Li, Z.L. Generation of continuous surface soil moisture dataset using combined optical and thermal infrared images. Hydrol. Process. 2016. [Google Scholar] [CrossRef]
  12. Schmugge, T. Remote sensing of surface soil moisture. J. Appl. Meteorol. 1978, 17, 1549–1557. [Google Scholar] [CrossRef]
  13. de Jeu, R.A.M.; Wagner, W.; Holmes, T.R.H.; Dolman, A.J.; Giesen, N.C.; Friesen, J. Global soil moisture patterns observed by space borne microwave radiometers and scatterometers. Surv. Geophys. 2008, 29, 399–420. [Google Scholar] [CrossRef] [Green Version]
  14. Chen, Y.; Yang, K.; Qin, J.; Zhao, L.; Tang, W.; Han, M. Evaluation of AMSR-E retrievals and GLDAS simulations against observations of a soil moisture network on the central Tibetan Plateau. J. Geophys. Res. Atmos. 2013, 118, 4466–4475. [Google Scholar] [CrossRef]
  15. Owe, M.; de Jeu, R.; Holmes, T. Multisensor historical climatology of satellite-derived global land surface moisture. J. Geophys. Res. Earth Surf. 2008, 113. [Google Scholar] [CrossRef] [Green Version]
  16. Njoku, E.G.; Jackson, T.J.; Lakshmi, V.; Chan, T.K.; Nghiem, S.V. Soil moisture retrieval from AMSR-E. IEEE Trans. Geosci. Remote Sens. 2003, 41, 215–229. [Google Scholar] [CrossRef]
  17. Owe, M.; De Jeu, R.; Walker, J. A methodology for surface soil moisture and vegetation optical depth retrieval using the microwave polarization difference index. IEEE Trans. Geosci. Remote Sens. 2001, 39, 1643–1654. [Google Scholar] [CrossRef]
  18. Koike, T.; Nakamura, Y.; Kaihotsu, I.; Davva, G.; Matsuura, N.; Tamagawa, K.; Fujii, H. Development of an advanced microwave scanning radiometer (AMSR-E) algorithm of soil moisture and vegetation water content. J. Hydraul. Eng. 2004, 48, 217–222. [Google Scholar] [CrossRef]
  19. Kim, S.; Liu, Y.Y.; Johnson, F.M.; Parinussa, R.M.; Sharma, A. A global comparison of alternate AMSR2 soil moisture products: Why do they differ. Remote Sens. Environ. 2015, 161, 43–62. [Google Scholar] [CrossRef]
  20. Kerr, Y.H.; Waldteufel, P.; Wigneron, J.P.; Delwart, S.; Cabot, F.; Boutin, J.; Mecklenburg, S. The SMOS mission: New tool for monitoring key elements of the global water cycle. Proc. IEEE 2010, 98, 666–687. [Google Scholar] [CrossRef] [Green Version]
  21. Van der Schalie, R.; Parinussa, R.M.; Renzullo, L.J.; van Dijk, A.I.J.M.; Su, C.H.; de Jeu, R.A.M. SMOS soil moisture retrievals using the land parameter retrieval model: Evaluation over the Murrumbidgee Catchment, southeast Australia. Remote Sens. Environ. 2015, 163, 70–79. [Google Scholar] [CrossRef]
  22. Wagner, W.; Lemoine, G.; Rott, H. A method for estimating soil moisture from ERS scatterometer and soil data. Remote Sens. Environ. 1999, 70, 191–207. [Google Scholar] [CrossRef]
  23. Wagner, W.; Hahn, S.; Kidd, R.; Melzer, T.; Bartalis, Z.; Hasenauer, S.; Steinnocher, K. The ASCAT soil moisture product: A reviewof its specifications, validation results, and emerging applications. Meteorol. Z. 2013, 22, 5–33. [Google Scholar]
  24. Bartalis, Z.; Wagner, W.; Naeimi, V.; Hasenauer, S.; Scipal, K.; Bonekamp, H.; Figa, J.; Anderson, C. Initial soil moisture retrievals from the METOP-A Advanced Scatterometer (ASCAT). Geophys. Res. Lett. 2007, 34. [Google Scholar] [CrossRef]
  25. Albergel, C.; Rüdiger, C.; Carrer, D.; Calvet, J.C.; Fritz, N.; Naeimi, V.; Bartalis, Z.; Hasenauer, S. An evaluation of ASCAT surface soil moisture products with in-situ observations in Southwestern France. Hydrol. Earth Syst. Sci. 2009, 13, 115–124. [Google Scholar] [CrossRef]
  26. Jackson, T.J.; Cosh, M.H.; Bindlish, R.; Starks, P.J.; Bosch, D.D.; Seyfried, M.; Goodrich, D.C.; Moran, M.S.; Du, J. Validation of advanced microwave scanning radiometer soil moisture products. IEEE Trans. Geosci. Remote Sens. 2010, 48, 4256–4272. [Google Scholar] [CrossRef]
  27. Jackson, T.J.; Bindlish, R.; Cosh, M.H.; Zhao, T.; Starks, P.J.; Bosch, D.D.; Seyfried, M.; Moran, M.S.; Goodrich, D.C.; Kerr, Y.H.; et al. Validation of soilmoisture and ocean salinity (SMOS) soil moisture over watershed networks inthe U.S. IEEE Trans. Geosci. Remote Sens. 2012, 50, 1530–1543. [Google Scholar] [CrossRef] [Green Version]
  28. Zhao, L.; Yang, K.; Qin, J.; Chen, Y.; Tang, W.; Montzka, C.; Wu, H.; Lin, C.; Han, M.; Vereecken, H. Spatiotemporal analysis of soil moisture observations within a Tibetan mesoscale area and its implication to regional soil moisture measurements. J. Hydrol. 2013, 482, 92–104. [Google Scholar] [CrossRef]
  29. Zeng, J.; Li, Z.; Chen, Q.; Bi, H.; Qiu, J.; Zou, P. Evaluation of remotely sensed and reanalysis soil moisture products over the Tibetan Plateau using in-situ observations. Remote Sens. Environ. 2015, 163, 91–110. [Google Scholar] [CrossRef]
  30. Zeng, J.; Chen, K.S.; Bi, H.; Chen, Q. A Preliminary Evaluation of the SMAP Radiometer Soil Moisture Product over United States and Europe Using Ground-Based Measurements. IEEE Trans. Geosci. Remote Sens. 2016, 54, 4929–4940. [Google Scholar] [CrossRef]
  31. Dorigo, W.A.; Gruber, A.; De Jeu, R.A.M.; Wanger, W.; Stacke, T.; Loew, A.; Albergel, C.; Brocca, L.; Chung, D.; Parinussa, R.M.; et al. Evaluation of the ESA CCI soil moisture product using ground-based observations. Remote Sens. Environ. 2015, 162, 380–395. [Google Scholar] [CrossRef]
  32. Griesfeller, A.; Lahoz, W.A.; de Jeu, R.A.M.; Dorigo, W.; Haugen, L.E.; Svendby, T.M.; Wanger, W. Evaluation of satellite soil moisture products over Norway using ground-based observations. Int. J. Earth Obs. 2016, 45, 155–164. [Google Scholar] [CrossRef]
  33. Polcher, J.; Piles, M.; Gelati, E.; Barella-Ortiz, A.; Tello, M. Comparing surface-soil moisture from the SMOS mission and the ORCHIDEE land-surface model over the Iberian Peninsula. Remote Sens. Environ. 2016, 174, 69–81. [Google Scholar] [CrossRef]
  34. Zawadzki, J.; Kędzior, M. Soil moisture variability over Odra watershed: Comparison between SMOS and GLDAS data. Int. J. Earth Obs. 2016, 45, 110–124. [Google Scholar] [CrossRef]
  35. Kerr, Y.H.; Al-Yaari, A.; Rodriguez-Fernandez, N.; Parrens, M.; Molero, B.; Leroux, D.; Bircher, S.; Mahmoodi, A.; Mialon, A.; Richaume, P.; et al. Overview of SMOS performance in terms of global soil moisture monitoring after six years in operation. Remote Sens. Environ. 2016, 180, 40–63. [Google Scholar] [CrossRef]
  36. Fascetti, F.; Pierdicca, N.; Pulvirenti, L.; Crapolicchio, R.; Muñozsabater, J. A comparison of ASCAT and SMOS soil moisture retrievals over Europe and northern Africa from 2010 to 2013. Int. J. Earth Obs. 2016, 45, 135–142. [Google Scholar] [CrossRef]
  37. Entekhabi, D.; Njoku, E.G.; O’Neill, P.E.; Kellogg, K.H.; Crow, W.T.; Edelstein, W.N.; Entin, J.K.; Goodman, S.D.; Jackson, T.J.; Johnson, J.; et al. The Soil Moisture Active Passive (SMAP) mission. Proc. IEEE 2010, 98, 704–716. [Google Scholar] [CrossRef]
  38. Dorigo, W.A.; Scipal, K.; Parinussa, R.M.; Liu, Y.Y.; Wagner, W.; de Jeu, R.A.M.; Naeimi1, V. Error characterisation of global active and passive microwave soil moisture datasets. Hydrol. Earth Syst. Sci. 2010, 14, 2605–2616. [Google Scholar] [CrossRef] [Green Version]
  39. Entekhabi, D.; Yueh, S.; O’Neill, P.E.; Kellogg, K.H.; Allen, A.; Bindlish, R.; Brown, M.; Chan, S.; Colliander, A.; Crow, W.T.; et al. SMAP Handbook, JPL Publication JPL 400-1567; Jet Propulsion Laboratory: Pasadena, CA, USA, 2014; p. 182. [Google Scholar]
  40. Miernecki, M.; Wigneron, J.P.; Lopez-Baeza, E.; Kerr, Y.; Jeu, R.D.; Lannoy, G.J.M.D.; Jackson, T.J.; O’Neill, P.E.; Schwank, M.; Moran, R.F.; et al. Comparison of SMOS and SMAP soil moisture retrieval approaches using tower-based radiometer data over a vineyard field. Remote Sens. Environ. 2014, 154, 89–101. [Google Scholar] [CrossRef]
  41. Zhu, Y. China relief; the trisected scale terrace. J. South China Normal Univ. (Nat. Sci.) 1989, 2, 011. [Google Scholar]
  42. Zhou, G.; Zhang, X. Study on climate-vegetation classification for global change in China. Acta Bot. Sin. 1995, 38, 8–17. [Google Scholar]
  43. Brodzik, M.J.; Knowles, K. EASE-Grid 2.0 Land Cover Classifications from Boston University MODIS/Terra Land Cover Data; NASA National Snow and Ice Data Center Distributed Active Archive Center: Boulder, CO, USA, 2010.
  44. Draper, C.S.; Walker, J.P.; Steinle, P.J.; de Jeu, R.A.M.; Holmes, T.R.H. An evaluation of AMSR-E derived soil moisture over Australia. Remote Sens. Environ. 2009, 113, 703–710. [Google Scholar] [CrossRef]
  45. Crow, W.T.; Berg, A.A.; Cosh, M.H.; Loew, A.; Mohanty, B.P.; Panciera, R.; Rosnay, P.; Ryu, D.; Walker, J.P. Upscaling sparse ground-based soil moisture observations for the validation of coarse-resolution satellite soil moisture products. Rev. Geophys. 2012, 50. [Google Scholar] [CrossRef]
  46. Scipal, K.T.; Holmes, T.R.H.; de Jeu, R.A.M.; Naeimi, V.; Wagner, W. A possible solution for the problem of estimating the error structure of global soil moisture data sets. Geophys. Res. Lett. 2008, 35. [Google Scholar] [CrossRef] [Green Version]
  47. Chen, F.; Crow, W.T.; Colliander, A.; Cosh, M.H. Application of triple collocation in ground-based validation of Soil Moisture Active/Passive (SMAP) level 2 data products. IEEE J.-STARS 2016. [Google Scholar] [CrossRef]
  48. Chan, S.K.; Bindlish, R.; O’Neill, P.E.; Njoku, E.; Jackson, T.; Colliander, A.; Chen, F.; Burgin, M.; Dunbar, S.; Piepmeier, J.; et al. Assessment of the SMAP Passive Soil Moisture Product. IEEE Trans. Geosci. Remote Sens. 2016, 54, 4994–5007. [Google Scholar] [CrossRef]
  49. Jackson, T.; Schmugge, T. Vegetation effects on the microwave emission of soils. Remote Sens. Environ. 1991, 36, 203–212. [Google Scholar] [CrossRef]
  50. Kerr, Y.; Waldteufel, P.; Richaume, P.; Ferrazzoli, P.; Wigneron, J.P. SMOS Level 2 Processor Soil Moisture Algorithm Theoretical Basis Document (ATBD) V4.a; SM-ESL (CBSA): Toulouse, France, 2014; p. 142. [Google Scholar]
  51. Wang, X.; Wang, X.; Han, Z. Radio Frequency Interference Detection and Characteristic Analysis Based on the L Band Stokes Parameters Remote Sensing Data. JEIT 2015, 37, 2342–2348. [Google Scholar]
Figure 1. The spatial distribution of the seven geographical zones and 655 CMA monitoring stations across continental China.
Remotesensing 09 00292 g001
Figure 2. The composited SMAP daily radiometer soil moisture data on 1 June 2016.
Remotesensing 09 00292 g002
Figure 3. The spatial distribution of seven land cover types and 655 CMA monitoring stations in continental China.
Remotesensing 09 00292 g003
Figure 4. Evaluation of SMAP soil moisture retrievals relative to in situ soil moisture observations based on original data over the different land cover types and geographical zones in continental China. The presented data are the median (the horizontal line inside each box), 1st quantile Q1, and 3rd quantile Q3 (the bottom and top of the box, respectively), and the 90th and 10th percentiles (the whiskers, i.e., error bars, above and below the box).
Remotesensing 09 00292 g004
Figure 5. Evaluation of SMAP soil moisture retrievals relative to in situ soil moisture observations based on anomaly data over the different land cover types and geographical zones in continental China. The presented data are the median (the horizontal line inside each box), 1st quantile Q1, and 3rd quantile Q3 (the bottom and top of the box, respectively), and the 90th and 10th percentiles (the whiskers, i.e., error bars, above and below the box).
Remotesensing 09 00292 g005
Figure 6. Spatial distribution of four metrics, i.e., bias, RMSE, ubRMSE, and R, between SMAP soil moisture retrievals and in situ observations. (ae) are based on the original data; (fh) are based on the anomaly data.
Remotesensing 09 00292 g006
Table 1. The differences between SMAP radiometer soil moisture retrievals and in situ soil moisture observations over continental China based on the original data (1 April 2015—31 August 2016).
No. of SitesBiasRMSEubRMSERDensity of Sites (Per Million km2)
All of China6550.0580.1080.0590.44
Geographical ZonesNortheast 1070.0120.1060.0750.35137
Northwest340.0030.0700.0470.4112
North 900.0000.0680.0560.4260
East 810.1210.1560.0700.36147
Central 830.0660.1120.0570.48104
South 630.0960.1220.0410.53140
Southwest 1970.0770.1080.0550.4999
Land CoverEvergreen Forest330.1360.1580.0470.5241
Deciduous Forest150.1140.1360.0560.5450
Mixed Forest960.0980.1250.0550.45480
Shrublands670.0530.0890.0470.54124
Grasslands790.0260.0750.0540.4624
Croplands3570.0470.1090.0640.41162
Barren8−0.0290.0830.0560.214
Table 2. The differences between SMAP radiometer soil moisture retrievals and in situ soil moisture observations over continental China based on anomaly data (1 April 2015–31 August 2016).
No. of SitesBiasRMSEubRMSERDensity of Sites (Per Million km2)
All of China6550.000090.0390.0390.39
Geographical ZonesNortheast1070.000020.0490.049137137
Northwest 340.000100.0350.0351212
North 900.000150.0430.0436060
East 810.000070.0360.036147147
Central 83−0.000130.0390.039104104
South 630.000040.0310.031140140
Southwest 1970.000210.0370.0379999
Land CoverEvergreen Forest330.000120.0330.0330.4641
Deciduous Forest150.000130.0400.0400.3750
Mixed Forest960.000260.0390.0390.32480
Shrublands670.000010.0330.0330.40124
Grasslands790.000100.0400.0400.3724
Croplands3570.000050.0410.0410.41162
Barren80.000160.0410.0410.164

