Population Reference Values for Serum Methylmalonic Acid Concentrations and Its Relationship with Age, Sex, Race-Ethnicity, Supplement Use, Kidney Function and Serum Vitamin B12 in the Post-Folic Acid Fortification Period


Abstract
:1. Background
2. Methods
2.1. Description of Survey and Study Sample
2.2. Measurements
2.3. Statistical Analysis
3. Results
4. Discussion
5. Conclusions
Acknowledgments
Author Contributions
Conflicts of Interest
References
- Bae, S.; West, A.A.; Yan, J.; Jiang, X.; Perry, C.A.; Malysheva, O.; Stabler, S.P.; Allen, R.H.; Caudill, M.A. Vitamin B-12 status differs among pregnant, lactating and control women with equivalent nutrient intakes. J. Nutr. 2015, 145, 1507–1514. [Google Scholar] [CrossRef] [PubMed]
- Stabler, S.P.; Lindenbaum, J.; Allen, R.H. The use of homocysteine and other metabolites in the specific diagnosis of vitamin B-12 deficiency. J. Nutr. 1996, 126, 1266S–1272S. [Google Scholar] [PubMed]
- Wolters, M.; Strohle, A.; Hahn, A. Cobalamin: A critical vitamin in the elderly. Prev. Med. 2004, 39, 1256–1266. [Google Scholar] [CrossRef] [PubMed]
- Wajner, M.; Coelho, J.C. Neurological dysfunction in methylmalonic academia is probably related to the inhibitory effect of methylmalonate on brain energy production. J. Inherit. Metab. Dis. 1997, 20, 761–768. [Google Scholar] [CrossRef] [PubMed]
- Morath, M.A.; Okun, J.G.; Muller, L.B.; Sauer, S.W.; Horster, F.; Hoffmannn, G.F.; Kolker, S. Neurodegeneration and chronic renal failure in methylmalonic aciduria—A pathophysiological approach. J. Inherit. Metab. Dis. 2008, 31, 35–43. [Google Scholar] [CrossRef] [PubMed]
- Aparicio-Ugarriza, R.; Palacios, G.; Alder, M.; Gonzalez-Gross, M.A. A review of the cut-off points for the diagnosis of vitamin B12 deficiency in the general population. Clin. Chem. Lab. Med. 2015, 53, 1149–1159. [Google Scholar] [CrossRef] [PubMed]
- Stabler, S.P. Clinical practice. Vitamin b12 deficiency. N. Engl. J. Med. 2013, 368, 149–160. [Google Scholar] [CrossRef] [PubMed]
- Morris, M.S.; Jacques, P.F.; Rosenberg, I.H.; Selhub, J. Elevated serum methylmalonic acid concentrations are common among elderly Americans. J. Nutr. 2002, 132, 2799–2803. [Google Scholar] [PubMed]
- Selhub, J.; Morris, M.S.; Jacques, P.F. In vitamin B-12 deficiency, higher serum folate is associated with increased total homocysteine and methylmalonic acid concentrations. Proc. Natl. Acad. Sci. USA 2007, 104, 19995–20000. [Google Scholar] [CrossRef] [PubMed]
- Morris, M.S.; Jacques, P.F.; Rosenberg, I.H.; Selhub, J. Folate and vitamin B-12 status in relation to anemia, macrocytosis and cognitive impairment in older Americans in the age of folic acid fortification. Am. J. Clin. Nutr. 2007, 85, 193–200. [Google Scholar] [PubMed]
- Lindenbaum, J.; Rosenberg, I.H.; Wilson, P.W.F.; Stabler, S.; Allen, R.H. Prevalence of cobalamin deficiency in the Framingham elderly population. Am. J. Clin. Nutr. 1994, 60, 2–11. [Google Scholar] [CrossRef] [PubMed]
- Stabler, S.P.; Allen, R.H.; Fried, L.P.; Pahor, M.; Kittner, S.J.; Penninx, B.W.J.H.; Guralnik, J.M. Racial differences in prevalence of cobalamin and folate deficiencies in disabled elderly women. Am. J. Clin. Nutr. 1999, 70, 911–919. [Google Scholar] [PubMed]
- Carmel, R.; Green, R.; Jacobsen, D.W.; Rasmussen, K.; Florea, M.; Azen, C. Serum cobalamin, homocysteine and methylmalonic acid concentrations in a multiethnic elderly population: Ethnic and sex differences in cobalamin and metabolite abnormalities. Am. J. Clin. Nutr. 1999, 70, 904–910. [Google Scholar] [PubMed]
- National Center for Health Statistics. National Health and Nutrition Examination Survey. 1999–2000; Public Use Data Files; Center for Disease Control and Prevention Home Page. Available online: http://www.cdc.gov/nchs/about/major/nhanes/NHANES99-00.htm (accessed on 29 May 2017).
- National Center for Health Statistics. National Health and Nutrition Examination Survey. 2001–2002; Public Use Data Files; Center for Disease Control and Prevention Home Page. Available online: http://www.cdc.gov/nchs/about/major/nhanes/NHANES01-02.htm (accessed on 29 May 2017).
- National Center for Health Statistics. National Health and Nutrition Examination Survey. 2003–2004; Public Use Data Files; Center for Disease Control and Prevention Home Page. Available online: http://www.cdc.gov/nchs/about/major/nhanes/NHANES01-02.htm (accessed on 29 May 2017).
- National Center for Health Statistics. National Health and Nutrition Examination Survey. 1999–2000; Survey Operations Manuals, Brochures, Consent Documents; March 2001; Centers for Disease Control and Prevention Home Page. Available online: http://www.cdc.gov/nchs/about/major/nhanes/nhanes99_00.htm (accessed on 29 May 2017).
- National Center for Health Statistics. National Health and Nutrition Examination Survey. 2001–2002; Survey Operations Manuals, Brochures, Consent Documents; March 2001; Centers for Disease Control and Prevention Home Page. Available online: http://www.cdc.gov/nchs/about/major/nhanes/current_nhanes_01_02.htm (accessed on 29 May 2017).
- National Center for Health Statistics. National Health and Nutrition Examination Survey. 2003–2004; Survey Operations Manuals, Brochures, Consent Documents; March 2001; Centers for Disease Control and Prevention Home Page. Available online: http://www.cdc.gov/nchs/about/major/nhanes/nhanes2003-2004/current_nhanes_03_04.htm (accessed on 29 May 2017).
- National Center for Health Statistics. National Health and Nutrition Examination Survey. 2003–2004; Laboratory Methods, 1999–2000; Centers for Disease Control and Prevention Home Page. Available online: http://www.cdc.gov/nchs/about/major/nhanes/lab_methods99_00.htm (accessed on 29 May 2017).
- National Center for Health Statistics. National Health and Nutrition Examination Survey. 2003–2004; Laboratory Methods, 2001–2002; Centers for Disease Control and Prevention Home Page. Available online: http://www.cdc.gov/nchs/about/major/nhanes/lab_methods01_02.htm (accessed on 29 May 2017).
- National Center for Health Statistics. National Health and Nutrition Examination Survey. 2003–2004; Laboratory Methods, 2003–2004; Centers for Disease Control and Prevention Home Page. Available online: http://www.cdc.gov/nchs/about/major/nhanes/lab_methods03_04.htm (accessed on 29 May 2017).
- Horster, F.; Baumgartner, M.R.; Viardot, C.; Suormala, T.; Burgard, P.; Fowler, B.; Hoffmann, G.F.; Garbade, S.F.; Kölker, S.; Baumgartner, E.R. Long-term outcome in methylmalonic acidurias is influenced by the underlying defect (mut0, mut-, cblA, cblB). Pediatr. Res. 2007, 62, 225–230. [Google Scholar] [CrossRef] [PubMed]
- Mikkelsen, K.; Stojanovska, L.; Apostolopoulos, V. The effects of vitamin B in depression. Curr. Med. Chem. 2016, 23, 4317–4337. [Google Scholar] [CrossRef] [PubMed]
- Johnson, M.A.; Hawthorne, N.A.; Brackett, W.R.; Fischer, J.G.; Gunter, E.W.; Allen, R.H.; Stabler, S.P. Hyperhomocysteinemia and vitamin B-12 deficiency in elderly using title IIIc nutrition service. Am. J. Clin. Nutr. 2003, 77, 211–220. [Google Scholar] [PubMed]
- Clarke, R.; Birks, J.; Nexo, E.; Ueland, P.M.; Schneede, J.; Scott, J.; Molloy, A.; Evans, J.G. Low vitamin B-12 status and risk of cognitive decline in older adults. Am. J. Clin. Nutr. 2007, 86, 1384–1391. [Google Scholar] [PubMed]
- Ravaglia, G.; Forti, P.; Maioli, F.; Martelli, M.; Servadei, L.; Brunetti, N.; Porcellini, E.; Licastro, F. Homocysteine and folate as risk factors for dementia and Alzheimer’s disease. Am. J. Clin. Nutr. 2005, 82, 636–643. [Google Scholar] [PubMed]
- Tucker, K.L.; Rich, S.; Rosenberg, I.H.; Jacques, P.; Dallal, G.; Wilson, P.; Selhub, J. Plasma vitamin B-12 concentrations relate to intake source in the Framingham Offspring Study. Am. J. Clin. Nutr. 2000, 71, 514–522. [Google Scholar] [PubMed]
- Ganji, V.; Kafai, M.R. Population prevalence, attributable risk and attributable risk percentage for high methylmalonic acid concentrations in the post-folic acid fortification period in the, U.S. Nutr. Metab. 2012, 9, 2. [Google Scholar] [CrossRef] [PubMed]
- Carmel, R. Cobalamin, the stomach and aging. Am. J. Clin. Nutr. 1997, 66, 750–759. [Google Scholar] [CrossRef] [PubMed]
- Van Asselt, D.Z.; de Groot, L.C.; van Staveren, W.A.; Blom, H.L.; Wevers, R.A.; Biemond, I.; Hoefnagels, W.H. Role of cobalamin intake and atrophic gastritis in mild Cobalamin deficiency in older Dutch subjects. Am. J. Clin. Nutr. 1998, 68, 328–334. [Google Scholar] [CrossRef] [PubMed]
- Belghith, A.; Mahjoub, S.; Ben Romdhane, N. Causes of vitamin B12 deficiency. Tunis. Med. 2015, 93, 678–682. [Google Scholar] [PubMed]
- Saltzman, J.R.; Kemp, J.A.; Golner, B.B.; Pedrosa, M.C.; Dallal, G.E.; Russell, R.M. Effect of hypochlorhydria due to omeprazole treatment or atrophic gastritis on protein-bound vitamin B-12 absorption. J. Am. Coll. Nutr. 1994, 13, 584–591. [Google Scholar] [CrossRef] [PubMed]
- Molloy, A.M.; Pangilinan, F.; Mills, J.L.; Shane, B.; O’Neill, M.B.; McGaughey, D.M.; Velkova, A.; Abaan, H.O.; Ueland, P.M.; McNulty, H.; et al. A Common Polymorphism in HIBCH Influences Methylmalonic Acid Concentrations in Blood Independently of Cobalamin. Am. J. Hum. Genet. 2016, 98, 869–882. [Google Scholar] [CrossRef] [PubMed]
- Pupavac, M.; Tian, X.; Chu, J.; Wang, G.; Feng, Y.; Chen, S.; Fenter, R.; Zhang, V.W.; Wang, J.; Watkins, D.; et al. Added value of next generation gene panel analysis for patients with elevated methylmalonic acid and no clinical diagnosis following functional studies of vitamin B12 metabolism. Mol. Genet. Metab. 2016, 117, 363–368. [Google Scholar] [CrossRef] [PubMed]
- Risch, M.; Meier, D.W.; Sakem, B.; Escobar, P.; Risch, C.; Nydegger, U.; Risch, L. Vitamin B12 and folate levels in healthy Swiss senior citizens: A prospective study evaluating reference intervals and decision limits. BMC Geriatr. 2015, 15, 82. [Google Scholar] [CrossRef] [PubMed]
- Spence, J.D. Homocysteine lowering for stroke prevention: Unravelling the complicity of the evidence. Int. J. Stroke 2016, 11, 744–747. [Google Scholar] [CrossRef] [PubMed]
- Franques, J.; Chiche, L.; Mathis, S. Sensory neuropathy revealing severe vitamin B12 deficiency in a patient with anorexia nervosa: An often-forgotten reversible cause. Nutrients 2017, 9, 281. [Google Scholar] [CrossRef] [PubMed]
- Pfeiffer, C.M.; Caudill, S.P.; Gunter, E.W.; Osterloh, J.; Sampson, E.J. Biochemical indicators of B vitamin status in the US population after folic acid fortification: Results from the National Health and Nutrition Examination Survey 1999–20001. Am. J. Clin. Nutr. 2005, 82, 442–450. [Google Scholar] [PubMed]
- Herrmann, W.; Schorr, H.; Purschwitz, K.; Rassoul, F.; Richter, V. Total homocysteine, vitamin B-12 and total antioxidant status in vegetarians. Clin. Chem. 2001, 47, 1094–1101. [Google Scholar] [PubMed]
- Herbert, V.; Fong, W.; Guile, V.; Stopler, T. Low holotranscobalamin II is the earliest serum marker of subnormal vitamin B-12 absorption in patients with AIDS. Am. J. Hematol. 1990, 34, 132–139. [Google Scholar] [CrossRef] [PubMed]
- Havas, A.M.; Nexo, E. Holotranscobalamin—A first choice assay for diagnosing early vitamin B-12 deficiency. J. Intern. Med. 2005, 257, 289–298. [Google Scholar] [CrossRef] [PubMed]
- Golding, P.H. Holotranscobalamin (HoloTC, Active-B12) and Herbert’s model for the development of vitamin B12 deficiency: A review and alternative hypothesis. Springerplus 2016, 5, 668. [Google Scholar] [CrossRef] [PubMed]
- Golding, P.H. Experimental vitamin B12 deficiency in a human subject: A longitudinal investigation of the performance of the holotranscobalamin (HoloTC, Active-B12) immunoassay. Springerplus 2016, 5, 184. [Google Scholar] [CrossRef] [PubMed]
- Remacha, A.F.; Sardà, M.P.; Canals, C.; Queraltò, J.M.; Zapico, E.; Remacha, J.; Carrascosa, C. Role of serum holotranscobalamin (holoTC) in the diagnosis of patients with low serum cobalamin. Comparison with methylmalonic acid and homocysteine. Ann. Hematol. 2014, 93, 565–569. [Google Scholar] [CrossRef] [PubMed]
- Herrmann, W.; Obeid, R.; Schorr, H.; Geisel, J. Functional vitamin B12 deficiency and determination of holotranscobalamin in populations at risk. Clin. Chem. Lab. Med. 2003, 41, 1478–1488. [Google Scholar] [CrossRef] [PubMed]
- Fedosov, S.N.; Brito, A.; Miller, J.W.; Green, R.; Allen, L.H. Combined indicator of vitamin B12 status: Modification for missing biomarkers and folate status and recommendations for revised cut-points. Clin. Chem. Lab. Med. 2015, 53, 1215–1225. [Google Scholar] [CrossRef] [PubMed]


| Characteristic | Men | Women | p-Value 2 |
|---|---|---|---|
| (n = 9020) | (n = 9549) | ||
| Race-ethnicity | |||
| Non-Hispanic white, n, (%) | 3971 (48.9) | 4199 (51.1) | 0.023 |
| Non-Hispanic black, n, (%) | 2140 (45.2) | 2211 (54.8) | <0.0001 |
| Hispanic/Mexican, n, (%) | 2909 (49.7) | 3139 (50.3) | 0.72 |
| Age (year) | |||
| 12–14, n (%) | 1125 (51.1) | 1187 (48.9) | 0.41 |
| 15–17 years, n (%) | 1178 (51.4) | 1056 (48.6) | 0.30 |
| 18–40 years, n (%) | 2775 (49.7) | 3328 (50.3) | 0.63 |
| 41–65 years, n (%) | 2254 (49.1) | 2274 (50.9) | 0.16 |
| >65 years, n (%) | 1590 (42.6) | 1598 (57.4) | <0.0001 |
| Supplements use 3 | |||
| Yes, n (%) | 3222 (42.9) | 4459 (57.1) | <0.0001 |
| No, n (%) | 5798 (54.3) | 5090 (45.7) | <0.0001 |
| Serum creatinine, μmol/L (mean ± SE) | 83.4 ± 0.5 | 64.7 ± 0.4 | <0.001 |
| Serum vitamin B-12, pmol/L (mean ± SE) | 380.8 ± 7.0 | 418.5 ± 17.1 | 0.04 |
| n | Mean ± SE 2 | Percentiles | |||||
|---|---|---|---|---|---|---|---|
| 5th | 25th 3 | 50th | 75th | 95th | |||
| MMA, nmol/L | |||||||
| All subjects | 18,569 | 155.0 ± 2.1 | 69.6 | 99.4 | 129.3 | 169.4 | 297.0 |
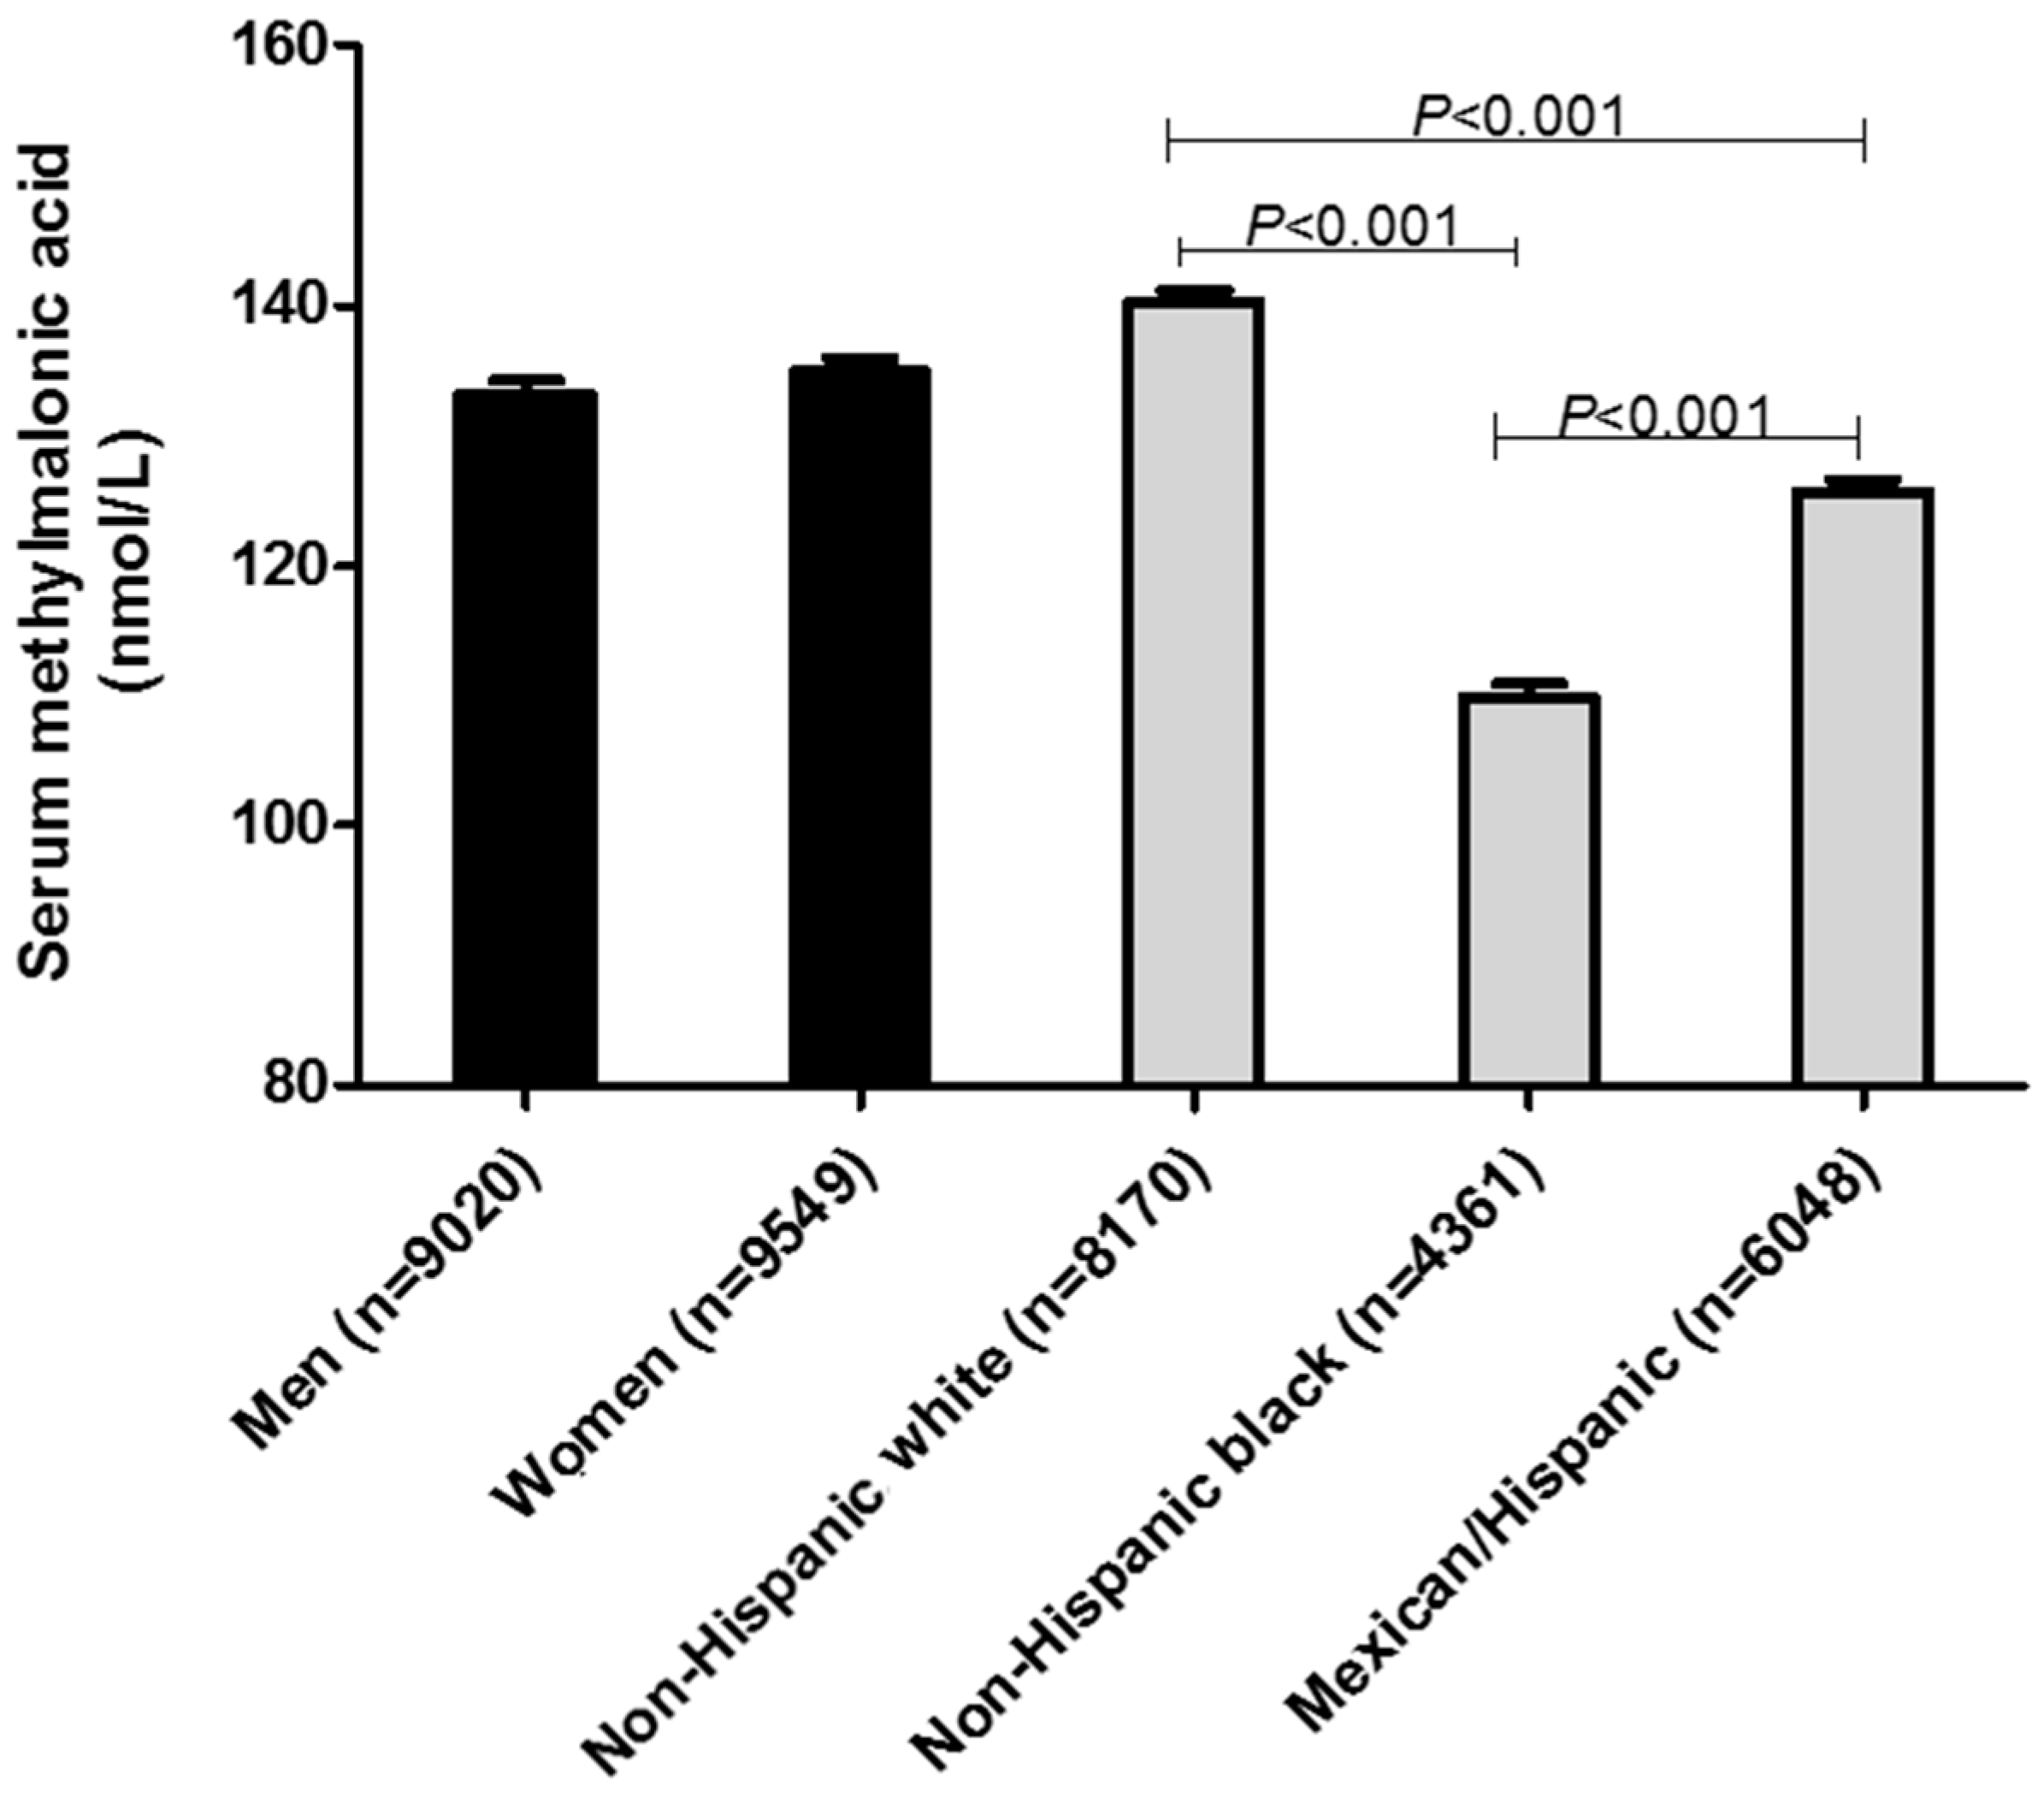
| Sex | |||||||
| Men | 9020 | 157.2 ± 2.6 | 70.0 | 100.0 | 129.7 | 169.8 | 299.2 |
| Women | 9549 | 152.9 ± 2.9 | 69.4 | 97.4 | 125.6 | 167.7 | 289.7 |
| Race-ethnicity | |||||||
| Non-Hispanic white | 8170 | 162.1 ± 2.4 | 79.0 | 106.3 | 134.4 | 179.1 | 300.0 |
| Non-Hispanic black | 4351 | 133.3 ± 8.1 | 59.8 | 83.5 | 109.1 | 139.5 | 229.9 |
| Hispanic/Mexican | 6048 | 135.7 ± 2.9 | 60.0 | 89.4 | 109.9 | 149.5 | 269.8 |
| Supplement use 4 | |||||||
| Yes | 7681 | 155.3 ± 3.2 | 69.8 | 99.5 | 129.4 | 169.2 | 281.4 |
| No | 10,888 | 154.6 ± 2.4 | 69.4 | 99.3 | 129.2 | 169.7 | 301.9 |
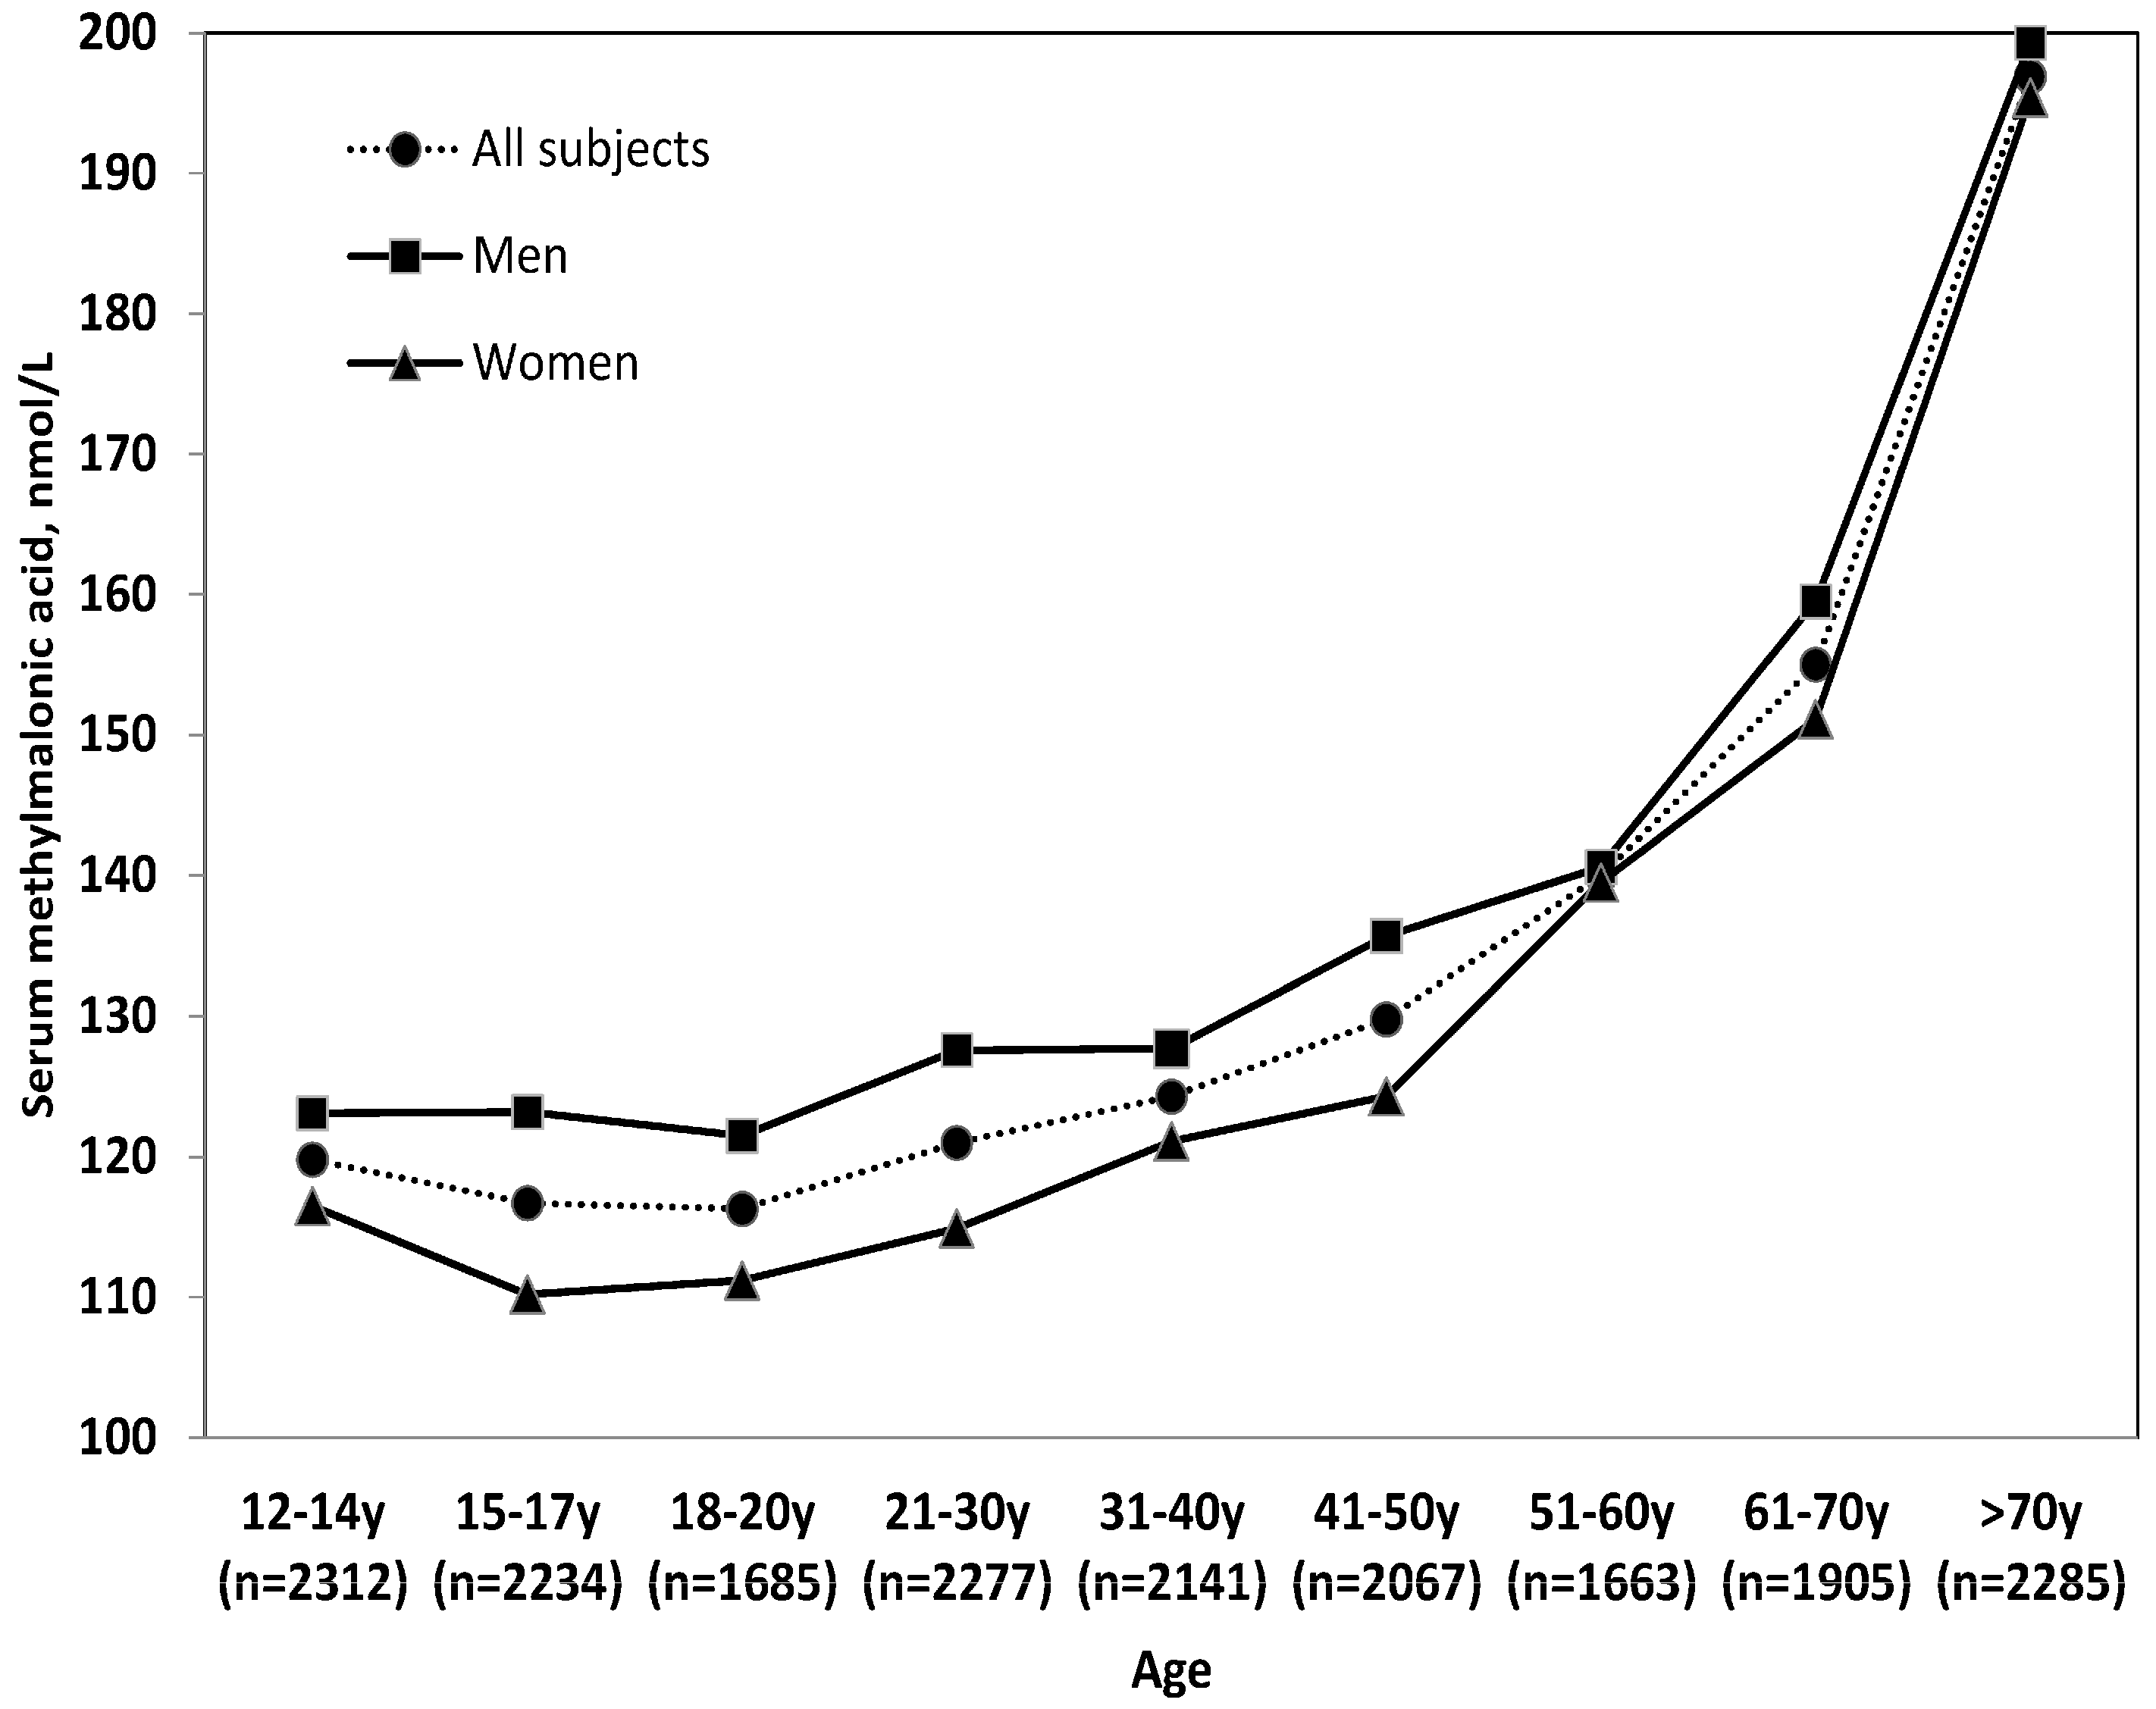
| Age (year) | |||||||
| 12–14 | 2312 | 130.0 ± 2.6 | 69.5 | 89.9 | 116.8 | 149.4 | 226.1 |
| 15–17 | 2234 | 135.8 ± 6.0 | 65.9 | 89.3 | 109.8 | 139.9 | 227.3 |
| 18–40 | 6103 | 134.1 ± 1.7 | 69.0 | 89.8 | 119.2 | 150.0 | 248.7 |
| 41–65 | 4732 | 152.4 ± 2.8 | 73.3 | 100.3 | 129.6 | 169.5 | 274.8 |
| >65 | 3188 | 236.1 ± 9.4 | 89.8 | 129.6 | 169.4 | 229.9 | 476.4 |
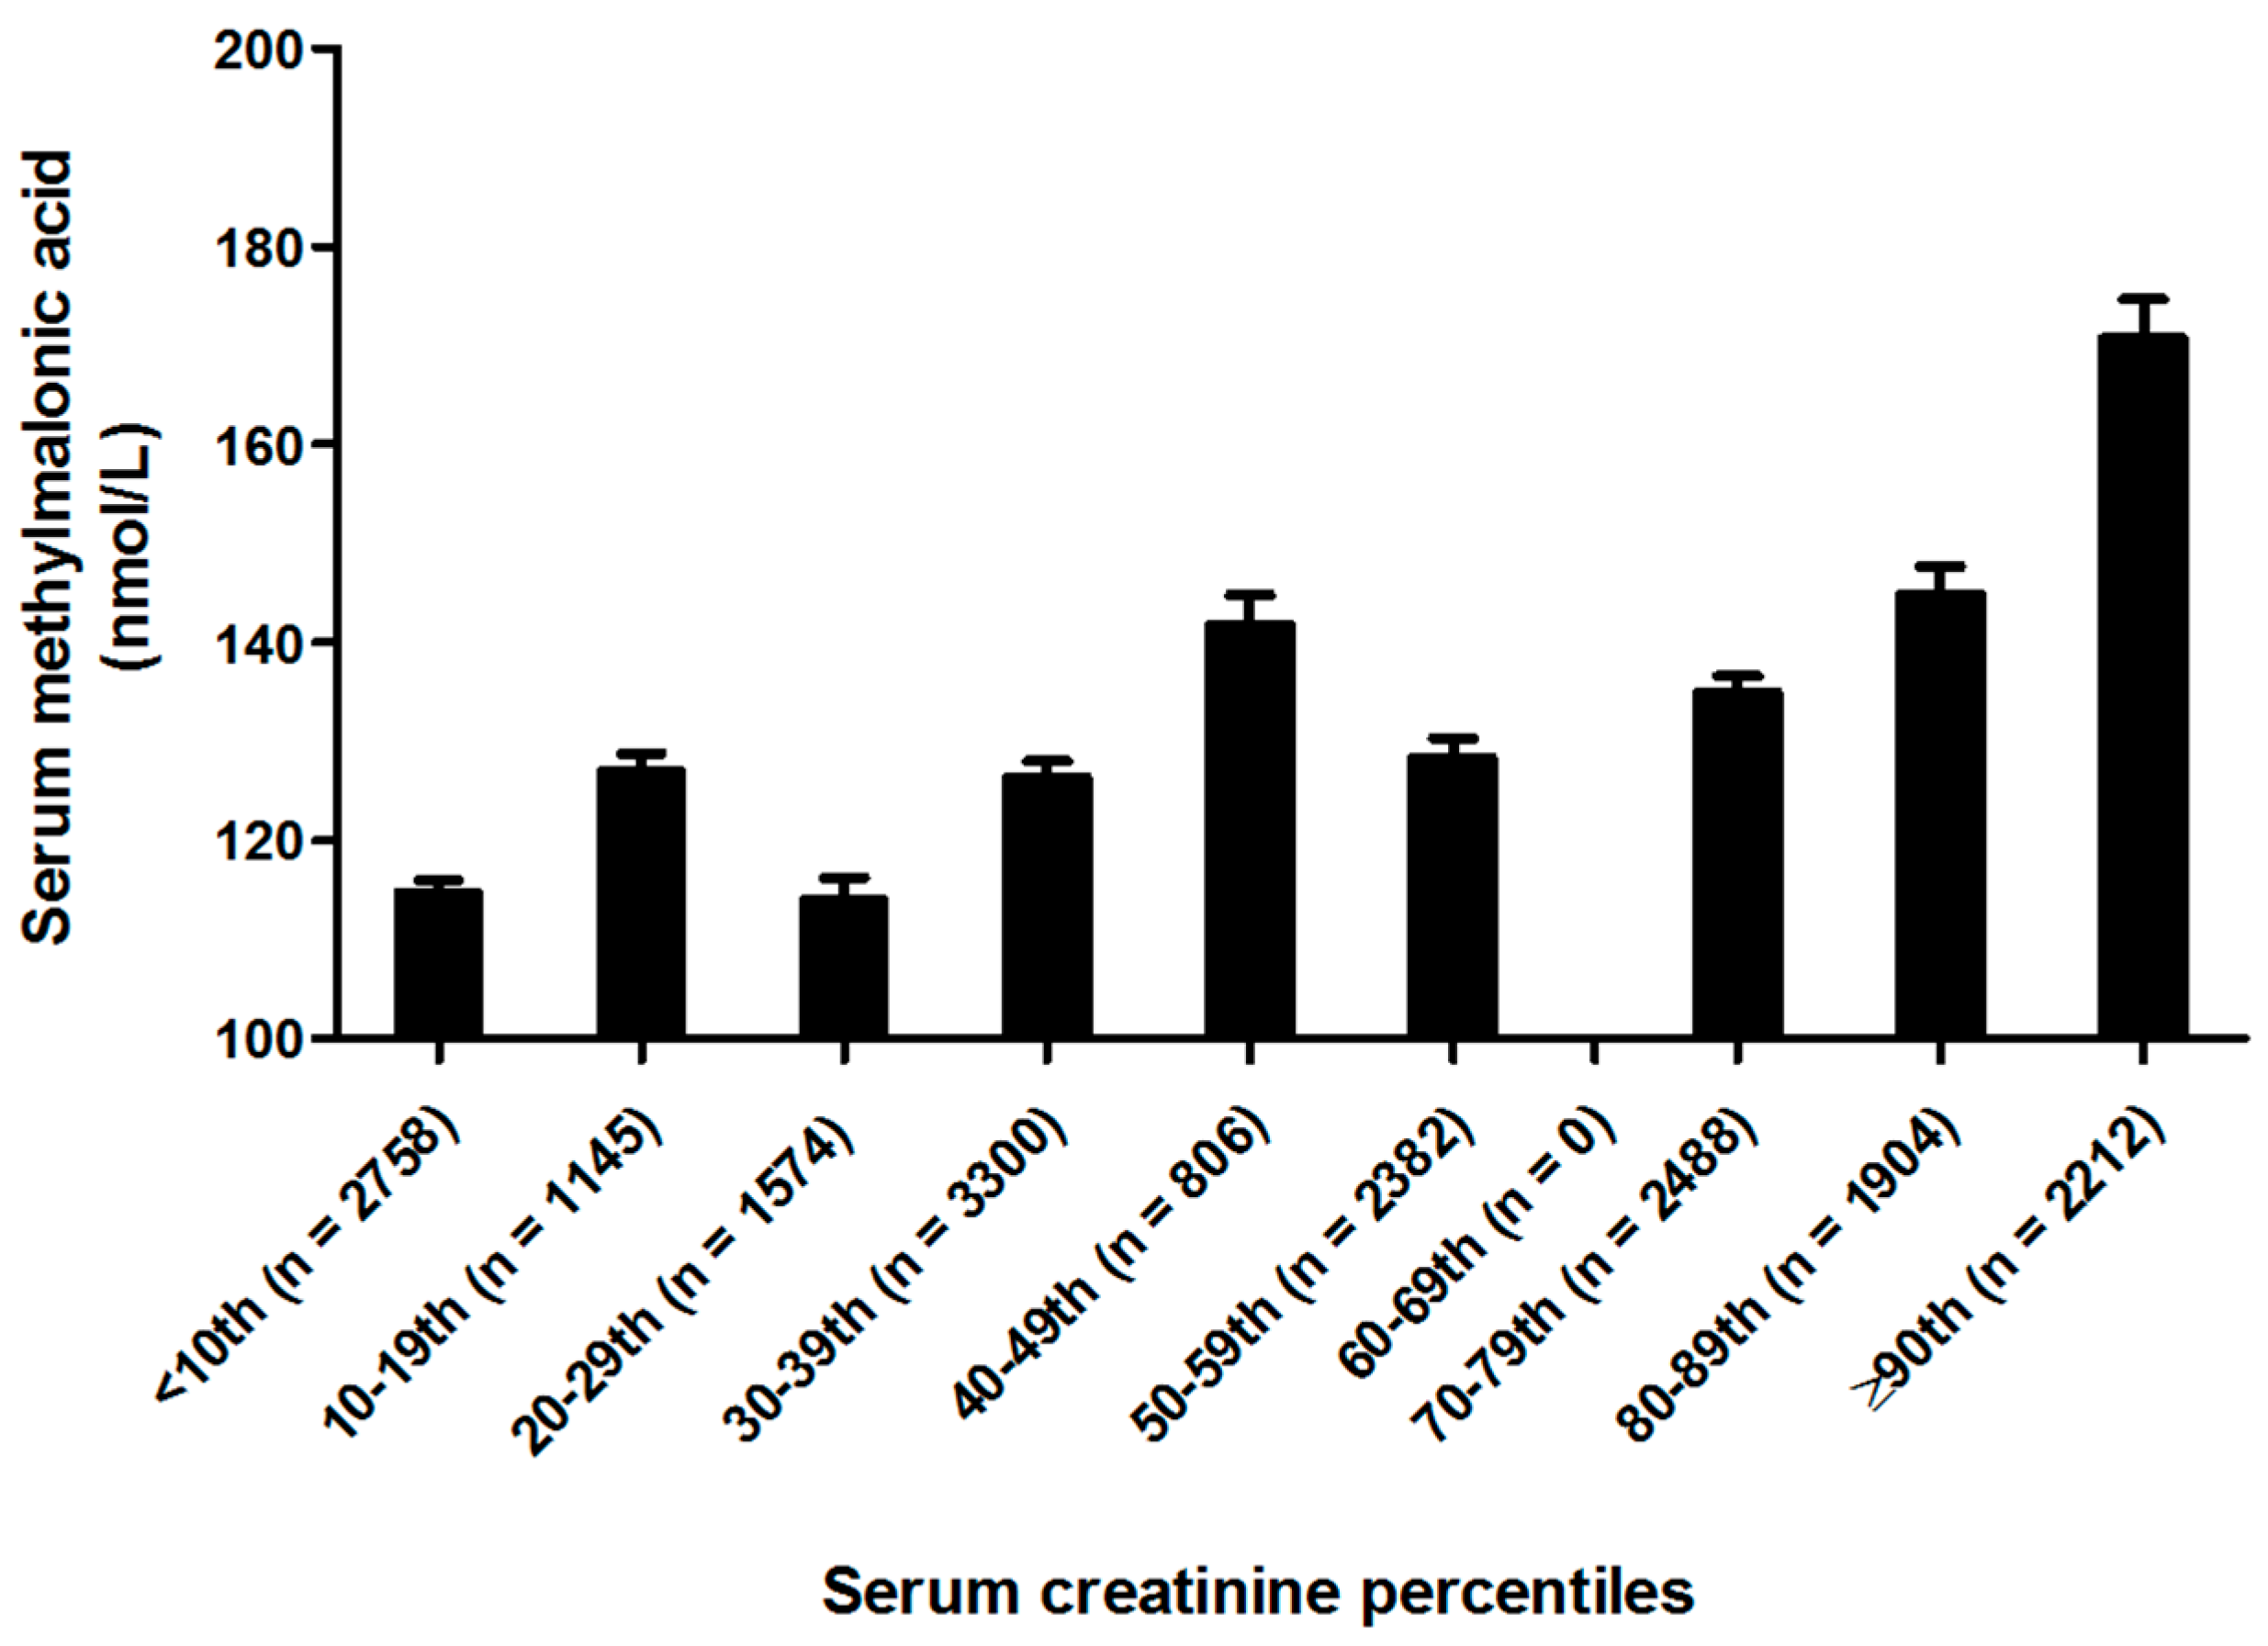
| Serum creatinine 5 (µmol/L) | |||||||
| <55.96 | 5477 | 132.9 ± 1.7 | 59.9 | 89.3 | 109.8 | 149.3 | 254.7 |
| 55.96 ≤ 70.71 | 4106 | 146.4 ± 2.7 | 69.5 | 99.0 | 128.3 | 159.9 | 262.2 |
| 7.71 ≤ 79.8 | 4870 | 147.1 ± 2.7 | 72.3 | 99.7 | 129.0 | 160.1 | 272.6 |
| ≥79.8 | 4116 | 190.6 ± 6.3 | 79.6 | 112.5 | 149.1 | 199.6 | 377.7 |
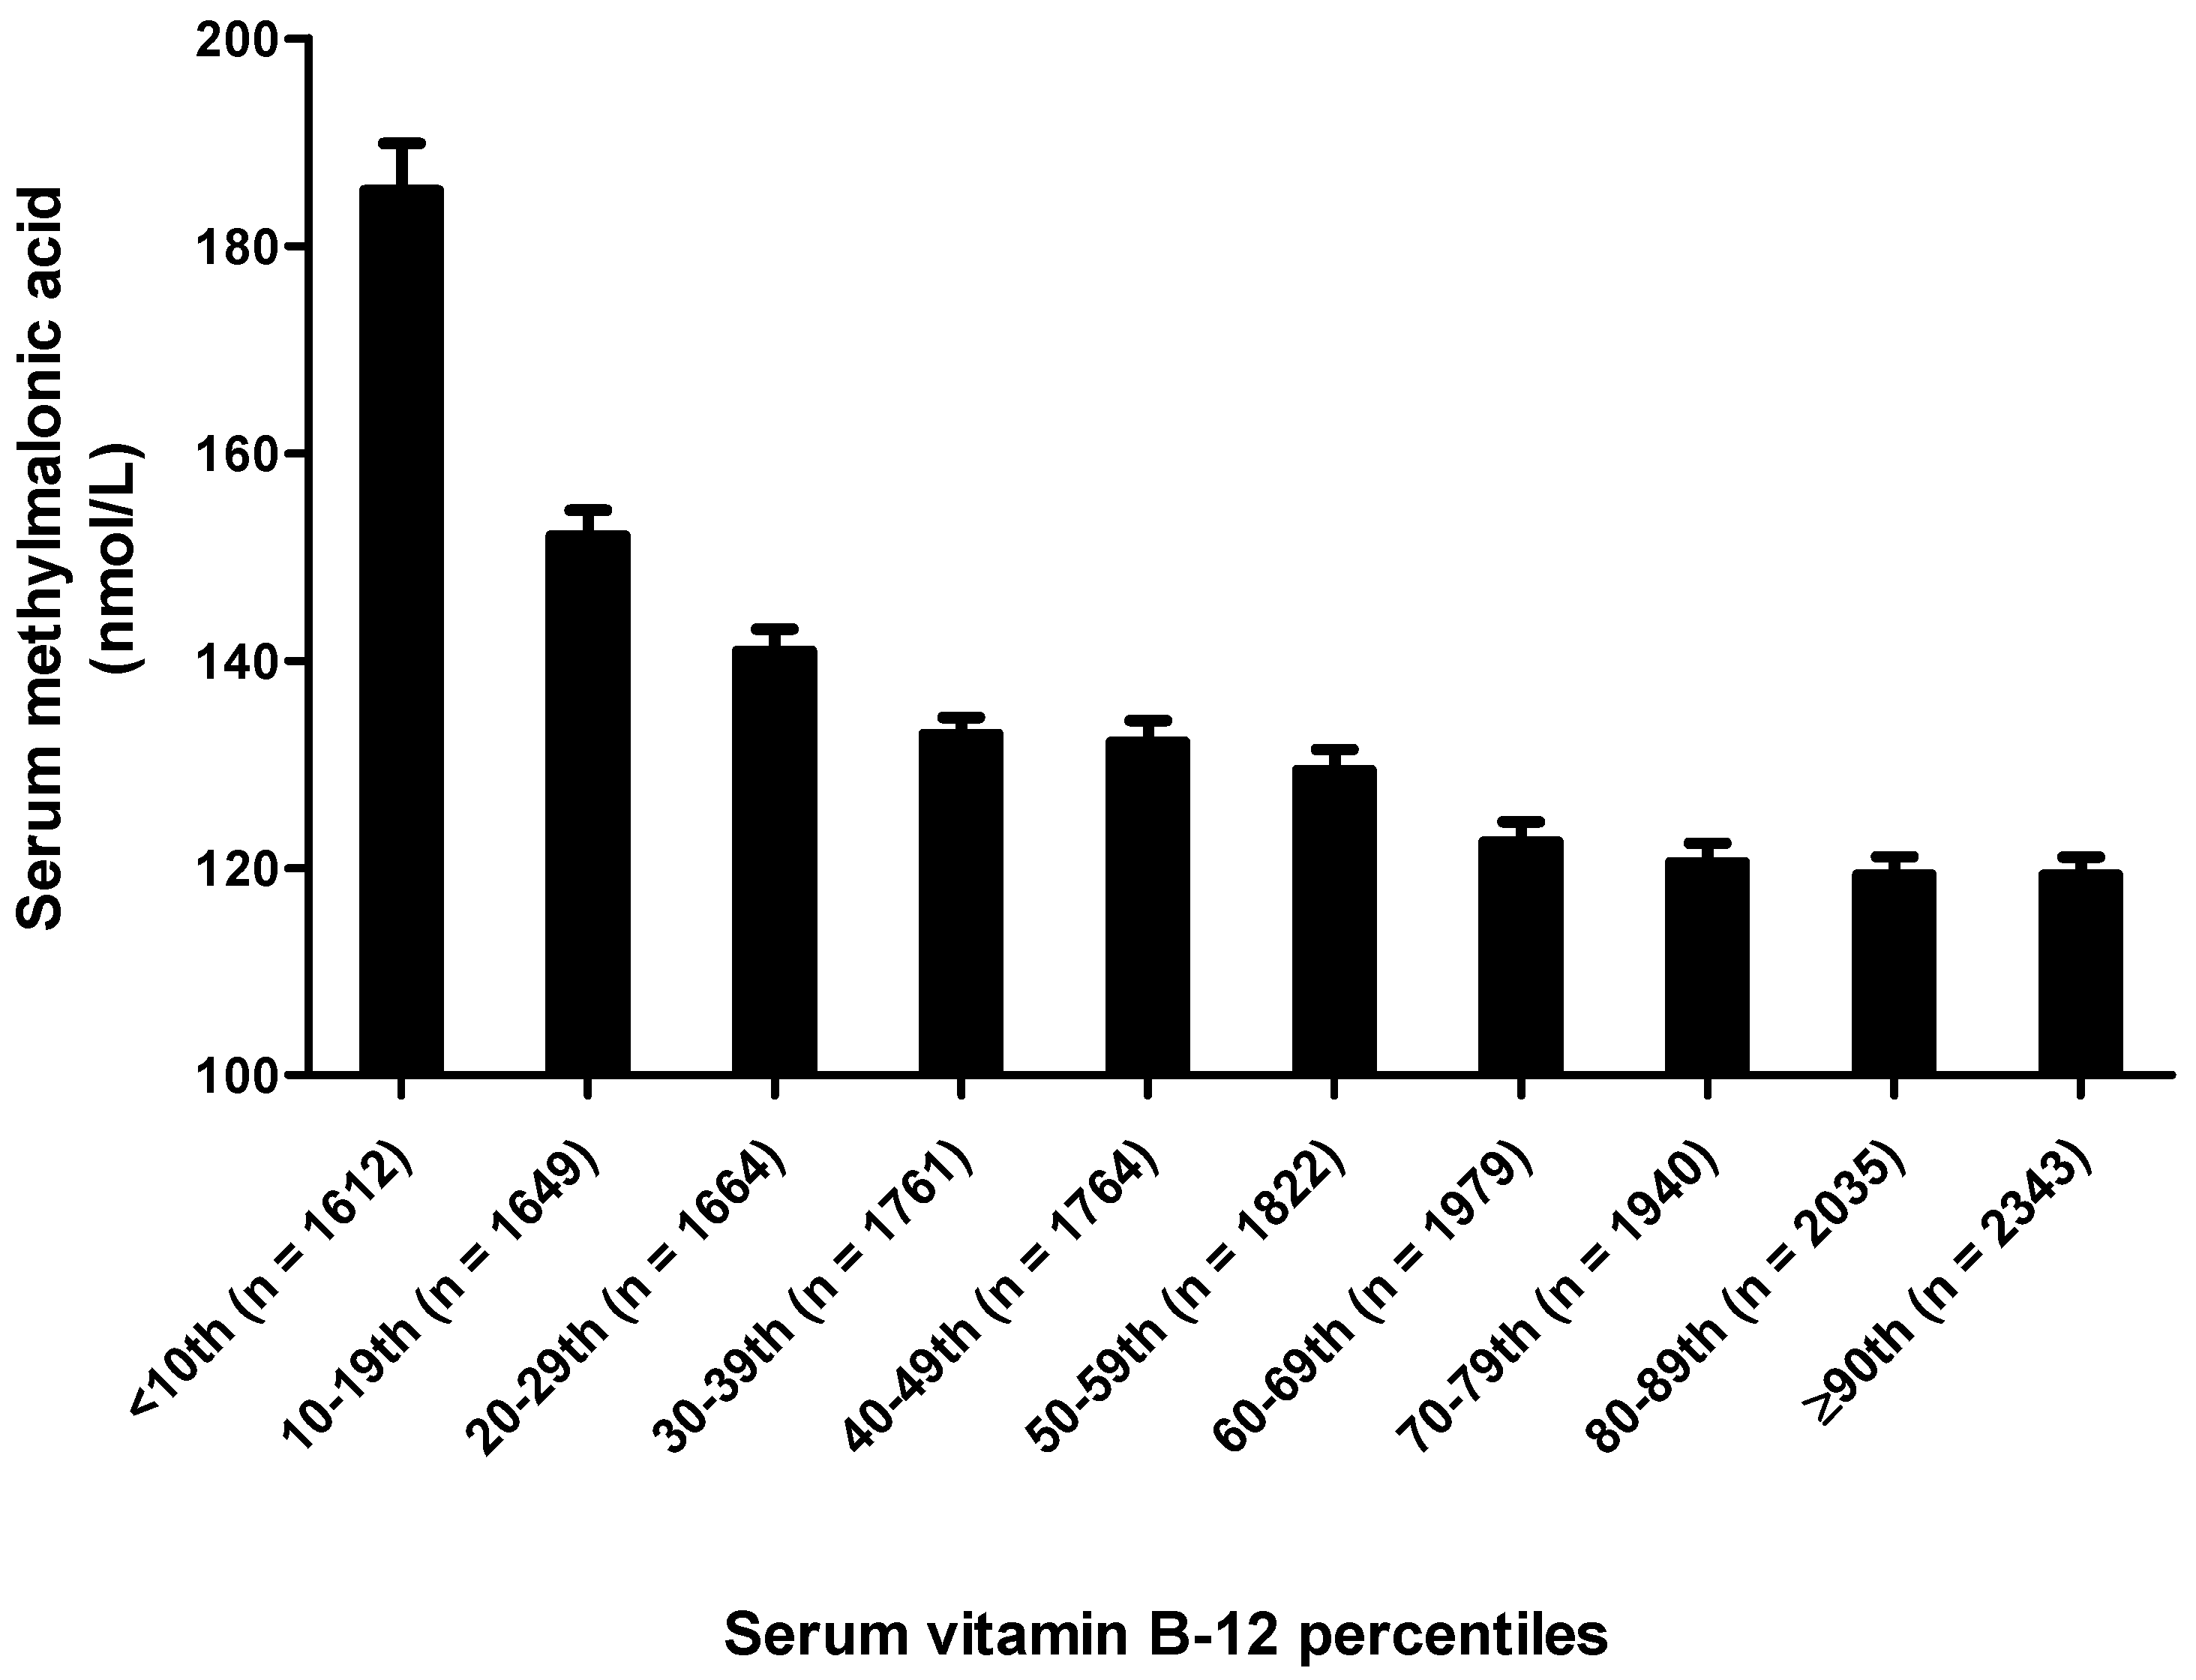
| Serum vitamin B-12 5 (pmol/L) | |||||||
| <260.96 | 4087 | 202.3 ± 6.1 | 79.4 | 110.0 | 149.7 | 209.7 | 428.0 |
| 260.96 ≤ 340.94 | 4363 | 146.6 ± 1.6 | 69.9 | 99.9 | 129.7 | 169.4 | 269.4 |
| 340.94 ≤ 445.91 | 4754 | 138.3 ± 2.9 | 69.4 | 97.6 | 119.7 | 152.0 | 240.0 |
| ≥445.91 | 5365 | 133.0 ± 2.5 | 68.1 | 89.7 | 116.5 | 149.3 | 232.5 |
| Age, Year | ≤100 nmol/L | 100 ≤ 200 nmol/L | 200 ≤ 300 nmol/L | ≥300 nmol/L | ||||||||
|---|---|---|---|---|---|---|---|---|---|---|---|---|
| NW | NB | H/M | NW | NB | H/M | NW | NB | H/M | NW | NB | H/M | |
| 19–30 (n = 2948) | 26.8 | 50.0 | 40.2 | 59.6 | 47.0 | 50.8 | 10.8 | 2.3 | 6.0 | 2.9 | 0.8 | 3.0 |
| 31–40 (n = 2008) | 23.9 | 43.5 | 40.0 | 64.1 | 48.7 | 51.0 | 8.9 | 5.4 | 6.0 | 3.2 | 2.4 | 2.9 |
| 41–50 (n = 1929) | 19.2 | 36.8 | 34.7 | 66.2 | 55.2 | 53.3 | 10.8 | 5.6 | 8.5 | 3.8 | 2.5 | 3.5 |
| 51–60 (n = 1516) | 12.1 | 28.3 | 26.6 | 67.0 | 61.2 | 61.0 | 15.4 | 8.7 | 7.3 | 5.5 | 1.8 | 5.1 |
| 61–70 (n = 1684) | 9.5 | 24.6 | 19.9 | 64.8 | 61.2 | 62.2 | 16.7 | 10.5 | 11.5 | 9.0 | 3.7 | 6.5 |
| >70 (n = 2069) | 3.9 | 4.8 | 8.9 | 50.3 | 56.2 | 55.1 | 27.1 | 28.5 | 17.5 | 18.7 | 10.4 | 18.6 |
© 2018 by the authors. Licensee MDPI, Basel, Switzerland. This article is an open access article distributed under the terms and conditions of the Creative Commons Attribution (CC BY) license (http://creativecommons.org/licenses/by/4.0/).
Share and Cite
Ganji, V.; Kafai, M.R. Population Reference Values for Serum Methylmalonic Acid Concentrations and Its Relationship with Age, Sex, Race-Ethnicity, Supplement Use, Kidney Function and Serum Vitamin B12 in the Post-Folic Acid Fortification Period. Nutrients 2018, 10, 74. https://doi.org/10.3390/nu10010074
Ganji V, Kafai MR. Population Reference Values for Serum Methylmalonic Acid Concentrations and Its Relationship with Age, Sex, Race-Ethnicity, Supplement Use, Kidney Function and Serum Vitamin B12 in the Post-Folic Acid Fortification Period. Nutrients. 2018; 10(1):74. https://doi.org/10.3390/nu10010074
Chicago/Turabian StyleGanji, Vijay, and Mohammad R. Kafai. 2018. "Population Reference Values for Serum Methylmalonic Acid Concentrations and Its Relationship with Age, Sex, Race-Ethnicity, Supplement Use, Kidney Function and Serum Vitamin B12 in the Post-Folic Acid Fortification Period" Nutrients 10, no. 1: 74. https://doi.org/10.3390/nu10010074