Effects of a Carob-Pod-Derived Sweetener on Glucose Metabolism
by
 and
and
Carmen Lambert
1,†, 
Judit Cubedo
1,2,†,
Teresa Padró
1,2,
Gemma Vilahur
1,2, 
Sergi López-Bernal
1,
Milagros Rocha
3,
Antonio Hernández-Mijares
3,4 and
Lina Badimon
1,2,5,* 1
Program ICCC-Cardiovascular Research Center, Institut de Reserca, Hospital de la Santa Creu i Sant Pau, IIB-Sant Pau, 08025 Barcelona, Spain
2
Centro de Investigación Biomédica en Red de Enfermedades Cardiovasculares, Ciber CV, Instituto de Salud Carlos III, 28029 Madrid, Spain
3
Service of Endocrinology, University Hospital Dr Peset, Foundation for the Promotion of Health and Biomedical Research in the Valencian Region (FISABIO), 46020 Valencia, Spain
4
Department of Medicine, University of Valencia, 46010 Valencia, Spain
5
Cardiovascular Research Chair, UAB, 08025 Barcelona, Spain
*
Author to whom correspondence should be addressed.
†
These authors contributed equally to this work.
Nutrients 2018, 10(3), 271; https://doi.org/10.3390/nu10030271
Submission received: 19 December 2017
/
Revised: 16 February 2018
/
Accepted: 16 February 2018
/
Published: 27 February 2018
(This article belongs to the Special Issue Consumption of Sugar and Impact on Overweight)
Abstract
:Background: Patients with type 2 diabetes mellitus (T2DM) have a higher incidence of cardiovascular (CV) events. The ingestion of high-glycemic index (GI) diets, specially sweetened beverage consumption, has been associated with the development of T2DM and CV disease. Objective: We investigated the effects of the intake of a sweetened beverage, obtained from natural carbohydrates containing pinitol (PEB) compared to a sucrose-enriched beverage (SEB) in the context of impaired glucose tolerance (IGT) and diabetes. Methods: The study was divided in three different phases: (1) a discovery phase where the plasma proteomic profile was investigated by 2-DE (two-dimensional electrophoresis) followed by mass spectrometry (matrix-assisted laser desorption/ionization time-of-flight—MALDI-TOF/TOF) in healthy and IGT volunteers; (2) a verification phase where the potential mechanisms behind the observed protein changes were investigated in the discovery cohort and in an additional group of T2DM volunteers; and (3) the results were validated in a proof-of-concept interventional study in an animal model of diabetic rats with complementary methodologies. Results: Six weeks of pinitol-enriched beverage (PEB) intake induced a significant increase in two proteins involved in the insulin secretion pathway, insulin-like growth factor acid labile subunit (IGF1BP-ALS; 1.3-fold increase; P = 0.200) and complement C4A (1.83-fold increase; P = 0.007) in IGT subjects but not in healthy volunteers. Changes in C4A were also found in the serum samples of Zucker diabetic fatty (ZDF) rats after four weeks of PEB intake compared to basal levels (P = 0.042). In addition, an increased expression of the glucose transporter-2 (GLUT2) gene was observed in the jejunum (P = 0.003) of inositol-supplemented rats when compared to sucrose supplementation. This change was correlated with the observed change in C4A (P = 0.002). Conclusions: Our results suggest that the substitution of a common sugar source, such as sucrose, by a naturally-based, pinitol-enriched beverage induces changes in the insulin secretion pathway that could help to reduce blood glucose levels by protecting β-cells and by stimulating the insulin secretion pathway. This mechanism of action could have a relevant role in the prevention of insulin resistance and diabetes progression.
1. Introdution
Diabetes is a chronic degenerative disease [1], characterized by hyperglycaemia caused by defects in insulin activity, secretion, and/or metabolism [2], that has become an epidemic and is now one of the biggest health challenges [3]. Type 2 diabetes mellitus (T2DM) represents the vast majority of cases worldwide [2] and millions of people are at high risk of developing T2DM, or suffering impaired glucose tolerance (IGT), which is a prediabetes state [4]. The relationship between T2DM and cardiovascular disease (CVD) is well established, since patients with diabetes mellitus have an increased risk of developing CVD [5,6]. Recent prospective studies have linked a food high-glucose index (GI) diet in the pathogenesis of CVD, T2DM, and obesity [7,8], and carbohydrate intake with an elevated risk of mortality [9]. Several studies have shown a link between the consumption of beverages with artificial and/or natural sweeteners and the risk of developing T2DM [10], related metabolic disorders [11] and CVD [12,13]. Beverages with carbohydrate-based sweeteners promote weight gain and contribute to an increased risk of T2DM not only through obesity but also due to the glycaemic effects derived from the consumption of large amounts of rapidly absorbable sugars. Interest has focused on recommending the intake of low-GI beverages with natural sweeteners to both prevent the development of diabetes and effectively manage diabetic patients [14,15]. A continuous association between fasting blood glucose levels and CVD, in both diabetic and non-diabetic patients, has suggested that all individuals may benefit from blood glucose level lowering strategies.
A new carbohydrate-based beverage extracted from carob pods containing pinitol, has been shown to improve the postprandial glycaemic response in healthy individuals as opposed to sucrose-based beverages [16,17]. Normal western diets provide between 0.5 g and 0.7 g of inositol per day, mainly through vegetables and fruits [18]. Reduced pinitol levels were observed in impaired glucose tolerance and diabetic patients [19]. To prevent or ameliorate diabetes mellitus (DM), the normal supplementation dose of inositol is between 2 g/day and 4 g/day [20]. The aim of the present study was to identify by proteomic approaches and experimental proof-of-concept studies, the potential mechanisms behind improvement in the glycaemia response pattern associated with the regular and chronic ingestion of a pinitol-enriched beverage.
2. Materials and Methods
2.1. Human Study
2.1.1. Subjects and Study Design
Two groups of volunteers were studied. Healthy volunteers (HV; N = 40) and overweight volunteers with impaired glucose tolerance (IGT; N = 40). A third group of T2DM (N = 38) patients was also included in the validation phase. All subjects were recruited at the University Hospital Dr. Peset, Valencia and the study was designed as previously described [16,17,21,22].
Briefly, the subjects included in the study had an age range of 18–72 years; a body mass index (BMI) range of 19–40 Kg/m2 and clinically normal biochemical parameters. The inclusion criteria for IGT subjects was fasting glycaemia levels between 100 mg/dL and 125 mg/dL on at least two previous occasions and/or a HbA1c range of 5.7–6.4%. Type 2 diabetes was defined according to the American Diabetes Association guidelines [2]. Exclusion criteria were type 1 diabetes, malignant neoplasm, triacylglycerols (TG) > 400 mg/dL, macrovascular complications, patients with poorly controlled type 2 diabetes (HbA1c ≥ 8%) or who were being treated with insulin or intestinal disaccharidase inhibitors.
The study was conducted according to the guidelines laid down in the Declaration of Helsinki, and all procedures involving human subjects were approved by the university hospital Dr. Peset Ethics Committee on 28 March 2012 (Project code: FRUIT UP/01; Committee code: 11/12). Written informed consent was obtained from all patients.
This was a randomized, double-blind study, as previously described [17,21,22]. Each group of volunteers was then divided into two subgroups. One subgroup received a sucrose-enriched beverage (SEB) as a placebo and the other received a carob-pod, pinitol-enriched beverage (PEB; Fruit Up®; ADM&WILD-Valencia SAU, Valencia, Spain) [17,21,22]. The PEB consisted of a complex mixture of naturally-occurring soluble carbohydrates (including mono-, di-, oligo-saccharides and polyols, mainly pinitol, myoinositol plus D-chiro-inositol–soluble fibre) and minor compounds (organic acids, minerals, aminoacids) derived from carob pods. The sucrose-based beverage contained very similar amounts of non-polyol soluble carbohydrates, macronutrient composition and total number of calories to the PEB, but excluded inositols (Table 1). The sweetness and energy supply of inositols compared to other common sweeteners is showed in Supplementary Table S1. This trial was registered on clinicaltrials.gov under the study number NCT01754792.
The anthropometric and biochemical profile of the study population has been previously reported [16,17,21,22] for healthy subjects, IGT subjects and in T2DM patients. (For further information, see Supplementary Material).
2.1.2. Blood Collection and Sample Preparation
Venous blood samples from the volunteers were collected by the volunteers at 8–10 am after 12 h overnight fasting at the moment of inclusion (T0) and after six weeks (T6) of intake of the supplemented beverages (Figure 1a; baseline and endpoint of the study). Blood samples were collected in anticoagulant-free Vacutainer tubes for serum preparation. Serum fractions were separated by centrifugation at 3.000× g at 4 °C for 20 min, aliquoted and then stored at −80 °C in Valencia [16,17,21,22]. Sample aliquots were transported in dry ice to Barcelona for the present mechanistic study. All samples were kept without thawing at −80 °C until used.
2.1.3. Sample Preparation
For proteomic studies, serum samples were prepared as previously reported [23,24,25]. Briefly, samples were sonicated (six cycles of 15 s each) in ice and filtrated (0.22 µm) by centrifugation to avoid the presence of impurities. The six most abundant serum proteins were depleted using a specific affinity cartridge with binding capacity for albumin, IgGs, IgAs, transferrin, antitrypsin, and haptoglobin (Multiple Affinity Removal Spin Cartridge, Agilent Technologies, Santa Clara, CA, USA), as reported by the providers. Serum depleted samples (called the total serum fraction) were concentrated and desalted by centrifugation with 5 kDa cutoff filter devices and sample buffer was exchanged to a urea-containing buffer (8 M urea, 2% CHAPS). The protein concentration in the serum extracts was measured with a 2D-Quant Kit (GE Healthcare, Little Chalfont, UK). All processed samples were stored at −80 °C until used.
2.1.4. Proteomic Analysis
The proteomic serum profile of six volunteers from each group and condition were randomly selected and analyzed by two dimensional gel electrophoresis (2-DE) and mass spectrometry (MS) (Figure 1b).
Two-Dimensional Gel Electrophoresis
A protein load of 100 μg (analytical gels) and 300 μg (preparative gels) of the urea/chaps serum extracts was applied to 17-cm dry strips (pH 4–7 linear range; BioRad). The second dimension was resolved in 10% SDS-PAGE (sodium dodecyl sulfate-polyacrylamide gel electrophoresis). Gels were developed by fluorescent staining (Flamingo; BioRad, Hercules, CA, USA). For each independent condition, 2-DE for protein extracts from the baseline and the post-intake of placebo or Fruit-Up® were processed in parallel to guarantee maximum comparability. Analysis for differences in the protein profiles was performed with the PD-Quest 8.0 software (BioRad, Hercules, CA, USA). Each spot was assigned a relative value that corresponds to the single spot volume compared to the volume of all the spots in the gel, following background extraction and normalization between gels [26].
Mass Spectrometry Analysis
Proteins were identified after in-gel tryptic digestion and the extraction of peptides from the gel pieces, as previously described [24,27], by matrix-assisted laser desorption/ionization time-of-flight (MALDI-TOF) using an AutoFlex III Smartbeam MALDI-TOF/TOF (Bruker Daltonics, Billerica, MA, USA). Samples were applied to Prespotted AnchorChip plates (Bruker Daltonics, Billerica, MA, USA) surrounding the calibrants provided on the plates. Spectra were acquired with flexControl in reflector mode (mass range: 850–4000 m/z, reflector 1: 21.06 kV; reflector 2: 9.77 kV; ion source 1 voltage: 19 kV; ion source 2: 16.5 kV; detection gain: 2.37x), with an average of 3500 added shots at a frequency of 200 Hz. Each sample was processed with flexAnalysis (version 3.0, Bruker Daltonics, Billerica, MA, USA) considering a signal-to-noise ratio over three, applying statistical calibration and eliminating background peaks. For identification, peaks between 850 m/z and 1000 m/z were not considered. After processing, spectra were sent to the BioTools interface (version 3.2, Bruker Daltonics, Billerica, MA, USA) and a MASCOT server search on Swiss-Prot 57.15 database was carried out (taxonomy: homo sapiens, mass tolerance 50 to 100, up to two trypsin miss cleavages, global modification: carbamidomethyl (C), variable modification: oxidation (M)). Identified proteins were accepted when a mascot score higher than 52 was obtained by peptide mass fingerprint and confirmed by peptide fragmentation was working in the reflector mode.
Quantification of Protein Serum Levels
A commercial sandwich-based ELISA (enzyme-linked immunosorbent assay) kit was used to measure total IGF-I (Insulin-like growth factor-I) levels in the serum samples before and after the intake of PEB by the control (N = 20) and IGT volunteers (N = 20). In addition, a group of diabetic patients was included (N = 19). The detection range of the kit was 2.0–50 ng/mL (IGF-I ELISA E20, Human Insulin-Like Growth Factor-I ELISA Kit; Mediagnost, Budapest, Hungary).
2.2. Animal Study
The study protocol was approved by the institutional ethics committee “Animal Experimentation Committee of the Cardiovascular Research Centre (CSIC-ICCC)” conforming to the position of the American Heart Association (AHA) on Research Animal Use adopted by the AHA on 11 November 1984. All procedures fulfilled the criteria established by the “Guide for the Care and Use of Laboratory Animals” published by the United States National Institutes of Health (NIH; NIH Publication No.85-23, revised 1996).
Animals were housed in the ICCC (Instituto Catalán de Ciencias Cardiovasculares) animal facilities in a dedicated room with controlled temperature (22 ± 1 °C), humidity (60%), and lighting (12 h light–dark cycles).
2.2.1. Animal Model
Male Zucker diabetic fatty (ZDF) rats (350 g ± 30 g; 12 weeks-old; N = 10) supplied by Charles River (Barcelona, Spain) were used as an animal model of severe T2DM. ZDF rats progress to T2DM due to insulin resistance and express abnormalities such as early hyperinsulinemia (that quickly decreases as the β-cells fatigue), hyperglycemia, glucose intolerance, hyperlipidemia, mild nephropathy and hyperleptinemia [28].
ZDF rats were fed a diet with high protein, carbohydrate and fat levels to develop diabetes (LabDiet® 5008 Formulab, P.O. Box 19798 St. Louis, MO, USA). The study was conducted in rats under a pinitol-free diet to avoid potential interactions. Animals were provided with food and water ad libitum.
2.2.2. Experimental Design
ZDF rats were randomized into two parallel groups (1:1) receiving the low-glycemic index pinitol solution (PEB; intervention group) or a sucrose solution (SEB; control group).
Animals were administered a 1.15 g/kg carob-pod pinitol preparation, equivalent to a daily dose of pinitol in humans, as tested in previous studies [16]. The dose of sucrose was calculated in order to ensure that all animals received the same amount of non-polyol carbohydrates and total energy as those obtained by PEB intake (0.90 g/kg). Animals were administered daily for four weeks (28 days) by gastric gavage of either sucrose or pinitol solution. On days 1 and 28 (after a 4-h time period of food deprivation) blood was collected from the tail vein, for the blood glucose level analysis (Glucocard™ Memory 2 meter, Menarini Diagnostics, Firenze, Italy; Figure 2). Animals were kept conscious in order to avoid potential transient hyperglycemia caused by sedation [29].
Upon completion of the experiment on day 28, the animals were deeply anesthetized with a mixture of ketamine (75 mg/kg) + medetomidine (0.5 mg/kg) + buprenorphine (0.1 mg/kg) and euthanized with an intracardiac injection of a pentobarbital overdose (400 mg/kg). A portion of duodenum, jejunum, ileum, large intestine and the heart were extracted and cleaned to avoid bacterial RNAse interference, immediately frozen in liquid nitrogen and stored at −80 °C until processed.
2.2.3. Western Blot Analysis
Protein extracts were resolved by 1-DE under reducing conditions and electrotransferred to nitrocellulose membranes in semi-dry conditions (Trans-Blot Turbo system; BioRad, Hercules, CA, USA). C4A complement detection was performed using a rabbit policlonal antibody against a recombinant fragment corresponding to a region within amino acids 23-302 of the protein (NBP2-14,893, 1:1000 dilution, Novus bio, Littleton, CO, USA). Band detection was performed using a chemiluminiscent substrate dye (SuperSignal® West Dura Extended Duration Substrate, Thermo Scientific, Waltham, MA, USA) and a molecular imager ChemiDoc XRS System, Universal Hood II (BioRad, Hercules, CA, USA). Band quantification was performed with Image Lab 4.0 software (BioRad laboratories, Hercules, CA, USA). The protein load was normalized with total protein staining, as previously described [27].
2.2.4. Glucose Transporter mRNA Expression
We evaluated the potential effect of the intake of PEB on the expression of three main glucose transporters: GLUT2, GLUT4 and GLUT5. Due to the tissue specificity and pinitol absorption, we measured GLUT2 and GLUT5 in the duodenum, jejunum and ileum, and GLUT4 in the heart. To this end, the aforementioned samples were pulverized in liquid nitrogen and mRNA was isolated using the TripureTM Isolation Reagent (Roche Molecular Biochemicals, Pleasanton, CA, USA) according to the manufacturer’s instructions and then gene expression was assessed by real-time PCR analysis; GLUT2 (Rn00563565, Thermo Fisher Scientific, Waltham, MA, USA), GLUT4 (Rn01752377, Thermo Fisher Scientific, Waltham, MA, USA) and GLUT5 (Rn00582000, Thermo Fisher Scientific, Waltham, MA, USA).
2.3. Statistical Analysis
Data are expressed as mean and standard error (SEM) unless stated. N indicates the number of subjects tested. Statistical analysis was performed with Stat View 5.0.1 software (SAS Institute, Cary, NC, USA). Differences between the basal condition and after six weeks of intake of the pinitol-enriched beverage were tested using a repeated measurement Willcoxon analysis. Differences between groups were tested with a nonparametric Mann–Whitney test. A p-value ≤ 0.05 was considered significant.
3. Results
3.1. Pinitol-Enriched Beverage Intake Induces Serum Proteomic Changes in Proteins Related to the Insulin Secretion Pathway
Six weeks of pinitol-enriched beverage intake induced a significant decrease in glucose levels both in IGT and healthy subjects (P = 0.03). On the contrary, sucrose intake induced an increase in glucose levels in both groups of volunteers (P = 0.03; Table 2; Supplemental Figure S1).
In order to investigate the proteins involved in the observed glucose-lowering-effect of PEB, we analyzed the serum proteomic profile of both IGT and healthy subjects at baseline and after six weeks of pinitol or sucrose-enriched beverage intake.
Among the identified proteins, IGF1BP-ALS (IGF1—insulin-like growth factor 1; BP—binding protein; ALS—acid labile subunit; MW = 63kDa; pI = 6.13) was detected in the 2-DE analysis as a cluster of two different spots that showed an increased change in IGT volunteers after PEB intake compared to sucrose intake (P = 0.028; Figure 3a). On the contrary, no differences were detected in the healthy subjects (Supplemental Table S1).
Together with changes in IGF1BP-ALS, complement C4A also showed a significant shift in its distribution profile in IGT subjects, but not in healthy subjects. C4A was identified as two different chains, the gamma chain (MW = 33 kDa; pI = 6.37), which corresponds to 77% of total protein intensity, and the alpha chain (MW = 84kDa; pI = 5.33), that represents 23% of total protein intensity (Figure 3b). Total C4A levels showed a significant increase (P = 0.028; Figure 3c) in IGT subjects after six weeks of dietary supplementation with PEB compared to sucrose intake. No differences were found in the alpha chain, whereas a significant increase in the IGT subjects after the intake of the PEB was observed in the gamma chain (P = 0.028; Figure 3d) when compared to sucrose intake. On the contrary, no differences in C4A expression were detected in the healthy group (Supplemental Table S1).
3.2. Potential Mechanisms Involved in the Peb Glucose Modulating Effect
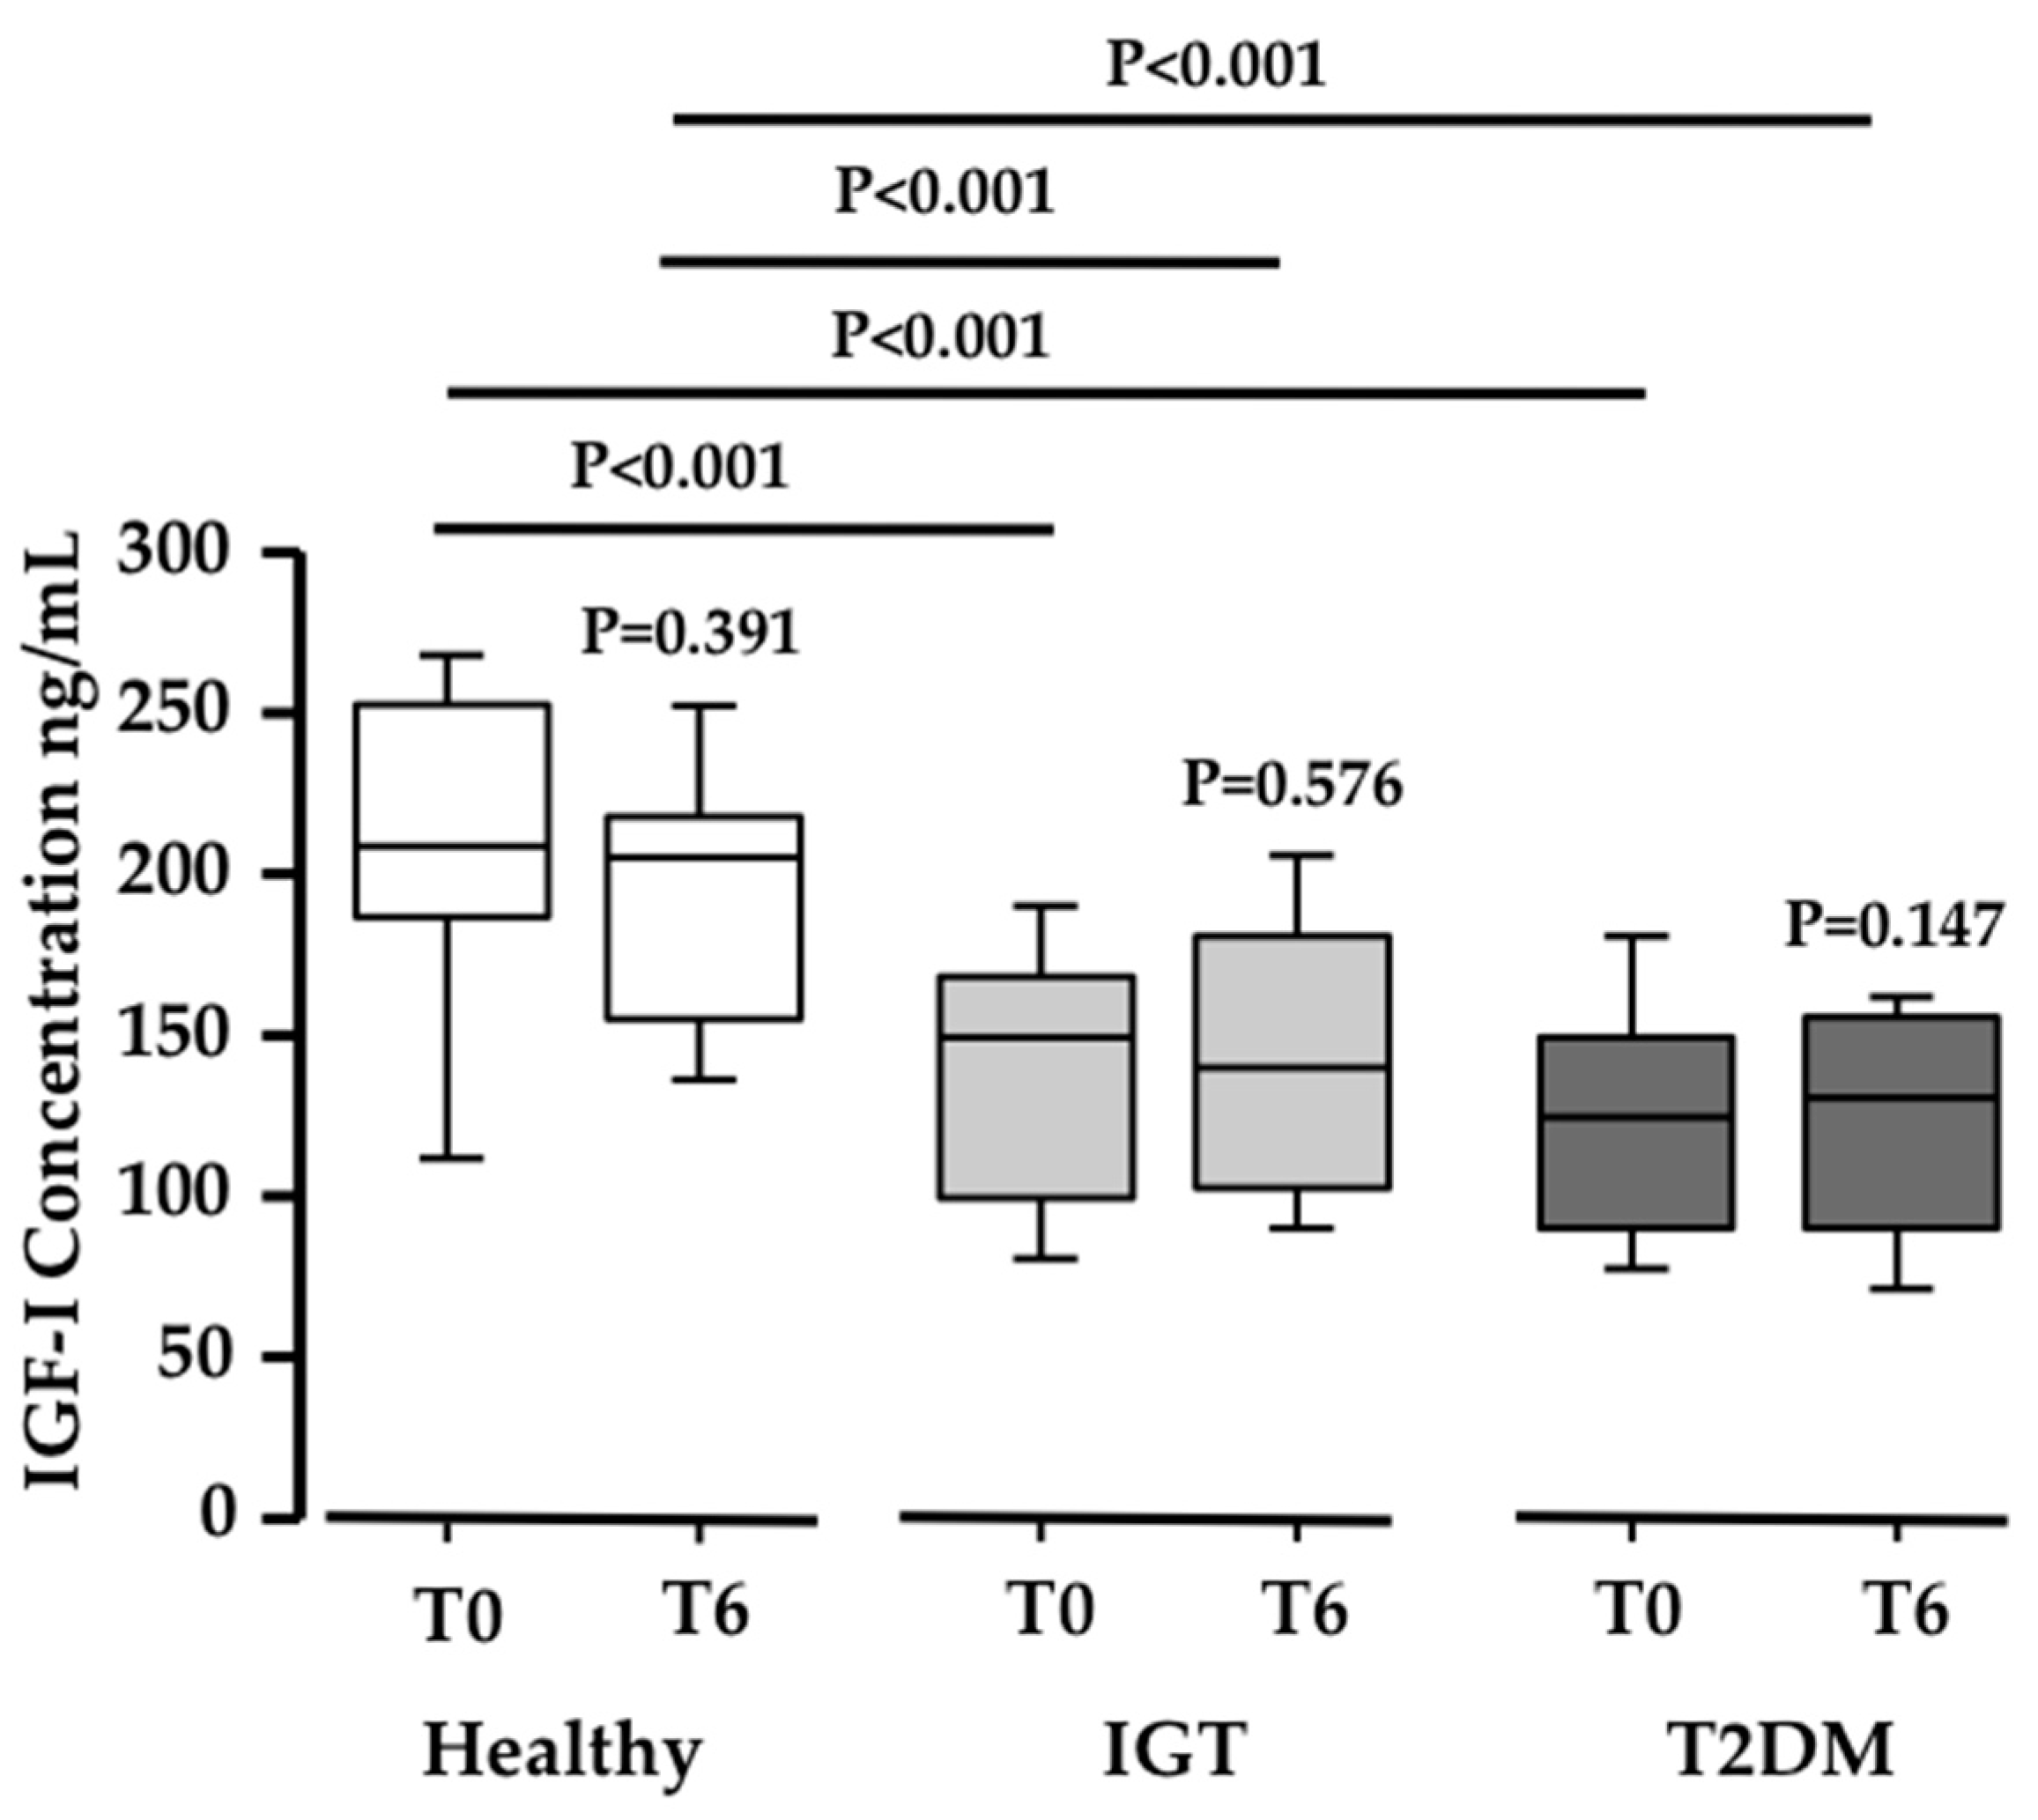
Since the acid labile subunit (ALS) was found increased in the proteomic analysis, and ALS binds IGF-1 [30], we measured the total IGF-1 serum levels in the three study populations. Interestingly, both the IGT and T2DM subjects showed significantly lower basal serum levels of IGF-1 when compared to healthy subjects (N ≥ 19 in each group; P < 0.001; Figure 4). However, no differences were observed in IGF-1 serum levels after PEB intake in any of the three groups. This means that PEB intake, while regulating ALS, has no influence on IGF-1 levels.
To better understand the mechanisms related to the observed glucose reduction produced after the intake of a pinitol-enriched beverage, ZDF rats, as an animal model of diabetes, were included in the study.
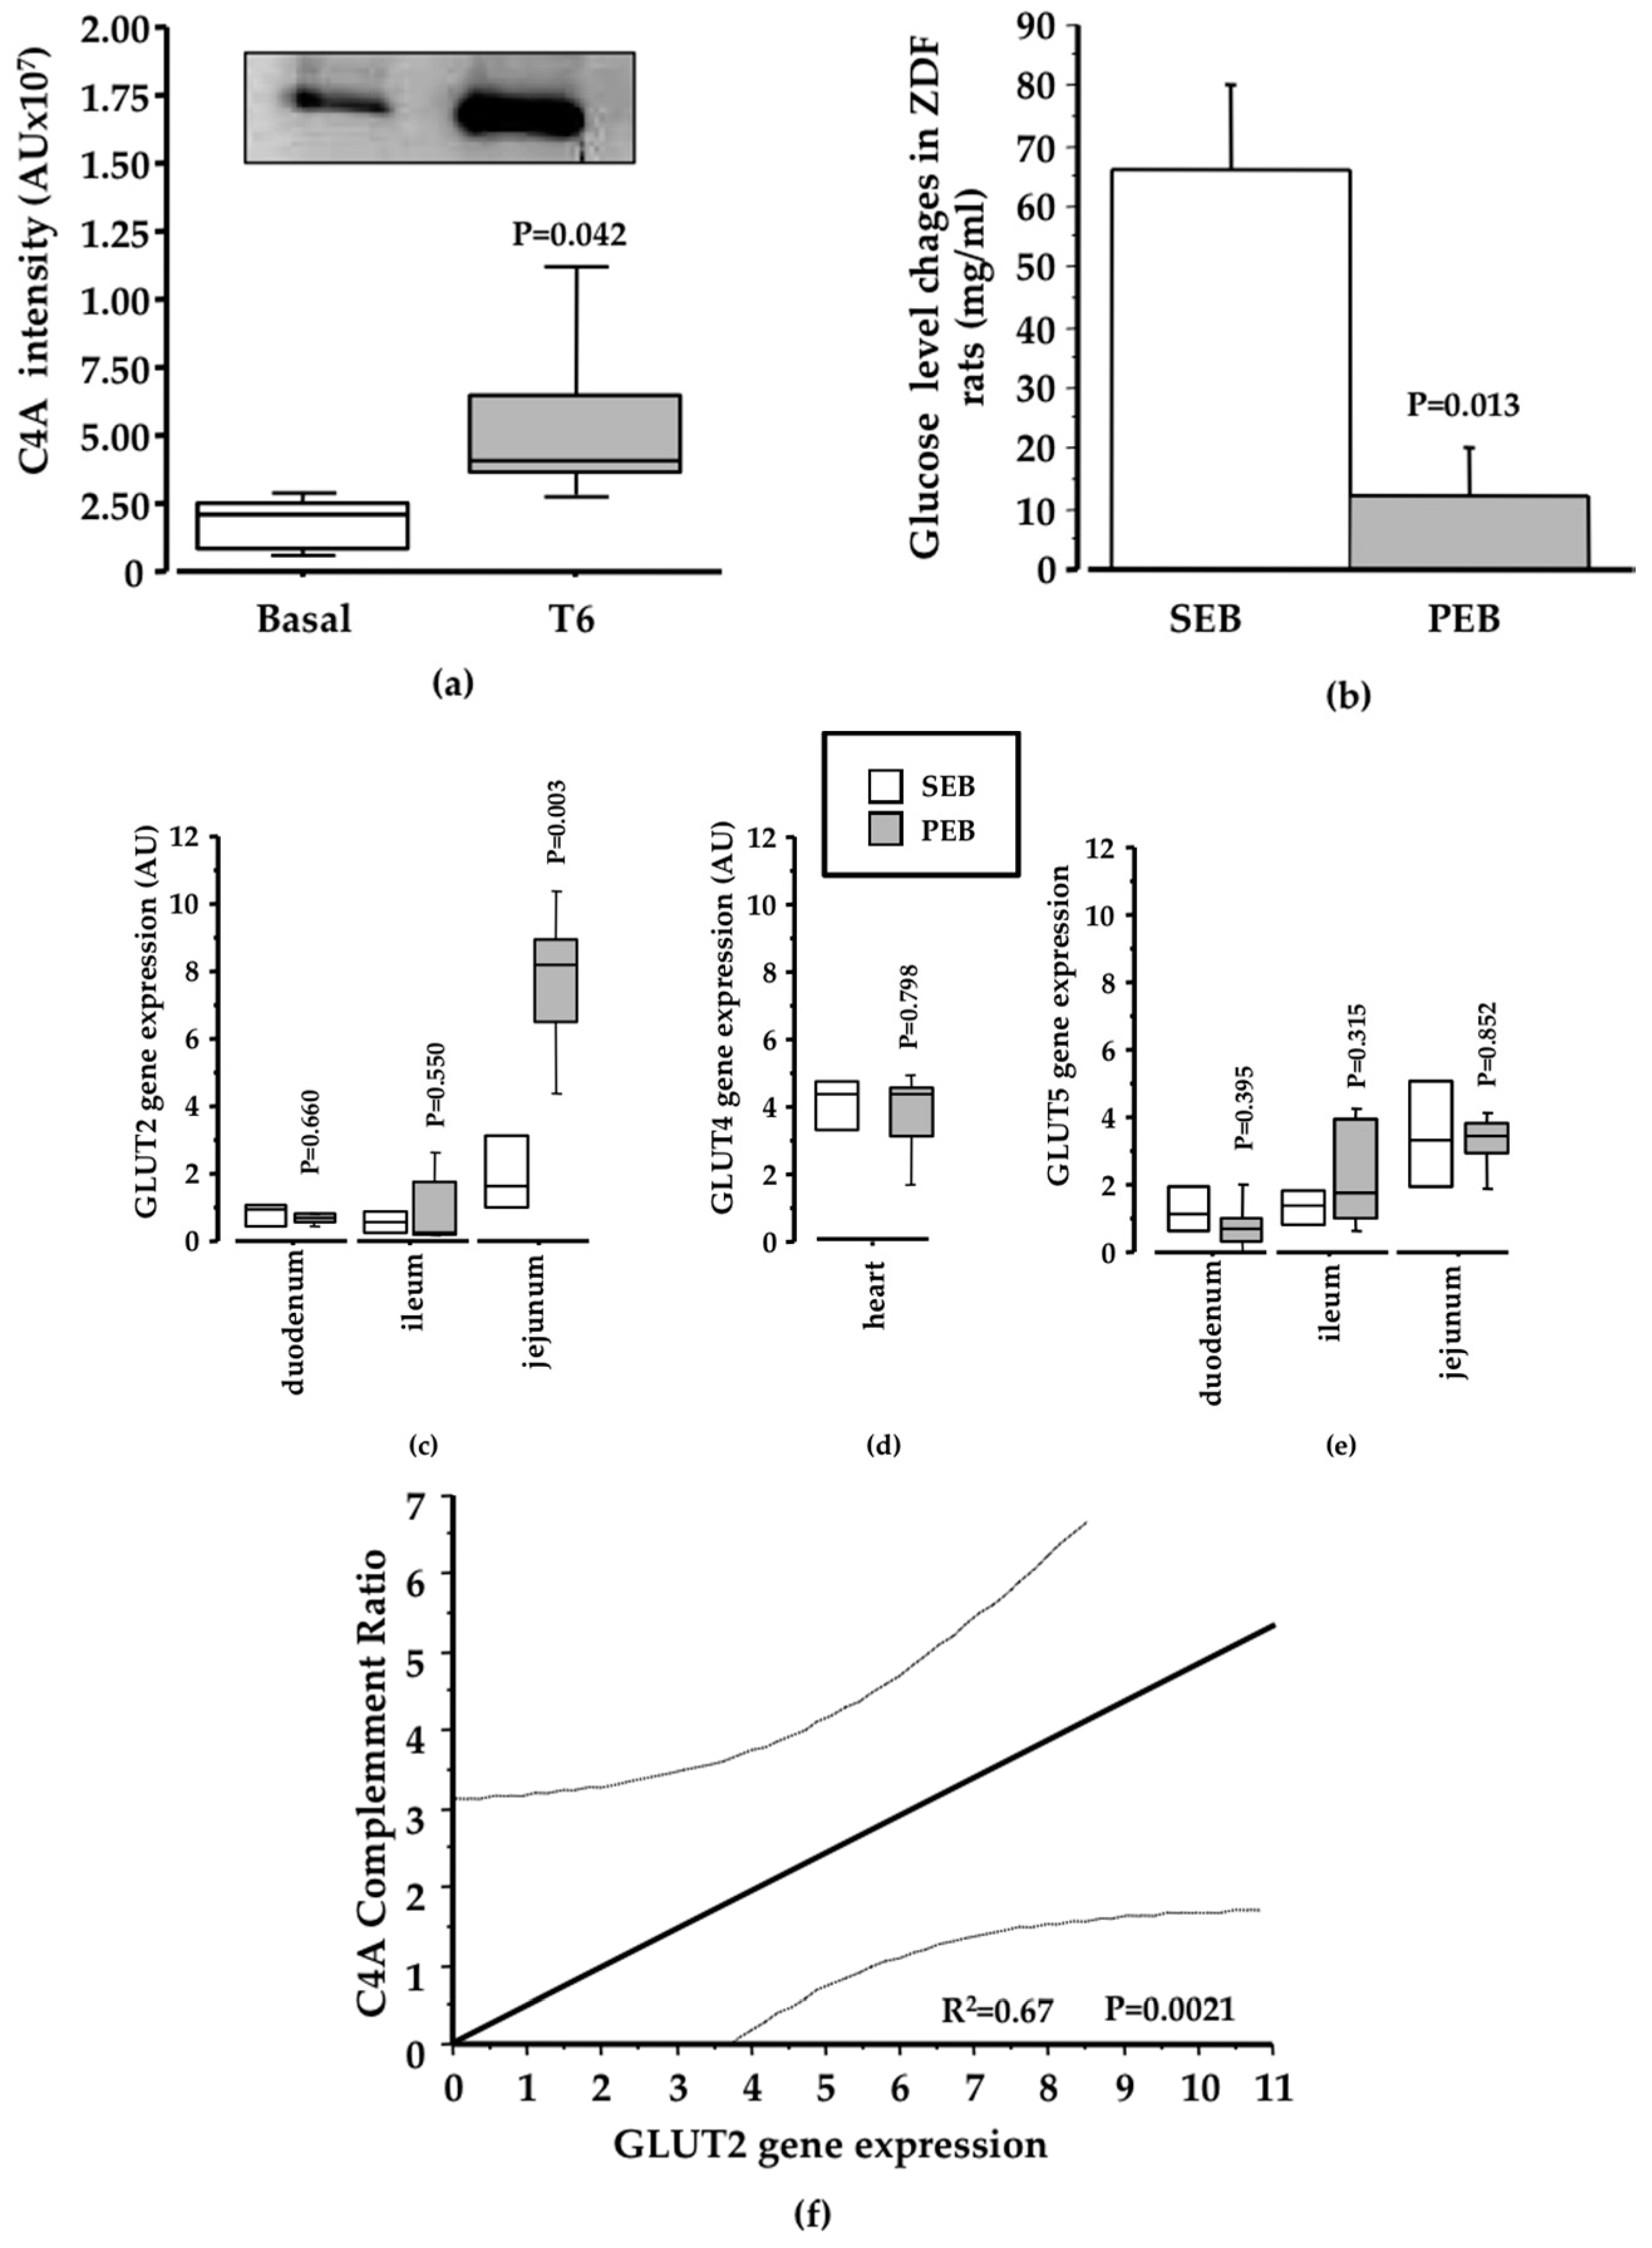
Changes in C4A serum levels were confirmed in ZDF rats by Western blot analysis, showing a significant increase in this protein after four weeks of pinitol intake compared to basal levels (P = 0.042; Figure 5a). Leptin-receptor-deficient ZDF rats acquire a very severe phenotype, reaching an average of 400 mg/dL glucose. Interestingly, sucrose feeding induced an increase in 100 mg/dL, while the pinitol solution did not impair glycaemia (Figure 5b). To further explore the potential mechanisms behind the observed Fruit-Up®-mediated effects, we analyzed the gene expression levels of three different glucose transporters (GLUT2, GLUT4 and GLUT5) at their major sites of expression. A significant increase of GLUT2 after dietary supplementation with the pinitol solution when compared to sucrose intake was observed in the jejunum (P = 0.003; Figure 5c). However, no change was observed either in GLUT4 (Figure 5d), or in GLUT5 (Figure 5e). The observed change in C4A protein levels showed a direct correlation with GLUT2 expression levels in the jejunum (P = 0.002; Figure 5f).
4. Discussion
The refined sugar intake steadily increased in the last years and it is nowadays the most commonly used sweetener for foods and beverages contributing to the high glycaemic indices of this diet [31]. High glycaemic index diets have been linked to the development of diverse metabolic diseases such as obesity, decreased insulin sensitivity, an elevated risk of developing diabetes [32] and are a risk factor for coronary heart disease [33]. Thus, the reduction of glucose levels is one of the main objectives to prevent and treat diabetes [34].
Previous studies with pinitol-enriched beverages have demonstrated a significant reduction in the post-prandial glycaemic response and glucose levels both after 24 h [16,35] and after 12 weeks of daily consumption [17] in healthy volunteers, when compared with a sucrose-based beverage. Also, its daily oral ingestion positively impacts insulin resistance [22].
Here, we have analyzed the serum proteomic profile in IGT and in healthy subjects after the intake of the pinitol-enriched beverage (PEB), to investigate the mechanisms associated with the improvement in the glycaemic response previously observed. With this aim, pair comparisons of protein-intensity values between basal conditions (before intervention) and after six weeks of PEB/SEB intake were performed for each individual. This proteomic study was based on 24 subjects randomly chosen among the total study population (six/study group) and the suitability of the groups was based on the consistent response of the plasma glucose levels to the interventions. Importantly, a significant change in the two proteins closely related with β-cell insulin secretion, IGF1BP-ALS and C4A, was observed only in IGT volunteers. IGT patients have an altered glucose metabolism compared to healthy subjects, supporting the view that IGT patients have different responses to glucose metabolism than healthy subjects. However, the findings of this proteomic approach should be further assessed in new prospective studies specifically designed to this aim.
There are multiple β-cell-related factors involved in impaired insulin secretion, such as the reduction of β-cell mass, glucotoxicity and lipotoxicity [36]. Insulin is packed into β-cells in small granules like propreinsulin, the first inactive form of insulin, with an hexameric crystalline structure, formed by six insulin units [37]. Most diabetic patients have already lost 70–80% of their original β-cell mass [38]. Each β-cell contains more than 10,000 granules, so its protection is an important strategy to prevent impaired insulin secretion [39,40]. These granules are then secreted from β-cells as proinsulin, which is composed of an insulin chain attached to C-peptide (Figure 6). IGF-1 reduces β-cell inflammation, protecting from apoptosis and promoting proliferation [41]. Therefore, the relationship of IGF-1 with the prognosis of T2DM has been widely studied. In fact, low levels of IGF-1 are related with obesity and impaired glucose tolerance [42]. In addition, IGF-1 is related with C-peptide secretion and β-cell regeneration (Figure 6) and low IGF-1 levels are associated with reduced insulin secretion and can be an important marker of β-cell function [43]. In this context, the search for strategies to maintain the levels of IGF-1 is very important to preserve β-cell function. In line with this, we found decreased IGF-1 serum levels in IGT and T2DM subjects. Importantly, IGF-1 is mainly found in a complex with one of its binding proteins (BP) and with the acid-labile subunit (ALS) [44]. ALS is an essential component to maintain the integrity of IGF-1 [44]. IGF-1 as a free molecule has a half-life shorter than 12 min, whereas this rises to 12 h when forming a complex with ALS and its BPs [30,45,46]. In this respect, ALS deficiency in humans has been characterized by a severe reduction in IGF-1 levels and insulin insensitivity [44]. Here, we have observed that the regular consumption of the pinitol-enriched beverage induced a significant increase in ALS levels in those volunteers suffering impaired glucose resistance. These results suggest that the intake of a pinitol-enriched beverage might help maintain IGF-1 levels by increasing levels of ALS, therefore improving IGF-1 stability in patients with impaired glucose metabolism. Indeed, nowadays it is recognized that the importance of a protein in a pathology lies not only in the total levels, but also in its stability, conformation and ability to make up complexes.
Besides changes in IGF1BP-ALS, an increase in C4A complement was also observed. C4A is a non-enzymatic component of the complement system, which takes part in the initial steps of the complementary pathway. The complement system is involved in several processes including the dysregulation of adipose tissue metabolism, inflammation, endothelial dysfunction and insulin resistance [47,48]. The relationship between C4A and the progression and prognosis of T2DM has not been widely studied. However, the relationship between C4A levels and insulin-dependent DM has been previously demonstrated [49,50]. In fact, low levels of this protein appear after high glucose intake [51]. Also, higher levels of C4A are associated with higher levels of C-peptide (Figure 6), indicative of enhanced insulin secretion [52,53]. C4A protein has been also suggested to protect β-cells [53] and it is involved in innate immunity [50,54,55]. With all this in mind, we sought to investigate the potential mechanism behind the increase in C4A protein levels induced by the intake of a pinitol-enriched beverage. For this purpose, we used leptin-receptor-deficient ZDF rats as an animal model of highly severe T2DM and compared those receiving PEB with those treated with sucrose solution, used as control group. While in those rats receiving sucrose a significant increase in blood glucose levels was observed, in those rats that received the PEB, glucose levels remained at the baseline. Higher levels of C4A were also found in ZDF rats after the intake of a pinitol solution when compared to sucrose intake, confirming the results of the proteomic study in humans and suggesting a potential implication of this protein in the regulation of blood glucose levels induced by the administration of the pinitol solution. β-cell protection achieved by C4A has been related to glucose transport across the plasma membrane [53]. Interestingly, we observed a significant increase in the expression of the glucose transport 2 (GLUT2) in jejunum after the regular intake of pinitol. This glucose transport is located in multiple organs and tissues, the small intestine, the pancreas, the liver and the brain. GLUT2 plays a very important role in glucose homeostasis control by an inter-organ communication system [56], including the passive movement of glucose through the cellular membrane of β-cells [57,58]. Importantly, we found that the increase in GLUT2 expression in the jejunum of ZDF rats, where pinitol is absorbed to be further distributed through the whole organism, was directly associated with the increase in C4A protein levels after pinitol intake, which suggests a protective effect on the pancreatic beta cells [53], explaining the significant difference in glucose levels after PEB and SEB interventions. In severely advanced T2DM states, as occurs in our animal model, multiple alterations within several metabolic signalling pathways, including the desensitization of GLUT2 translocation and the disruption of the insulin regulation of glucose absorption may developed. The enzyme glucokinase and GLUT2 comprise the glucose sensing system, regulating insulin secretion from pancreatic β-cells in response to nutrient intake and, therefore, preventing excessive blood glucose transport after a sugar-rich meal [59,60]. Of note, regular intake of the pinitol-enriched beverage was demonstrated to exert an insulin-mimetic activity in healthy subjects without affecting insulin secretion [16]. In fact, previous recent studies have shown the favourable effects of pinitol on the treatment of insulin-related disorders because of its insulin-like function (e.g., reduces blood glucose levels in T2DM patients) [35,61]. In this regard, we observe that the regular intake of pinitol induces a coordinated increase in C4A and GLUT2 in ZDF rats, helping to improve their metabolic system.
Diabetes mellitus is associated with β-cell destruction, so its regeneration and protection remain key strategies for the prognosis of the disease [62]. Our results suggest for the first time that the substitution of a normal sugar source with a naturally-based, pinitol-enriched beverage in IGT subjects could help to attenuate glucose metabolism disruption by inducing a coordinated change in C4A complement and IGF1BP-ALS, two important molecules with direct implications on β-cell survival. Furthermore, changes in C4A complement seem to be related to an increase in the expression of the glucose transporter GLUT2 (Figure 6). Future studies on the differential pattern of glucose transporters in various tissues, including liver and pancreas, would help the better understanding of the mechanisms directly associated with the beneficial effects on glucose metabolism after PEB intake. Therefore, we propose that the substitution of sucrose by carob pod sweetener may help efforts to normalize an impaired glucose metabolism, and to reduce the risk associated with the intake of processed sugars.
Limitations of the Study
The manuscript referred to a proteomic discovery design aimed at identifying the differential protein signatures associated with the glycaemic pattern after the regular and chronic ingestion of a pinitol-enriched beverage. Specifically, the main goal of the study was to highlight proteins potentially involved in the glycaemic response to the intervention with pinitol. However, further studies are needed to better explain mechanisms and pathways associating the pinitol intervention with changes in glucose metabolism. Thus, measuring GLUT2 in pancreas tissue would provide extra information on the beta-cell response to pinitol intake. Unfortunately, we do not have pancreas tissue to perform this analysis.
Supplementary Materials
The following are available online at https://www.mdpi.com/2072-6643/10/3/271/s1, Figure S1: Cell line chart showing the individual glucose change of each subject after 6 weeks of PEB or SEB supplementation, Table S1: Sugars characterization, Table S2: Changes in the proteomic profile after SEB intake.
Acknowledgments
The technical assistance of María Dolores Fernández and Ona Catot is gratefully acknowledged. Authors are indebted to Josep Moreno for the animal support. Finally, the authors thank the study participants for their valuable contribution and ADM&WILD-Valencia SAU especially R Salom and R García-Bou, for providing the products used in the study. This work was supported by grants from CDTI Spanish Ministry of Competitiveness and Economy (MINECO) (CEN-20101016 (HEFUFOOD) to L.B.); the Spanish Ministry of Economy and Competitiveness of Science [SAF2016-76819-R to L.B.]; Institute of Health Carlos III, ISCIII [TERCEL RD16/00110018 to L.B.; and CB16/11/0041 to L.B.; and FIS PI16/01915 to T.P.; PI16/00301 and PI15/01424 to M.R. and A.H.]; FEDER “Una Manera de Hacer Europa”; the Secretary of University and Research, Department of Economy and Knowledge of the Government of Catalonia [2014SGR1303 to L.B.]; “CERCA Programme/Generalitat de Catalunya” Spain; the Valencian Regional Ministry of Education [GV/2016/169 to M.R. and A.H.]; and FISABIO, Valencia, Spain [UGP-15-220 to M.R. and A.H.]. C.L is recipient of a pre-doctoral grant from the Spanish Ministry of Economy and Competitiveness of Science [BES-2014-068269] and M.R. is recipient of a Miguel Servet tipo II contract (CPII16/00037). We thank FIC-Fundacion Jesús Serra, Barcelona, Spain, for their continuous support.
Author Contributions
C.L. designed and conducted the research, analyzed data and performed the statistical analysis, and wrote the manuscript. J.C. designed and conducted the research, analyzed data and performed the statistical analysis, and wrote the manuscript. G.V. designed and supervised the research, analyzed data and performed the statistical analysis, and wrote the manuscript. S.L.-B. designed and supervised the research, analyzed data and performed the statistical analysis, and wrote the manuscript. T.P. designed and supervised the research, analyzed data and performed the statistical analysis, and wrote the manuscript. M.R. designed the research, provided samples, and analyzed data. A.H.-M. designed the research, provided samples, and analyzed data. L.B. designed and supervised the research, analyzed data and performed the statistical analysis, and wrote and revised the manuscript. All authors had primary responsibility for the final content and approved the final version of the manuscript.
Conflicts of Interest
The authors declare no conflict of interest.
References
- Nathan, D.M. Diabetes: Advances in Diagnosis and Treatment. JAMA 2015, 314, 1052–1062. [Google Scholar] [CrossRef] [PubMed]
- American Diabetes Association. Diagnosis and Classification of Diabetes Mellitus. Diabetes Care 2011, 34 (Suppl. S1), S062–S069. [Google Scholar]
- Hossain, P.; Kawar, B.; El Nahas, M. Obesity and diabetes in the developing world: A growing challenge. N. Engl. J. Med. 2007, 356, 213–215. [Google Scholar] [CrossRef] [PubMed]
- Kanat, M.; Defronzo, R.A.; Abdul-ghani, M.A. Treatment of prediabetes. World J. Prediabetes 2015, 6, 1207–1222. [Google Scholar] [CrossRef] [PubMed]
- Erdmann, E. Diabetes and cardiovascular risk markers. Curr. Med. Res. Opin. 2005, 21, S21–S28. [Google Scholar] [CrossRef] [PubMed]
- Desai, D.; Ahmed, H.M.; Michos, E.D. Preventing cardiovascular disease in patients with diabetes: Use of aspirin for primary prevention. Curr. Cardiol. Rep. 2015, 17, 13. [Google Scholar] [CrossRef] [PubMed]
- Augustin, L.S.A.; Kendall, C.W.C.; Jenkins, D.J.A.; Willett, W.C.; Astrup, A.; Barclay, A.W.; Björck, I.; Brand-Miller, J.C.; Brighenti, F.; Buyken, A.E.; et al. Glycemic index, glycemic load and glycemic response: An International Scientific Consensus Summit from the International Carbohydrate Quality Consortium (ICQC). Nutr. Metab. Cardiovasc. Dis. 2015, 25, 795–815. [Google Scholar] [CrossRef] [PubMed]
- Lean, M.E.J.; Morenga, L. Te Sugar and Type 2 diabetes. Sugar Diabetes 2016, 10, 43–53. [Google Scholar] [CrossRef]
- Dehghan, M.; Mente, A.; Zhang, X.; Swaminathan, S.; Li, W.; Mohan, V.; Iqbal, R.; Kumar, R.; Wentzel-Viljoen, E.; Rosengren, A.; et al. Associations of fats and carbohydrate intake with cardiovascular disease and mortality in 18 countries from five continents (PURE): A prospective cohort study. Lancet 2017, 6736, 1–13. [Google Scholar] [CrossRef]
- De Koning, L.; Malik, V.S.V.; Rimm, E.B.; Willett, W.C.; Hu, F.B. Sugar-sweetened and artificially sweetened beverage consumption and risk of type 2 diabetes in men. Am. J. Clin. Nutr. 2011, 93, 1321–1327. [Google Scholar] [CrossRef] [PubMed]
- Dhingra, R.; Sullivan, L.; Jacques, P.F.; Wang, T.J.; Fox, C.S.; Meigs, J.B.; D’Agostino, R.B.; Gaziano, J.M.; Vasan, R.S. Soft drink consumption and risk of developing cardiometabolic risk factors and the metabolic syndrome in middle-aged adults in the community. Circulation 2007, 116, 480–488. [Google Scholar] [CrossRef] [PubMed]
- Malik, V.S.; Hu, F.B. Sweeteners and risk of obesity and type 2 diabetes: The role of sugar-sweetened beverages. Curr. Diabetes Rep. 2012, 12, 195–203. [Google Scholar] [CrossRef] [PubMed]
- Welsh, J.A.; Sharma, A.; Cunningham, S.A.; Vos, M.B. Consumption of added sugars and indicators of cardiovascular disease risk among US adolescents. Circulation 2011, 123, 249–257. [Google Scholar] [CrossRef] [PubMed]
- Shearer, J.; Swithers, S.E. Artificial sweeteners and metabolic dysregulation: Lessons learned from agriculture and the laboratory. Rev. Endocr. Metab. Disord. 2016, 17, 179–186. [Google Scholar] [CrossRef] [PubMed]
- Connor, H.; Annan, F.; Bunn, E.; Frost, G.; McGough, N.; Sarwar, T.; Thomas, B. The implementation of nutritional advice for people with diabetes. Diabet. Med. 2003, 20, 786–807. [Google Scholar] [PubMed]
- Hernández-Mijares, A.; Bañuls, C.; Peris, J.E.; Monzó, N.; Jover, A.; Bellod, L.; Victor, V.M.; Rocha, M. A single acute dose of pinitol from a naturally-occurring food ingredient decreases hyperglycaemia and circulating insulin levels in healthy subjects. Food Chem. 2013, 141, 1267–1272. [Google Scholar] [CrossRef] [PubMed]
- Bañuls, C.; Rovira-Llopis, S.; Falcón, R.; Veses, S.; Monzó, N.; Víctor, V.M.; Rocha, M.; Hernández-Mijares, A. Chronic consumption of an inositol-enriched carob extract improves postprandial glycaemia and insulin sensitivity in healthy subjects: A randomized controlled trial. Clin. Nutr. 2016, 35, 600–607. [Google Scholar] [CrossRef] [PubMed]
- Regidor, P.A.; Schindler, A.E. Myoinositol as a Safe and Alternative Approach in the Treatment of Infertile PCOS Women: A German Observational Study. Int. J. Endocrinol. 2016, 2016, 2–7. [Google Scholar] [CrossRef] [PubMed]
- Davis, A.; Christiansen, M.A.; Horowitz, J.F.; Klein, S.; Hellerstein, M.K.; Ostlund, R.E. Effect of pinitol treatment on insulin action in subjects with insulin resistance. Diabetes Care 2000, 23, 1000–1005. [Google Scholar] [CrossRef] [PubMed]
- Jones, A.G.; Hattersley, A.T. The clinical utility of C-peptide measurement in the care of patients with diabetes. Diabet. Med. 2013, 30, 803–817. [Google Scholar] [CrossRef] [PubMed]
- Hernández-Mijares, A.; Bañuls, C.; Rovira-Llopis, S.; Álvarez, Á.; Orden, S.; Rubio-Puchol, O.; Víctor, V.M.; Rocha, M. Chronic consumption of an inositol-enriched beverage ameliorates endothelial dysfunction and oxidative stress in type 2 diabetes. J. Funct. Foods 2015, 18, 598–607. [Google Scholar] [CrossRef]
- Bañuls, C.; Rovira-Llopis, S.; López-Doménech, S.; Veses, S.; Víctor, V.M.; Rocha, M.; Hernández-Mijares, A. Effect of consumption of a carob pod inositol-enriched beverage on insulin sensitivity and inflammation in middle-aged prediabetic subjects. Food Funct. 2016, 7, 4379–4387. [Google Scholar] [CrossRef] [PubMed]
- Cubedo, J.; Padró, T.; García-Moll, X.; Pintó, X.; Cinca, J.; Badimon, L. Proteomic signature of apolipoprotein J in the early phase of new-onset myocardial infarction. J. Proteome Res. 2011, 10, 211–220. [Google Scholar] [CrossRef] [PubMed]
- Cubedo, J.; Padro, T.; Garcia-Moll, X.; Pinto, X.; Cinca, J.; Badimon, L. Serum proteome in acute myocardial infarction. Clin. Investig. Arterioscler. 2011, 23, 147–154. [Google Scholar] [CrossRef]
- Cubedo, J.; Padró, T.; Badimon, L. Coordinated proteomic signature changes in immune response and complement proteins in acute myocardial infarction: The implication of serum amyloid P-component. Int. J. Cardiol. 2013, 168, 5196–5204. [Google Scholar] [CrossRef] [PubMed]
- Cubedo, J.; Padró, T.; García-Arguinzonis, M.; Vilahur, G.; Miñambres, I.; Pou, J.M.; Ybarra, J.; Badimon, L. A novel truncated form of apolipoprotein A-I transported by dense LDL is increased in diabetic patients. J. Lipid Res. 2015, 56, 1762–1773. [Google Scholar] [CrossRef] [PubMed]
- Cubedo, J.; Padro, T.; Badimon, L. Glycoproteome of human apolipoprotein A-I: N- and O-glycosylated forms are increased in patients with acute myocardial infarction. Transl. Res. 2014, 164, 209–222. [Google Scholar] [CrossRef] [PubMed]
- Tofovic, S.P.; Jackson, E.K. Rat models of the metabolic syndrome. Methods Mol. Med. 2003, 86, 29–46. [Google Scholar] [CrossRef] [PubMed]
- Angel, I.; Bidet, S.; Langer, S.Z. Pharmacological characterization of the hyperglycemia induced by alpha-2 adrenoceptor agonists. J. Pharmacol. Exp. Ther. 1988, 246, 1098–1103. [Google Scholar] [PubMed]
- Rensing, K.L.; van Duyvenvoorde, H.A.; Cramer, M.J.; Teske, A.J.; Prokop, M.; Stroes, E.S.; Wit, J.M.; Hermus, A.R.M.M.; Twickler, T.B. Case report: Low circulating IGF-I levels due to Acid-Labile Subunit deficiency in adulthood are not associated with early development of atherosclerosis and impaired heart function. Growth Horm. IGF Res. 2011, 21, 233–237. [Google Scholar] [CrossRef] [PubMed]
- Bray, G.; Popkin, B. Dietary sugar and body weight: Have we reached a crisis in the epidemic of obesity and diabetes? Health be damned! Pour on the sugar. Diabetes Care 2014, 37, 950–956. [Google Scholar] [CrossRef] [PubMed]
- Hodge, A.M.; English, D.R.; O’Dea, K.; Giles, G.G. Glycemic index and dietary fiber and the risk of type 2 diabetes. Diabetes Care 2004, 27, 2701–2706. [Google Scholar] [CrossRef] [PubMed]
- Denova-Gutiérrez, E.; Huitrón-Bravo, G.; Talavera, J.O.; Castañón, S.; Gallegos-Carrillo, K.; Flores, Y.; Salmerón, J. Dietary glycemic index, dietary glycemic load, blood lipids, and coronary heart disease. J. Nutr. Metab. 2010, 2010. [Google Scholar] [CrossRef] [PubMed]
- Asif, M. The prevention and control the type-2 diabetes by changing lifestyle and dietary pattern. J. Educ. Health Promot. 2014, 3. [Google Scholar] [CrossRef] [PubMed]
- Rafael, S.A.; Henry, C.J.K. FRUIT UP (new food ingredient from wild): Scientific review of its healthful properties. Nutrición Clínica y Dietética Hospitalaria 2010, 30, 15–25. [Google Scholar]
- Wallace, M.; Whelan, H.; Brennan, L. Metabolomic analysis of pancreatic beta cells following exposure to high glucose. Biochim. Biophys. Acta 2013, 1830, 2583–2590. [Google Scholar] [CrossRef] [PubMed]
- Fu, Z.; Gilbert, E.R.; Li, D. Regulation of Insulin Synthesis and Secretion and Pancreatic Beta-Cell Dysfunction in Diabetes. Curr. Diabetes Rev. 2012, 9, 25–53. [Google Scholar] [CrossRef]
- Cnop, M.; Welsh, N.; Jonas, J.C.; Jorns, A.; Lenzen, S.; Eizirik, D.L. Mechanisms of pancreatic beta-cell death in type 1 and type 2 diabetes: Many differences, few similarities. Diabetes 2005, 54 (Suppl. S2), S97–S107. [Google Scholar] [CrossRef] [PubMed]
- Rorsman, P.; Renström, E. Insulin granule dynamics in pancreatic beta cells. Diabetologia 2003, 46, 1029–1045. [Google Scholar] [CrossRef] [PubMed]
- Roder, P.V.; Wong, X.; Hong, W.; Han, W. Molecular regulation of insulin granule biogenesis and exocytosis. Biochem. J. 2016, 473, 2737–2756. [Google Scholar] [CrossRef] [PubMed]
- Chen, W.; Salojin, K.V.; Mi, Q.S.; Grattan, M.; Meagher, T.C.; Zucker, P.; Delovitch, T.L. Insulin-Like Growth Factor (IGF)-I/IGF-Binding Protein-3 Complex: Therapeutic Efficacy and Mechanism of Protection against Type 1 Diabetes. Endocrinology 2004, 145, 627–638. [Google Scholar] [CrossRef] [PubMed]
- Kajantie, E.; Eriksson, J. Serum Insulin-like Growth Factor (IGF)-I and IGF-Binding Protein-1 in Elderly People: Relationships with Cardiovascular Risk Factors, Body Composition, Size at Birth, and Childhood Growth. J. Clin. Endocrinol. Metab. 2003, 88, 1059–1065. [Google Scholar] [CrossRef] [PubMed]
- Thankamony, A.; Capalbo, D.; Marcovecchio, M.L.; Sleigh, A.; Jørgensen, S.W.; Hill, N.R.; Mooslehner, K.; Yeo, G.S.H.; Bluck, L.; Juul, A.; et al. Low circulating levels of IGF-1 in healthy adults are associated with reduced β-cell function, increased intramyocellular lipid, and enhanced fat utilization during fasting. J. Clin. Endocrinol. Metab. 2014, 99, 2198–2207. [Google Scholar] [CrossRef] [PubMed]
- Domené, H.M.; Hwa, V.; Héctor, G. Jasper; Rosenfeld, R.G. Acid-labile subunit (ALS) deficiency. Best Pract. Res. Clin. Endocrinol. Metab. J. 2011, 25, 101–113. [Google Scholar] [CrossRef]
- Boisclair, Y.R.; Rhoads, R.P.; Ueki, I.; Wang, J.; Ooi, G.T. The acid-labile subunit (ALS) of the 150 kDa IGF-binding protein complex: An important but forgotten component of the circulating IGF system. J. Endocrinol. 2001, 170, 63–70. [Google Scholar] [CrossRef] [PubMed]
- Guler, H.P.; Zapf, J.; Schmid, C.; Froesch, E.R. Insulin-like growth factors I and II in healthy man. Estimations of half-lives and production rates. Acta Endocrinol. 1989, 121, 753–758. [Google Scholar] [PubMed]
- Gilmore, J.H. NIH Public Access. AJNR Am. J. Neuroradiol. 2008, 29, 1883–1889. [Google Scholar] [CrossRef]
- Charlesworth, J.A.; Timmermans, V.; Golding, J.; Campbell, L.V.; Peake, P.W.; Pussell, B.A.; Wakefield, D.; Howard, N. The complement system in Type 1 (insulin-dependent) diabetes. Diabetologia 1987, 30, 372–379. [Google Scholar] [CrossRef] [PubMed]
- Jenhani, F.; Bardi, R.; Gorgi, Y.; Ayed, K.; Jeddi, M. C4 polymorphism in multiplex families with insulin dependent diabetes in the Tunisian population: Standard C4 typing methods and RFLP analysis. J. Autoimmun. 1992, 5, 149–160. [Google Scholar] [CrossRef]
- Szilagyi, A.; Blasko, B.; Szilassy, D.; Fust, G.; Sasvari-szekely, M.; Ronai, Z. Real-time PCR quantification of human complement C4A and C4B genes. BMC Genet. 2006, 7, 1–9. [Google Scholar] [CrossRef] [PubMed]
- Wang, H.; Tian, Y.; Chien, C.; Kan, W.; Liao, P.; Wu, H.; Su, S.; Lin, C. Differential proteomic characterization between normal peritoneal fluid and diabetic peritoneal dialysate. Nephrol. Dial. Transpl. 2010, 25, 1955–1963. [Google Scholar] [CrossRef] [PubMed]
- Lappas, M. Lower circulating levels of complement split proteins C3a and C4a in maternal plasma of women with gestational diabetes mellitus. Diabet. Med. 2011, 28, 906–911. [Google Scholar] [CrossRef] [PubMed]
- Kingery, S.E.; Wu, Y.L.; Zhou, B.; Hoffman, R.P.; Yu, C.Y. Gene Copy-Number Variations (CNVs) and Protein Levels of Complement C4A and C4B as Novel Biomarkers for Partial Disease Remissions in New-Onset Type 1 Diabetes Patients. Pediatr. Diabetes 2012, 13, 408–418. [Google Scholar] [CrossRef] [PubMed]
- Lintner, K.E.; Wu, Y.L.; Yang, Y.; Spencer, C.H.; Hauptmann, G.; Hebert, L.A.; Atkinson, J.P.; Yu, C.Y. Early components of the complement classical activation pathway in human systemic autoimmune diseases. Front. Immunol. 2016, 7, 1–22. [Google Scholar] [CrossRef] [PubMed]
- Nityanand, S.; Hamsten, A.; Lithell, H.; Holm, G.; Lefvert, A.K. C4 null alleles and myocardial infarction. Atherosclerosis 1999, 143, 377–381. [Google Scholar] [CrossRef]
- Thorens, B. GLUT2, glucose sensing and glucose homeostasis. Diabetologia 2014, 58, 221–232. [Google Scholar] [CrossRef] [PubMed]
- Gould, G.W.; Holman, G.D. The glucose transporter family: Structure, function and tissue-specific expression. Biochem. J. 1993, 295, 329–341. [Google Scholar] [CrossRef] [PubMed]
- Bell, G.I.; Kayano, T.; Buse, J.B.; Burant, C.F.; Takeda, J.; Lin, D.; Fukumoto, H.; Seino, S. Molecular biology of mammalian glucose transporters. Diabetes Care 1990, 13, 198–208. [Google Scholar] [CrossRef] [PubMed]
- Liu, G.J.; Simpson, A.M.; Swan, M.A.; Tao, C.; Tuch, B.E.; Crawford, R.M.; Jovanovic, A.; Martin, D.K. ATP-sensitive potassium channels induced in liver cells after transfection with insulin cDNA and the GLUT2 transporter regulate glucose-stimulated insulin secretion. FASEB J. 2003, 17, 1682–1684. [Google Scholar] [CrossRef] [PubMed]
- Tobin, V.; Le Gall, M.; Fioramonti, X.; Stolarczyk, E.; Blazquez, A.G.; Klein, C.; Prlgent, M.; Serradas, P.; Cuif, M.H.; Magnan, C.; et al. Insulin internalizes GLUT2 in the enterocytes of healthy but not insulin-resistant mice. Diabetes 2008, 57, 555–562. [Google Scholar] [CrossRef] [PubMed]
- Yamashita, Y.; Yamaoka, M.; Hasunuma, T.; Ashida, H.; Yoshida, K.I. Detection of orally administered inositol stereoisomers in mouse blood plasma and their effects on translocation of glucose transporter 4 in skeletal muscle cells. J. Agric. Food Chem. 2013, 61, 4850–4854. [Google Scholar] [CrossRef] [PubMed]
- Stewart, A.F.S.A.; Wang, P.; Fiaschi-Taesch, N.M.; Vasavada, R.C.; Scott, D.K.; García-Ocaña, A.; Stewart, A.F. Diabetes mellitus—Advances and challenges in human β cell proliferation. Nat. Rev. Endocrinol. 2015, 11, 201–212. [Google Scholar] [CrossRef]
Figure 1.
Human study design (a) Blood samples were obtained before and after six weeks of daily sucrose/pinitol-enriched beverage supplementation; (b) Study workflow. A proteomic approach was used to identify changes in the proteomic profile of the different plasma fractions of healthy and impaired glucose tolerance (IGT) volunteers after the intake of the sucrose/pinitol-enriched beverage (N = 6 each group).
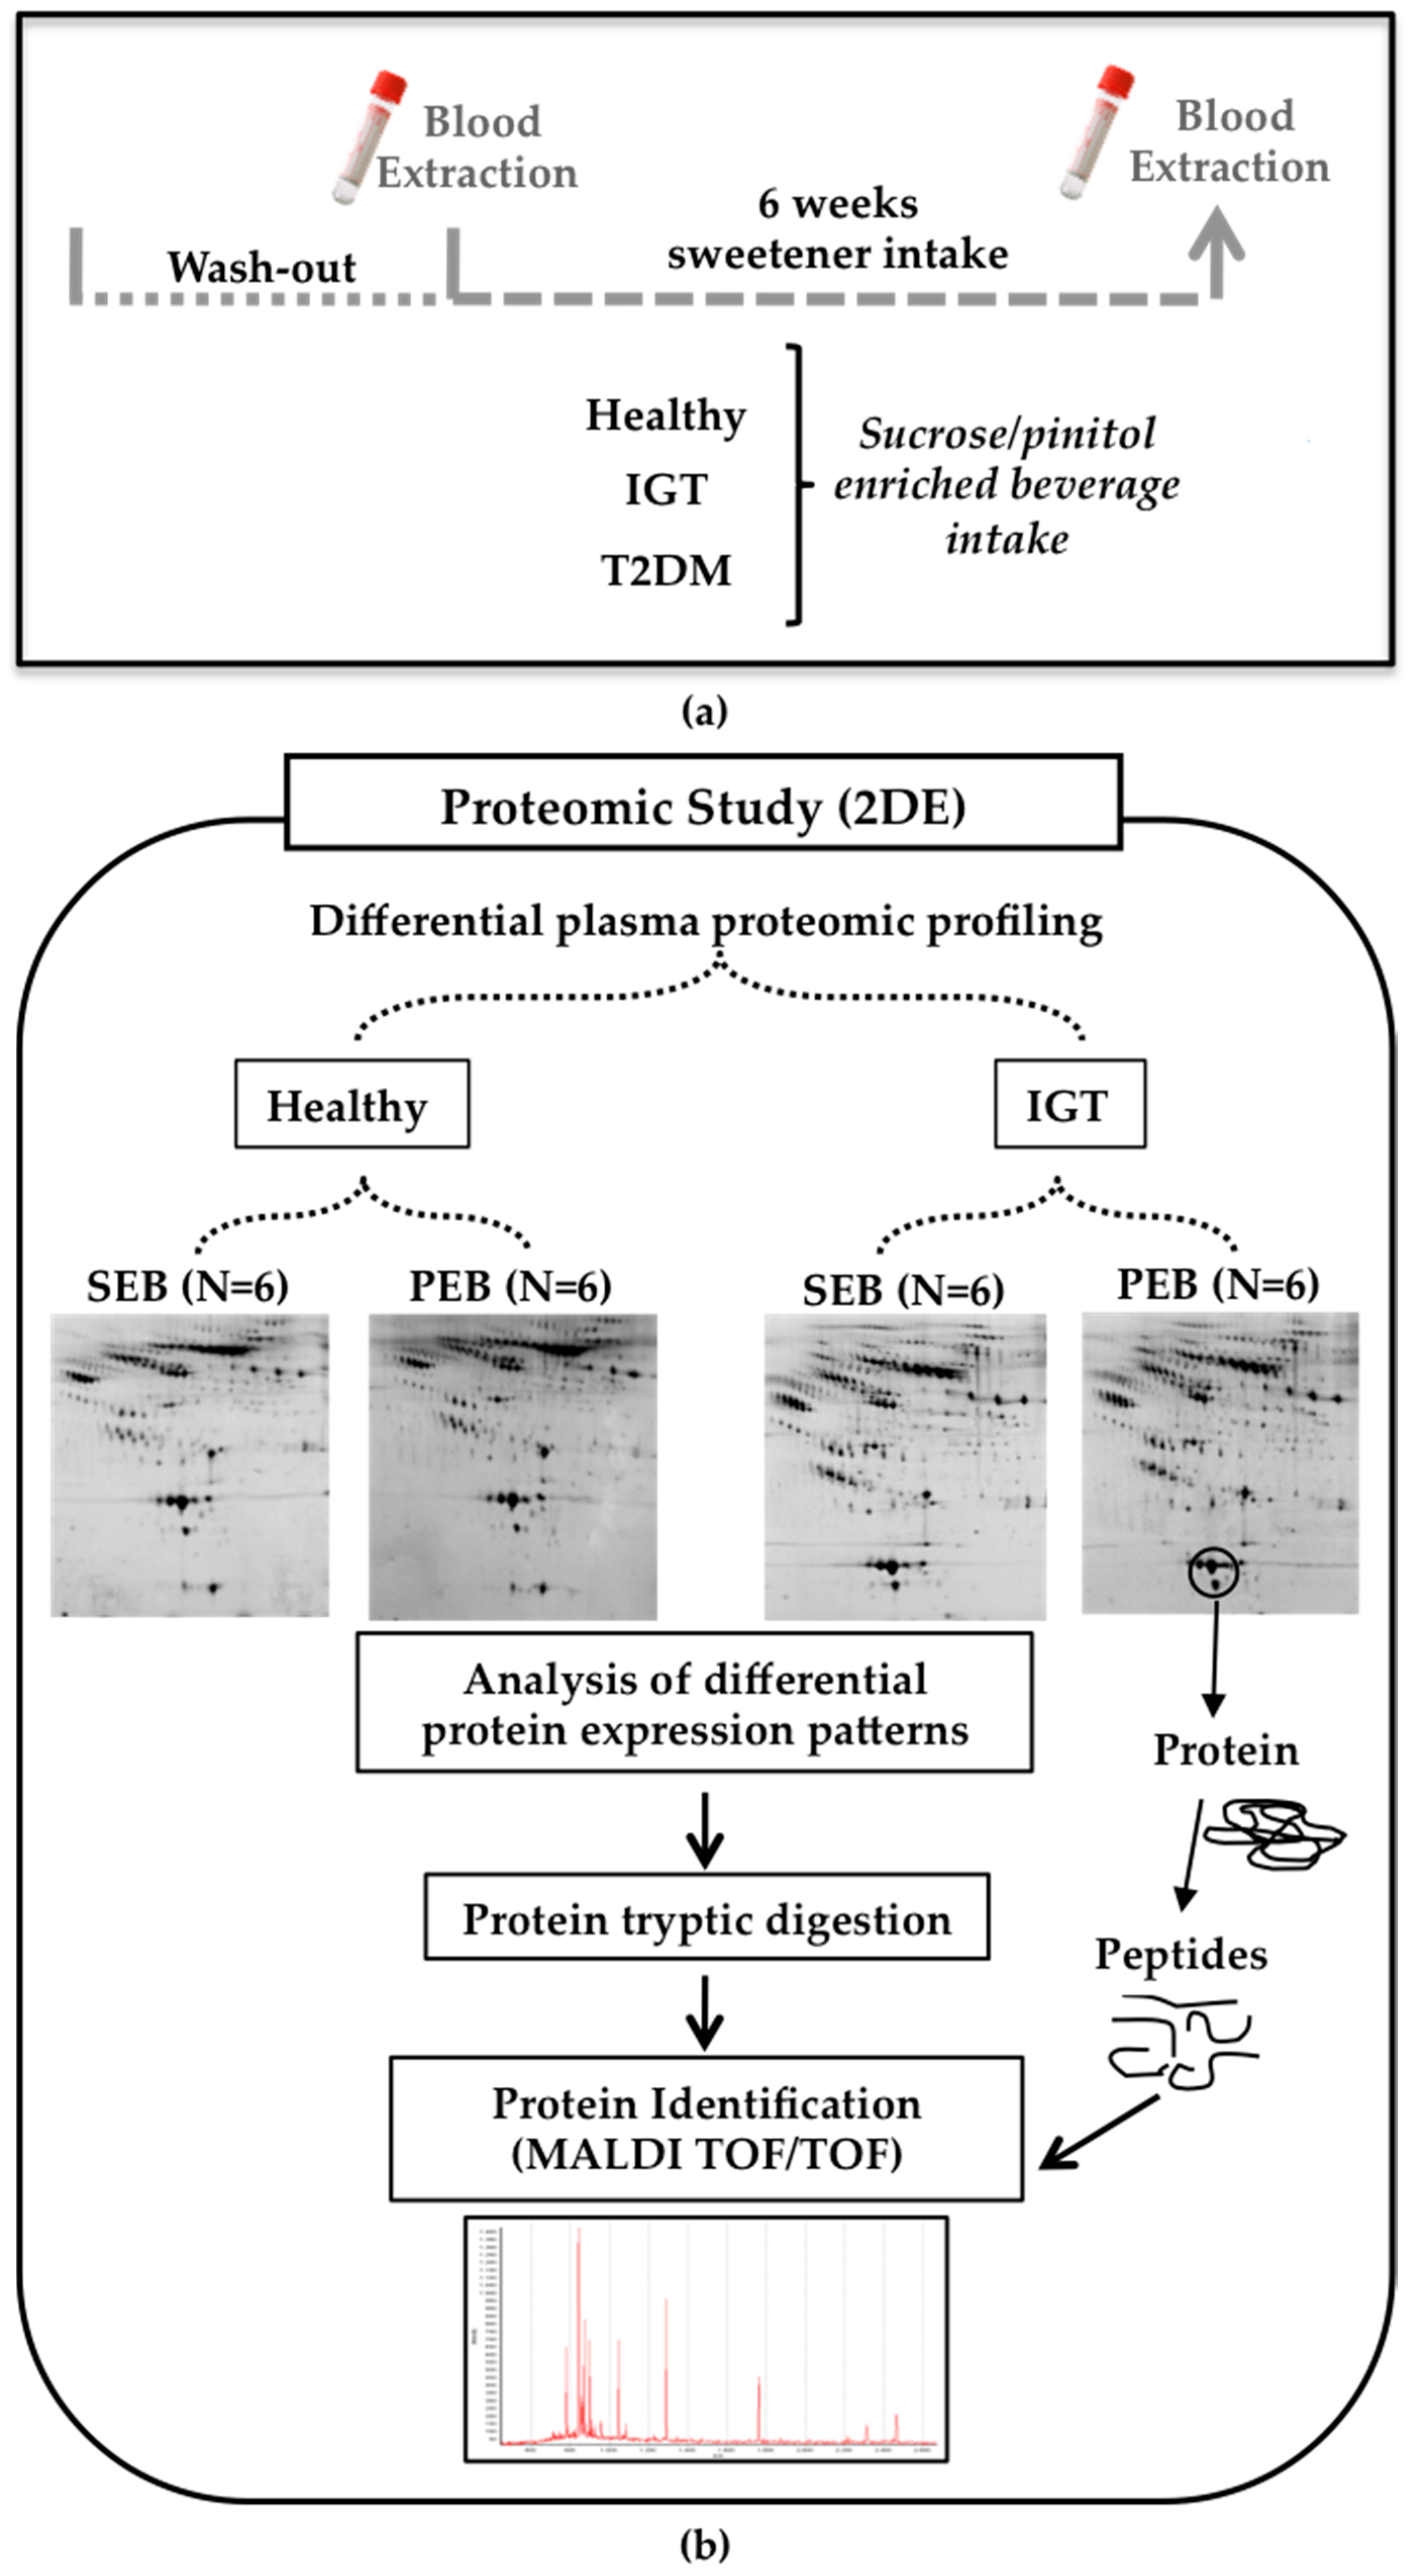
Figure 2.
Zucker diabetic fatty (ZDF) rat study design. Blood samples were obtained at baseline and after 28 days of sucrose/pinitol-enriched beverage administration. Tissues were obtained, frozen in liquid nitrogen and stored at −80 °C until used.
Figure 2.
Zucker diabetic fatty (ZDF) rat study design. Blood samples were obtained at baseline and after 28 days of sucrose/pinitol-enriched beverage administration. Tissues were obtained, frozen in liquid nitrogen and stored at −80 °C until used.
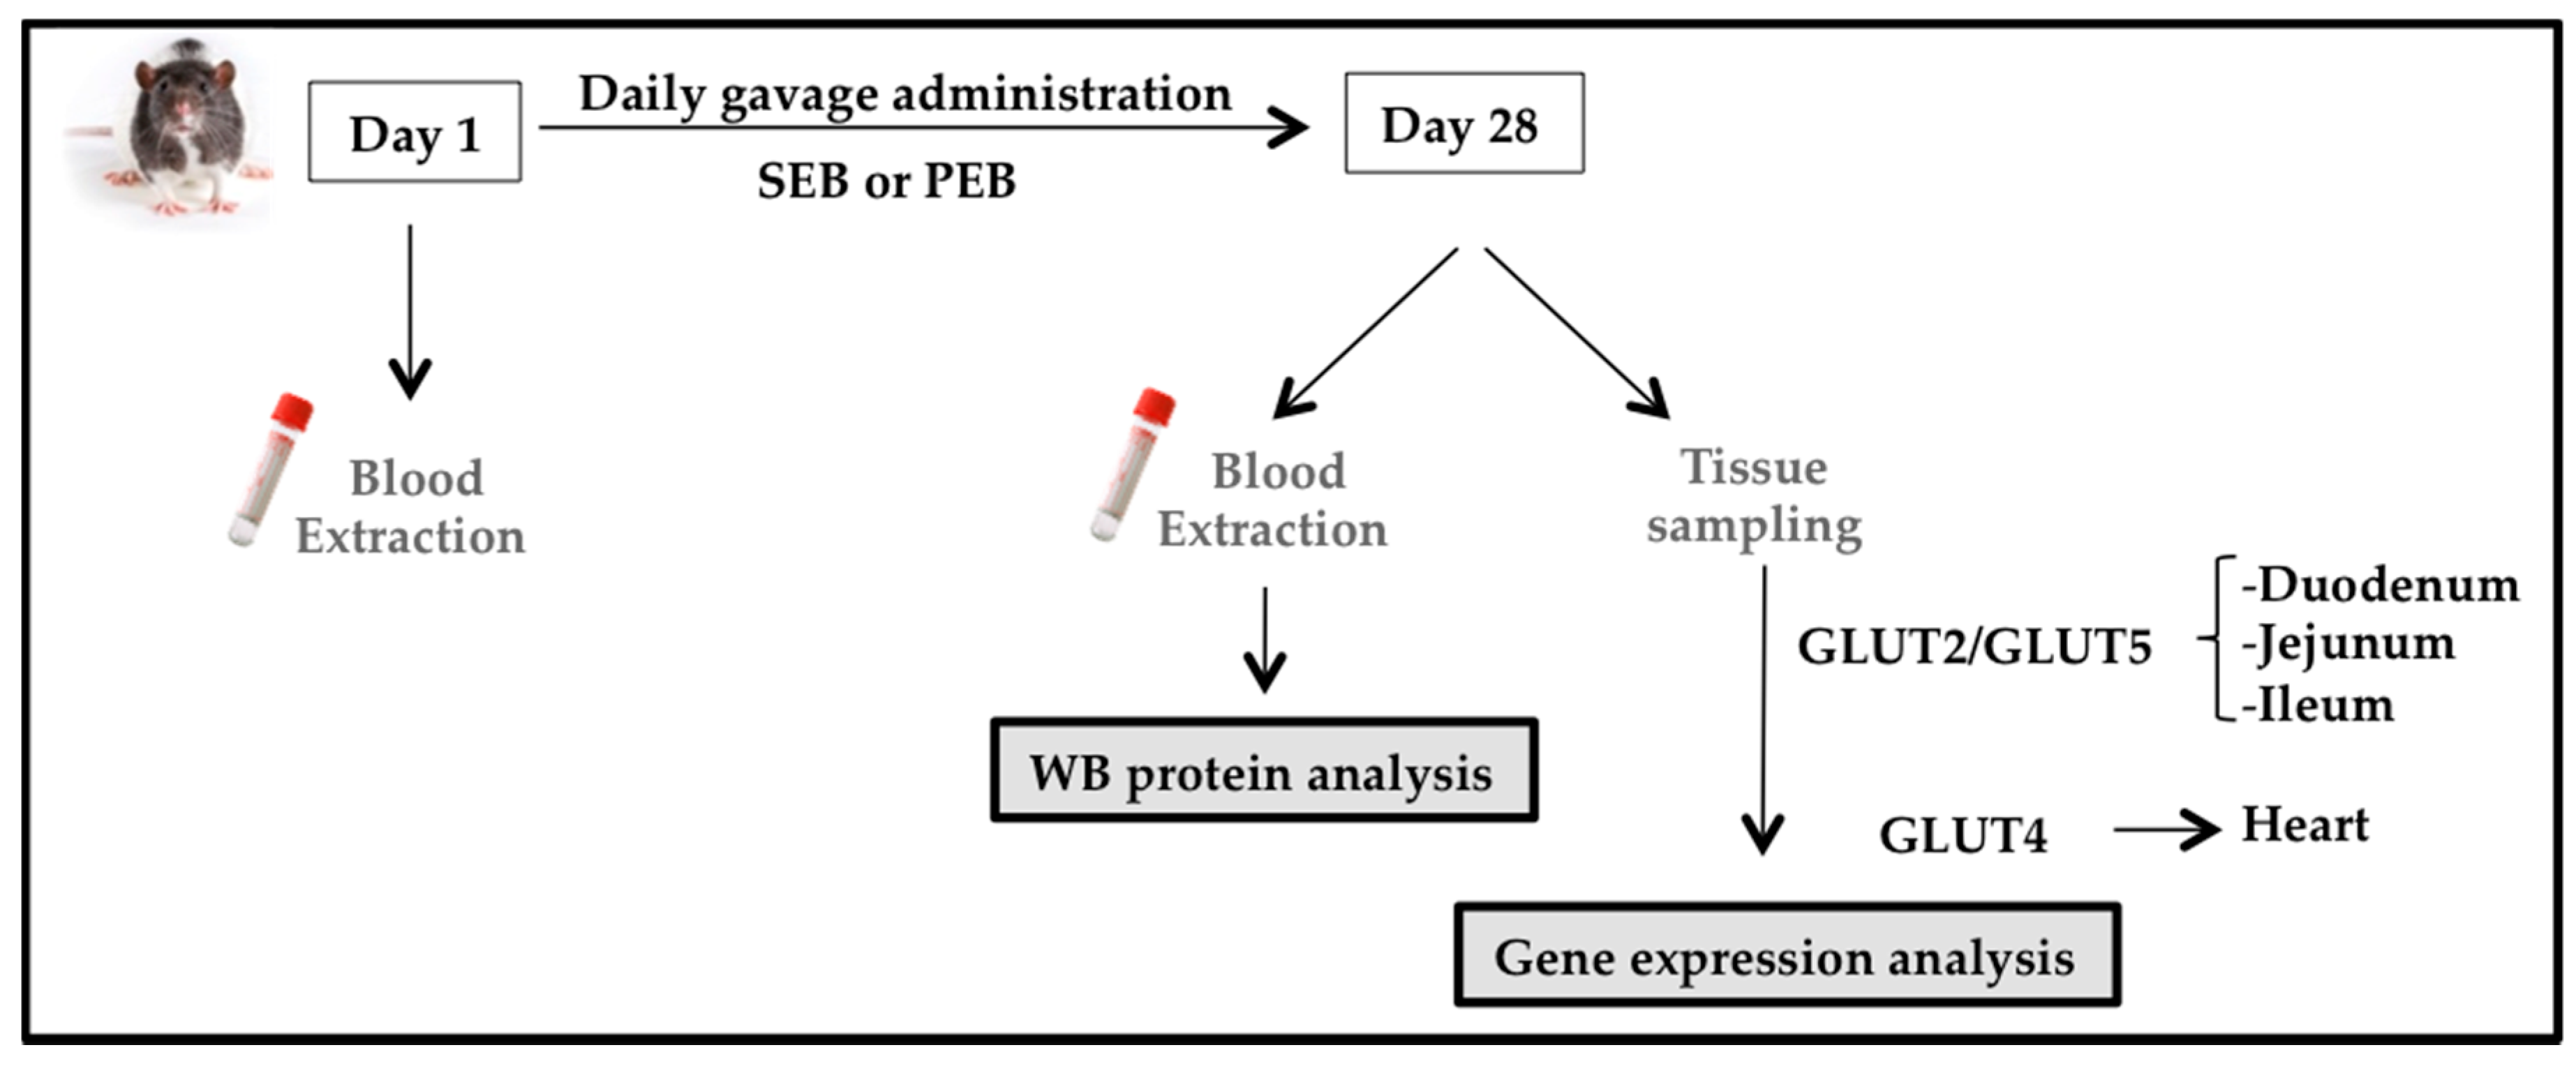
Figure 3.
Changes in the proteomic profile. (a) Line diagram and representative 2-DE (two-dimension electrophoresis) images showing IGF1BP-ALS (Insulin-like growth factor-1 binding protein acid labile subunit) change after six weeks of sucrose/pinitol-enriched beverage intake. Change in IGF1BP-ALS level was higher in IGT patients compared to healthy subjects (N = 6; P = 0.200) is observed in IGT patients; (b) Representative 2-DE images of C4A complement alpha and gamma chain. Alpha chain corresponds to the 27% of the total C4A complement identified complement. Gamma chain represents the 77% of the total C4A complement identified protein (c) Line diagram showing total C4A complement change of both healthy and IGT volunteers after the intake of the pinitol-enriched beverage. A significant change increase of the C4A complement level (N = 6; P = 0.02) is observed on IGT patients; (d) Line diagram showing C4A complement gamma chain of both healthy and IGT volunteers after the intake of the pinitol-enriched beverage. A significant change increase of C4A complement level (N = 6; P = 0.02) is observed in IGT patients.
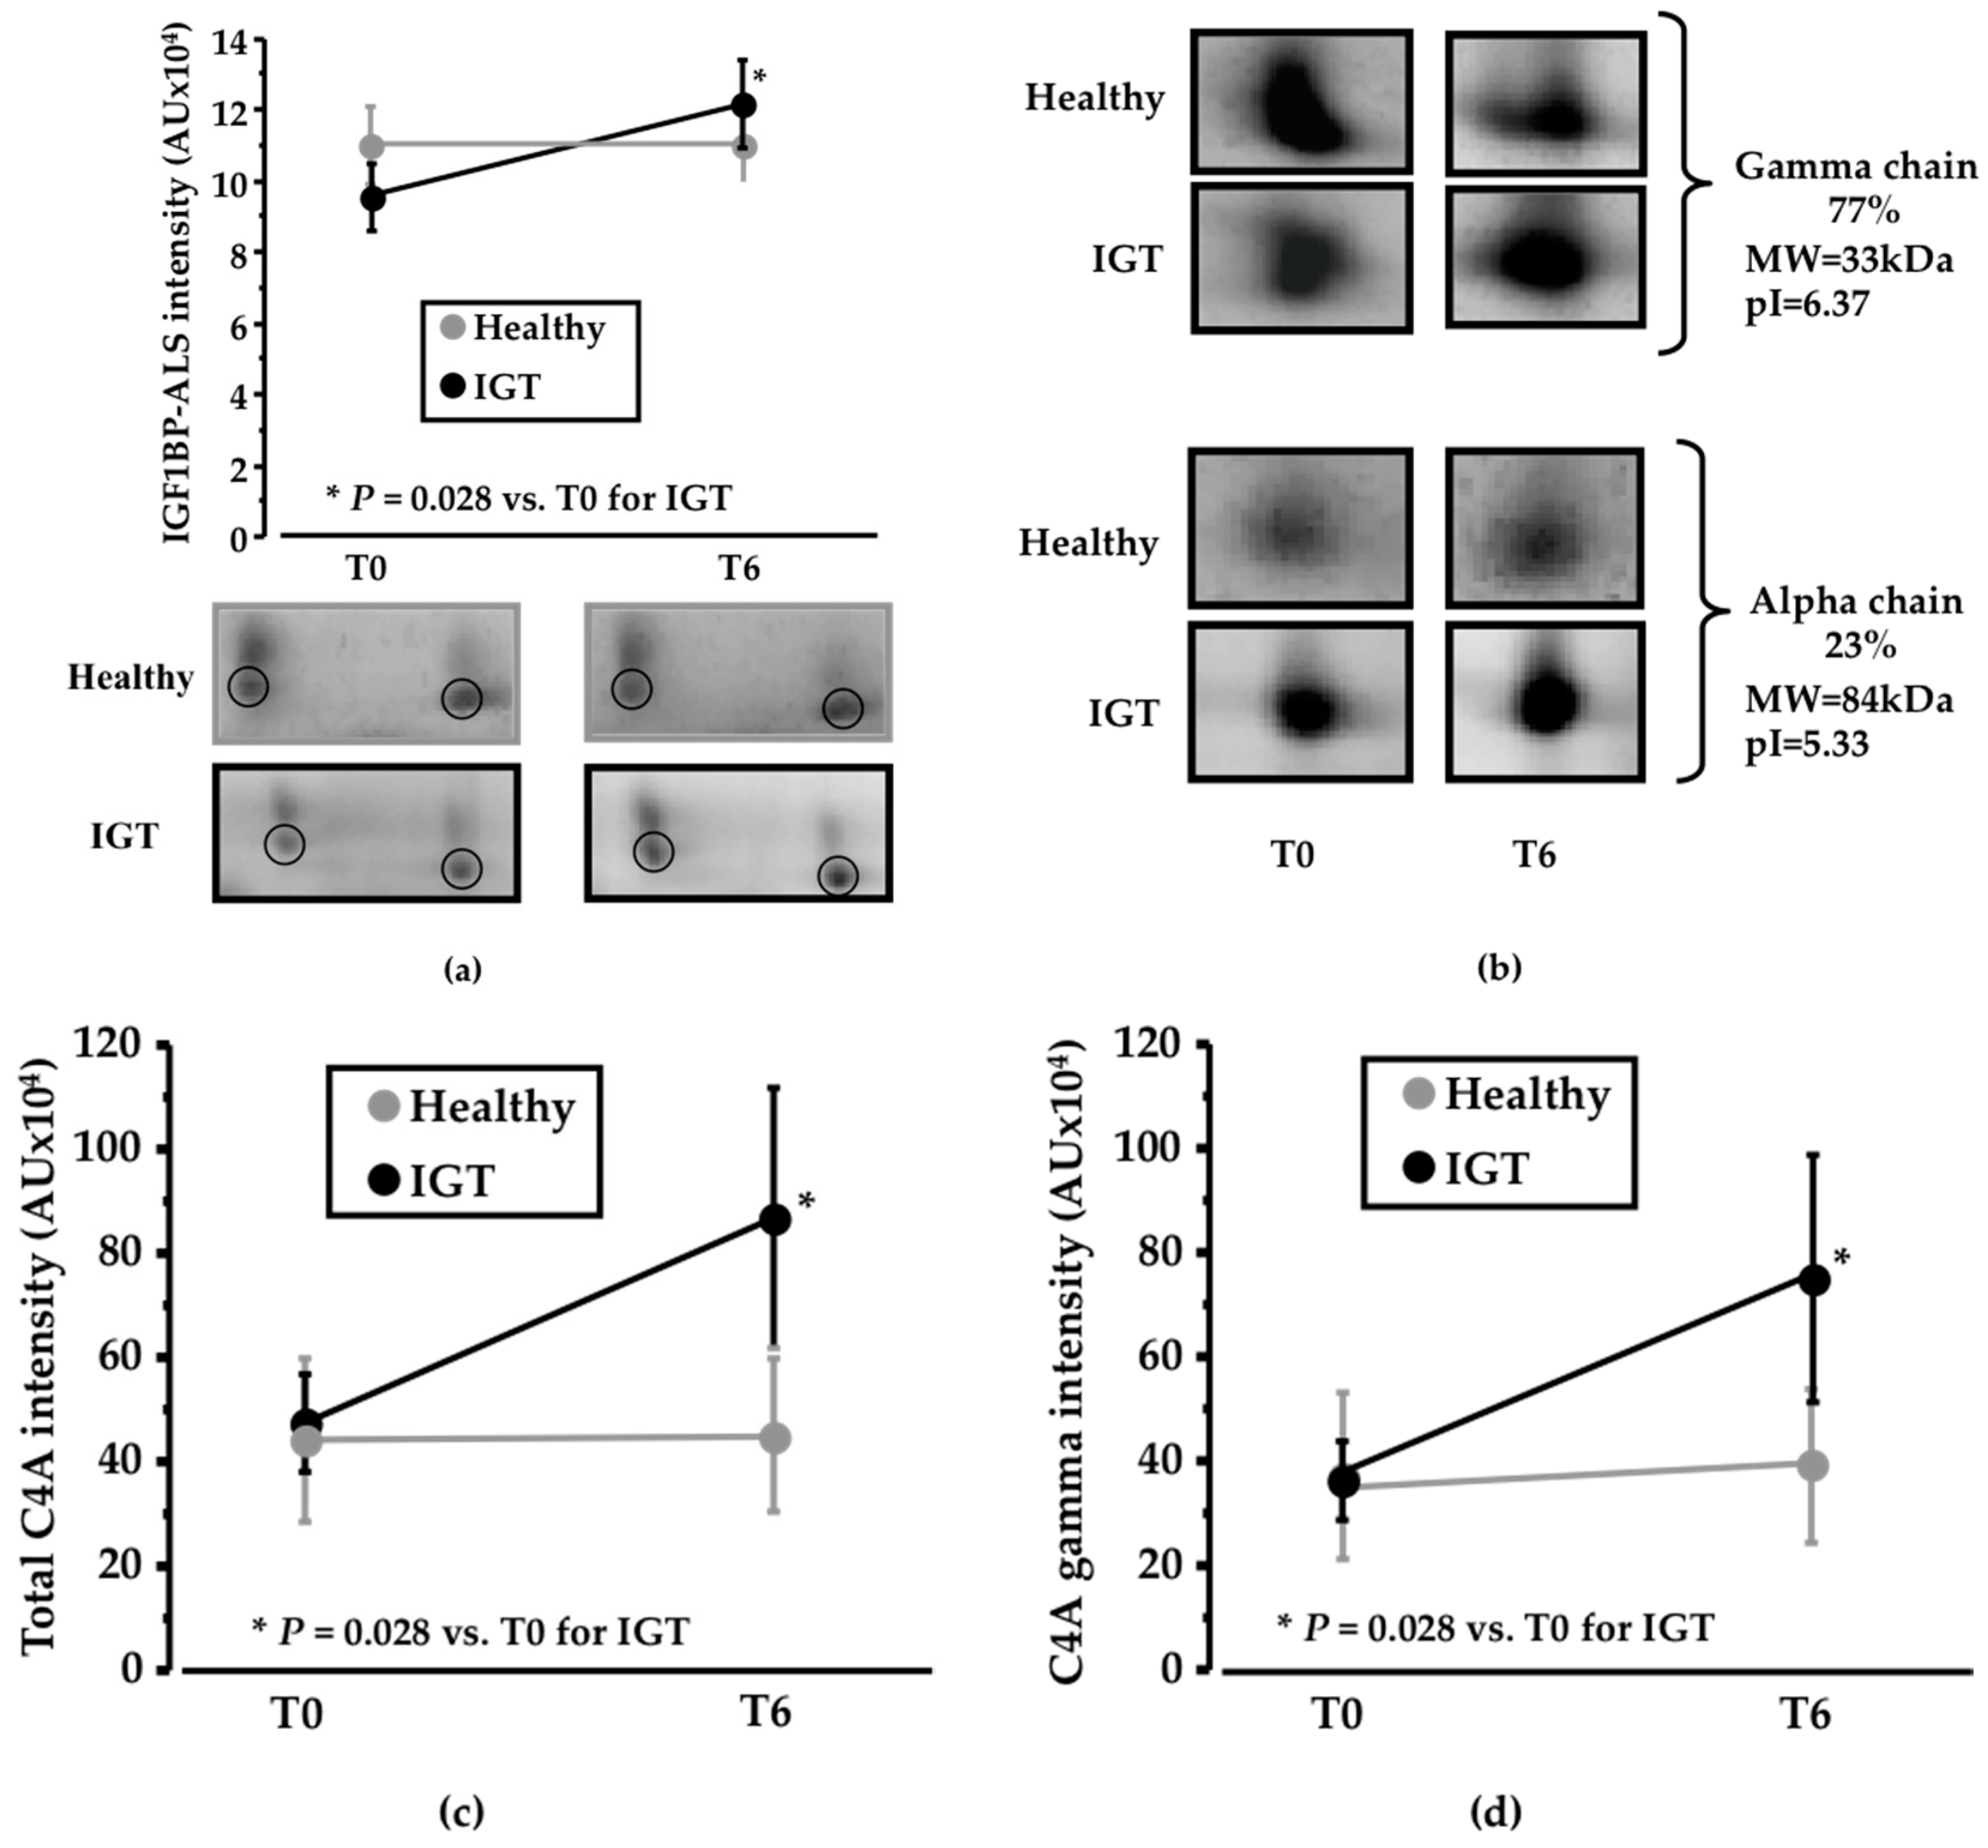
Figure 4.
Changes in IGF-1 levels. Box-plot diagram showing the significant decrease in IGF1 concentration (ng/mL) in IGT and T2DM volunteers when compared to healthy subjects (N = 20; 20; 19 respectively; P ≤ 0.0005).
Figure 4.
Changes in IGF-1 levels. Box-plot diagram showing the significant decrease in IGF1 concentration (ng/mL) in IGT and T2DM volunteers when compared to healthy subjects (N = 20; 20; 19 respectively; P ≤ 0.0005).

Figure 5.
Results validation. (a) C4A profile in ZDF rat samples. Box-plot and representative western blot image showing changes in C4A intensity in ZDF rats supplemented with a pinitol-enriched beverage (N = 5; 1.21-fold change; P = 0.04); (b) In ZDF rats, the blood glucose level change after SEB intake was significantly higher than blood glucose level changes after four weeks of PEB intake (N = 5; P = 0.01); (c) Changes in GLUT2 levels. Box-plot diagram showing the change of the gene in the small intestine. A significant reduction in GLUT2 gene expression in the jejunum of ZDF diabetic rats supplemented with pinitol was achieved when compared with the intake of a sucrose-enriched beverage (N = 9; P = 0.003); (d) No change was observed in GLUT4 after pinitol-enriched beverage intake; (e) No change in GLUT5 was achieved after pinitol-enriched beverage intake; (f) A significant positive correlation was observed between the increase of C4A intensity and the level of GLUT2 achieved (P = 0.002).

Figure 6.
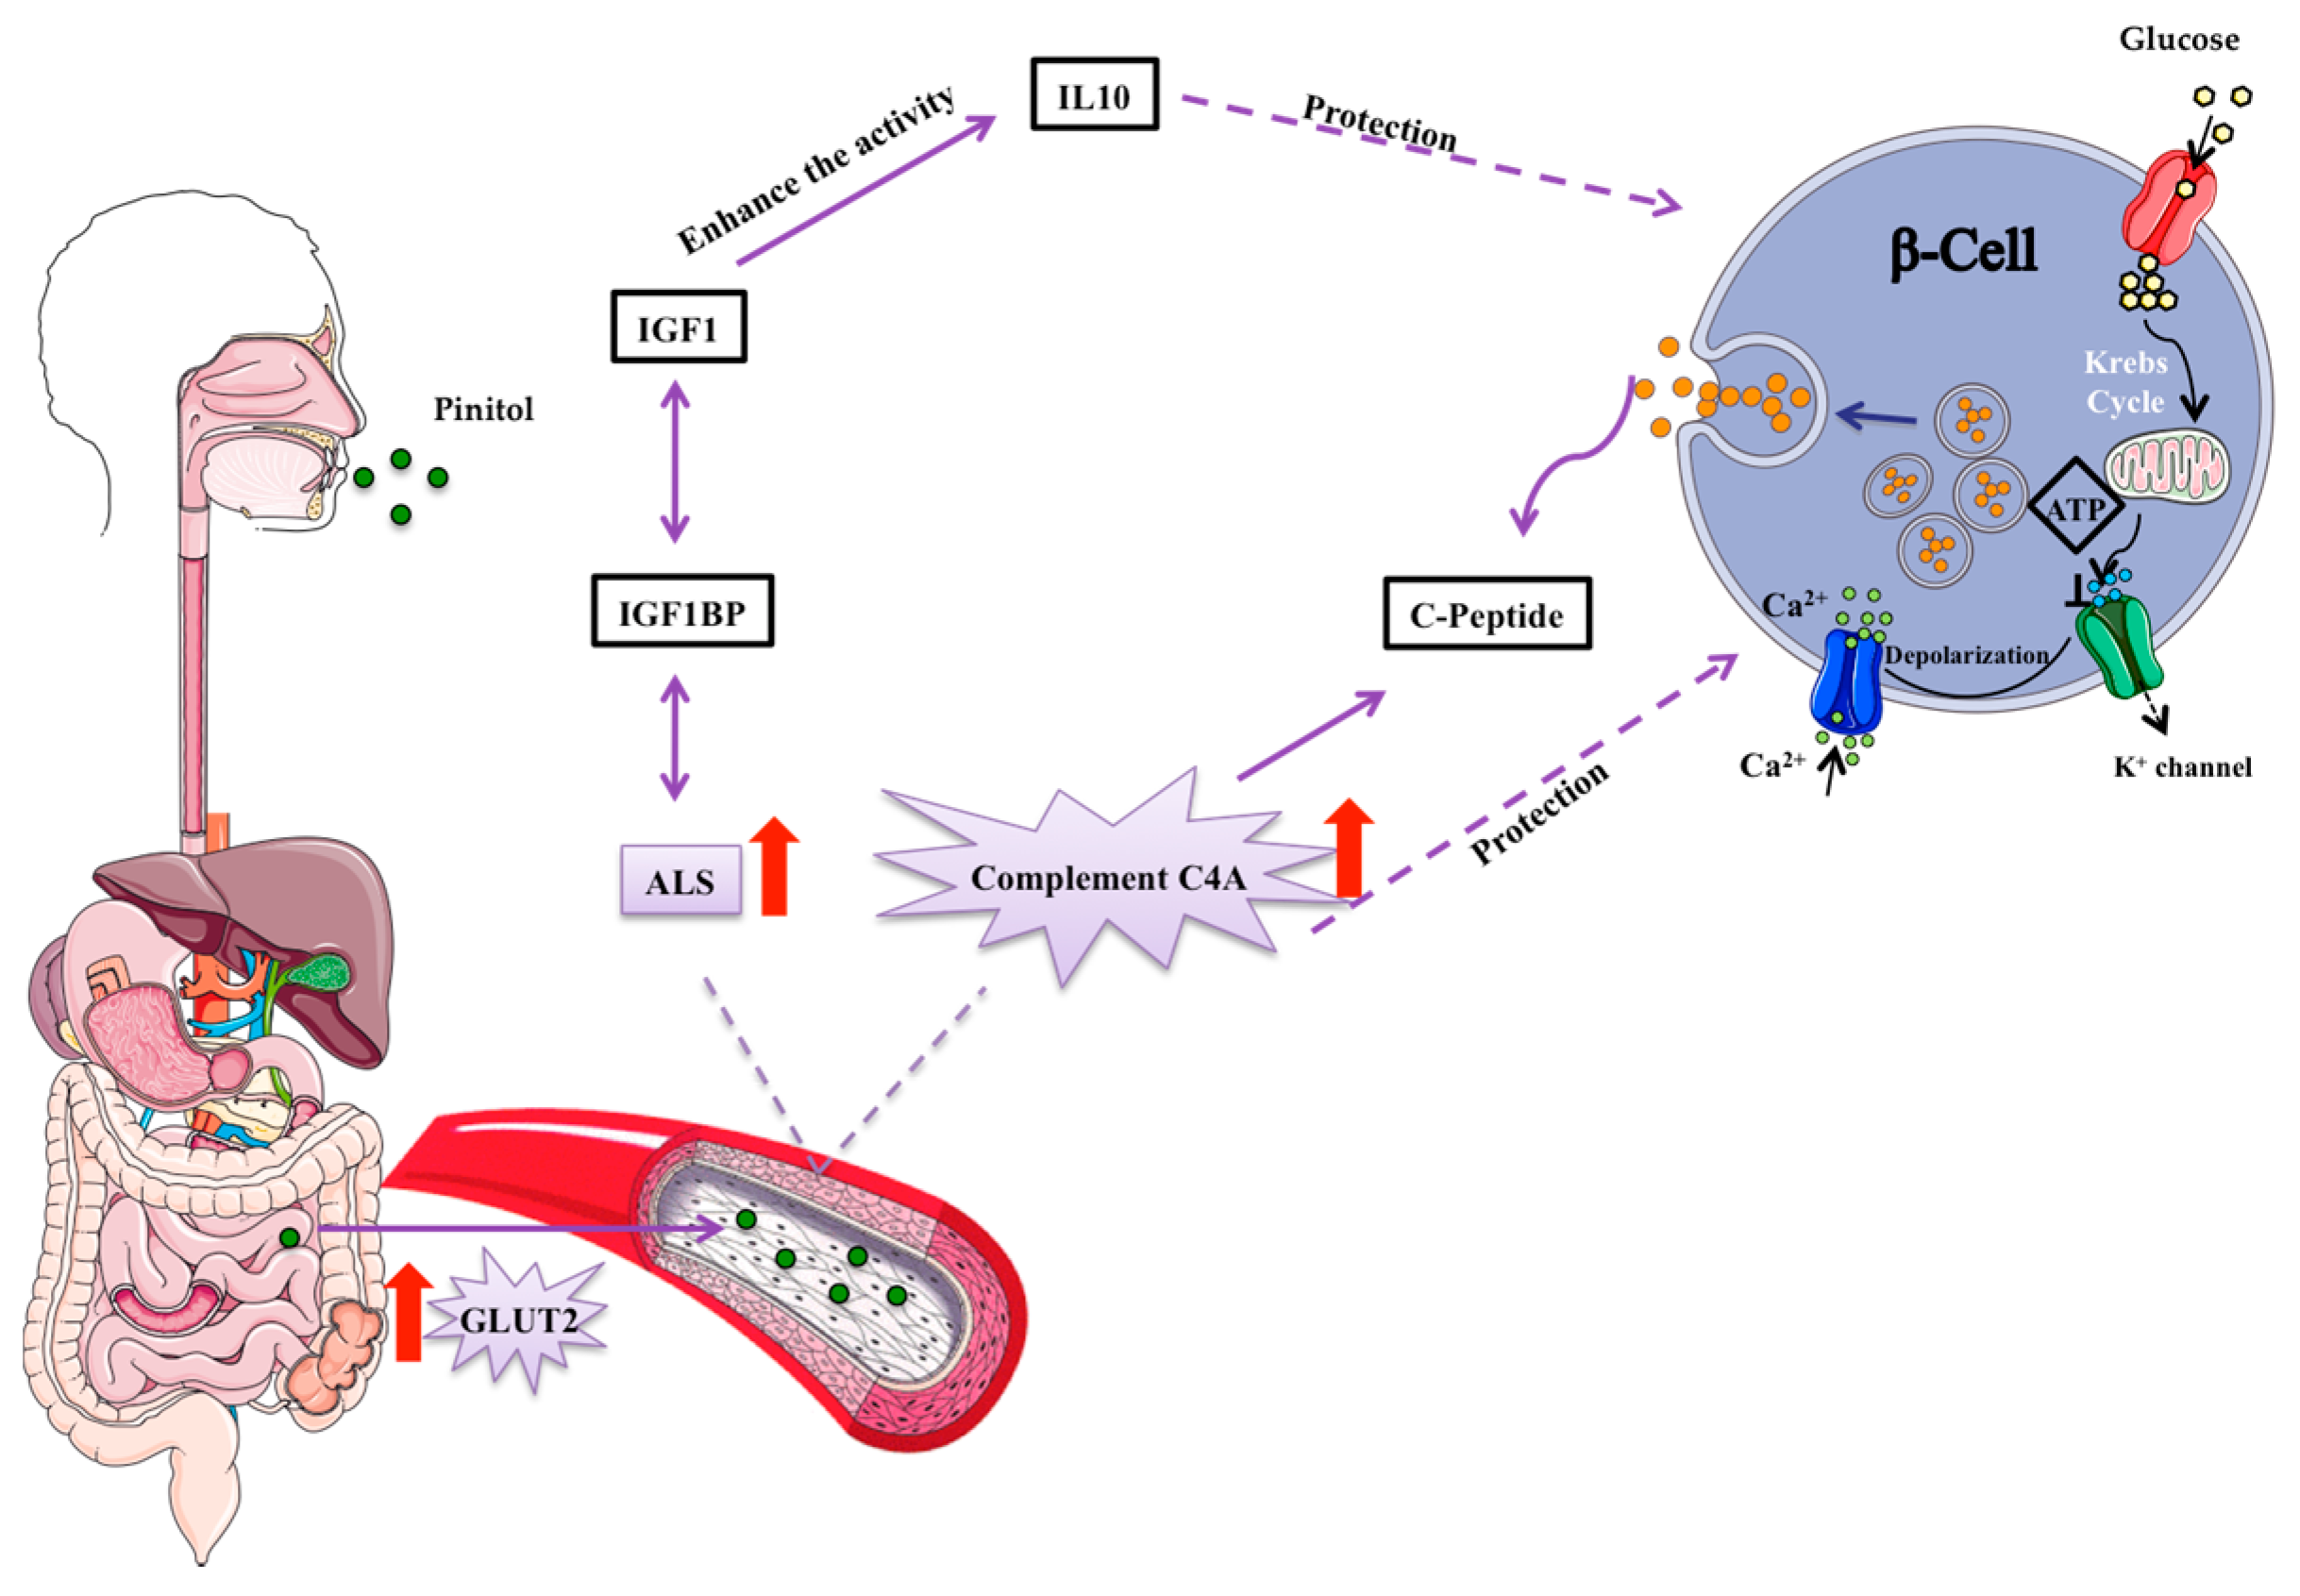
Suggested mechanism of pinitol-induced effects on the insulin secretion pathway. Pinitol is a glucose mimetic molecule, which is absorbed in the small intestine and distributed though the bloodstream to the whole organism. An increase in the acid labile subunit (ALS) and C4A complement proteins induce a protection of β-cells. Pro-preinsulin granules are packed inside pancreatic β-cells and secreted outside the cell as insulin, in response to nutrient intake.
Figure 6.
Suggested mechanism of pinitol-induced effects on the insulin secretion pathway. Pinitol is a glucose mimetic molecule, which is absorbed in the small intestine and distributed though the bloodstream to the whole organism. An increase in the acid labile subunit (ALS) and C4A complement proteins induce a protection of β-cells. Pro-preinsulin granules are packed inside pancreatic β-cells and secreted outside the cell as insulin, in response to nutrient intake.

Table 1.
Pinitol/sucrose-enriched beverage characterization.
| PEB | SEB | |
|---|---|---|
| Pinitol (g) | 4.00 | - |
| Myoinositol + D-chiro-inositol (g) | 0.45 | - |
| Sugars(g) | 34.90 | 42.5 |
| -Glucose | 6.23 | - |
| -Fructose | 4.83 | - |
| -Sucrose | 37.29 | 42.5 |
| -Others | 0.58 | - |
| Oligosaccharides (g) | 0.05 | - |
| Soluble fibre (g) | 1.65 | - |
| Total carbohydrates (g) | 41.18 | 42.50 |
| Total available carbohydrates (g) | 39.12 | 42.50 |
| Total calories (kcal) | 155.0 | 170.0 |
Nutritional composition of the pinitol/sucrose-enriched beverage per 500 mL (daily dose).
Table 2.
Biochemical characteristics of the subjects selected for the proteomic study.
| Healthy Subjects | IGT Subjects | |||||||||||
|---|---|---|---|---|---|---|---|---|---|---|---|---|
| SEB (N = 6) | PEB (N = 6) | SEB (N = 6) | PEB (N = 6) | |||||||||
| T0 | T6 | P Value | T0 | T6 | P Value | T0 | T6 | P Value | T0 | T6 | P Value | |
| Cholesterol (mg/dL) | 192 | 202 | 0.022 * | 183 | 178 | 0.398 | 197 | 203 | 0.602 | 189 | 194 | 0.798 |
| cLDL(mg/dL) | 112 | 125 | 0.004 * | 109 | 108 | 0.706 | 104 | 130 | 0.266 | 122 | 125 | 0.824 |
| cHDL (mg/dL) | 54 | 52 | 0.283 | 55 | 52 | 0.047 * | 54 | 53 | 0.734 | 42 | 43 | 0.812 |
| TG (mg/dL) | 126 | 125 | 0.934 | 88 | 89 | 0.802 | 111 | 101 | 0.379 | 121 | 128 | 0.797 |
| Urea (mg/dL) | 24 | 26 | 0.168 | 32 | 34 | 0.445 | 41 | 35 | 0.028 * | 43 | 35 | 0.01 * |
| Glucose (mg/dL) | 87 | 92 | 0.057 | 98 | 89 | 0.003 * | 100 | 103 | 0.003 * | 120 | 105 | <0.001* |
T0 corresponds to the day of inclusion in the study and T6 six weeks after the intake of pinitol-enriched beverage (PEB) or sucrose-enriched beverage (SEB). * Significant change T0 vs. T6. P value ≤ 0.05.
© 2018 by the authors. Licensee MDPI, Basel, Switzerland. This article is an open access article distributed under the terms and conditions of the Creative Commons Attribution (CC BY) license (http://creativecommons.org/licenses/by/4.0/).
Share and Cite
MDPI and ACS Style
Lambert, C.; Cubedo, J.; Padró, T.; Vilahur, G.; López-Bernal, S.; Rocha, M.; Hernández-Mijares, A.; Badimon, L. Effects of a Carob-Pod-Derived Sweetener on Glucose Metabolism. Nutrients 2018, 10, 271. https://doi.org/10.3390/nu10030271
AMA Style
Lambert C, Cubedo J, Padró T, Vilahur G, López-Bernal S, Rocha M, Hernández-Mijares A, Badimon L. Effects of a Carob-Pod-Derived Sweetener on Glucose Metabolism. Nutrients. 2018; 10(3):271. https://doi.org/10.3390/nu10030271
Chicago/Turabian StyleLambert, Carmen, Judit Cubedo, Teresa Padró, Gemma Vilahur, Sergi López-Bernal, Milagros Rocha, Antonio Hernández-Mijares, and Lina Badimon. 2018. "Effects of a Carob-Pod-Derived Sweetener on Glucose Metabolism" Nutrients 10, no. 3: 271. https://doi.org/10.3390/nu10030271
Note that from the first issue of 2016, this journal uses article numbers instead of page numbers. See further details here.