Roles of Sedentary Behaviors and Unhealthy Foods in Increasing the Obesity Risk in Adult Men and Women: A Cross-Sectional National Study

 , , ,
, , ,  , ,
, ,  and
and
Abstract
:1. Introduction
2. Materials and Methods
2.1. Data Sources
2.2. Measurements
2.3. Statistical Analysis
3. Results
4. Discussion
5. Conclusions
Supplementary Materials
Author Contributions
Acknowledgments
Conflicts of Interest
References
- Hall, M.E.; do Carmo, J.M.; da Silva, A.A.; Juncos, L.A.; Wang, Z.; Hall, J.E. Obesity, hypertension, and chronic kidney disease. Int. J. Nephrol. Renovasc. Dis. 2014, 7, 75–88. [Google Scholar] [CrossRef] [PubMed]
- Zheng, W.; McLerran, D.F.; Rolland, B.; Zhang, X.; Inoue, M.; Matsuo, K.; He, J.; Gupta, P.C.; Ramadas, K.; Tsugane, S.; et al. Association between body-mass index and risk of death in more than 1 million Asians. N. Engl. J. Med. 2011, 364, 719–729. [Google Scholar] [CrossRef] [PubMed]
- Rachmi, C.N.; Li, M.; Alison Baur, L. Overweight and obesity in Indonesia: Prevalence and risk factors—A literature review. Public Health 2017, 147, 20–29. [Google Scholar] [CrossRef] [PubMed]
- Roemling, C.; Qaim, M. Obesity trends and determinants in Indonesia. Appetite 2012, 58, 1005–1013. [Google Scholar] [CrossRef] [PubMed]
- Martínez-González, M.A.; Martínez, J.A.; Hu, F.B.; Gibney, M.J.; Kearney, J. Physical inactivity, sedentary lifestyle and obesity in the European Union. Int. J. Obes. Relat. Metab. Disord. 1999, 23, 1192–1201. [Google Scholar] [CrossRef] [PubMed]
- Proper, K.I.; Cerin, E.; Brown, W.J.; Owen, N. Sitting time and socio-economic differences in overweight and obesity. Int. J. Obes. 2007, 31, 169–176. [Google Scholar] [CrossRef] [PubMed]
- Sugiyama, T.; Healy, G.N.; Dunstan, D.W.; Salmon, J.; Owen, N. Joint associations of multiple leisure-time sedentary behaviours and physical activity with obesity in Australian adults. Int. J. Behav. Nutr. Phys. Act. 2008, 5, 35. [Google Scholar] [CrossRef] [PubMed]
- Jakes, R.W.; Day, N.E.; Khaw, K.T.; Luben, R.; Oakes, S.; Welch, A.; Bingham, S.; Wareham, N.J. Television viewing and low participation in vigorous recreation are independently associated with obesity and markers of cardiovascular disease risk: Epic-norfolk population-based study. Eur. J. Clin. Nutr. 2003, 57, 1089–1096. [Google Scholar] [CrossRef] [PubMed]
- Healy, G.N.; Wijndaele, K.; Dunstan, D.W.; Shaw, J.E.; Salmon, J.; Zimmet, P.Z.; Owen, N. Objectively measured sedentary time, physical activity, and metabolic risk: The Australian diabetes, obesity and lifestyle study (ausdiab). Diabetes Care 2008, 31, 369–371. [Google Scholar] [CrossRef] [PubMed]
- Hu, F.B.; Li, T.Y.; Colditz, G.A.; Willett, W.C.; Manson, J.E. Television watching and other sedentary behaviors in relation to risk of obesity and type 2 diabetes mellitus in women. JAMA 2003, 289, 1785–1791. [Google Scholar] [CrossRef] [PubMed]
- Dunstan, D.W.; Salmon, J.; Owen, N.; Armstrong, T.; Zimmet, P.Z.; Welborn, T.A.; Cameron, A.J.; Dwyer, T.; Jolley, D.; Shaw, J.E. Physical activity and television viewing in relation to risk of undiagnosed abnormal glucose metabolism in adults. Diabetes Care 2004, 27, 2603–2609. [Google Scholar] [CrossRef] [PubMed]
- Kronenberg, F.; Pereira, M.A.; Schmitz, M.K.H.; Arnett, D.K.; Evenson, K.R.; Crapo, R.O.; Jensen, R.L.; Burke, G.L.; Sholinsky, P.; Ellison, R.C.; et al. Influence of leisure time physical activity and television watching on atherosclerosis risk factors in the NHLBI family heart study. Atherosclerosis 2000, 153, 433–443. [Google Scholar] [CrossRef]
- Slentz, C.A.; Houmard, J.A.; Kraus, W.E. Exercise, abdominal obesity, skeletal muscle, and metabolic risk: Evidence for a dose response. Obesity (Silver Spring) 2009, 17 (Suppl. 3), S27–S33. [Google Scholar] [CrossRef] [PubMed]
- Hill, J.O.; Wyatt, H.R.; Peters, J.C. Energy balance and obesity. Circulation 2012, 126, 126–132. [Google Scholar] [CrossRef] [PubMed]
- Macdiarmid, J.I.; Vail, A.; Cade, J.E.; Blundell, J.E. The sugar-fat relationship revisited: Differences in consumption between men and women of varying BMI. Int. J. Obes. Relat. Metab. Disord. 1998, 22, 1053–1061. [Google Scholar] [CrossRef] [PubMed]
- Spadaro, P.A.; Naug, H.L.; Du Toit, E.F.; Donner, D.; Colson, N.J. A refined high carbohydrate diet is associated with changes in the serotonin pathway and visceral obesity. Genet. Res. 2015, 97, e23. [Google Scholar] [CrossRef] [PubMed]
- Qi, Q.; Chu, A.Y.; Kang, J.H.; Jensen, M.K.; Curhan, G.C.; Pasquale, L.R.; Ridker, P.M.; Hunter, D.J.; Willett, W.C.; Rimm, E.B.; et al. Sugar-sweetened beverages and genetic risk of obesity. N. Engl. J. Med. 2012, 367, 1387–1396. [Google Scholar] [CrossRef] [PubMed]
- Guallar-Castillón, P.; Rodríguez-Artalejo, F.; Fornés, N.S.; Banegas, J.R.; Etxezarreta, P.A.; Ardanaz, E.; Barricarte, A.; Chirlaque, M.D.; Iraeta, M.D.; Larrañaga, N.L.; et al. Intake of fried foods is associated with obesity in the cohort of Spanish adults from the European prospective investigation into cancer and nutrition. Am. J. Clin. Nutr. 2007, 86, 198–205. [Google Scholar] [CrossRef] [PubMed]
- Qi, Q.; Chu, A.Y.; Kang, J.H.; Huang, J.; Rose, L.M.; Jensen, M.K.; Liang, L.; Curhan, G.C.; Pasquale, L.R.; Wiggs, J.L.; et al. Fried food consumption, genetic risk, and body mass index: Gene-diet interaction analysis in three US cohort studies. BMJ 2014, 348, g1610. [Google Scholar] [CrossRef] [PubMed] [Green Version]
- Yuan, Y.Q.; Li, F.; Meng, P.; You, J.; Wu, M.; Li, S.G.; Chen, B. Gender difference on the association between dietary patterns and obesity in chinese middle-aged and elderly populations. Nutrients 2016, 8, 448. [Google Scholar] [CrossRef] [PubMed]
- Chan, Y.Y.; Lim, K.K.; Lim, K.H.; Teh, C.H.; Kee, C.C.; Cheong, S.M.; Khoo, Y.Y.; Baharudin, A.; Ling, M.Y.; Omar, M.A.; et al. Physical activity and overweight/obesity among malaysian adults: Findings from the 2015 national health and morbidity survey (NHMS). BMC Public Health 2017, 17, 733. [Google Scholar] [CrossRef] [PubMed]
- National Institute of Health Research and Development. Riset Kesehatan Dasar 2013; Ministry of Health, Republic of Indonesia: Jakarta, Indonesia, 2013.
- WHO. Appropriate body-mass index for Asian populations and its implications for policy and intervention strategies. Lancet 2004, 363, 157–163. [Google Scholar]
- Katzmarzyk, P.T.; Lee, I.M. Sedentary behaviour and life expectancy in the USA: A cause-deleted life table analysis. BMJ Open 2012, 2. [Google Scholar] [CrossRef] [PubMed] [Green Version]
- Ying, C.; Kuay, L.K.; Huey, T.C.; Hock, L.K.; Hamid, H.A.; Omar, M.A.; Ahmad, N.A.; Cheong, K.C. Prevalence and factors associated with physical inactivity among Malaysian adults. Southeast Asian J. Trop. Med. Public Health 2014, 45, 467–480. [Google Scholar] [PubMed]
- Dallal, C.M.; Brinton, L.A.; Matthews, C.E.; Pfeiffer, R.M.; Hartman, T.J.; Lissowska, J.; Falk, R.T.; Garcia-Closas, M.; Xu, X.; Veenstra, T.D.; et al. Association of active and sedentary behaviors with postmenopausal estrogen metabolism. Med. Sci. Sports Exerc. 2016, 48, 439–448. [Google Scholar] [CrossRef] [PubMed]
- Gomez, L.M.; Hernández-Prado, B.; Morales Mdel, C.; Shamah-Levy, T. Physical activity and overweight/obesity in adult Mexican population: The Mexican national health and nutrition survey 2006. Salud Publica Mex. 2009, 51, S621–S629. [Google Scholar] [CrossRef] [PubMed]
- Yulia; Khusun, H.; Fahmida, U. Dietary patterns of obese and normal-weight women of reproductive age in urban slum areas in central Jakarta. Br. J. Nutr. 2016, 116 (Suppl. 1), S49–S56. [Google Scholar]
- Okubo, H.; Sasaki, S.; Murakami, K.; Kim, M.K.; Takahashi, Y.; Hosoi, Y.; Itabashi, M.; Freshmen in Dietetic Courses Study II group. Three major dietary patterns are all independently related to the risk of obesity among 3760 Japanese women aged 18–20 years. Int. J. Obes. (Lond.) 2008, 32, 541–549. [Google Scholar] [CrossRef] [PubMed]
- Prihantini, S.; Jahari, A.B. Risk factors of obesity in school children age 6–18 years in DKI Jakarta. Penelit Dizi Dan Makanan (PGM) 2007, 30, 32–40. [Google Scholar]
- Esmaillzadeh, A.; Azadbakht, L. Major dietary patterns in relation to general obesity and central adiposity among Iranian women. J. Nutr. 2008, 138, 358–363. [Google Scholar] [CrossRef] [PubMed]
- Dugee, O.; Khor, G.L.; Lye, M.S.; Luvsannyam, L.; Janchiv, O.; Jamyan, B.; Esa, N. Association of major dietary patterns with obesity risk among Mongolian men and women. Asia Pac. J. Clin. Nutr. 2009, 18, 433–440. [Google Scholar] [PubMed]
- Skop-Lewandowska, A.; Zajac, J.; Kolarzyk, E. Overweight and obesity vs. Simple carbohydrates consumption by elderly people suffering from diseases of the cardiovascular system. Ann. Agric. Environ. Med. 2017, 24, 575–580. [Google Scholar] [CrossRef] [PubMed]
- Ahmadi, S.; Eshraghian, M.R.; Hedayati, M.; Pishva, H. Relationship between estrogen and body composition, energy, and endocrine factors in obese women with normal and low ree. Steroids 2018, 130, 31–35. [Google Scholar] [CrossRef] [PubMed]
- Geary, N. The estrogenic inhibition of eating. In Neurobiology of Food and Fluid Intake; Springer: Boston, MA, USA, 2004; Volume 14, pp. 307–345. [Google Scholar]
- Pantaleao, T.U.; Mousovich, F.; Rosenthal, D.; Padron, A.S.; Carvalho, D.P.; da Costa, V.M. Effect of serum estradiol and leptin levels on thyroid function, food intake and body weight gain in female wistar rats. Steroids 2010, 75, 638–642. [Google Scholar] [CrossRef] [PubMed]
- Geary, N.; Lovejoy, J. Sex differences in energy metabolism, obesity and eating behavior. In Sex Differences in the Brain: From Genes to Behavior; Becker, J.B., Berkley, K.J., Geary, N., Hampson, E., Herman, J.P., Young, E., Eds.; Oxford University Press: New York, NY, USA, 2007. [Google Scholar]
- Lipoeto, N.I.; Lin, K.G.; Angeles-Agdeppa, I. Food consumption patterns and nutrition transition in South-East Asia. Public Health Nutr. 2013, 16, 1637–1643. [Google Scholar] [CrossRef] [PubMed]


| Variables | Young Age | p Value | Middle-Age | p Value | ||||||
|---|---|---|---|---|---|---|---|---|---|---|
| Men | % | Women | % | Men | % | Women | % | |||
| Body Mass Index (BMI) | ||||||||||
| Mean (SD) | 22.6 (3) | 23.7 (3.7) | 23.5(3.2) | 25 (3.9) | ||||||
| Education | ||||||||||
| College Graduate | 8581 | 8.9 | 11,703 | 10.6 | <0.0001 | 11,938 | 9.5 | 10,471 | 7.6 | <0.0001 |
| Not College Graduate | 88,049 | 91.1 | 98,535 | 89.4 | 114,082 | 90.5 | 127,881 | 92.4 | ||
| Nutritional Status by BMI | ||||||||||
| Normal Weight | 60,970 | 63.1 | 56,448 | 51.2 | <0.0001 | 62,992 | 50.0 | 48,351 | 34.9 | <0.0001 |
| Overweight | 29,195 | 30.2 | 37,292 | 33.8 | 48,532 | 38.5 | 56,776 | 41.0 | ||
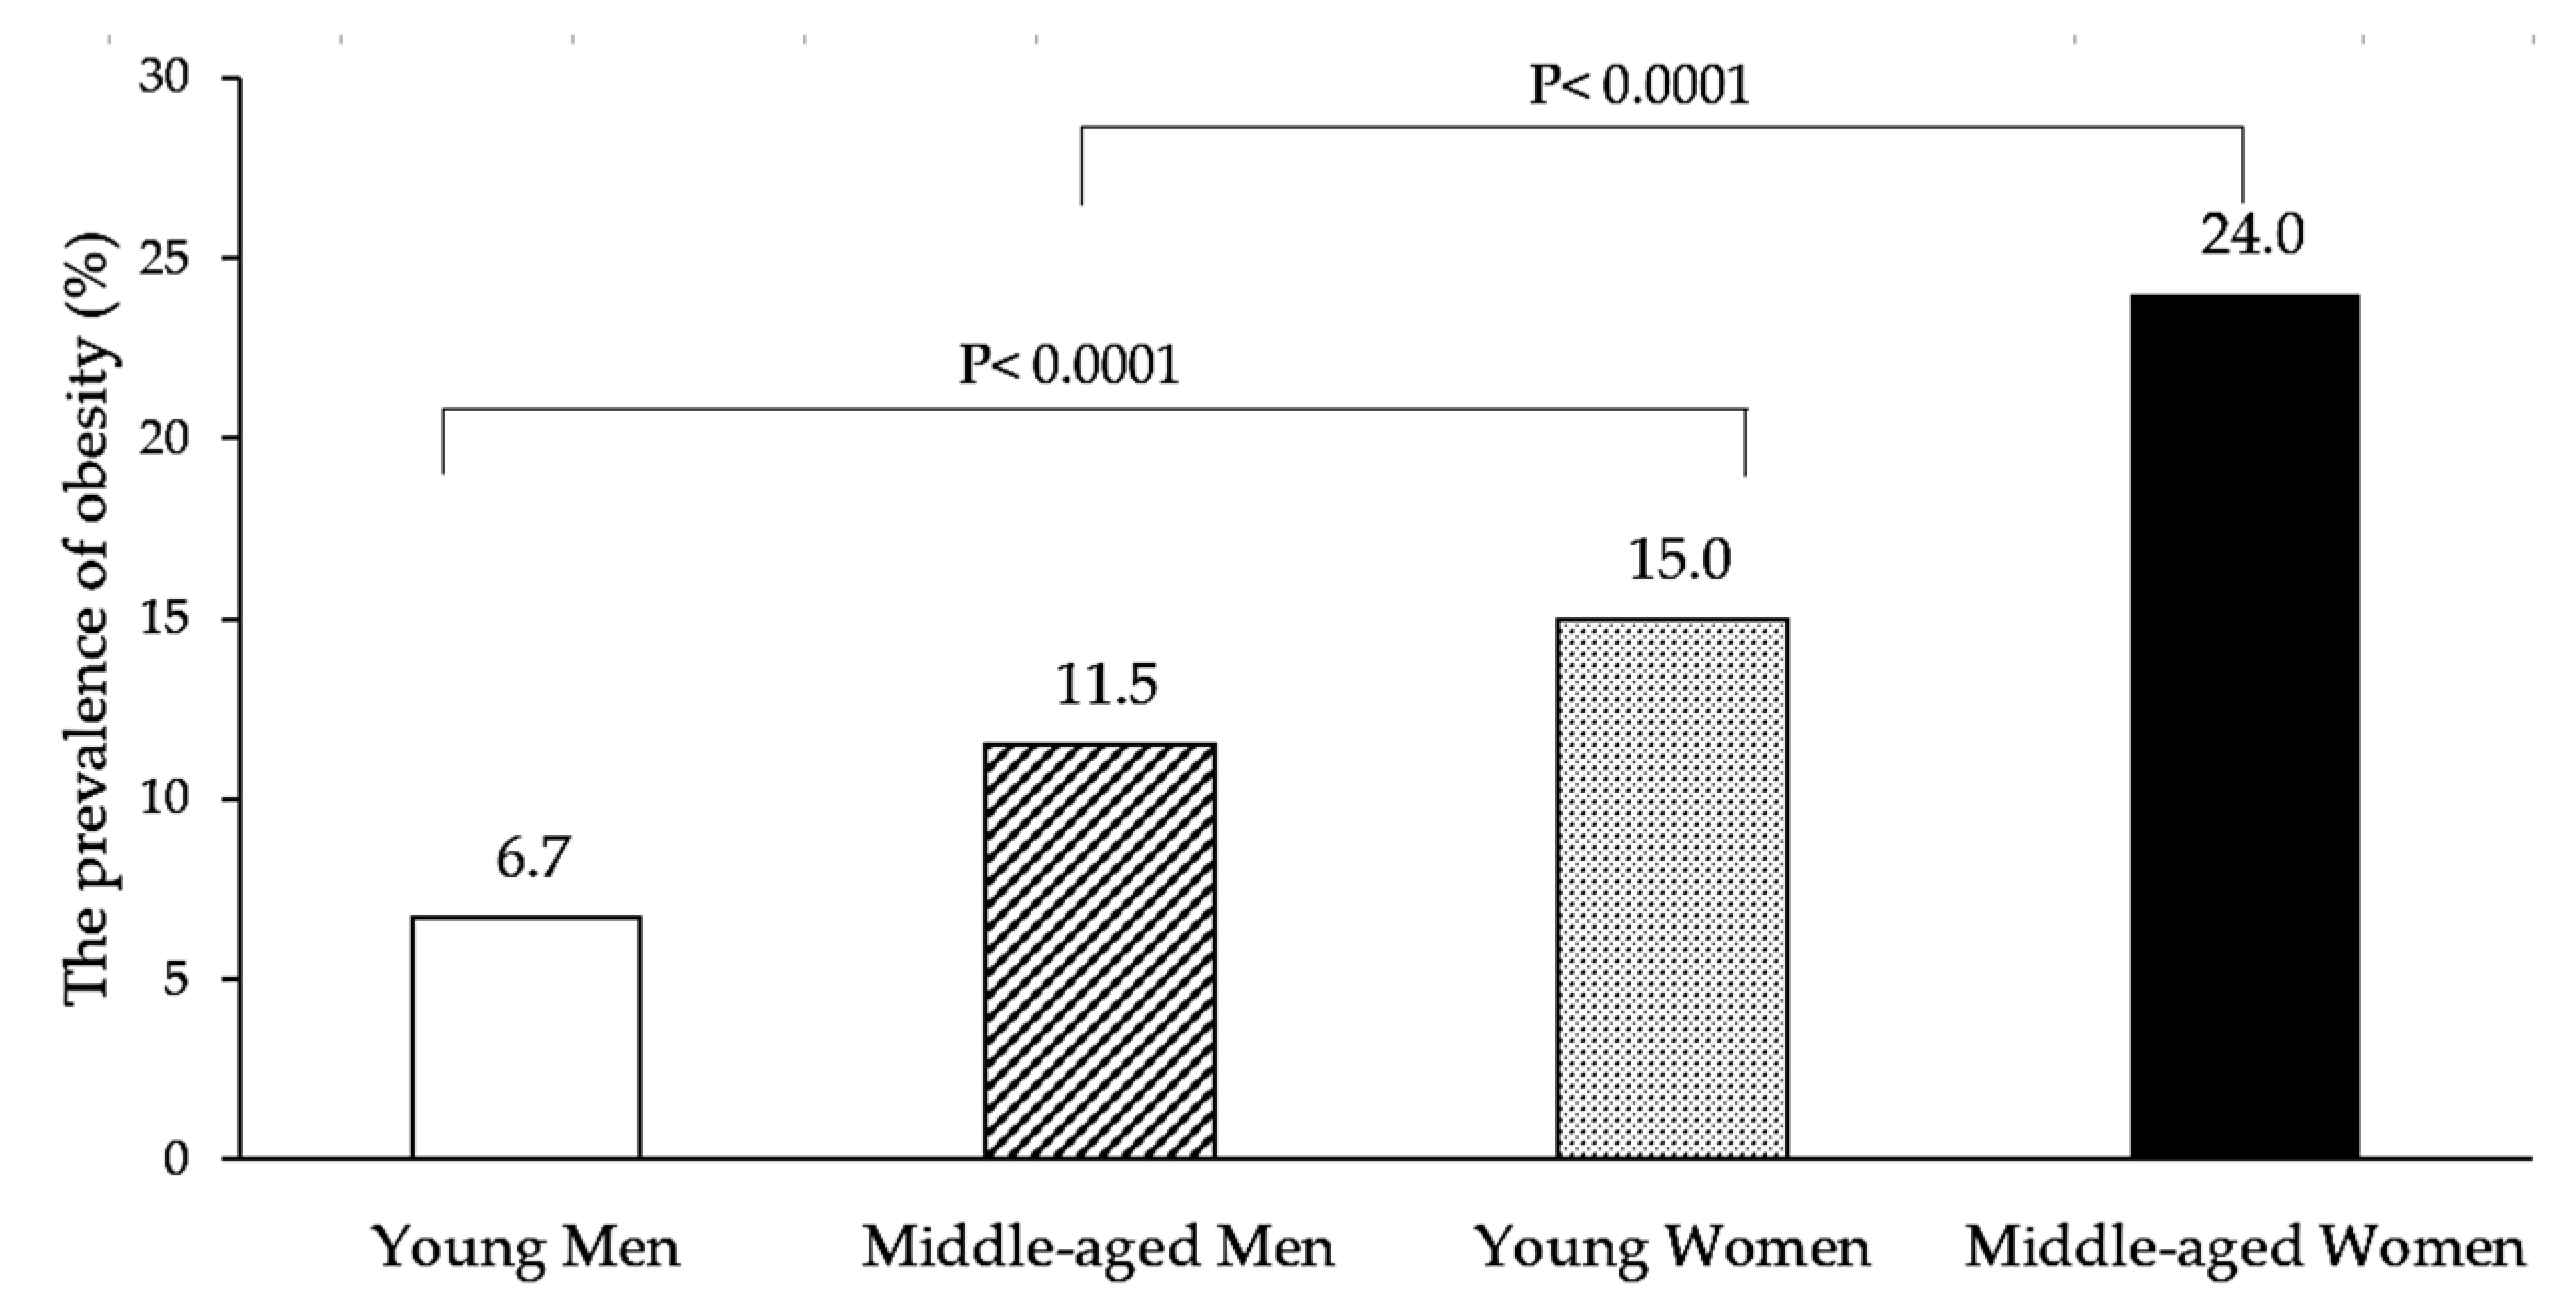
| Obese | 6465 | 6.7 | 16,498 | 15.0 | 14,496 | 11.5 | 33,225 | 24.0 | ||
| Sedentary Behavior | ||||||||||
| <3 h/d | 39,376 | 40.7 | 42,869 | 38.9 | <0.0001 | 53,541 | 42.5 | 54,699 | 39.5 | <0.0001 |
| 3–5 h/d | 40,730 | 42.2 | 44,122 | 40.0 | 51,864 | 41.2 | 55,208 | 39.9 | ||
| ≥6 h/d | 16,524 | 17.1 | 23,247 | 21.1 | 20,615 | 16.4 | 28,445 | 20.6 | ||
| Refined Carbohydrates | ||||||||||
| <1x/day | 82,609 | 85.5 | 91,055 | 82.6 | <0.0001 | 108,541 | 86.1 | 116,218 | 84.0 | <0.0001 |
| ≥1x/day | 14,021 | 14.5 | 19,183 | 17.4 | 17,479 | 13.9 | 22,134 | 16.0 | ||
| Sweet Foods and Beverages | ||||||||||
| <1x/day | 43,422 | 44.9 | 56,016 | 50.8 | <0.0001 | 54,570 | 43.3 | 66,943 | 48.4 | <0.0001 |
| ≥1x/day | 53,208 | 55.1 | 54,222 | 49.2 | 71,450 | 56.7 | 71,409 | 51.6 | ||
| Fatty and Fried Foods | ||||||||||
| <1x/day | 66,329 | 68.6 | 72,336 | 65.6 | <0.0001 | 85,479 | 67.8 | 87,641 | 63.3 | <0.0001 |
| ≥1x/day | 30,301 | 31.4 | 37,902 | 34.4 | 40,541 | 32.2 | 50,711 | 36.7 | ||
| Variable | PR | 95% CI | p Value |
|---|---|---|---|
| Men | |||
| Age (Middle-aged vs. young) | 1.71 | (1.66–1.76) | <0.0001 |
| Education (Graduate vs. non-graduate) | 0.49 | (0.47–0.51) | <0.0001 |
| Sedentary Behavior (≥6 h vs. <6 h/d) | 1.18 | (1.14–1.22) | <0.0001 |
| Refined Carbohydrates (≥1x vs. <1x/day) | 1.18 | (1.14–1.23) | <0.0001 |
| Sweet foods and Beverages (≥1x vs. <1x/day) | 0.98 | (0.96–1.01) | 0.2278 |
| Fatty and Fried Foods (≥1x vs. <1x/day) | 1.08 | (1.05–1.12) | <0.0001 |
| Women | |||
| Age (Middle-aged vs. young) | 1.61 | (1.58–1.64) | <0.0001 |
| Education (Graduate vs. non-graduate) | 0.92 | (0.90–0.95) | <0.0001 |
| Sedentary Behavior (≥6 h vs. <6 h/d) | 1.11 | (1.09–1.13) | <0.0001 |
| Refined Carbohydrates (≥1x vs. <1x/day) | 1.15 | (1.12–1.17) | <0.0001 |
| Sweet foods and Beverages (≥1x vs. <1x/day) | 0.97 | (0.95–0.99) | 0.0005 |
| Fatty and Fried Foods (≥1x vs. <1x/day) | 1.14 | (1.12–1.16) | <0.0001 |
| Variable (Risk vs. Reference) | PR | 95% CI | p Value |
|---|---|---|---|
| Model 1 | |||
| Gender (Women vs. Men) | 2.16 | 2.12–2.20 | <0.0001 |
| Age (Middle-aged vs. young) | 1.65 | 1.62–1.68 | <0.0001 |
| Education level (Graduate vs. non-graduate) | 0.72 | 0.71–0.74 | <0.0001 |
| Sedentary behavior (SB) (≥6 h vs. <6 h/d) | 1.20 | 1.16–1.25 | <0.0001 |
| Gender × SB | 0.93 | 0.90–0.97 | 0.0006 |
| Model 2 | |||
| Gender (Women vs. Men) | 2.16 | 2.12–2.20 | <0.0001 |
| Age (Middle-aged vs. young) | 1.65 | 1.63–1.68 | <0.0001 |
| Education level (Graduate vs. non-graduate) | 0.73 | 0.72–0.75 | <0.0001 |
| Refined carbohydrate intake (RCI) (≥1x vs. <1x/day) (Figure S1) | 1.24 | 1.19–1.28 | <0.0001 |
| Gender × RCI | 0.93 | 0.89–0.97 | 0.0004 |
| Model 3 | |||
| Gender (Women vs. Men) | 2.16 | 2.10–2.21 | <0.0001 |
| Age (Middle-aged vs. young) | 1.65 | 1.62–1.68 | <0.0001 |
| Education level (Graduate vs. non-graduate) | 0.72 | 0.70–0.74 | <0.0001 |
| Sweet Foods and Beverages (SFB) (≥1x vs. <1x/day) | 1.01 | 0.99–1.04 | 0.3275 |
| Gender × SFB | 0.99 | 0.96–1.02 | 0.4328 |
| Model 4 | |||
| Gender (Women vs. Men) | 2.09 | 2.05–2.13 | <0.0001 |
| Age (Middle-aged vs. young) | 1.65 | 1.62–1.67 | <0.0001 |
| Education level (Graduate vs. non-graduate) | 0.72 | 0.70–0.74 | <0.0001 |
| Fatty& fried foods intake (FFFI) (≥1x vs. <1x/day) | 1.10 | 1.07–1.13 | <0.0001 |
| Gender × FFFI | 1.05 | 1.02–1.09 | 0.0045 |
| Model 5 | |||
| Gender (Women vs. Men) | 2.13 | 2.08–2.18 | <0.0001 |
| Age (Middle-aged vs. young) | 1.65 | 1.62–1.68 | <0.0001 |
| Education level (Graduate vs. non-graduate) | 0.73 | 0.72–0.75 | <0.0001 |
| SB (≥6 h vs. <6 h/d) | 1.20 | 1.16–1.24 | <0.0001 |
| RCI (≥1x vs. <1x/day) | 1.22 | 1.18–1.27 | <0.0001 |
| FFFI (≥1x vs. <1x/day) | 1.07 | 1.04–1.10 | <0.0001 |
| Gender × SB | 0.93 | 0.89–0.96 | 0.0002 |
| Gender × RCI | 0.92 | 0.88–0.96 | 0.0001 |
| Gender × FFFI | 1.06 | 1.02–1.10 | 0.0008 |
© 2018 by the authors. Licensee MDPI, Basel, Switzerland. This article is an open access article distributed under the terms and conditions of the Creative Commons Attribution (CC BY) license (http://creativecommons.org/licenses/by/4.0/).
Share and Cite
Nurwanti, E.; Uddin, M.; Chang, J.-S.; Hadi, H.; Syed-Abdul, S.; Su, E.C.-Y.; Nursetyo, A.A.; Masud, J.H.B.; Bai, C.-H. Roles of Sedentary Behaviors and Unhealthy Foods in Increasing the Obesity Risk in Adult Men and Women: A Cross-Sectional National Study. Nutrients 2018, 10, 704. https://doi.org/10.3390/nu10060704
Nurwanti E, Uddin M, Chang J-S, Hadi H, Syed-Abdul S, Su EC-Y, Nursetyo AA, Masud JHB, Bai C-H. Roles of Sedentary Behaviors and Unhealthy Foods in Increasing the Obesity Risk in Adult Men and Women: A Cross-Sectional National Study. Nutrients. 2018; 10(6):704. https://doi.org/10.3390/nu10060704
Chicago/Turabian StyleNurwanti, Esti, Mohy Uddin, Jung-Su Chang, Hamam Hadi, Shabbir Syed-Abdul, Emily Chia-Yu Su, Aldilas Achmad Nursetyo, Jakir Hossain Bhuiyan Masud, and Chyi-Huey Bai. 2018. "Roles of Sedentary Behaviors and Unhealthy Foods in Increasing the Obesity Risk in Adult Men and Women: A Cross-Sectional National Study" Nutrients 10, no. 6: 704. https://doi.org/10.3390/nu10060704