Supplementation-Dependent Effects of Vegetable Oils with Varying Fatty Acid Compositions on Anthropometric and Biochemical Parameters in Obese Women

 ,
,
Abstract
1. Introduction
2. Methods
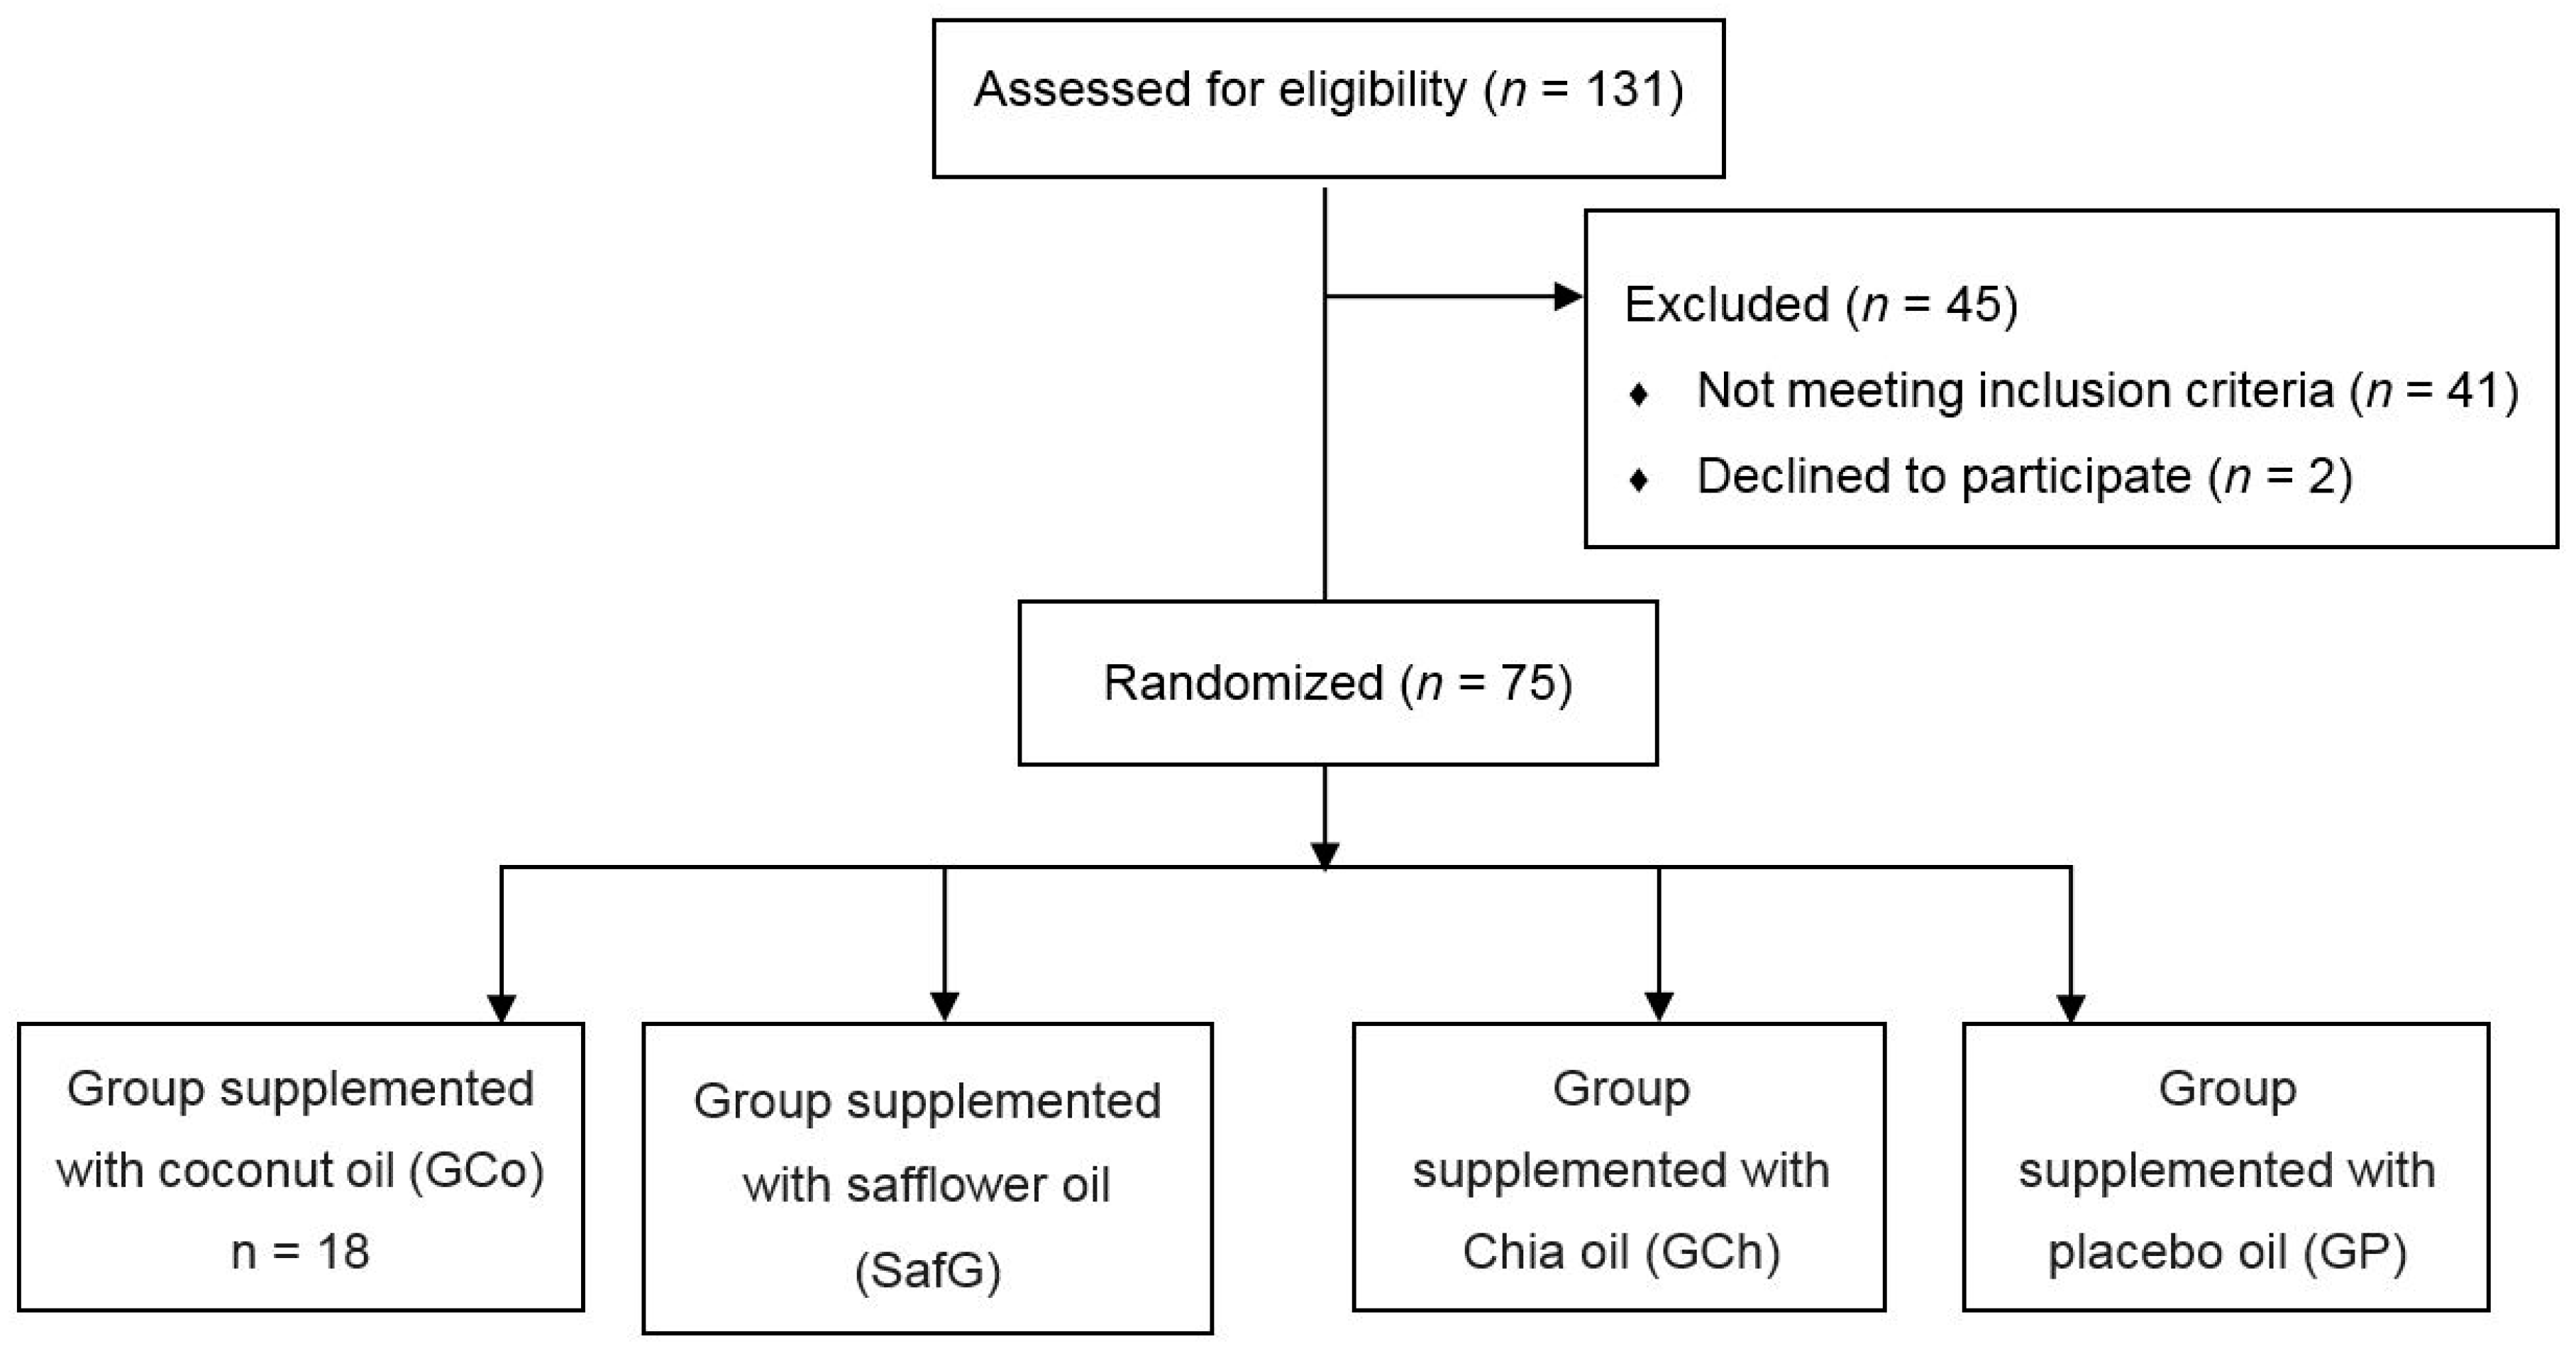
2.1. Participants
2.2. Study Design and Nutrition Intervention
2.3. Assessments
2.4. Body Composition
2.5. Biochemical Evaluation
3. Statistical Analysis
4. Results
5. Discussion
Supplementary Materials
Author Contributions
Funding
Acknowledgments
Conflicts of Interest
References
- Egger, G.; Dixon, J. Beyond obesity and lifestyle: A review of 21st century chronic disease determinants. Biomed. Res. Int. 2014, 2014, 1–12. [Google Scholar] [CrossRef] [PubMed]
- World Health Organization/Food and Agriculture Organization. Diet, Nutrition and the Prevention of Chronic Diseases; Report of a Joint WHO/FAO Expert Consultation; WHO: Geneva, Switzerland, 2013. [Google Scholar]
- Instituto Brasileiro de Geografia e Estatística. Pesquisa Nacional de Saúde 2013: Percepção do estado de saúde, estilos de vida e doenças crônicas—Brasil, Grandes Regiões e Unidades da Federação; Instituto Brasileiro de Geografia e Estatística: Rio de Janeiro, Brazil, 2014. [Google Scholar]
- Frood, S.; Johnston, L.M.; Matteson, C.L.; Finegood, D.T. Obesity, complexity, and the role of the health system. Curr. Obes. Rep. 2013, 2, 320–326. [Google Scholar] [CrossRef] [PubMed]
- ABESO. Diretrizes Brasileiras de Obesidade; ABESO: São Paulo, Brazil, 2016; pp. 75–91. [Google Scholar]
- Yanovski, S.Z.; Yanovski, J.A. Drugs for the treatment of obesity—Reply. JAMA Intern. Med. 2014, 174, 1415–1416. [Google Scholar] [CrossRef] [PubMed]
- Nakamura, M.T.; Yudell, B.E.; Loor, J.J. Regulation of energy metabolism by long-chain fatty acids. Prog. Lipid Res. 2014, 53, 124–144. [Google Scholar] [CrossRef] [PubMed]
- Rodríguez-Cruz, M.; Serna, D.S. Nutrigenomics of ω-3 fatty acids: Regulators of the master transcription factors. Nutrition 2017, 41, 90–96. [Google Scholar] [CrossRef] [PubMed]
- Fernando, W.M.; Martins, I.J.; Goozee, K.G.; Brennan, C.S.; Jayasena, V.; Martins, R.N. The role of dietary coconut for the prevention and treatment of Alzheimer’s disease: Potential mechanisms of action. Br. J. Nutr. 2015, 114, 1–14. [Google Scholar] [CrossRef] [PubMed]
- Vousoughkia, M.; Hossainchi Ghareaghag, L.; Ghavami, M.; Gharachorloo, M.; Delkhosh, B. Evaluation of oil content and fatty acid composition in seeds of different genotypes of safflower (Carthamus Tinctorius L.). Int. J. Agric. Sci. Res. 2011, 2, 59–66. [Google Scholar]
- Ullah, R.; Nadeem, M.; Khalique, A.; Imran, M.; Mehmood, S.; Javid, A.; Hussain, J. Nutritional and therapeutic perspectives of Chia (Salviahispanica L.): A review. J. Food Sci. Technol. 2016, 53, 1750–1758. [Google Scholar] [CrossRef] [PubMed]
- Jamilian, M.; Samimi, M.; Mirhosseini, N.; Afshar Ebrahimi, F.; Aghadavod, E.; Taghizadeh, M.; Asemi, Z. A Randomized Double-Blinded, Placebo-Controlled Trial Investigating the Effect of Fish Oil Supplementation on Gene Expression Related to Insulin Action, Blood Lipids, and Inflammation in Gestational Diabetes Mellitus-Fish Oil Supplementation and Gestational Diabetes. Nutrients 2018, 10, 163. [Google Scholar]
- Clevenger, H.C.; Stevenson, J.L.; Cooper, J.A. Metabolic responses to dietary fatty acids in obese women. Physiol. Behav. 2015, 139, 73–79. [Google Scholar] [CrossRef] [PubMed]
- Raatz, S.K.; Conrad, Z.; Johnson, L.K.; Picklo, M.J.; Jahns, L. Relationship of the Reported Intakes of Fat and Fatty Acids to Body Weight in US Adults. Nutrients 2017, 9, 438. [Google Scholar] [CrossRef] [PubMed]
- World Health Organization (WHO). Waist Circumference and Waist-Hip Ratio; Report of a WHO Expert Consultation; WHO: Geneva, Switzerland, 2008. [Google Scholar]
- Associação Brasileira de Empresas de Pesquisa (ABEP). Critério Padrão de Classificação Econômica Brasil; ABEP: São Paulo, Brazil, 2015. [Google Scholar]
- Matsudo, S.; Araújo, T.; Matsudo, V.; Andrade, D.; Andrade, E.; Oliveira, L.C.; Braggion, G. Questionário Internacional de Atividade Física (IPAQ): Estudo de validade e reprodutibilidade no Brasil. Rev. Bras. Ativ. Fís. Saúde 2001, 6, 5–12. [Google Scholar]
- Haun, D.R.; Pitanga, F.J.G.; Lessa, I. Razão Cintura/estatura comparado a Outros indicadores antropométricos de Obesidade como preditor de Risco coronariano elevado. Rev. Assoc. Med. Bras. 2009, 55, 705–711. [Google Scholar] [CrossRef] [PubMed]
- Valdez, R. A simple model-based index of abdominal adiposity. J. Clin. Epidemiol. 1991, 44, 955–956. [Google Scholar] [CrossRef]
- Ryan, D.H.; Yockey, S.R. Weight Loss and Improvement in Comorbidity: Differences at 5%, 10%, 15%, and Over. Curr. Obes. Rep. 2017, 6, 187–194. [Google Scholar] [CrossRef] [PubMed]
- Nathan, D.M.; Kuenen, J.; Borg, R.; Zheng, H.; Schoenfeld, D.; Heine, R.J. Translationg the A1C assay into estimated average glucose values. Diabetes Care 2008, 31, 1473–1478. [Google Scholar] [CrossRef] [PubMed]
- Da Luz, P.L.; Favarato, D.; Faria-Neto, J.R.; Lemos, P.; Chagas, A.C.P. High ratio of triglycerides to HDL cholesterol predicts extensive coronary disease. Clinics 2008, 63, 427–432. [Google Scholar] [PubMed]
- Assuncão, M.L.; Ferreira, H.S.; Dos Santos, A.F.; Cabral, C.R., Jr.; Florêncio, T.T.M.M.T. Effects of dietary coconut oil on the biochemical and anthropometric profiles of women presenting abdominal obesity. Lipids 2009, 44, 593–601. [Google Scholar] [CrossRef] [PubMed]
- Cardoso, D.A.; Moreira, A.S.; de Oliveira, G.M.; Raggio Luiz, R.; Rosa, G. A coconut extra virgin oil-rich diet increases hdl cholesterol and decreases waist circumference and body mass in coronary artery disease patients. Nutr. Hosp. 2015, 32, 2144–2152. [Google Scholar] [PubMed]
- Eyres, L.; Eyres, M.F.; Chisholm, A.; Brown, RC. Coconut oil Consumption and cardiovascular risk factors in humans. Nutr. Rev. 2016, 74, 267–280. [Google Scholar] [CrossRef] [PubMed]
- Mumme, K.; Stonehouse, W. Effects of medium-chain triglycerides on weight loss and body composition: A meta-analysis of randomized controlled trials. J. Acad. Nutr. Diet. 2015, 115, 249–263. [Google Scholar] [CrossRef] [PubMed]
- Harris, M.; Hutchins, A.; Fryda, L. The Impact of Virgin Coconut Oil and High-Oleic Safflower Oil on Body Composition, Lipids, and Inflammatory Markers in Postmenopausal Women. J. Med. Food 2017, 20, 345–351. [Google Scholar] [CrossRef] [PubMed]
- Chinwong, S.; Chinwong, D.; Mangklabruks, A. Daily Consumption of Virgin Coconut Oil Increases High-Density Lipoprotein Cholesterol Levels in Healthy Volunteers: A Randomized Crossover Trial. Evid.-Based Complement. Altern. Med. 2017, 2017, 1–8. [Google Scholar] [CrossRef] [PubMed]
- Lipoeto, N.I.; Agus, Z.; Oenzil, F.; Wahlqvist, M.L.; Wattanapenpaiboon, N. Dietary intake and the risk of coronary heart disease among the coconut-consuming Minangkabau in West Sumatra, Indonesia. Asia Pac. J. Clin. Nutr. 2004, 13, 377–384. [Google Scholar] [PubMed]
- Geng, S.; Zhu, W.; Xie, C.; Li, X.; Wu, J.; Liang, Z.; Xie, W.; Zhu, J.; Huang, C.; Zhu, M.; et al. Medium-chain triglyceride ameliorates insulin resistance and inflammation in high fat diet-induced obese mice. Eur. J. Nutr. 2016, 55, 931–940. [Google Scholar] [CrossRef] [PubMed]
- Narayanankutty, A.; Mukesh, R.K.; Ayoob, S.K.; Ramavarma, S.K.; Suseela, I.M.; Manalil, J.J.; Kuzhivelil, B.T.; Raghavamenon, A.C. Virgin coconut oil maintains redox status and improves glycemic conditions in high fructose fed rats. J. Food Sci. Technol. 2016, 53, 895–901. [Google Scholar] [CrossRef] [PubMed]
- Marina, A.M.; Man, Y.B.; Nazimah, S.A.; Amin, I. Antioxidant capacity and phenolic acids of virgin coconut oil. Int. J. Food Sci. Nutr. 2008, 2, 114–123. [Google Scholar] [CrossRef] [PubMed]
- Srinivasan, S.; Muthukumaran, J.; Muruganathan, U.; Venkatesan, R.S.; Jalaludeen, A.M. Antihyperglycemic effect of syringic acid on attenuating the key enzymes of carbohydrate metabolism in experimental diabetic rats. Biomed. Prev. Nutr. 2014, 4, 595–602. [Google Scholar] [CrossRef]
- Valente, F.X.; Cândido, F.G.; Lopes, L.L.; Dias, D.M.; Carvalho, S.D.; Pereira, P.F.; Bressan, J. Effects of coconut oil consumption on energy metabolism, cardiometabolic risk markers, and appetitive responses in women with excess body fat. Eur. J. Nutr. 2018, 57, 1627–1637. [Google Scholar] [CrossRef] [PubMed]
- Kinsella, R.; Maher, T.; Clegg, M.E. Coconut oil has less satiating properties than medium chain triglyceride oil. Physiol. Behav. 2017, 179, 422–426. [Google Scholar] [CrossRef] [PubMed]
- Deol, P.; Evans, J.R.; Dhahbi, J.; Chellappa, K.; Han, D.S.; Spindler, S.; Sladek, F.M. Soybean Oil Is More Obesogenic and Diabetogenic than Coconut Oil and Fructose in Mouse: Potential Role for the Liver. PLoS ONE 2015, 10, e0132672. [Google Scholar] [CrossRef] [PubMed]
- Madsen, L.; Pedersen, L.M.; Liaset, B.; Ma, T.; Petersen, R.K.; van den Berg, S.; Pan, J.; Müller-Decker, K.; Dülsner, E.D.; Kleemann, R.; et al. cAMP-dependent signaling regulates the adipogenic effect of n-6 polyunsaturated fatty acids. J. Biol. Chem. 2008, 283, 7196–7205. [Google Scholar] [CrossRef] [PubMed]
- Mao, L.; Lei, J.; Schoemaker, M.H.; Ma, B.; Zhong, Y.; Lambers, T.T.; Van Tol, E.A.F.; Zhou, Y.; Nie, T.; Wu, D. Long-chain polyunsaturated fatty acids and extensively hydrolyzed casein-induced browning in a Ucp-1 reporter mouse model of obesity. Food Funct. 2018, 25, 2362–7233. [Google Scholar] [CrossRef] [PubMed]
- Yu, S.Y.; Lee, Y.J.; Kim, J.D.; Kang, S.N.; Lee, S.K.; Jang, J.Y.; Lee, H.K.; Lim, J.H.; Lee, O.H. Phenolic Composition, Antioxidant Activity and Anti-Adipogenic Effect of Hot Water Extract from Safflower (CarthamustinctoriusL.) Seed. Nutrients 2013, 5, 4894–4907. [Google Scholar] [CrossRef] [PubMed]
- Zhu, H.; Wang, X.; Pan, H.; Dai, Y.; Li, N.; Wang, L.; Yang, H.; Gong, F. The Mechanism by Which Safflower Yellow Decreases Body Fat Mass and Improves Insulin Sensitivity in HFD-Induced Obese Mice. Front. Pharmacol. 2016, 7, 127. [Google Scholar] [CrossRef] [PubMed]
- Baker, E.J.; Miles, E.A.; Burdge, G.C.; Yaqoob, P.; Calder, P.C. Metabolism and functional effects of plant-derived omega-3 fatty acids in humans. Prog. Lipid Res. 2016, 64, 30–56. [Google Scholar] [CrossRef] [PubMed]
- Jiménez-Gómez, Y.; Marín, C.; Peérez-Martínez, P.; Hartwich, J.; Malczewska-Malec, M.; Golabek, I.; Kiec-Wilk, B.; Cruz-Teno, C.; Rodríguez, F.; Gómez, P.; et al. A low-fat, high-complex carbohydrate diet supplemented with long-chain (n-3) fatty acids alters the postprandial lipoprotein profile in patients with metabolic syndrome. J. Nutr. 2010, 140, 1595–1601. [Google Scholar] [CrossRef] [PubMed]
- Santos-López, J.A.; Garcimartín, A.; López-Oliva, M.E.; Bautista-Ávila, M.; González-Muñoz, M.J.; Bastida, S.; Benedí, J.; Sánchez-Muniz, F.J. Chia Oil-Enriched Restructured Pork Effects on Oxidative and Inflammatory Status of Aged Rats Fed High Cholesterol/High Fat Diets. J. Med. Food 2017, 20, 526–534. [Google Scholar] [CrossRef] [PubMed]
- Dittrich, M.; Jahreis, G.; Bothor, K.; Drechsel, C.; Kiehntopf, M.; Blüher, M.; Dawczynski, C. Benefits of foods supplemented with vegetable oils rich in alpha-linolenic, stearidonic or docosahexaenoic acid in hypertriglyceridemic subjects: A double-blind, randomized, controlled trail. Eur. J. Nutr. 2014, 54, 881–893. [Google Scholar] [CrossRef] [PubMed]
- Mirfatahi, M.; Tabibi, H.; Nasrollahi, A.; Hedayati, M. Effects of Flaxseed Oil on Serum Lipids and Lipoproteins in Hemodialysis Patients: A Randomized Controlled Trial. Iran. J. Kidney Dis. 2016, 10, 405–412. [Google Scholar] [PubMed]
- Zhao, G.; Etherton, T.D.; Martin, K.R.; West, S.G.; Gillies, P.J.; Kris-Etherton, P.M. Dietary alpha-linolenic acid reduces inflammatory and lipid cardiovascular risk factors in hypercholesterolemic men and women. J. Nutr. 2004, 134, 2991–2997. [Google Scholar] [CrossRef] [PubMed]
- Maki, K.C.; Dicklin, M.R. Omega-3 Fatty Acid Supplementation and Cardiovascular Disease Risk: Glass Half Full or Time to Nail the Coffin Shut? Nutrients 2018, 10, 864. [Google Scholar] [CrossRef] [PubMed]
- Pearl, R.L.; Wadden, T.A.; Tronieri, J.S.; Berkowitz, R.I.; Chao, A.M.; Alamuddin, N.; Leonard, S.M.; Carvajal, R.; Bakizada, Z.M.; Pinkasavage, E.; et al. Short- and Long-Term Changes in Health-Related Quality of Life with Weight Loss: Results from a Randomized Controlled Trial. Obesity 2018, 26, 985–991. [Google Scholar] [CrossRef] [PubMed]


| Variable | n | % |
|---|---|---|
| Socio economic classification | ||
| B1 | 7 | 9.3 |
| B2 | 17 | 22.7 |
| C1 | 36 | 48.0 |
| C2 | 15 | 20.0 |
| Marital status | ||
| Single | 13 | 17.3 |
| Married | 52 | 69.3 |
| Divorced | 10 | 13.3 |
| Degree of schooling | ||
| Primary school | 17 | 22.7 |
| Incomplete primary school | 3 | 4.0 |
| Secondary education | 46 | 61.3 |
| Higher education | 6 | 8.0 |
| Postgraduate | 3 | 4.0 |
| Groups | p-Value | ||||||||
|---|---|---|---|---|---|---|---|---|---|
| CoG (n = 18) | SafG (n = 19) | ChG (n = 19) | PG (n = 19) | ||||||
| n | % | n | % | n | % | n | % | ||
| Weight loss % | |||||||||
| >5% | 17 | 94.4 | 17 | 89.5 | 17 | 89.5 | 9 | 47.4 | p = 0.002 * |
| up to 5% | 1 | 5.6 | 2 | 10.5 | 2 | 10.5 | 10 | 52.6 | |
| Total | 18 | 100.0 | 19 | 100.0 | 19 | 100.0 | 19 | 100.0 | |
| Weight loss% | p = 0.013 * | ||||||||
| >10% | 4 | 22.2 | 1 | 5.3 | - | - | - | - | |
| Up to 10% | 14 | 77.8 | 18 | 94.7 | 19 | 100.0 | 19 | 100.0 | |
| Total | 18 | 100.0 | 19 | 100.0 | 19 | 100.0 | 19 | 100.0 | |
| Groups | p-Value | ||||
|---|---|---|---|---|---|
| GCo (n = 18) | SafG (n = 19) | ChG (n = 19) | GP (n = 19) | ||
| Biochemical characteristics | Mean ± SD | Mean ± SD | Mean ± SD | Mean ± SD | |
| Total cholesterol (TC mg/dL) | |||||
| T1 | 215.56 ± 17.85 | 200.74 ± 25.77 | 232.47 ± 17.98 | 214.47 ± 24.05 | |
| T2 | 198.00 ± 17.60 * | 182.95 ± 19.13 * | 187.11 ± 17.04 * | 195.74 ± 26.22 * | |
| Δ | −17.56 ± 7.70 | −17.79 ± 9.10 | −45.36 ± 8.86 a | −18.74 ± 10.27 | p < 0.001 |
| LDLc (mg/dL) | |||||
| T1 | 143.22 ± 18.78 | 146 ± 26.42 | 166.16 ± 17.90 | 142.84 ± 23.74 | |
| T2 | 128.33 ± 17.72 * | 130.63 ± 24.34 * | 123.63 ± 18.24 * | 127.47 ± 23.21 * | |
| Δ | −14.89 ± 11.53 | −15.37 ± 9.35 | −42.53 ± 22.65 a | −15.37 ± 13.78 | p < 0.001 |
| HDLc (mg/dL) | |||||
| T1 | 52.94 ± 7.94 | 44.53 ± 7.19 | 45.32 ± 7.17 | 50.47 ± 7.61 | |
| T2 | 55.61 ± 6.36 * | 47.11 ± 9.82 * | 49.05 ± 5.93 * | 49.95 ± 7.15 | |
| Δ | 2.67 ± 158 b | 2.58 ± 2.63 | 3.73 ± 1.24 a | 0.52 ± 0.46 | p < 0.001 |
| VLDLc (mg/dL) | |||||
| T1 | 21.50 ± 4.26 | 18.95 ± 5.29 | 23.47 ± 6.99 | 21.47 ± 7.41 | |
| T2 | 17.83 ± 3.17 * | 15.74 ± 4.48 * | 18.00 ±5.08 * | 20.05 ± 8.02 * | |
| Δ | −3.67 ± 4.56 | −3.21 ± 4.14 | −5.47 ± 7.63 | −1.42 ± 2.76 | p = 0.421 |
| Triglycerides (mg/dL) | |||||
| T1 | 130.89 ± 38.22 | 129.58 ± 49.34 | 137.79 ± 36.80 | 132.47 ± 44.00 | |
| T2 | 98.33 ± 29.09 * | 93.95 ± 36.51 * | 88.05 ± 24.42 * | 107.53 ± 39.18 * | |
| Δ | −32.56 ± 24.43 | −35.63 ± 23.47 | −49.74 ± 26.36 a | −24.94 ± 28.28 | p = 0.040 |
| Tg/HDL rate | |||||
| T1 | 2.52 ± 0.75 | 3.10 ± 1.77 | 3.27 ± 1.07 | 2.70 ± 1.05 | |
| T2 | 1.78 ± 0.53 * | 2.26 ± 1.63 * | 1.83 ± 0.58 * | 2.24 ± 1.03 * | |
| Δ | −0.74 ± 0.66 | −0.84 ± 0.60 | −1.36 ± 0.88 a | −0.46 ± 0.55 | p < 0.001 |
| MEG (mg/dl) | |||||
| T1 | 109.56 ± 7.32 | 108.28 ± 13.01 | 110.7 ± 9.53 | 104.2 ± 11.57 | |
| T2 | 84.84 ±6.17 * | 94.08 ± 8.64 * | 95.44 ± 6.79 * | 93.78 ± 8.31 * | |
| Δ | −24.71 ± 8.13c | −14.20 ± 7.44 d | −15.26 ± 5.98 d | −10.42 ± 5.17 | p < 0.001 |
| HbA1C (%) | |||||
| T1 | 5.44 ± 0.25 | 5.40 ± 0.45 | 5.48 ± 0.33 | 5.26 ± 0.40 | |
| T2 | 4.58 ± 0.21 * | 4.91 ± 0.30 * | 4.95 ± 0.24 * | 4.89 ± 0.29 * | |
| Δ | −0.86 ± 0.28 c | −0.49 ± 0.26 | −0.53 ± 0.21 | −0.36 ± 0.18 | p < 0.001 |
| Groups | p-Value | ||||
|---|---|---|---|---|---|
| CoG (n = 18) | SafG (n = 19) | ChG (n = 19) | PG (n = 19) | ||
| Variables | Mean ± SD | Mean ± SD | Mean ± SD | Mean ± SD | |
| Energy (Kcal) | |||||
| T1 | 2148.88 ±126.51 | 2080.81 ±122.59 | 2094.59 ± 94.23 | 2070.64 ± 109.96 | |
| T2 | 1536.19 ± 78.60 * | 1580.32 ± 98.69 * | 1562 ± 68.66 * | 1538.14 ± 63.82 * | |
| Δ | −612.69 ± 81.2 ** | −500.49 ± 73.54 | −532.59 ± 75.38 | −532.50 ± 89.84 | p = 0.016 |
| Protein (g) | |||||
| T1 | 59.71 ± 6.39 | 57.81 ± 5.79 | 62.31 ± 8.65 | 58.68 ± 6.46 | |
| T2 | 62.84 ± 4.58 * | 60.86 ± 4.96 * | 63.19 ± 3.87 | 61.62 ± 3.78 | |
| Δ | 3.14 ± 7.56 | 3.04 ± 5.75 | 0.87 ± 8.15 | 2.95 ± 7.33 | p = 0.735 |
| Carbohydrates (g) | |||||
| T1 | 354.79 ± 42.66 | 349.26 ± 24.23 | 352.42 ± 18.76 | 345.70 ± 24.70 | |
| T2 | 216.24 ± 14.83 * | 220.28 ± 15.31 * | 223.07 ± 12.03 * | 217.98 ± 14.32 * | |
| Δ | −138.55 ± 41.19 | −128.98 ± 20.00 | −129.34 ± 17.56 | −127.71 ± 28.19 | p = 0.375 |
| Lipids (g) | |||||
| T1 | 54.55 ± 11.11 | 50.28 ± 7.18 | 48.41 ± 6.68 | 50.35 ± 6.91 | |
| T2 | 51.65 ± 3.81 | 48.64 ± 4.26 | 46.33 ± 3.59 | 48.63 ± 3.28 * | |
| Δ | −2.9 ± 6.21 | 1−1.69 ± 5.89 | −2.08 ± 5.33 | −1.71 ± 6.44 | p = 0.116 |
| Fiber (g) | |||||
| T1 | 11.48 ± 1.98 | 12.14 ± 1.84 | 12.36 ± 1.50 | 12.20 ± 1.68 | |
| T2 | 25.94 ± 2.86 * | 25.71 ±2.26 * | 24.63 ± 3.07 * | 26.28 ± 2.86 * | |
| Δ | 14.46 ± 3.59 | 13.57 ± 2.56 | 12.26 ± 2.44 | 14.08 ± 2.18 | p = 0.109 |
| Classification | Groups | p-Value | |||||||||
|---|---|---|---|---|---|---|---|---|---|---|---|
| CoG (n = 18) | SafG (n = 19) | ChG (n = 19) | PG (n = 19) | Total | |||||||
| n | % | n | % | n | % | n | % | n | % | ||
| Total | 18 | 100.0 | 19 | 100.0 | 19 | 100.0 | 19 | 100.0 | 75 | 100.0 | |
| T1 | p = 0.031 * | ||||||||||
| Sedentary | 14 | 77.8 | 15 | 78.9 | 16 | 84.2 | 19 | 100.0 | 63 | 84.0 | |
| Active | 4 | 22.2 | 4 | 32.1 | 3 | 15.8 | - | - | 12 | 16.0 | |
| T2 | p = 0.278 | ||||||||||
| Sedentary | 7 | 38.9 | 6 | 31.6 | 5 | 26.3 | 19 | 47.4 | 45 | 60.0 | |
| Active | 11 | 61.1 | 13 | 68.4 | 14 | 73.7 | 10 | 52.6 | 30 | 40.0 | |
| p-value | p = 0.044 | p = 0.041 | p = 0.021 | ** | p< 0.001 * | ||||||
© 2018 by the authors. Licensee MDPI, Basel, Switzerland. This article is an open access article distributed under the terms and conditions of the Creative Commons Attribution (CC BY) license (http://creativecommons.org/licenses/by/4.0/).
Share and Cite
Oliveira-de-Lira, L.; Santos, E.M.C.; De Souza, R.F.; Matos, R.J.B.; Silva, M.C.d.; Oliveira, L.D.S.; Nascimento, T.G.d.; Schemly, P.A.d.L.S.; Souza, S.L.d. Supplementation-Dependent Effects of Vegetable Oils with Varying Fatty Acid Compositions on Anthropometric and Biochemical Parameters in Obese Women. Nutrients 2018, 10, 932. https://doi.org/10.3390/nu10070932
Oliveira-de-Lira L, Santos EMC, De Souza RF, Matos RJB, Silva MCd, Oliveira LDS, Nascimento TGd, Schemly PAdLS, Souza SLd. Supplementation-Dependent Effects of Vegetable Oils with Varying Fatty Acid Compositions on Anthropometric and Biochemical Parameters in Obese Women. Nutrients. 2018; 10(7):932. https://doi.org/10.3390/nu10070932
Chicago/Turabian StyleOliveira-de-Lira, Luciene, Eduila Maria Couto Santos, Raphael Fabrício De Souza, Rhowena Jane Barbosa Matos, Matilde Cesiana da Silva, Lisiane Dos Santos Oliveira, Taís Galdêncio do Nascimento, Paulo Artur de Lara Schinda Schemly, and Sandra Lopes de Souza. 2018. "Supplementation-Dependent Effects of Vegetable Oils with Varying Fatty Acid Compositions on Anthropometric and Biochemical Parameters in Obese Women" Nutrients 10, no. 7: 932. https://doi.org/10.3390/nu10070932
APA StyleOliveira-de-Lira, L., Santos, E. M. C., De Souza, R. F., Matos, R. J. B., Silva, M. C. d., Oliveira, L. D. S., Nascimento, T. G. d., Schemly, P. A. d. L. S., & Souza, S. L. d. (2018). Supplementation-Dependent Effects of Vegetable Oils with Varying Fatty Acid Compositions on Anthropometric and Biochemical Parameters in Obese Women. Nutrients, 10(7), 932. https://doi.org/10.3390/nu10070932