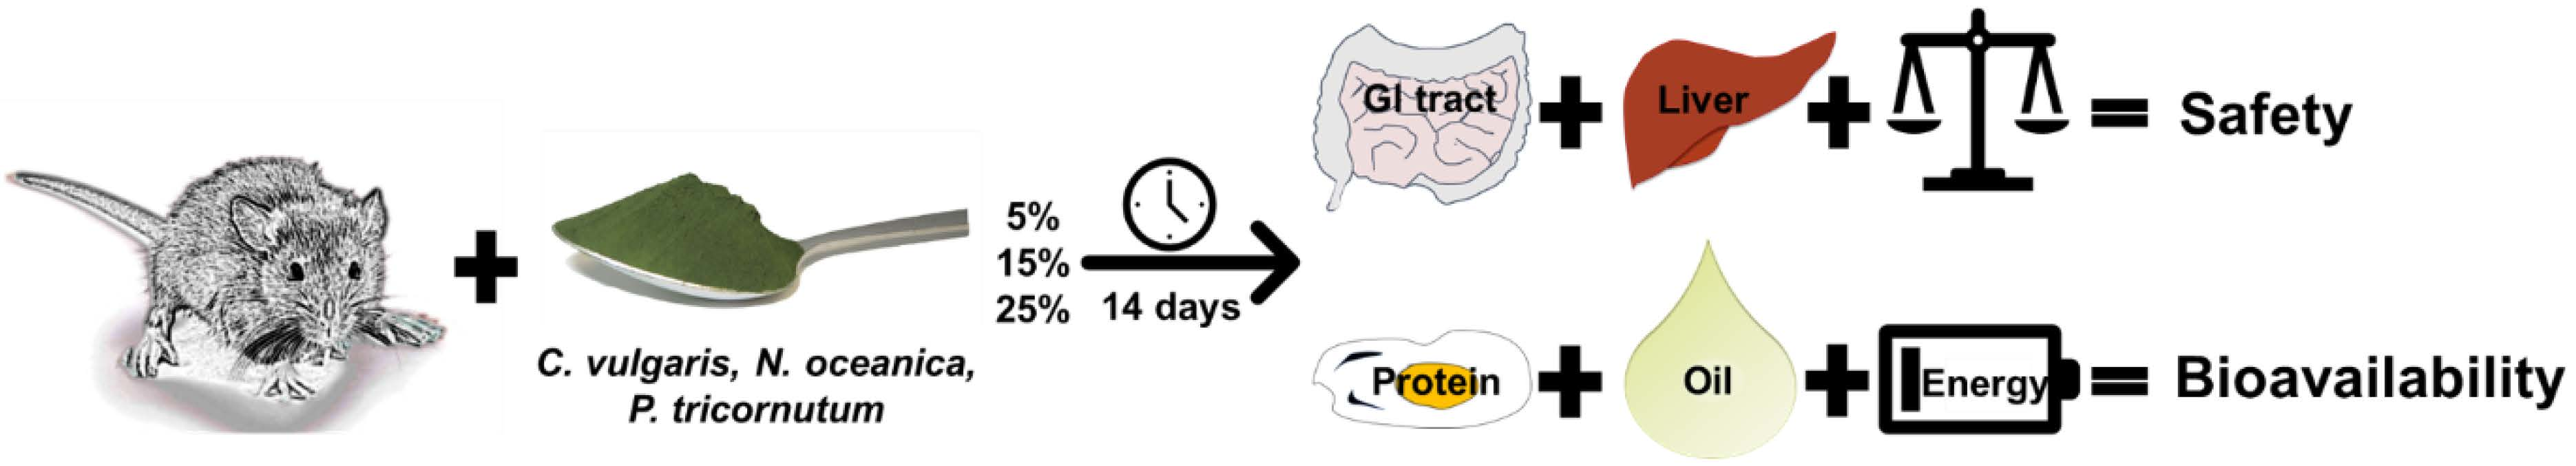
Bioavailability and Safety of Nutrients from the Microalgae Chlorella vulgaris, Nannochloropsis oceanica and Phaeodactylum tricornutum in C57BL/6 Mice

 , ,
, ,
Abstract
:
1. Introduction
2. Materials and Methods
2.1. Algae
2.2. Animals
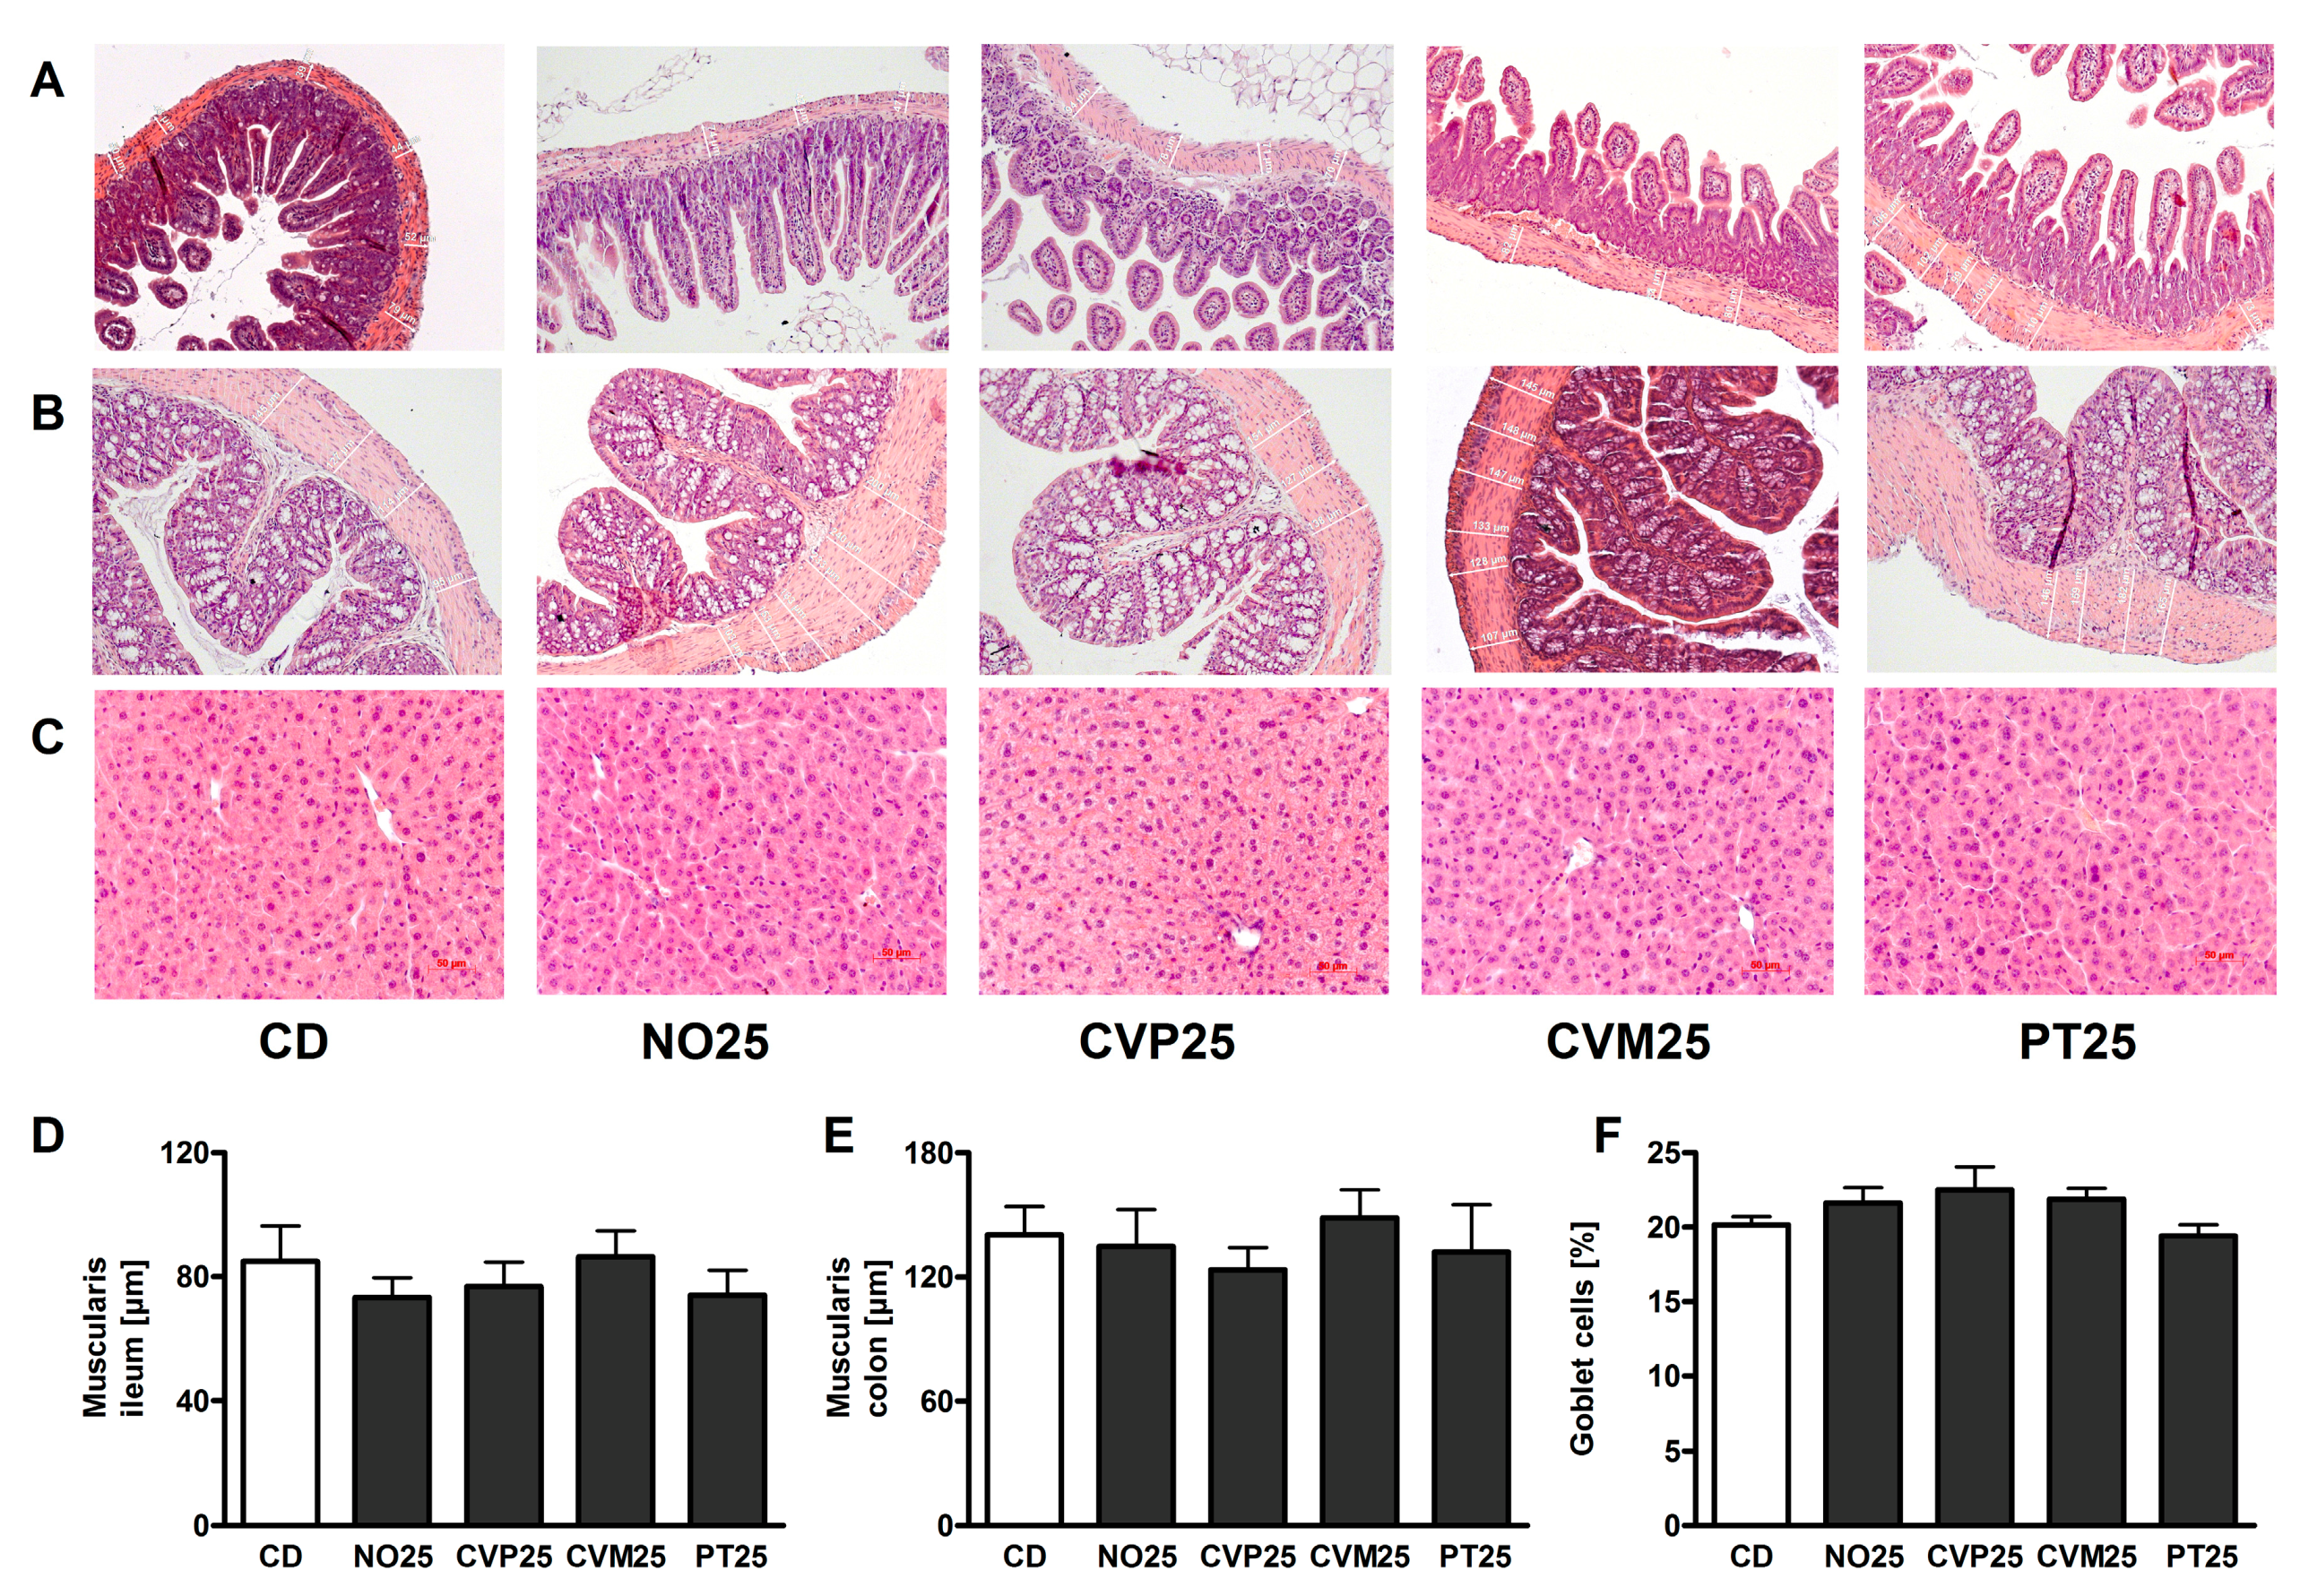
2.3. Histological Analysis
2.4. Bioavailability of Energy, Proteins and Fatty Acids
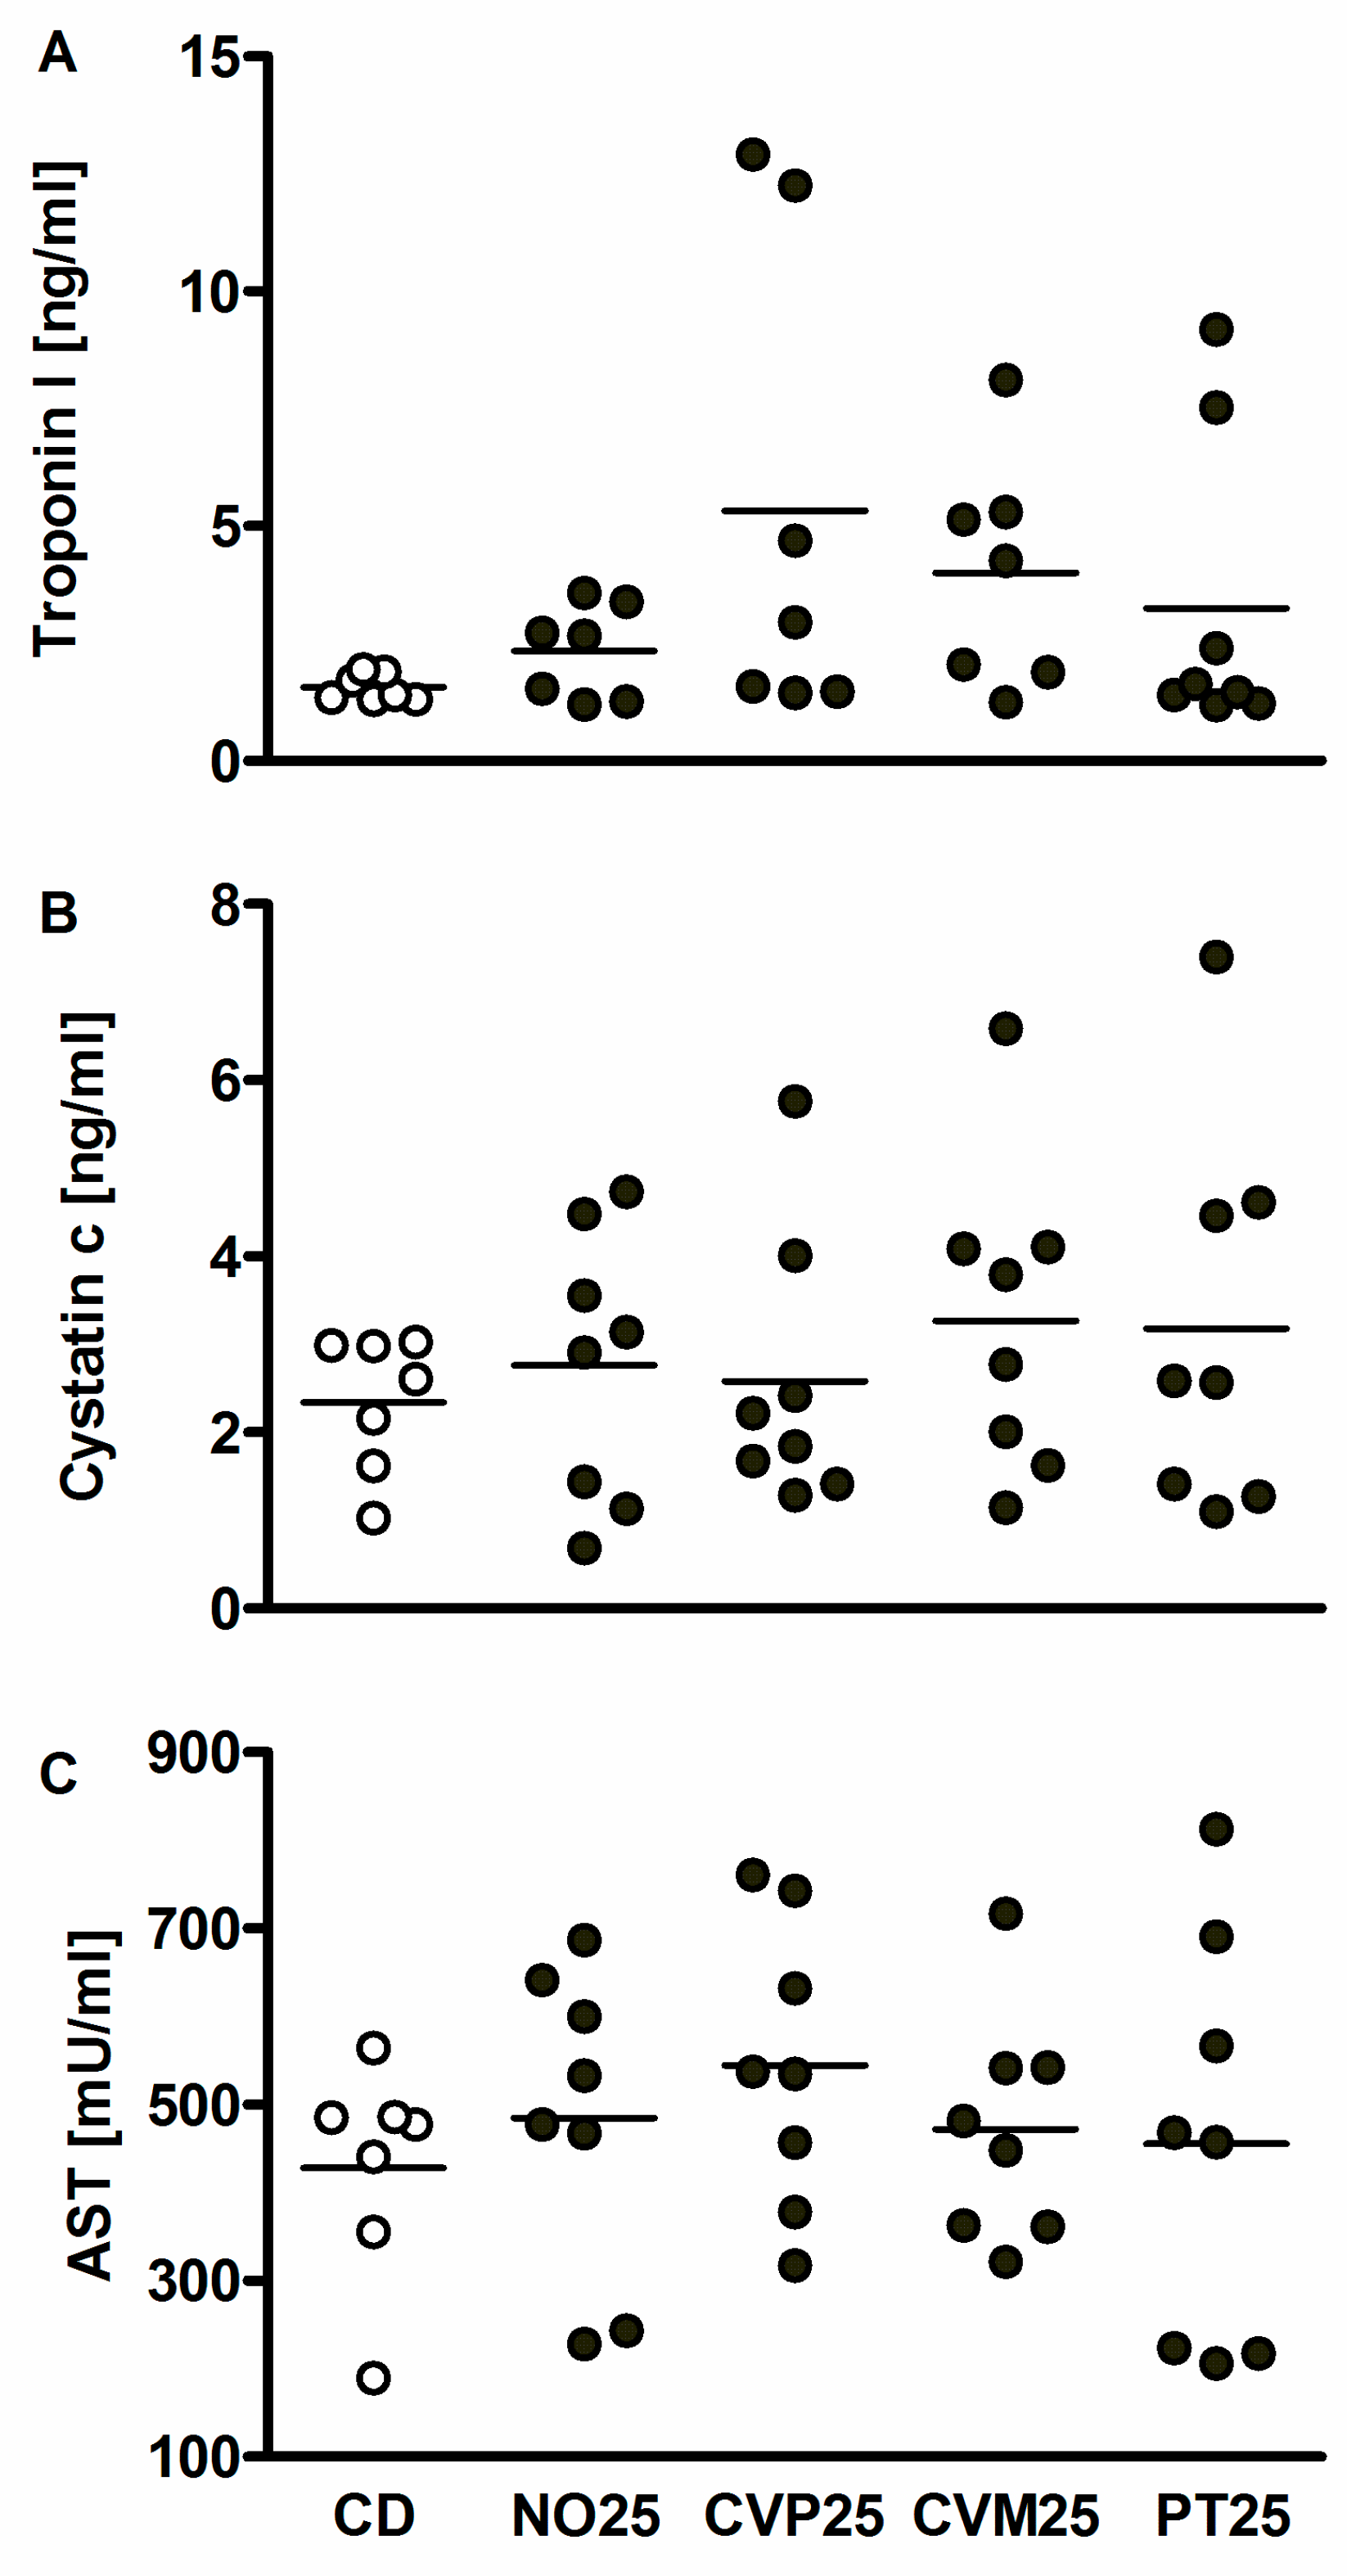
2.5. Toxicity Markers
2.6. Statistics
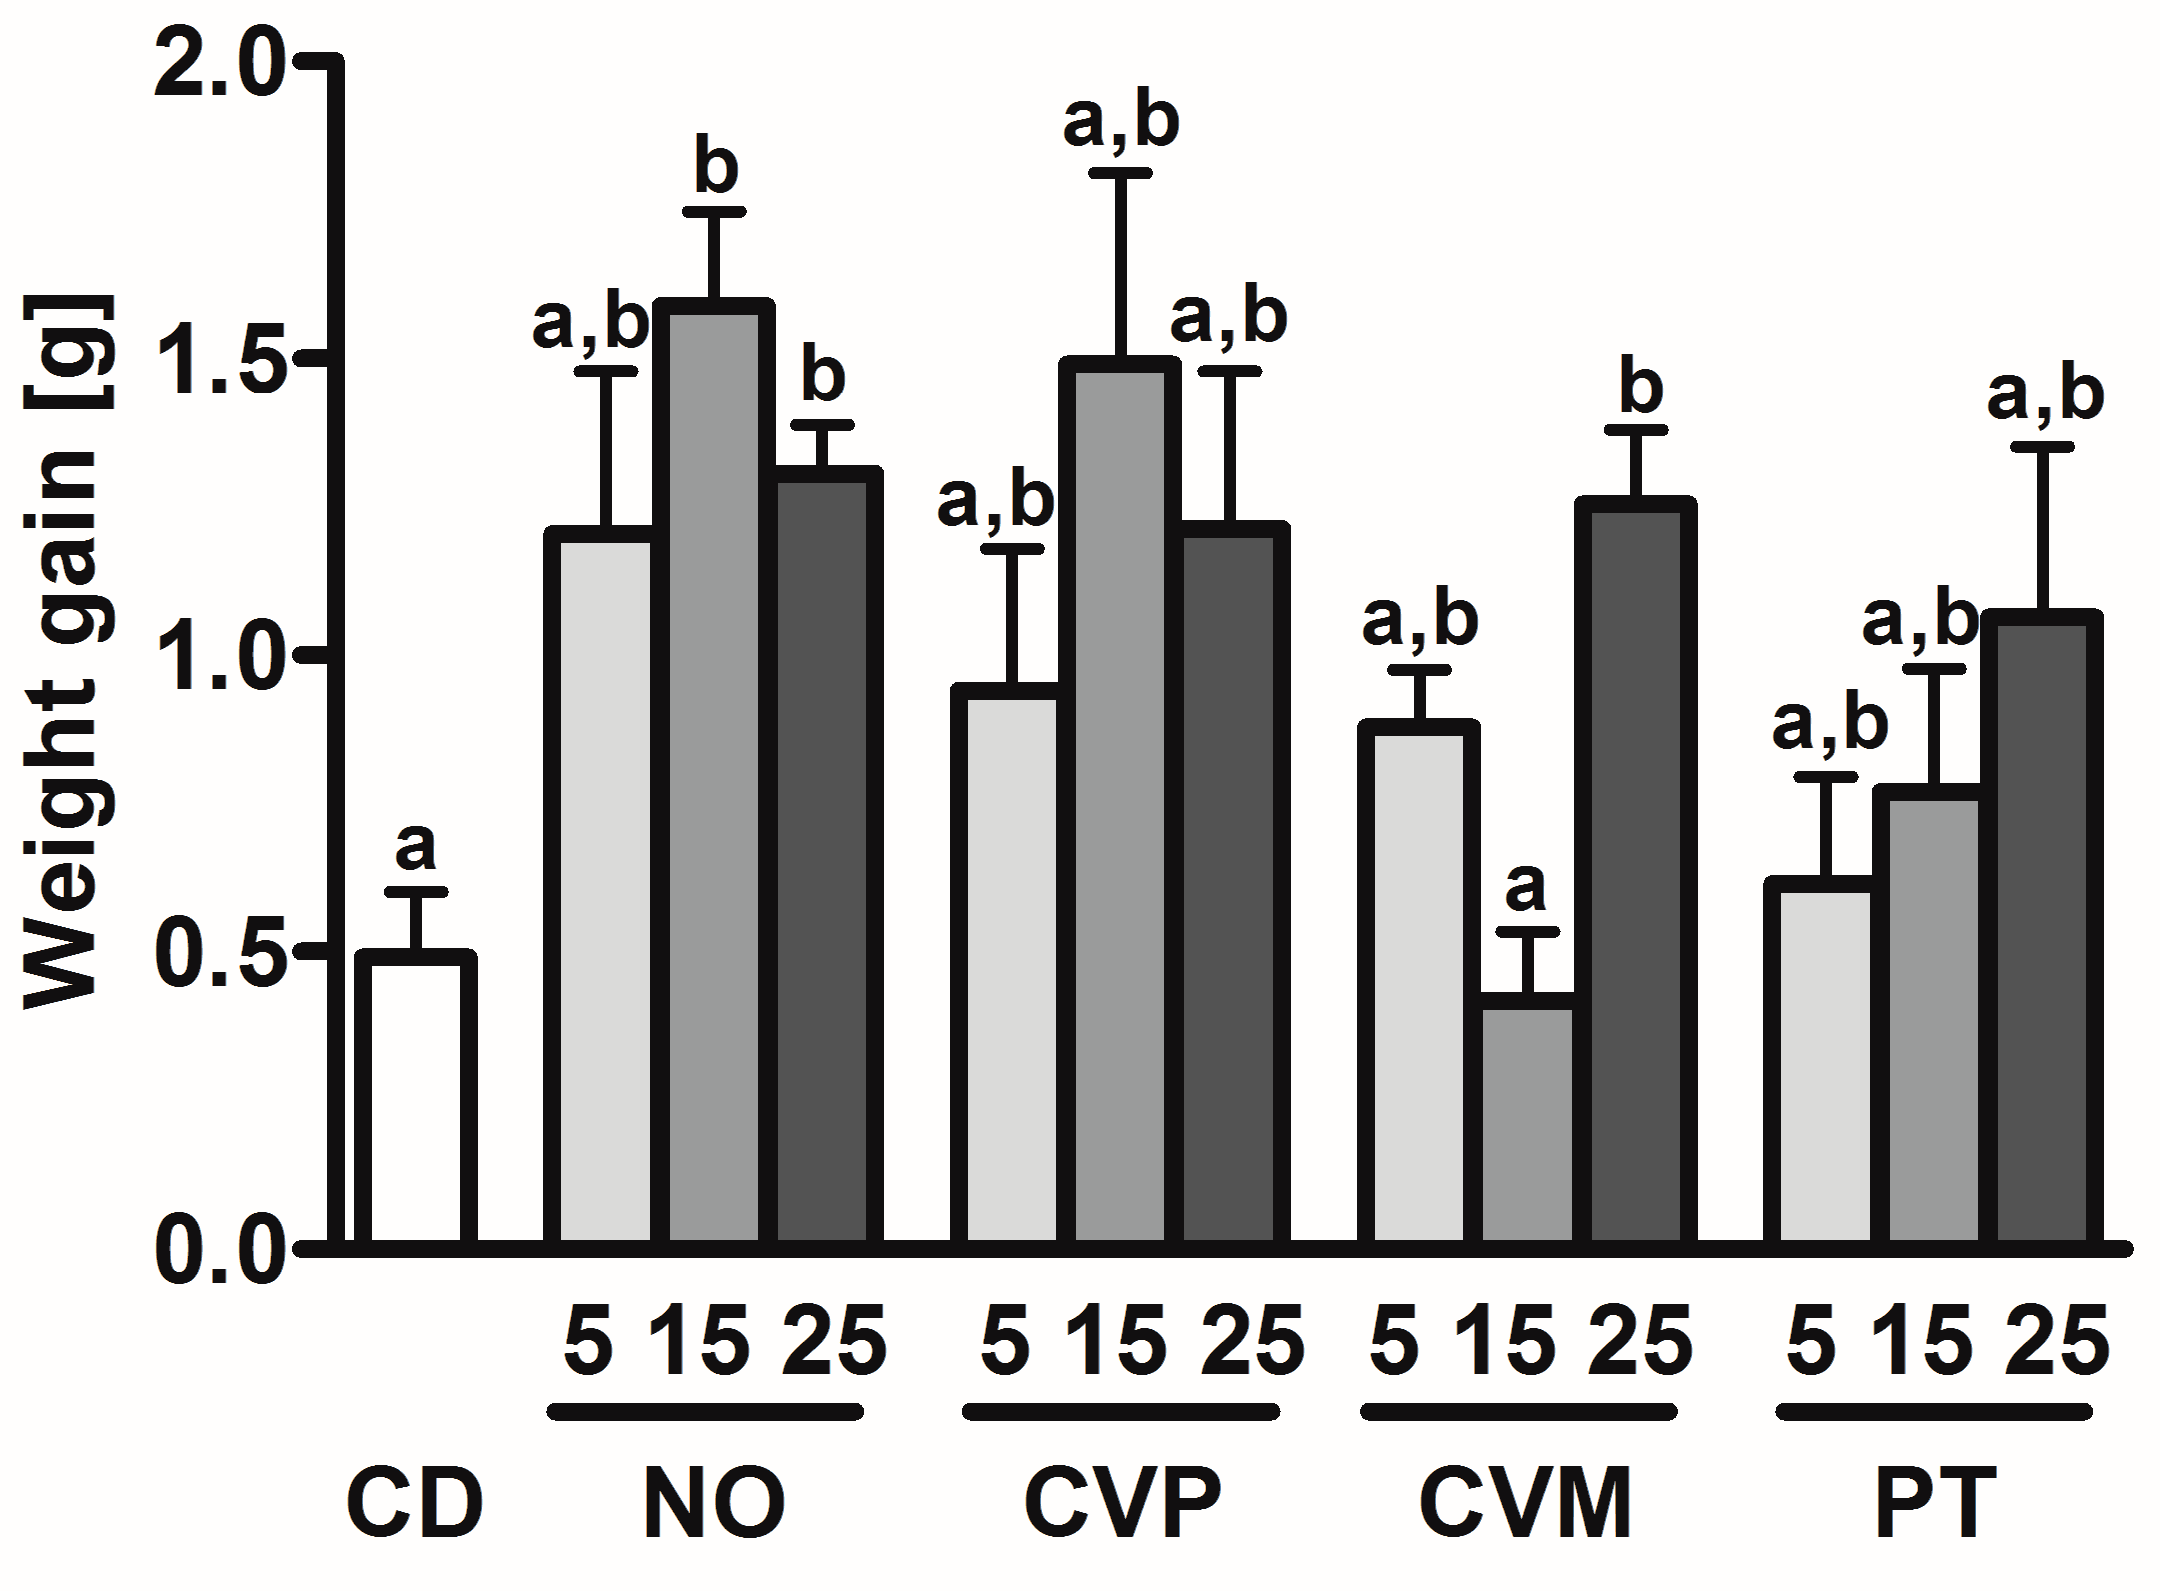
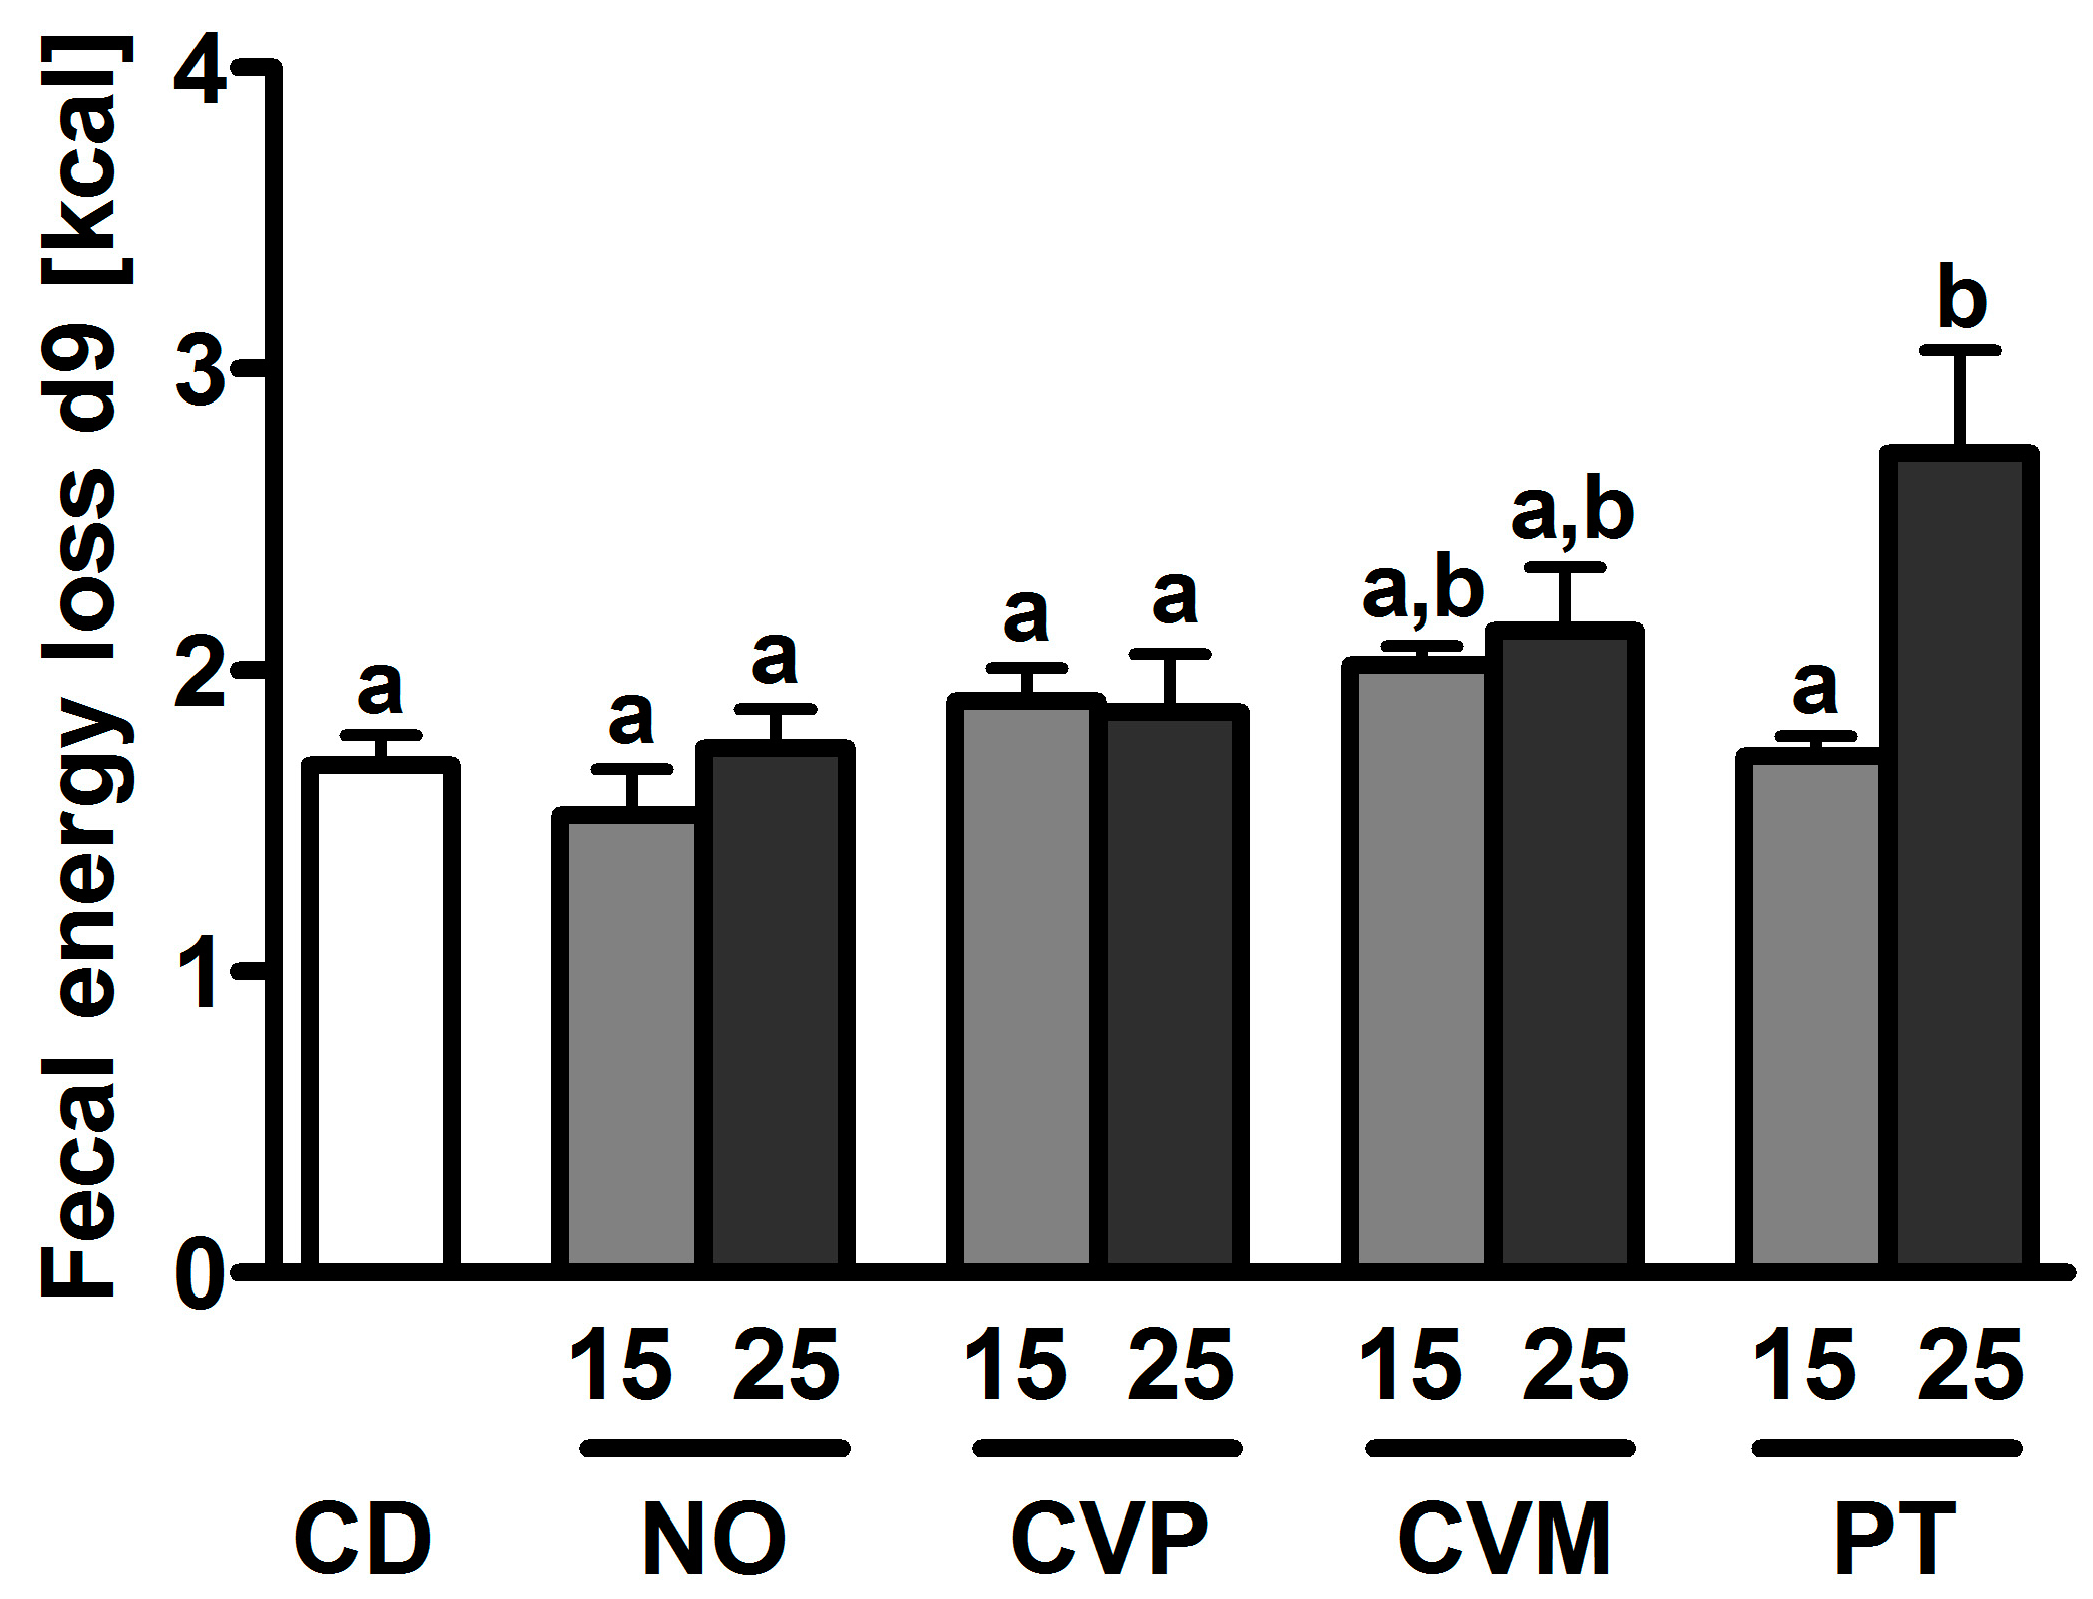
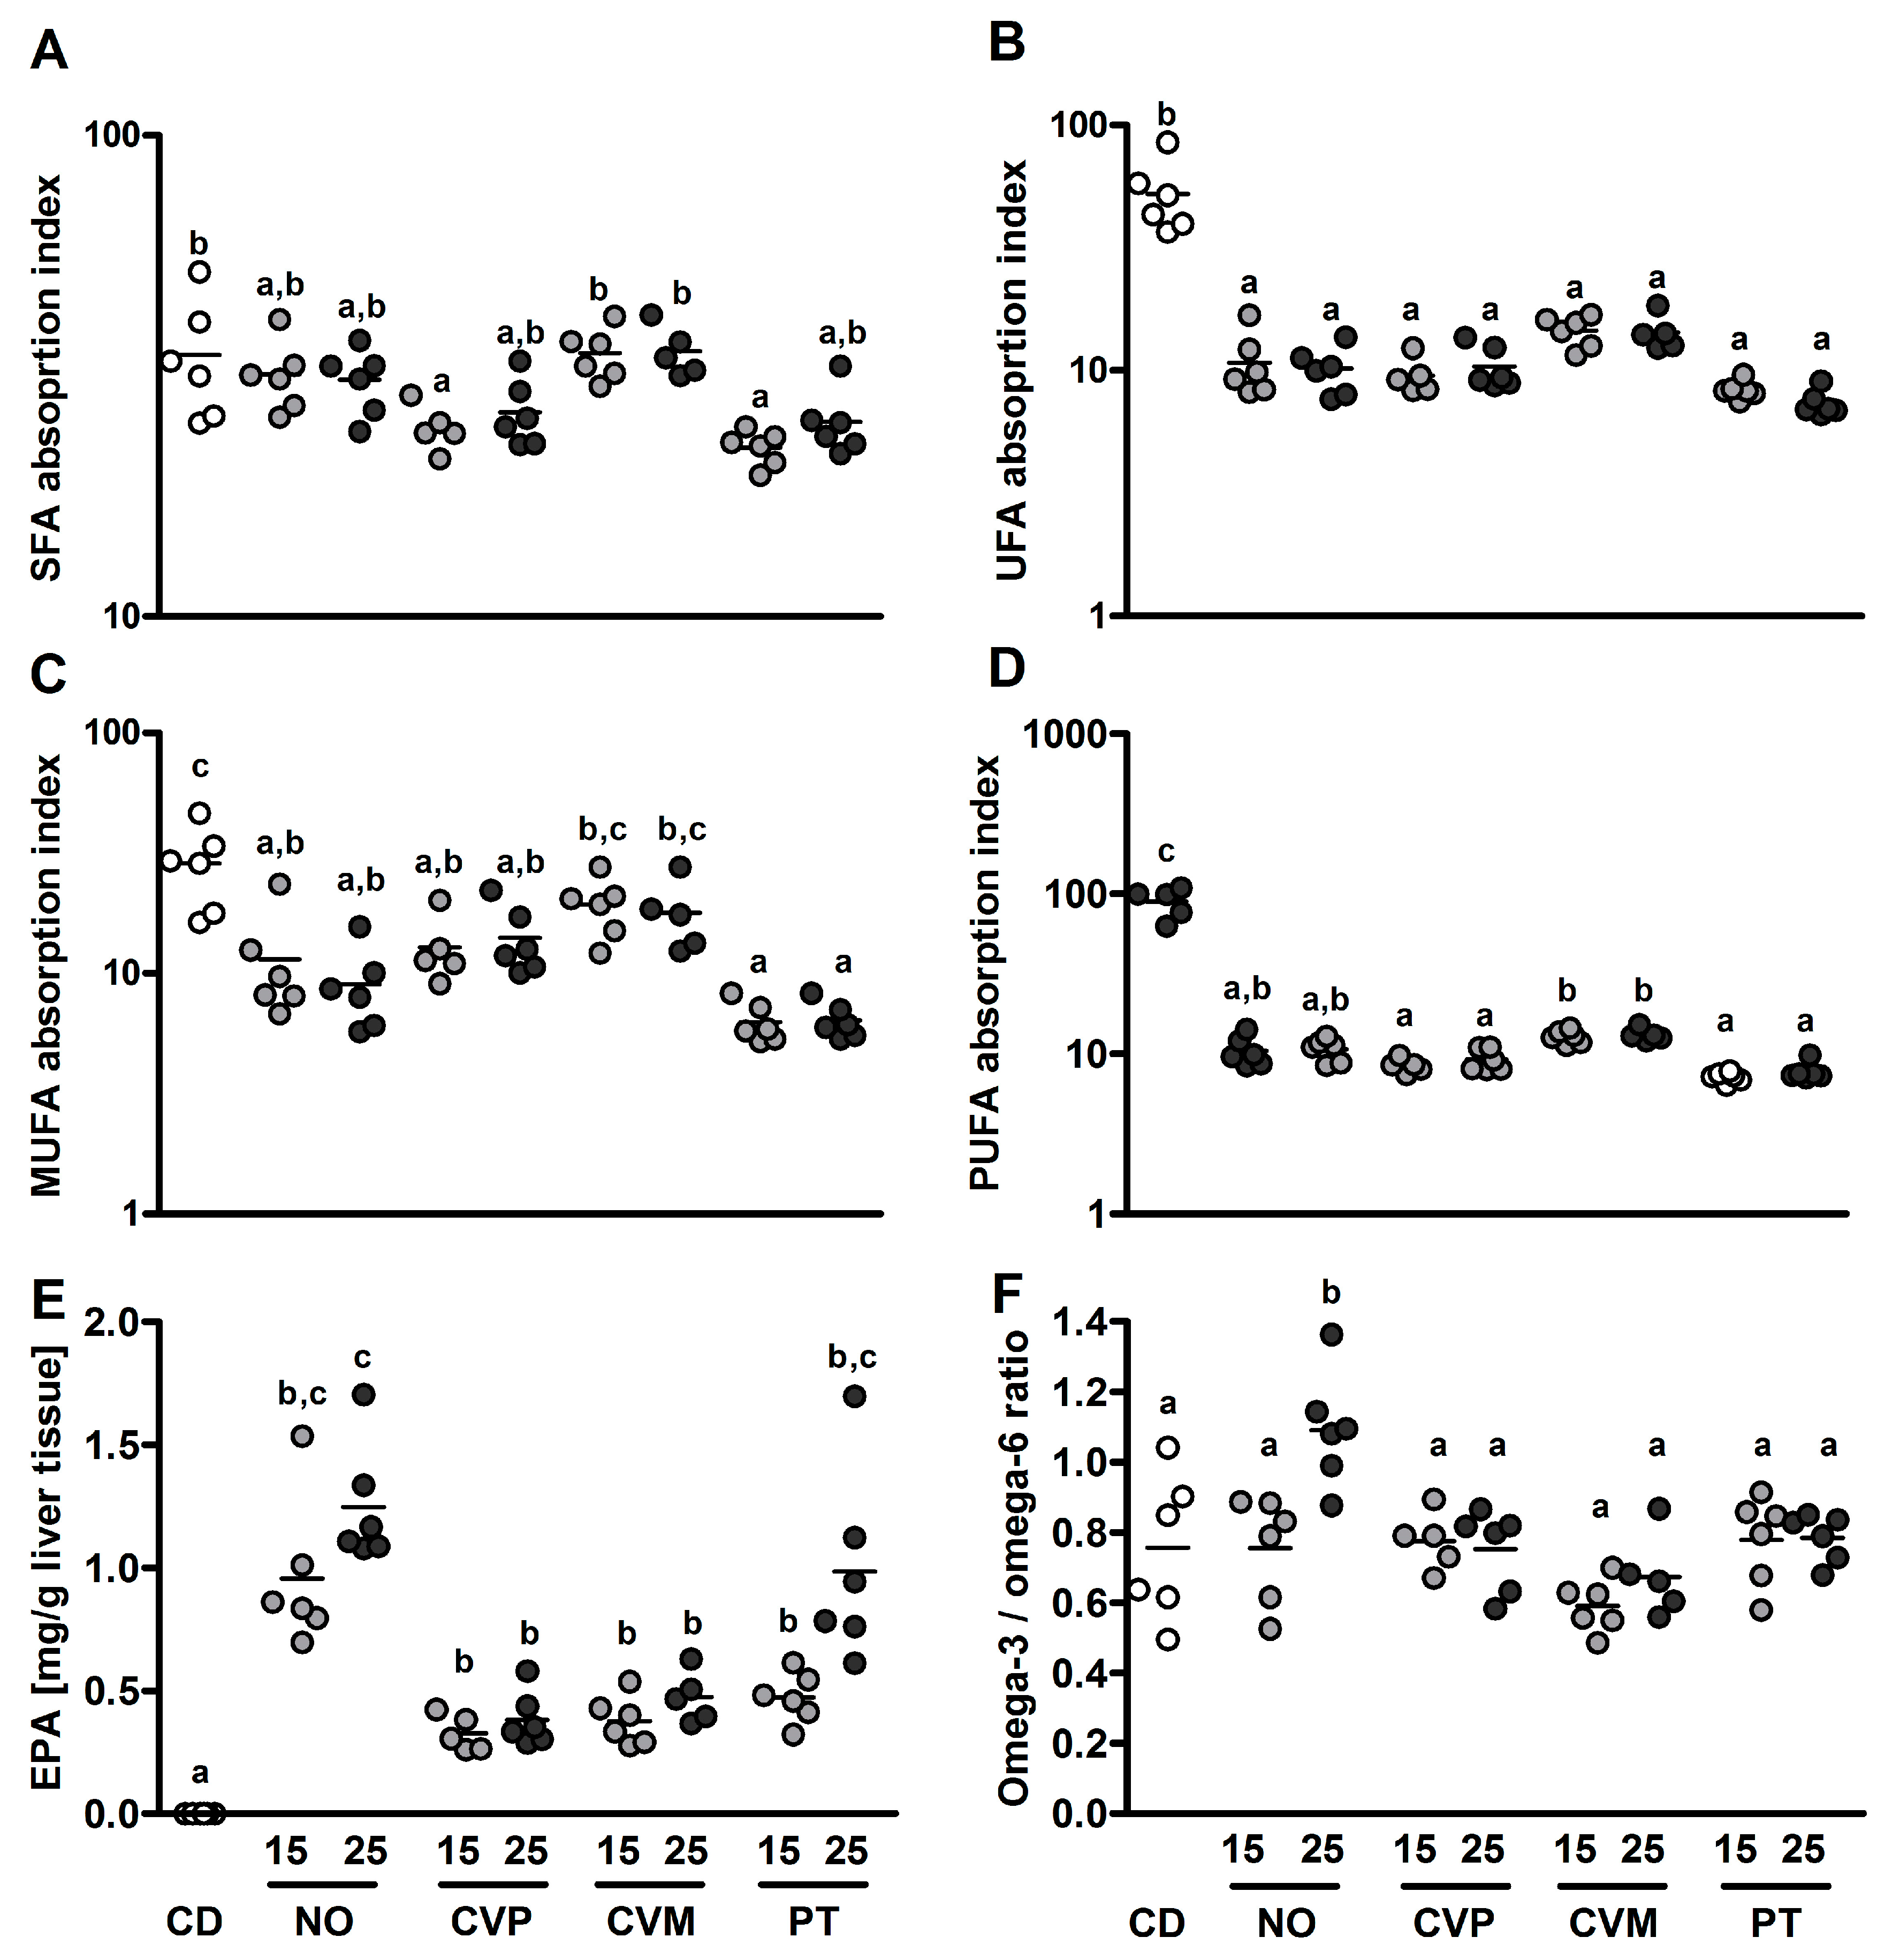
3. Results
4. Discussion
5. Conclusions
Author Contributions
Funding
Acknowledgments
Conflicts of Interest
References
- Becker, W. Microalgae in Human and Animal Nutrition. In Handbook of Microalgal Culture: Biotechnology and Applied Phycology; Richmond, A., Ed.; Blackwell Science: Ames, IA, USA, 2004; pp. 312–351. ISBN 9780521350204. [Google Scholar]
- Meiser, A.; Schmid-Staiger, U.; Trösch, W. Optimization of eicosapentaenoic acid production by Phaeodactylum tricornutum in the flat panel airlift (FPA) reactor. J. Appl. Phycol. 2004, 16, 215–225. [Google Scholar] [CrossRef]
- Chen, C.-Y.; Chen, Y.-C.; Huang, H.-C.; Huang, C.-C.; Lee, W.-L.; Chang, J.-S. Engineering strategies for enhancing the production of eicosapentaenoic acid (EPA) from an isolated microalga Nannochloropsis oceanica CY2. Bioresour. Technol. 2013, 147, 160–167. [Google Scholar] [CrossRef] [PubMed]
- Chia, M.A.; Lombardi, A.T.; Melão, M.d.G.G. Growth and biochemical composition of Chlorella vulgaris in different growth media. An. Acad. Bras. Cienc. 2013, 85, 1427–1438. [Google Scholar] [CrossRef] [PubMed]
- Spolaore, P.; Joannis-Cassan, C.; Duran, E.; Isambert, A. Commercial applications of microalgae. J. Biosci. Bioeng. 2006, 101, 87–96. [Google Scholar] [CrossRef] [PubMed] [Green Version]
- Tokuşoglu, O.; üUnal, M.K. Biomass Nutrient Profiles of Three Microalgae: Spirulina platensis, Chlorella vulgaris, and Isochrisis galbana. J. Food Sci. 2003, 68, 1144–1148. [Google Scholar] [CrossRef]
- Tanaka, K.; Yamada, A.; Noda, K.; Hasegawa, T.; Okuda, M.; Shoyama, Y.; Nomoto, K. A novel glycoprotein obtained from Chlorella vulgaris strain CK22 shows antimetastatic immunopotentiation. Cancer Immunol. Immunother. 1998, 45, 313–320. [Google Scholar] [CrossRef] [PubMed]
- Suárez, E.R.; Kralovec, J.A.; Noseda, M.D.; Ewart, H.S.; Barrow, C.J.; Lumsden, M.D.; Grindley, T.B. Isolation, characterization and structural determination of a unique type of arabinogalactan from an immunostimulatory extract of Chlorella pyrenoidosa. Carbohydr. Res. 2005, 340, 1489–1498. [Google Scholar] [CrossRef] [PubMed]
- Jong-Yuh, C.; Mei-Fen, S. Potential hypoglycemic effects of Chlorella in streptozotocin-induced diabetic mice. Life Sci. 2005, 77, 980–990. [Google Scholar] [CrossRef] [PubMed]
- Panahi, Y.; Mostafazadeh, B.; Abrishami, A.; Saadat, A.; Beiraghdar, F.; Tavana, S.; Pishgoo, B.; Parvin, S.; Sahebkar, A. Investigation of the effects of Chlorella vulgaris supplementation on the modulation of oxidative stress in apparently healthy smokers. Clin. Lab. 2013, 59, 579–587. [Google Scholar] [CrossRef] [PubMed]
- Ryu, N.H.; Lim, Y.; Park, J.E.; Kim, J.; Kim, J.Y.; Kwon, S.W.; Kwon, O. Impact of daily Chlorella consumption on serum lipid and carotenoid profiles in mildly hypercholesterolemic adults: A double-blinded, randomized, placebo-controlled study. Nutr. J. 2014, 13, 57. [Google Scholar] [CrossRef] [PubMed]
- Gille, A.; Trautmann, A.; Posten, C.; Briviba, K. Bioaccessibility of carotenoids from Chlorella vulgaris and Chlamydomonas reinhardtii. Int. J. Food Sci. Nutr. 2015, 67, 507–513. [Google Scholar] [CrossRef] [PubMed]
- Nagayama, J.; Noda, K.; Uchikawa, T.; Maruyama, I.; Shimomura, H.; Miyahara, M. Effect of maternal Chlorella supplementation on carotenoid concentration in breast milk at early lactation. Int. J. Food Sci. Nutr. 2014, 65, 573–576. [Google Scholar] [CrossRef] [PubMed]
- Becker, E.W. Micro-algae as a source of protein. Biotechnol. Adv. 2007, 25, 207–210. [Google Scholar] [CrossRef] [PubMed]
- Saleh, A.M.; Hussein, L.A.; Abdalla, F.E.; El-Fouly, M.M.; Shaheen, A.B. The nutritional quality of drum-dried algae produced in open door mass culture. Zeitschrift für Ernährungswissenschaft 1985, 24, 256–263. [Google Scholar] [CrossRef]
- Rebolloso-Fuentes, M.M.; Navarro-Pérez, A.; García-Camacho, F.; Ramos-Miras, J.J.; Guil-Guerrero, J.L. Biomass Nutrient Profiles of the Microalga Nannochloropsis. J. Agric. Food Chem. 2001, 49, 2966–2972. [Google Scholar] [CrossRef] [PubMed]
- Rebolloso-Fuentes, M.M.; Navarro-Pérez, A.; Ramos-Miras, J.J.; Guil-Guerrero, J.L. Biomass nutrient profiles of the microalga Phaeodactyum tricornutum. J. Food Biochem. 2001, 25, 57–76. [Google Scholar] [CrossRef]
- Chen, C.-Y.; Chen, Y.-C.; Huang, H.-C.; Ho, S.-H.; Chang, J.-S. Enhancing the production of eicosapentaenoic acid (EPA) from Nannochloropsis oceanica CY2 using innovative photobioreactors with optimal light source arrangements. Bioresour. Technol. 2015, 191, 407–413. [Google Scholar] [CrossRef] [PubMed]
- Ryckebosch, E.; Bruneel, C.; Muylaert, K.; Foubert, I. Microalgae as an alternative source of omega-3 long chain polyunsaturated fatty acids. Lipid Technol. 2012, 24, 128–130. [Google Scholar] [CrossRef]
- Maeda, H.; Hosokawa, M.; Sashima, T.; Funayama, K.; Miyashita, K. Fucoxanthin from edible seaweed, Undaria pinnatifida, shows antiobesity effect through UCP1 expression in white adipose tissues. Biochem. Biophys. Res. Commun. 2005, 332, 392–397. [Google Scholar] [CrossRef] [PubMed]
- Heo, S.-J.; Yoon, W.-J.; Kim, K.-N.; Ahn, G.-N.; Kang, S.-M.; Kang, D.-H.; Affan, A.; Oh, C.; Jung, W.-K.; Jeon, Y.-J. Evaluation of anti-inflammatory effect of fucoxanthin isolated from brown algae in lipopolysaccharide-stimulated RAW 264.7 macrophages. Food Chem. Toxicol. 2010, 48, 2045–2051. [Google Scholar] [CrossRef] [PubMed]
- Ha, A.W.; Na, S.J.; Kim, W.K. Antioxidant effects of fucoxanthin rich powder in rats fed with high fat diet. Nutr. Res. Pract. 2013, 7, 475–480. [Google Scholar] [CrossRef] [PubMed]
- Goh, L.P.; Loh, S.P.; Fatimah, M.Y.; Perumal, K. Bioaccessibility of Carotenoids and Tocopherols in Marine Microalgae, Nannochloropsis sp. and Chaetoceros sp. Malays. J. Nutr. 2009, 15, 77–86. [Google Scholar] [PubMed]
- Neumann, U.; Louis, S.; Gille, A.; Derwenskus, F.; Schmid-Staiger, U.; Briviba, K.; Bischoff, S.C. Anti-inflammatory effects of Phaeodactylum tricornutum extracts on human blood mononuclear cells and murine macrophages. J. Appl. Phycol. 2018. [Google Scholar] [CrossRef]
- Burkholder, T.; Foltz, C.; Karlsson, E.; Linton, C.G.; Smith, J.M. Health Evaluation of Experimental Laboratory Mice. Curr. Protoc. Mouse. Biol. 2012, 2, 145–165. [Google Scholar] [CrossRef] [PubMed] [Green Version]
- Hagenlocher, Y.; Hösel, A.; Bischoff, S.C.; Lorentz, A. Cinnamon extract reduces symptoms, inflammatory mediators and mast cell markers in murine IL-10−/− colitis. J. Nutr. Biochem. 2016, 30, 85–92. [Google Scholar] [CrossRef] [PubMed]
- Song, S.; Meyer, M.; Türk, T.R.; Wilde, B.; Feldkamp, T.; Assert, R.; Wu, K.; Kribben, A.; Witzke, O. Serum cystatin C in mouse models: A reliable and precise marker for renal function and superior to serum creatinine. Nephrol. Dial. Transplant. 2009, 24, 1157–1161. [Google Scholar] [CrossRef] [PubMed]
- Engle, S.K.; Jordan, W.H.; Pritt, M.L.; Chiang, A.Y.; Davis, M.A.; Zimmermann, J.L.; Rudmann, D.G.; Heinz-Taheny, K.M.; Irizarry, A.R.; Yamamoto, Y.; et al. Qualification of cardiac troponin I concentration in mouse serum using isoproterenol and implementation in pharmacology studies to accelerate drug development. Toxicol. Pathol. 2009, 37, 617–628. [Google Scholar] [CrossRef] [PubMed]
- Hoffman, J.R.; Falvo, M.J. Protein-Which is Best? J. Sports Sci. Med. 2004, 3, 118–130. [Google Scholar] [PubMed]
- Becker, E.W. Microalgae: Biotechnology and Microbiology, 1st ed.; Cambridge University Press: Cambridge, UK, 1994; pp. 170–194. ISBN 9780521350204. [Google Scholar]
- Hammond, E.G.; Johnson, L.A.; Su, C.; Wang, T.; White, P.J. Soybean Oil. In Bailey’s Industrial Oil and Fat Products, 6th ed.; John Wiley & Sons, Inc.: New York, NY, USA, 2005; p. 577. ISBN 9780471678496. [Google Scholar]
- Parrish, C.C.; Wangersky, P.J. Particulate and dissolved lipid classes in cultures of Phaeodactylum tricornutum grown in cage culture turbidostats with a range of nitrogen supply rates. Mar. Ecol. Prog. Ser. 1987, 35, 119–128. [Google Scholar] [CrossRef]
- Yao, L.; Gerde, J.A.; Lee, S.-L.; Wang, T.; Harrata, K.A. Microalgae lipid characterization. J. Agric. Food Chem. 2015, 63, 1773–1787. [Google Scholar] [CrossRef] [PubMed]
- Simopoulos, A.P. The importance of the omega-6/omega-3 fatty acid ratio in cardiovascular disease and other chronic diseases. Exp. Biol. Med. (Maywood) 2008, 233, 674–688. [Google Scholar] [CrossRef] [PubMed]
- Li, K.; Huang, T.; Zheng, J.; Wu, K.; Li, D. Effect of Marine-Derived n-3 Polyunsaturated Fatty Acids on C-Reactive Protein, Interleukin 6 and Tumor Necrosis Factor α: A Meta-Analysis. PLoS ONE 2014, 9, e88103. [Google Scholar] [CrossRef] [PubMed]
- Brouwer, I.A.; Raitt, M.H.; Dullemeijer, C.; Kraemer, D.F.; Zock, P.L.; Morris, C.; Katan, M.B.; Connor, W.E.; Camm, J.A.; Schouten, E.G.; et al. Effect of fish oil on ventricular tachyarrhythmia in three studies in patients with implantable cardioverter defibrillators. Eur. Heart J. 2009, 30, 820–826. [Google Scholar] [CrossRef] [PubMed]
- Eslick, G.D.; Howe, P.R.C.; Smith, C.; Priest, R.; Bensoussan, A. Benefits of fish oil supplementation in hyperlipidemia: A systematic review and meta-analysis. Int. J. Cardiol. 2009, 136, 4–16. [Google Scholar] [CrossRef] [PubMed]
- Ryckebosch, E.; Bruneel, C.; Termote-Verhalle, R.; Goiris, K.; Muylaert, K.; Foubert, I. Nutritional evaluation of microalgae oils rich in omega-3 long chain polyunsaturated fatty acids as an alternative for fish oil. Food Chem. 2014, 160, 393–400. [Google Scholar] [CrossRef] [PubMed]
- Erben, U.; Loddenkemper, C.; Doerfel, K.; Spieckermann, S.; Haller, D.; Heimesaat, M.M.; Zeitz, M.; Siegmund, B.; Kühl, A.A. A guide to histomorphological evaluation of intestinal inflammation in mouse models. Int. J. Clin. Exp. Pathol. 2014, 7, 4557–4576. [Google Scholar] [PubMed]
- Adams, J.E., 3rd; Bodor, G.S.; Davila-Roman, V.G.; Delmez, J.A.; Apple, F.S.; Ladenson, J.H.; Jaffe, A.S. Cardiac troponin I. A marker with high specificity for cardiac injury. Circulation 1993, 88, 101–106. [Google Scholar] [CrossRef] [PubMed]
- Randers, E.; Kristensen, J.H.; Erlandsen, E.J.; Danielsen, H. Serum cystatin C as a marker of the renal function. Scand J. Clin. Lab. Investig. 1998, 58, 585–592. [Google Scholar] [CrossRef]
- Johnston, D.E. Special Considerations in Interpreting Liver Function Tests. Am. Fam. Phys. 1999, 59, 2223–2230. [Google Scholar]
- Frobert, A.; Valentin, J.; Magnin, J.-L.; Riedo, E.; Cook, S.; Giraud, M.-N. Prognostic Value of Troponin I for Infarct Size to Improve Preclinical Myocardial Infarction Small Animal Models. Front. Physiol. 2015, 6, 353. [Google Scholar] [CrossRef] [PubMed]
- Janczyk, P. Evaluation of Nutritional Value and Activity of Green Microalgae Chlorella vulgaris in Rats and Mice. Ph.D. Thesis, Freie Universität Berlin, Berlin, Germany, 9 December 2005. [Google Scholar]
- Skrede, A.; Mydland, L.; Ahlstrøm, O.; Reitan, K.; Gislerød, H.; Overland, M. Evaluation of microalgae as sources of digestible nutrients for monogastric animals. J. Anim. Feed Sci. 2011, 20, 131–142. [Google Scholar] [CrossRef] [Green Version]
- Sørensen, M.; Berge, G.M.; Reitan, K.I.; Ruyter, B. Microalga Phaeodactylum tricornutum in feed for Atlantic salmon (Salmo salar)-Effect on nutrient digestibility, growth and utilization of feed. Aquaculture 2016, 460, 116–123. [Google Scholar] [CrossRef]
- Guil-Guerrero, J.L.; Navarro-Juárez, R.; López-Martı́nez, J.C.; Campra-Madrid, P.; Rebolloso-Fuentes, M. Functional properties of the biomass of three microalgal species. J. Food Eng. 2004, 65, 511–517. [Google Scholar] [CrossRef]
- Nuño, K.; Villarruel-López, A.; Puebla-Pérez, A.M.; Romero-Velarde, E.; Puebla-Mora, A.G.; Ascencio, F. Effects of the marine microalgae Isochrysis galbana and Nannochloropsis oculata in diabetic rats. J. Funct. Foods 2013, 5, 106–115. [Google Scholar] [CrossRef]
- Kagan, M.L.; Matulka, R.A. Safety assessment of the microalgae Nannochloropsis oculata. Toxicol. Rep. 2015, 2, 617–623. [Google Scholar] [CrossRef] [PubMed]


| Diet | Suppl [%] | CP [%] | CL [%] | CF [%] | CA [%] | Ca [%] | P [%] | ME [MJ/kg] | Casein [%] | Maltodextrin [%] | Cellulose [%] | SFA [g/kg] | UFA [g/kg] | MUFA [g/kg] | PUFA [g/kg] | EPA [g/kg] | O3/O6 |
|---|---|---|---|---|---|---|---|---|---|---|---|---|---|---|---|---|---|
| CD | 20.2 | 8.0 | 7.9 | 4.8 | 0.93 | 0.71 | 15.6 | 22.93 | 14.5 | 7.89 | 9.33 | 11.18 | 7.58 | 3.60 | 0.00 | 0.08 | |
| NO | 5 | 20.2 | 8.0 | 7.1 | 5.7 | 0.93 | 0.71 | 15.6 | 20.74 | 14.35 | 6.39 | 9.83 | 48.01 | 13.36 | 34.65 | 1.28 | 0.14 |
| 15 | 20.2 | 8.0 | 5.4 | 7.7 | 0.93 | 0.71 | 15.6 | 16.38 | 14.15 | 3.3 | 8.68 | 43.23 | 11.89 | 31.34 | 4.16 | 0.31 | |
| 25 | 20.2 | 8.0 | 3.7 | 9.6 | 0.93 | 0.71 | 15.6 | 12.02 | 13.9 | 0.23 | 8.51 | 38.53 | 11.35 | 27.18 | 8.40 | 0.76 | |
| CVP | 5 | 20.2 | 8.0 | 7.9 | 4.9 | 0.93 | 0.71 | 15.6 | 19.94 | 13.88 | 7.2 | 10.04 | 22.72 | 10.10 | 12.62 | 0.00 | 0.11 |
| 15 | 20.2 | 8.0 | 7.8 | 5.1 | 0.93 | 0.71 | 15.6 | 13.97 | 12.75 | 5.74 | 10.18 | 48.18 | 11.81 | 36.37 | 0.00 | 0.17 | |
| 25 | 20.2 | 8.0 | 7.8 | 5.3 | 0.93 | 0.71 | 15.6 | 8.0 | 11.60 | 4.31 | 10.41 | 47.45 | 11.02 | 36.43 | 0.00 | 0.25 | |
| CVM | 5 | 20.2 | 8.0 | 7.8 | 5.0 | 0.93 | 0.71 | 15.6 | 19.85 | 14.15 | 7.1 | 10.10 | 49.73 | 13.16 | 36.57 | 0.00 | 0.12 |
| 15 | 20.2 | 8.0 | 7.4 | 5.3 | 0.93 | 0.71 | 15.6 | 13.71 | 13.6 | 5.34 | 9.65 | 46.16 | 11.88 | 34.28 | 0.00 | 0.16 | |
| 25 | 20.2 | 8.0 | 7.1 | 5.6 | 0.93 | 0.71 | 15.6 | 7.57 | 13.0 | 3.63 | 9.13 | 42.70 | 10.42 | 31.65 | 0.00 | 0.22 | |
| PT | 5 | 20.2 | 8.0 | 5.8 | 6.9 | 1.39 | 1.08 | 15.6 | 20.63 | 13.75 | 5.15 | 8.36 | 42.77 | 5.82 | 36.95 | 0.57 | 0.15 |
| 15 | 20.2 | 8.0 | 5.3 | 7.2 | 1.39 | 1.08 | 15.6 | 16.03 | 12.9 | 3.24 | 9.62 | 48.95 | 13.20 | 32.75 | 0.70 | 0.16 | |
| 25 | 20.2 | 8.0 | 4.8 | 7.5 | 1.39 | 1.09 | 15.6 | 11.43 | 12.05 | 1.27 | 9.61 | 47.87 | 13.98 | 33.88 | 2.07 | 0.17 |
| Diet | Suppl [%] | BW d 0 [g] † | BW d 14 [g] † | PC [g/day] † | Spleen w [mg/g BW] | Liver w [mg/g BW] † | Lung w [mg/g BW] † | Heart w [mg/g BW] † | Colon l [mm/g BW] † | Cecum l [mm/g BW] † |
|---|---|---|---|---|---|---|---|---|---|---|
| CD | 18.2 ± 1.4 | 18.4 ± 1.6 | 2.6 ± 0.2 | 3.4 ± 0.6 a,b | 47.6 ± 7.0 | 10.0 ± 2.7 | 6.5 ± 1.0 | 2.2 ± 0.5 | 0.65 ± 0.03 | |
| NO | 5 | 18.0 ± 1.7 | 19.2 ± 2.4 | 2.5 ± 0.4 | 4.1 ± 0.8 a | 41.5 ± 5.2 | 10.0 ± 1.7 | 6.1 ± 1.0 | 2.1 ± 0.5 | 0.45± 0.06 |
| 15 | 18.6 ± 1.7 | 20.2 ± 1.8 | 2.8 ± 0.2 | 4.1 ± 0.4 a | 44.1 ± 4.0 | 9.1 ± 1.6 | 6.3 ± 1.2 | 2.0 ± 0.3 | 0.53 ± 0.06 | |
| 25 | 18.1 ± 0.7 | 19.4 ± 0.7 | 2.7 ± 0.1 | 4.3 ± 0.4 a | 42.7 ± 4.4 | 10.2 ± 1.3 | 6.1 ± 0.5 | 2.2 ± 0.3 | 0.44 ± 0.04 | |
| CVP | 5 | 18.1 ± 1.4 | 19.0 ± 1.6 | 2.7 ± 0.3 | 3.3 ± 0.4 b | 48.8 ± 6.0 | 10.1 ± 2.6 | 6.0 ± 0.8 | 2.3 ± 0.5 | 0.58 ± 0.08 |
| 15 | 18.5 ± 1.2 | 20.0 ± 1.2 | 2.8 ± 0.4 | 4.1 ± 0.4 a,b | 47.3 ± 2.1 | 9.9 ± 2.4 | 6.2 ± 0.6 | 2.3 ± 0.5 | 0.48 ± 0.05 | |
| 25 | 18.6 ± 0.8 | 19.8 ± 1.1 | 2.8 ± 0.3 | 4.0 ± 0.6 a,b | 48.4 ± 4.8 | 9.8 ± 1.9 | 6.3 ± 1.1 | 1.9 ± 0.3 | 0.60 ± 0.06 | |
| CVM | 5 | 18.9 ± 1.3 | 19.8 ± 1.5 | 2.6 ± 0.6 | 4.4 ± 0.5 a | 46.7 ± 7.7 | 10.1 ± 2.6 | 5.9 ± 0.7 | 2.4 ± 0.3 | 0.58 ± 0.04 |
| 15 | 18.6 ± 0.9 | 19.1 ± 0.7 | 2.5 ± 0.3 | 3.7 ± 0.6 a,b | 43.5 ± 2.4 | 10.9 ± 2.2 | 6.3 ± 0.9 | 2.3 ± 0.6 | 0.54 ± 0.03 | |
| 25 | 18.4 ± 0.8 | 19.7 ± 0.8 | 2.8 ± 0.3 | 3.6 ± 0.6 a,b | 44.2 ± 3.4 | 9.2 ± 1.3 | 5.9 ± 0.6 | 2.3 ± 0.5 | 0.58 ± 0.08 | |
| PT | 5 | 18.3 ± 0.8 | 18.9 ± 1.0 | 2.6 ± 0.5 | 3.9 ± 0.4 a,b | 48.0 ± 7.4 | 9.7 ± 2.6 | 6.0 ± 0.8 | 2.1 ± 0.5 | 0.48 ± 0.02 |
| 15 | 18.9 ± 1.1 | 19.7 ± 1.1 | 2.6 ± 0.3 | 3.9 ± 0.5 a,b | 46.9 ± 3.3 | 11.4 ± 1.4 | 6.4 ± 0.8 | 2.0 ± 0.3 | 0.56 ± 0.03 | |
| 25 | 18.8 ± 1.1 | 19.9 ± 1.3 | 2.7 ± 0.5 | 4.3 ± 0.4 a | 49.0 ± 6.2 | 11.1 ± 2.8 | 6.5 ± 0.6 | 2.4 ± 0.4 | 0.57 ± 0.06 |
| Diet | Suppl [%] | ABV [%] | ADC [%] | NPU [%] | SFA [mg/g lt] | UFA [mg/g lt] | MUFA [mg/g lt] | PUFA [mg/g lt] |
|---|---|---|---|---|---|---|---|---|
| CD | 66.4 ± 4.8 a,b | 82.7 ± 2.5 a,b | 54.9 ± 4.3 a–c | 11.4 ± 1.2 a,b | 20.4 ± 2.4 b,c | 7.6 ± 1.1 b | 11.5 ± 1.0 a,b | |
| NO | 5 | 61.4 ± 3.6 a,b | 88.8 ± 0.9 a | 54.5 ± 3.2 a–c | ||||
| 15 | 58.7 ± 2.2 a | 87.6 ± 0.8 a | 51.5 ± 2.3 a–c | 10.9 ± 0.8 a,b | 18.3 ± 2.4 a–c | 5.4 ± 1.2 a,b | 13.0 ± 1.2 a,b | |
| 25 | 58.7 ± 5.2 a,b | 84.4 ± 0.3 a | 49.5 ± 4.4 a | 9.7 ± 0.5 a,b | 14.4 ± 1.1 a,b | 3.8 ± 0.6 a | 10.8 ± 0.6 a | |
| CVP | 5 | 76.4 ± 5.5 a,b | 87.3 ± 0.8 a | 66.8 ± 5.0 b,c | ||||
| 15 | 65.2 ± 2.9 a,b | 85.6 ± 0.6 a | 55.8 ± 2.4 a–c | 10.0 ± 0.5 a,b | 18.3 ± 1.5a-c | 6.0 ± 0.9 a,b | 12.2 ± 0.6 a,b | |
| 25 | 76.2 ± 5.4 a,b | 78.3 ± 3.1 a,b | 59.1 ± 3.8 a–c | 10.2 ± 0.6 a,b | 18.1 ± 1.4a-c | 5.7 ± 0.8 a,b | 12.4 ± 0.7 a,b | |
| CVM | 5 | 66.2 ± 2.6 a,b | 88.2 ± 0.2a | 58.3 ± 2.2 a–c | ||||
| 15 | 69.6 ± 2.8 a,b | 79.3 ± 3.2 a,b | 55.5 ± 3.8 a–c | 12.2 ± 0.7b | 24.2 ± 1.6c | 8.3 ± 1.0 b | 15.9 ± 0.7 b | |
| 25 | 60.0 ± 3.8 a,b | 76.4 ± 1.6 b | 45.9 ± 3.2a | 11.5 ± 0.4 a,b | 21.6 ± 1.2 a–c | 6.6 ± 0.9 a,b | 14.8 ± 0.4 b | |
| PT | 5 | 69.9 ± 3.2 a,b | 88.0 ± 1.2a | 61.3 ± 2.6 a–c | ||||
| 15 | 77.0 ± 2.5 b | 84.2 ± 2.9 a,b | 64.9 ± 3.0 c | 9.4 ± 0.3 a,b | 14.7 ± 0.4 b | 3.7 ± 0.3 a | 11.1 ± 0.3 a | |
| 25 | 69.5 ± 3.8 a,b | 69.5 ± 0.7 b | 55.2 ± 2.8 a–c | 9.1 ± 0.4 a | 13.2 ± 0.6 a | 3.4 ± 0.3 a | 9.9 ± 0.4 a |
| Diet | Suppl [%] | Liver Score † | Infil Duodenum † | Infil Jejunum † | Infil Ileum † | Infil Colon † | Cell Damage Colon † |
|---|---|---|---|---|---|---|---|
| CD | 0.03 ± 0.06 | 0.06 ± 0.09 | 0.08 ± 0.09 | 0.10 ± 0.15 | 0.03 ± 0.06 | 0.00 ± 0.00 | |
| NO | 25 | 0.03 ± 0.06 | 0.17 ± 0.14 | 0.08 ± 0.09 | 0.14 ± 0.13 | 0.11 ± 0.14 | 0.00 ± 0.00 |
| CVP | 25 | 0.00 ± 0.00 | 0.08 ± 0.10 | 0.13 ± 0.14 | 0.06 ± 0.09 | 0.08 ± 0.09 | 0.00 ± 0.00 |
| CVM | 25 | 0.00 ± 0.00 | 0.08 ± 0.10 | 0.13 ± 0.16 | 0.14 ± 0.13 | 0.03 ± 0.06 | 0.00 ± 0.00 |
| PT | 25 | 0.06 ± 0.09 | 0.08 ± 0.09 | 0.10 ± 0.15 | 0.08 ± 0.09 | 0.06 ± 0.09 | 0.00 ± 0.00 |
© 2018 by the authors. Licensee MDPI, Basel, Switzerland. This article is an open access article distributed under the terms and conditions of the Creative Commons Attribution (CC BY) license (http://creativecommons.org/licenses/by/4.0/).
Share and Cite
Neumann, U.; Derwenskus, F.; Gille, A.; Louis, S.; Schmid-Staiger, U.; Briviba, K.; Bischoff, S.C. Bioavailability and Safety of Nutrients from the Microalgae Chlorella vulgaris, Nannochloropsis oceanica and Phaeodactylum tricornutum in C57BL/6 Mice. Nutrients 2018, 10, 965. https://doi.org/10.3390/nu10080965
Neumann U, Derwenskus F, Gille A, Louis S, Schmid-Staiger U, Briviba K, Bischoff SC. Bioavailability and Safety of Nutrients from the Microalgae Chlorella vulgaris, Nannochloropsis oceanica and Phaeodactylum tricornutum in C57BL/6 Mice. Nutrients. 2018; 10(8):965. https://doi.org/10.3390/nu10080965
Chicago/Turabian StyleNeumann, Ulrike, Felix Derwenskus, Andrea Gille, Sandrine Louis, Ulrike Schmid-Staiger, Karlis Briviba, and Stephan C. Bischoff. 2018. "Bioavailability and Safety of Nutrients from the Microalgae Chlorella vulgaris, Nannochloropsis oceanica and Phaeodactylum tricornutum in C57BL/6 Mice" Nutrients 10, no. 8: 965. https://doi.org/10.3390/nu10080965