Omega-3 Fatty Acids Survey in Men under Active Surveillance for Prostate Cancer: from Intake to Prostate Tissue Level

 ,
,
Abstract
:1. Introduction
2. Materials and Methods
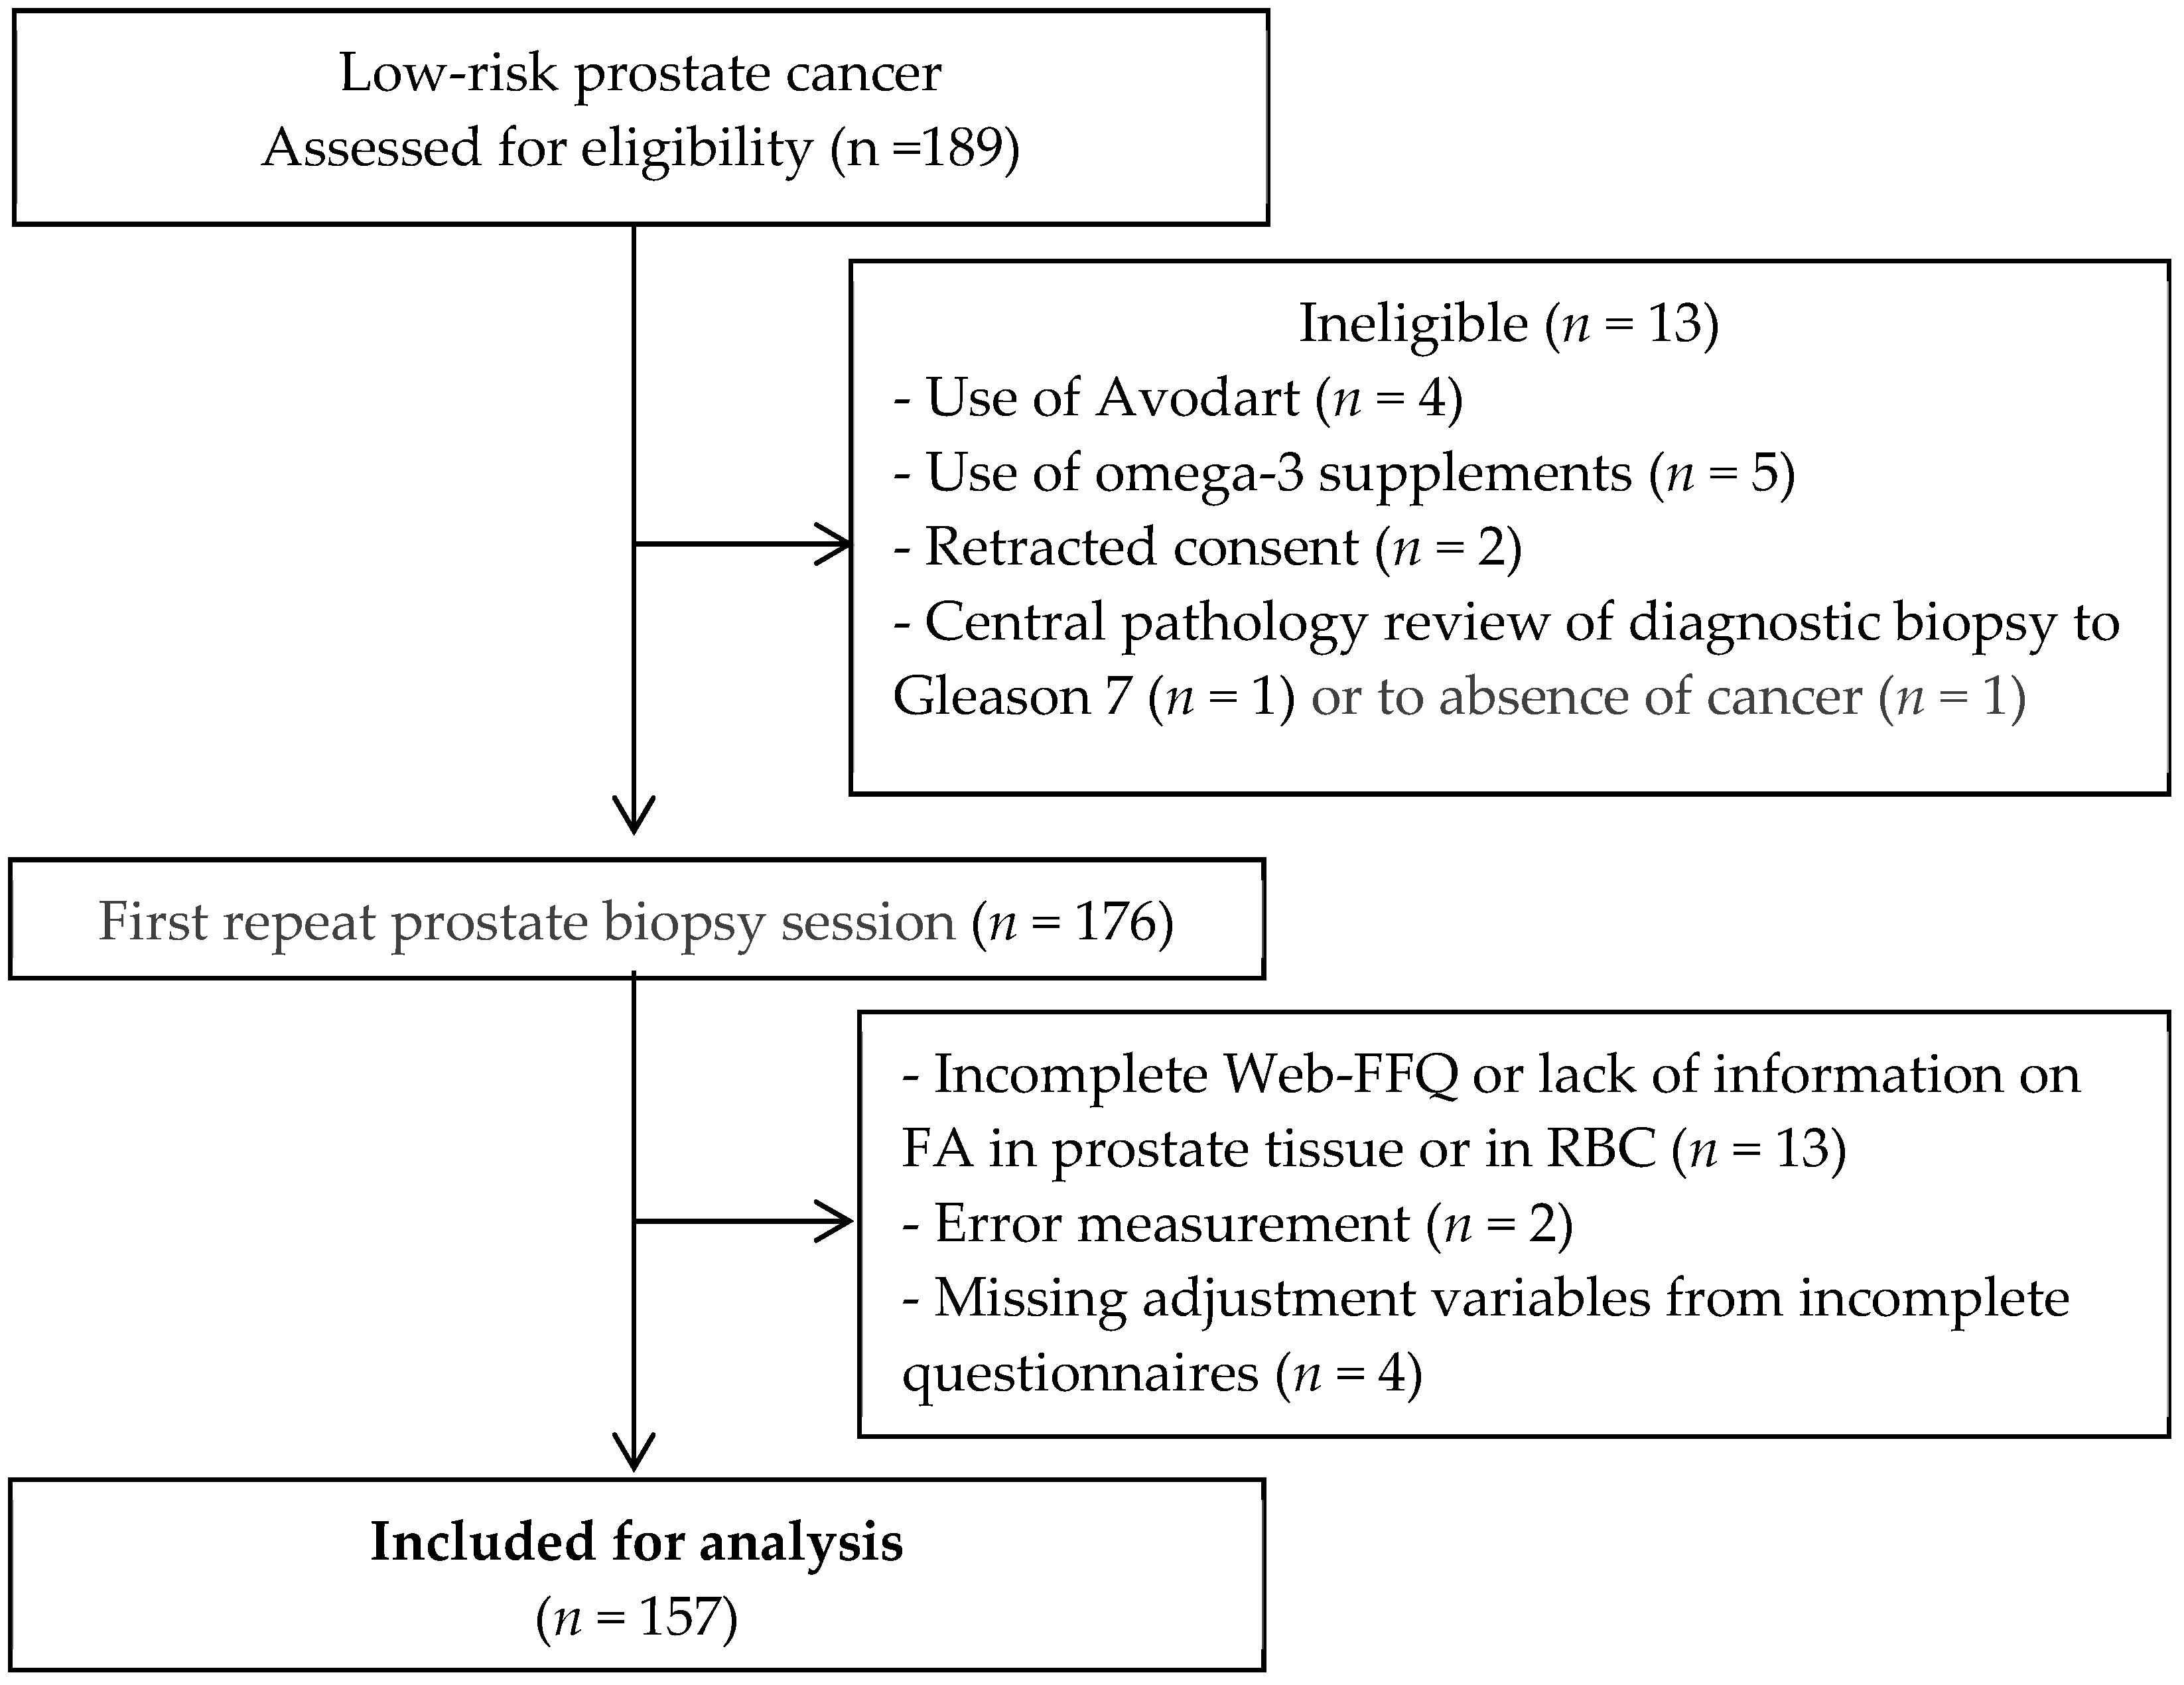
2.1. Study Population
2.2. Data Collection
2.2.1. PCa Grade
2.2.2. FA Profiles
2.3. Confounding Variables
2.4. Statistical Analysis
3. Results
4. Discussion
Supplementary Materials
Author Contributions
Funding
Acknowledgments
Conflicts of Interest
References
- Parkin, D.M.; Whelan, S.L.; Ferlay, J.; Teppo, L.; Thomas, D. Cancer Incidence in Five Continents, International Agency for Research on Cancer; IARC Scientific Publications: Lyon, France, 2003; Volume 155. [Google Scholar]
- Haenszel, W.; Kurihara, M. Studies of Japanese migrants. I. Mortality from cancer and other diseases among Japanese in the United States. J. Natl. Cancer Inst. 1968, 40, 43–68. [Google Scholar] [PubMed]
- Wilson, K.M.; Giovannucci, E.L.; Mucci, L.A. Lifestyle and dietary factors in the prevention of lethal prostate cancer. Asian J. Androl. 2012, 14, 365–374. [Google Scholar] [CrossRef] [PubMed] [Green Version]
- Maskarinec, G.; Noh, J.J. The effect of migration on cancer incidence among Japanese in Hawaii. Ethn. Dis. 2004, 14, 431–439. [Google Scholar] [PubMed]
- Carriere, G.M.; Tjepkema, M.; Pennock, J.; Goedhuis, N. Cancer patterns in Inuit Nunangat: 1998–2007. Int. J. Circumpolar Health 2012, 71, 18581. [Google Scholar] [CrossRef] [PubMed]
- Dewailly, E.; Mulvad, G.; Sloth Pedersen, H.; Hansen, J.C.; Behrendt, N.; Hart Hansen, J.P. Inuit are protected against prostate cancer. Cancer Epidemiol. Biomarkers Prev. 2003, 12, 926–927. [Google Scholar] [PubMed]
- Wendel, M.; Heller, A.R. Anticancer actions of omega-3 fatty acids--current state and future perspectives. Anticancer Agents Med. Chem. 2009, 9, 457–470. [Google Scholar] [CrossRef] [PubMed]
- Tamma, S.M.; Shorter, B.; Toh, K.L.; Moldwin, R.; Gordon, B. Influence of polyunsaturated fatty acids on urologic inflammation. Int. Urol. Nephrol. 2015, 47, 1753–1761. [Google Scholar] [CrossRef] [PubMed]
- Rose, D.P. Dietary fatty acids and prevention of hormone-responsive cancer. Proc. Soc. Exp. Biol. Med. 1997, 216, 224–233. [Google Scholar] [CrossRef]
- Aronson, W.J.; Kobayashi, N.; Barnard, R.J.; Henning, S.; Huang, M.; Jardack, P.M.; Liu, B.; Gray, A.; Wan, J.; Konijeti, R.; et al. Phase II prospective randomized trial of a low-fat diet with fish oil supplementation in men undergoing radical prostatectomy. Cancer Prev. Res. 2011, 4, 2062–2071. [Google Scholar] [CrossRef]
- Galet, C.; Gollapudi, K.; Stepanian, S.; Byrd, J.B.; Henning, S.M.; Grogan, T.; Elashoff, D.; Heber, D.; Said, J.; et al. Effect of a low-fat fish oil diet on proinflammatory eicosanoids and cell-cycle progression score in men undergoing radical prostatectomy. Cancer Prev. Res. 2014, 7, 97–104. [Google Scholar] [CrossRef]
- Terry, P.; Lichtenstein, P.; Feychting, M.; Ahlbom, A.; Wolk, A. Fatty fish consumption and risk of prostate cancer. Lancet 2001, 357, 1764–1766. [Google Scholar] [CrossRef]
- Augustsson, K.; Michaud, D.S.; Rimm, E.B.; Leitzmann, M.F.; Stampfer, M.J.; Willett, W.C.; Giovannucci, E. A prospective study of intake of fish and marine fatty acids and prostate cancer. Cancer Epidemiol. Biomarkers Prev. 2003, 12, 64–67. [Google Scholar] [PubMed]
- Leitzmann, M.F.; Stampfer, M.J.; Michaud, D.S.; Augustsson, K.; Colditz, G.C.; Willett, W.C.; Giovannucci, E.L. Dietary intake of n-3 and n-6 fatty acids and the risk of prostate cancer. Am. J. Clin. Nutr. 2004, 80, 204–216. [Google Scholar] [CrossRef] [PubMed]
- Williams, C.D.; Whitley, B.M.; Hoyo, C.; Grant, D.J.; Iraggi, J.D.; Newman, K.A.; Gerber, L.; Taylor, L.A.; McKeever, M.G.; Freedland, S.J. A high ratio of dietary n-6/n-3 polyunsaturated fatty acids is associated with increased risk of prostate cancer. Nutr. Res. 2011, 31, 1–8. [Google Scholar] [CrossRef] [PubMed]
- Norrish, A.E.; Skeaff, C.M.; Arribas, G.L.; Sharpe, S.J.; Jackson, R.T. Prostate cancer risk and consumption of fish oils: A dietary biomarker-based case-control study. Br. J. Cancer 1999, 81, 1238–1242. [Google Scholar] [CrossRef] [PubMed]
- Terry, P.D.; Rohan, T.E.; Wolk, A. Intakes of fish and marine fatty acids and the risks of cancers of the breast and prostate and of other hormone-related cancers: A review of the epidemiologic evidence. Am. J. Clin. Nutr. 2003, 77, 532–543. [Google Scholar] [CrossRef] [PubMed]
- Brasky, T.M.; Till, C.; White, E.; Neuhouser, M.L.; Song, X.; Goodman, P.; Thompson, I.M.; King, I.B.; Albanes, D.; Kristal, A.R. Serum phospholipid fatty acids and prostate cancer risk: Results from the prostate cancer prevention trial. Am. J. Epidemiol. 2011, 173, 1429–1439. [Google Scholar] [CrossRef] [PubMed]
- Sala-Vila, A.; Calder, P.C. Update on the relationship of fish intake with prostate, breast, and colorectal cancers. Crit. Rev. Food Sci. Nutr. 2011, 51, 855–871. [Google Scholar] [CrossRef] [PubMed]
- Shannon, J.; O’Malley, J.; Mori, M.; Garzotto, M.; Palma, A.J.; King, I.B. Erythrocyte fatty acids and prostate cancer risk: A comparison of methods. Prostaglandins Leukot. Essent. Fat. Acids 2010, 83, 161–169. [Google Scholar] [CrossRef] [PubMed] [Green Version]
- Park, S.Y.; Wilkens, L.R.; Henning, S.M.; Le Marchand, L.; Gao, K.; Goodman, M.T.; Murphy, S.P.; Henderson, B.E.; Kolonel, L.N. Circulating fatty acids and prostate cancer risk in a nested case-control study: The Multiethnic Cohort. Cancer Causes Control 2009, 20, 211–223. [Google Scholar] [CrossRef] [PubMed]
- Dahm, C.C.; Gorst-Rasmussen, A.; Crowe, F.L.; Roswall, N.; Tjønneland, A.; Drogan, D.; Boeing, H.; Teucher, B.; Kaaks, R.; Adarakis, G.; et al. Fatty acid patterns and risk of prostate cancer in a case-control study nested within the European Prospective Investigation into Cancer and Nutrition. Am. J. Clin. Nutr. 2012, 96, 1354–1361. [Google Scholar] [CrossRef] [PubMed] [Green Version]
- Chua, M.E.; Sio, M.C.; Sorongon, M.C.; Dy, J.S. Relationship of dietary intake of omega-3 and omega-6 Fatty acids with risk of prostate cancer development: A meta-analysis of prospective studies and review of literature. Prostate Cancer 2012, 2012, 826254. [Google Scholar] [CrossRef] [PubMed]
- Brasky, T.M.; Darke, A.K.; Song, X.; Tangen, C.M.; Goodman, P.J.; Thompson, I.M.; Meyskens, F.L., Jr.; Goodman, G.E.; Minasian, L.M.; Parnes, H.L.; et al. Plasma phospholipid fatty acids and prostate cancer risk in the SELECT trial. J. Natl. Cancer Inst. 2013, 105, 1132–1141. [Google Scholar] [CrossRef] [PubMed]
- Torfadottir, J.E.; Valdimarsdottir, U.A.; Mucci, L.A.; Kasperzyk, J.L.; Fall, K.; Tryggvadottir, L.; Aspelund, T.; Olafsson, O.; Harris, T.B.; Jonsson, E.; et al. Consumption of fish products across the lifespan and prostate cancer risk. PLoS ONE 2013, 8, e59799. [Google Scholar] [CrossRef] [PubMed]
- Pelser, C.; Mondul, A.M.; Hollenbeck, A.R.; Park, Y. Dietary fat, fatty acids, and risk of prostate cancer in the NIH-AARP diet and health study. Cancer Epidemiol. Biomarkers Prev. 2013, 22, 697–707. [Google Scholar] [CrossRef] [PubMed]
- Dougherty, R.M.; Galli, C.; Ferro-Luzzi, A.; Iacono, J.M. Lipid and phospholipid fatty acid composition of plasma, red blood cells, and platelets and how they are affected by dietary lipids: A study of normal subjects from Italy, Finland, and the USA. Am. J. Clin. Nutr. 1987, 45, 443–455. [Google Scholar] [CrossRef] [PubMed]
- Moreel, X.; Allaire, J.; Leger, C.; Caron, A.; Labonté, M.È.; Lamarche, B.; Julien, P.; Desmeules, P.; Têtu, B.; Fradet, V. Prostatic and dietary omega-3 fatty acids and prostate cancer progression during active surveillance. Cancer Prev. Res. 2014, 7, 766–776. [Google Scholar] [CrossRef] [PubMed]
- Epstein, J.I.; Zelefsky, M.J.; Sjoberg, D.D.; Nelson, J.B.; Egevad, L.; Magi-Galluzzi, C.; Vickers, A.J.; Parwani, A.V.; Reuter, V.E.; Fine, S.W.; et al. A Contemporary Prostate Cancer Grading System: A Validated Alternative to the Gleason Score. Eur. Urol. 2016, 69, 428–435. [Google Scholar] [CrossRef] [PubMed]
- Epstein, J.I.; Egevad, L.; Amin, M.B.; Delahunt, B.; Srigley, J.R.; Humphrey, P.A. The 2014 International Society of Urological Pathology (ISUP) Consensus Conference on Gleason Grading of Prostatic Carcinoma: Definition of Grading Patterns and Proposal for a New Grading System. Am. J. Surg. Pathol. 2016, 40, 244–252. [Google Scholar] [CrossRef] [PubMed]
- Shaikh, N.A.; Downar, E. Time course of changes in porcine myocardial phospholipid levels during ischemia. A reassessment of the lysolipid hypothesis. Circ. Res. 1981, 49, 316–325. [Google Scholar] [CrossRef] [PubMed]
- Da Silva, M.S.; Julien, P.; Bilodeau, J.F.; Barbier, O.; Rudkowska, I. Trans Fatty Acids Suppress TNF-alpha-Induced Inflammatory Gene Expression in Endothelial (HUVEC) and Hepatocellular Carcinoma (HepG2) Cells. Lipids 2017, 52, 315–325. [Google Scholar] [CrossRef]
- Labonte, M.E.; Cyr, A.; Baril-Gravel, L.; Royer, M.M.; Lamarche, B. Validity and reproducibility of a web-based, self-administered food frequency questionnaire. Eur. J. Clin. Nutr. 2012, 66, 166–173. [Google Scholar] [CrossRef] [PubMed]
- Allaire, J.; Moreel, X.; Labonte, M.E.; Leger, C.; Caron, A.; Julien, P.; Lamarche, B.; Fradet, V. Validation of the omega-3 fatty acid intake measured by a web-based food frequency questionnaire against omega-3 fatty acids in red blood cells in men with prostate cancer. Eur. J. Clin. Nutr. 2015, 69, 1004–1008. [Google Scholar] [CrossRef] [PubMed]
- Godin, G. The Godin-Shephard leisure-time physical activity questionnaire. Health Fit. J. Can. 2011, 4, 18–22. [Google Scholar]
- Amireault, S.; Godin, G. The Godin-Shephard leisure-time physical activity questionnaire: Validity evidence supporting its use for classifying healthy adults into active and insufficiently active categories. Percept. Mot. Skills 2015, 120, 604–622. [Google Scholar] [CrossRef] [PubMed]
- Koelwyn, G.J.; Wennerberg, E.; Demaria, S.; Jones, L.W. Exercise in Regulation of Inflammation-Immune Axis Function in Cancer Initiation and Progression. Oncology (Williston Park) 2015, 29, 908–920, 922. [Google Scholar] [PubMed]
- Ouellet, V.; Weisnagel, S.J.; Marois, J.; Bergeron, J.; Julien, P.; Gougeon, R.; Tchernof, A.; Holub, B.J.; Jacques, H. Dietary cod protein reduces plasma C-reactive protein in insulin-resistant men and women. J. Nutr. 2008, 138, 2386–2391. [Google Scholar] [CrossRef] [PubMed]
- Ouellet, V.; Marois, J.; Weisnagel, S.J.; Jacques, H. Dietary cod protein improves insulin sensitivity in insulin-resistant men and women: A randomized controlled trial. Diabetes Care 2007, 30, 2816–2821. [Google Scholar] [CrossRef] [PubMed]
- Kelavkar, U.P.; Hutzley, J.; Dhir, R.; Kim, P.; Allen, K.G.; McHugh, K. Prostate tumor growth and recurrence can be modulated by the omega-6:omega-3 ratio in diet: Athymic mouse xenograft model simulating radical prostatectomy. Neoplasia 2006, 8, 112–124. [Google Scholar] [CrossRef]
- Akinsete, J.A.; Ion, G.; Witte, T.R.; Hardman, W.E. Consumption of high omega-3 fatty acid diet suppressed prostate tumorigenesis in C3(1) Tag mice. Carcinogenesis 2012, 33, 140–148. [Google Scholar] [CrossRef]
- Lloyd, J.C.; Masko, E.M.; Wu, C.; Keenan, M.M.; Pilla, D.M.; Aronson, W.J.; Chi, J.T.; Freedland, S.J. Fish oil slows prostate cancer xenograft growth relative to other dietary fats and is associated with decreased mitochondrial and insulin pathway gene expression. Prostate Cancer Prostatic Dis. 2013, 16, 285–291. [Google Scholar] [CrossRef] [PubMed] [Green Version]
- Gevariya, N.; Besancon, M.; Robitaille, K.; Picard, V.; Diabaté, L.; Alesawi, A.; Julien, P.; Fradet, Y.; Bergeron, A.; Fradet, V. Omega-3 fatty acids decrease prostate cancer progression associated with an anti-tumor immune response in eugonadal and castrated mice. Prostate 2019, 79, 9–20. [Google Scholar] [CrossRef] [PubMed]
- Liang, P.; Henning, S.M.; Schokrpur, S.; Wu, L.; Doan, N.; Said, J.; Grogan, T.; Elashoff, D.; Cohen, P.; Aronson, W.J. Effect of Dietary Omega-3 Fatty Acids on Tumor-Associated Macrophages and Prostate Cancer Progression. Prostate 2016, 76, 1293–1302. [Google Scholar] [CrossRef] [PubMed] [Green Version]
- Demark-Wahnefried, W.; Polascik, T.J.; George, S.L.; Switzer, B.R.; Madden, J.F.; Ruffin, M.T.; Snyder, D.C.; Owzar, K.; Hars, V.; Albala, D.M.; et al. Flaxseed supplementation (not dietary fat restriction) reduces prostate cancer proliferation rates in men presurgery. Cancer Epidemiol. Biomarkers Prev. 2008, 17, 3577–3587. [Google Scholar] [CrossRef] [PubMed]
- Freeman, V.L.; Meydani, M.; Hur, K.; Flanigan, R.C. Inverse association between prostatic polyunsaturated fatty acid and risk of locally advanced prostate carcinoma. Cancer 2004, 101, 2744–2754. [Google Scholar] [CrossRef] [PubMed]
- Tayari, N.; Heerschap, A.; Scheenen, T.W.J.; Kobus, T. In vivo MR spectroscopic imaging of the prostate, from application to interpretation. Anal. Biochem. 2017, 529, 158–170. [Google Scholar] [CrossRef] [PubMed]
- Kobus, T.; Vos, P.C.; Hambrock, T.; De Rooij, M.; Hulsbergen—Van de Kaa, C.A.; Barentsz, J.O.; Heerschap, A.; Scheenen, T.W. Prostate cancer aggressiveness: In vivo assessment of MR spectroscopy and diffusion-weighted imaging at 3 T. Radiology 2012, 265, 457–467. [Google Scholar] [CrossRef] [PubMed]
- Bellomo, G.; Marcocci, F.; Bianchini, D.; Mezzenga, E.; D’Errico, V.; Menghi, E.; Zannoli, R.; Sarnelli, A. MR Spectroscopy in Prostate Cancer: New Algorithms to Optimize Metabolite Quantification. PLoS ONE 2016, 11, e0165730. [Google Scholar] [CrossRef] [PubMed]
- Sciarra, A.; Panebianco, V.; Ciccariello, M.; Alfarone, A.; Gentilucci, A.; Parente, U.; Passariello, R.; Gentile, V. Magnetic resonance spectroscopic imaging (1H-MRSI) and dynamic contrast-enhanced magnetic resonance (DCE-MRI): Pattern changes from inflammation to prostate cancer. Cancer Investig. 2010, 28, 424–432. [Google Scholar] [CrossRef]
- Kurhanewicz, J.; Vigneron, D.B. Advances in MR spectroscopy of the prostate. Magn. Reson. Imaging Clin. N. Am. 2008, 16, 697–710. [Google Scholar] [CrossRef]
- De Marzo, A.M.; Platz, E.A.; Sutcliffe, S.; Xu, J.; Grönberg, H.; Drake, C.G.; Nakai, Y.; Isaacs, W.B.; Nelson, W.G. Inflammation in prostate carcinogenesis. Nat. Rev. Cancer 2007, 7, 256–269. [Google Scholar] [CrossRef] [PubMed] [Green Version]
- Sfanos, K.S.; De Marzo, A.M. Prostate cancer and inflammation: The evidence. Histopathology 2012, 60, 199–215. [Google Scholar] [CrossRef] [PubMed]
- Ratnayake, W.M.; Galli, C. Fat and fatty acid terminology, methods of analysis and fat digestion and metabolism: A background review paper. Ann. Nutr. Metab. 2009, 55, 8–43. [Google Scholar] [CrossRef] [PubMed]
- Davidson, J.; Rotondo, D.; Rizzo, M.T.; Leaver, H.A. Therapeutic implications of disorders of cell death signalling: Membranes, micro-environment, and eicosanoid and docosanoid metabolism. Br. J. Pharmacol. 2012, 166, 1193–1210. [Google Scholar] [CrossRef]
- Nash, S.H.; Schenk, J.M.; Kristal, A.R.; Goodman, P.J.; Lucia, M.S.; Parnes, H.L.; Thompson, I.M.; Lippman, S.M.; Song, X.; Gurel, B.; et al. Association between Serum Phospholipid Fatty Acids and Intraprostatic Inflammation in the Placebo Arm of the Prostate Cancer Prevention Trial. Cancer Prev. Res. 2015, 8, 590–596. [Google Scholar] [CrossRef] [Green Version]
- Lindberg, J.; Klevebring, D.; Liu, W.; Neiman, M.; Xu, J.; Wiklund, P.; Wiklund, F.; Mills, I.G.; Egevad, L.; Grönberg, H. Exome sequencing of prostate cancer supports the hypothesis of independent tumour origins. Eur. Urol. 2013, 63, 347–353. [Google Scholar] [CrossRef]
- VanderWeele, D.J.; Brown, C.D.; Taxy, J.B.; Gillard, M.; Hatcher, D.M.; Tom, W.R.; Stadler, W.M.; White, K.P. Low-grade prostate cancer diverges early from high grade and metastatic disease. Cancer Sci. 2014, 105, 1079–1085. [Google Scholar] [CrossRef]

| Variables | Total (n = 157) | Low-Grade (n = 118) | High-Grade (n = 39) | p-Value * |
|---|---|---|---|---|
| Age (y) | 0.84 | |||
| Mean ± SD | 61.3 ± 7.4 | 61.3 ± 7.2 | 61.2 ± 8.2 | |
| Median (Q1–Q3) | 62.0 (56.0–67.0) | 62.0 (56.0–67.0) | 62.0 (56.0–67.0) | |
| PSA (ng/mL) | 0.26 | |||
| Mean ± SD | 5.0 ± 2.7 | 5.04 ± 2.9 | 5.05 ± 2.05 | |
| Median (Q1–Q3) | 4.7 (3.3–6.0) | 4.6 (3.0–6.2) | 4.8 (4.0–5.9) | |
| Waist Circumference (cm) | 0.42 | |||
| Mean ± SD | 90.0 ± 10.2 | 95.2 ± 9.3 | 98.5 ± 12.5 | |
| Median (Q1–Q3) | 96.0 (89.0–102.0) | 95.0 (88.0–101.0) | 96.0 (89.0–105.0) | |
| BMI Kg/m2, n (%) | 0.26 | |||
| <25 | 44 (28.39) | 35 (29.66) | 9 (24.32) | |
| 25–30 | 76 (49.03) | 60 (50.85) | 16 (43.24) | |
| >30 | 35 (22.58) | 23 (19.49) | 12 (32.43) | |
| Education level attained, n (%) | 0.34 | |||
| Secondary school or less | 46 (29.30) | 31 (26.27) | 15 (38.46) | |
| Postsecondary diploma | 44 (28.03) | 34 (28.81) | 10 (25.64) | |
| University degree | 67 (42.68) | 53 (44.92) | 14 (35.90) | |
| Smoking status, n (%) | 0.91 | |||
| Current smoker | 10 (6.37) | 7 (5.93) | 3 (7.69) | |
| Former smoker | 88 (56.05) | 66 (55.93) | 22 (56.41) | |
| Never | 59 (37.58) | 45 (38.14) | 14 (35.90) | |
| Physical activity score, n (%) | 0.33 | |||
| Active | 94 (59.87) | 74 (62.71) | 20 (51.28) | |
| Moderately active | 13 (8.28) | 8 (6.78) | 5 (12.82) | |
| Inactive | 50 (31.85) | 36 (30.51) | 14 (35.90) |
| Method | Variables | Total n = 157 | Low-Grade n = 118 | High-Grade n = 39 | p-Value § |
|---|---|---|---|---|---|
| Web-FFQ * | Energy (kcal) | 0.23 | |||
| Mean ± SD | 2496 ± 759 | 2468 ± 755 | 2583 ± 775 | ||
| Median (Q1–Q3) | 2449 (1901–2952) | 2416 (1871–2869) | 2604 (1991–2975) | ||
| Alcohol (g) | 0.42 | ||||
| Mean ± SD | 16.80 ± 16.92 | 15.77 ± 15.67 | 19.93 ± 20.16 | ||
| Median (Q1–Q3) | 12.73 (4.70–21.15) | 11.32 (4.70–21.49) | 14.94 (4.68–20.30) | ||
| Total fat (g) | 0.08 | ||||
| Mean ± SD | 94.17 ± 35.33 | 91.89 ± 35.69 | 101.05 ± 33.77 | ||
| Median (Q1–Q3) | 89.87 (69.68–113.81) | 87.51 (68.86–107.90) | 97.99 (74.64–121.04) | ||
| Total ω3 | 0.38 | ||||
| Mean ± SD | 2.17 ± 0.90 | 2.16 ± 0.96 | 2.20 ± 0.70 | ||
| Median (Q1–Q3) | 2.00 (1.64–2.53) | 1.96 (1.61–2.52) | 2.07 (1.64–2.79) | ||
| ALA | 0.09 | ||||
| Mean ± SD | 1.76 ± 0.73 | 1.72 ± 0.75 | 1.87 ± 0.67 | ||
| Median (Q1–Q3) | 1.64 (1.30–2.12) | 1.58 (1.28–2.02) | 1.84 (1.35–2.23) | ||
| LCω3 | 0.09 | ||||
| Mean ± SD | 0.41 ± 0.35 | 0.44 ± 0.38 | 0.32 ± 0.26 | ||
| Median (Q1–Q3) | 0.32 (0.17–0.57) | 0.35 (0.19–0.62) | 0.22 (0.16–0.44) | ||
| EPA | 0.15 | ||||
| Mean ± SD | 0.15 ± 0.15 | 0.16 ± 0.16 | 0.11 ± 0.11 | ||
| Median (Q1–Q3) | 0.11 (0.05–0.19) | 0.12 (0.05–0.20) | 0.08 (0.05–0.16) | ||
| DHA | 0.08 | ||||
| Mean ± SD | 0.22 ± 0.19 | 0.24 ± 0.20 | 0.18 ± 0.14 | ||
| Median (Q1–Q3) | 0.17 (0.09–0.29) | 0.19 (0.11–0.33) | 0.12 (0.09–0.25) | ||
| DPA | 0.17 | ||||
| Mean ± SD | 0.04 ± 0.04 | 0.04 ± 0.04 | 0.03 ± 0.03 | ||
| Median (Q1–Q3) | 0.03 (0.02–0.06) | 0.03 (0.02–0.06) | 0.03 (0.02–0.04) | ||
| Total ω6 | 0.03 | ||||
| Mean ± SD | 14.91 ± 6.37 | 14.23 ± 6.10 | 16.96 ± 6.80 | ||
| Median (Q1–Q3) | 13.47 (10.36–18.64) | 13.25 (10.18–17.05) | 17.28 (10.62–22.00) | ||
| ω3/ω6 ratio | 0.05 | ||||
| Mean ± SD | 0.15 ± 0.05 | 0.16 ± 0.05 | 0.14 ± 0.04 | ||
| Median (Q1–Q3) | 0.15 (0.12–0.18) | 0.16 (0.12–0.18) | 0.14 (0.11–0.16) | ||
| LCω3/ω6 ratio | 0.02 | ||||
| Mean ± SD | 0.03 ± 0.03 | 0.03 ± 0.03 | 0.02 ± 0.01 | ||
| Median (Q1–Q3) | 0.02 (0.01–0.04) | 0.03 (0.01–0.04) | 0.02 (0.01–0.03) | ||
| RBC † | Total ω3 | 0.43 | |||
| Mean ± SD | 7.98 ± 1.42 | 8.04 ± 1.47 | 7.80 ± 1.26 | ||
| Median (Q1–Q3) | 7.75 (6.99–8.80) | 7.76 (7.06–8.80) | 7.75 (6.91–8.82) | ||
| ALA | 0.30 | ||||
| Mean ± SD | 0.12 ± 0.08 | 0.12 ± 0.08 | 0.10 ± 0.07 | ||
| Median (Q1–Q3) | 0.14 (0.00–0.17) | 0.14 (0.00–0.17) | 0.14 (0.00–0.16) | ||
| LCω3 | 0.52 | ||||
| Mean ± SD | 7.79 ± 1.42 | 7.86 ± 1.50 | 7.60 ± 1.13 | ||
| Median (Q1–Q3) | 7.57 (6.80–8.58) | 7.57 (6.93–8.63) | 7.35 (6.71–8.54) | ||
| EPA | 0.19 | ||||
| Mean ± SD | 0.86 ± 0.43 | 0.88 ± 0.46 | 0.77 ± 0.27 | ||
| Median (Q1–Q3) | 0.79 (0.60–0.98) | 0.81 (0.60–0.99) | 0.72 (0.61–0.89) | ||
| DHA | 0.70 | ||||
| Mean ± SD | 4.22 ± 0.93 | 4.24 ± 0.98 | 4.13 ± 0.79 | ||
| Median (Q1–Q3) | 4.07 (3.59–4.75) | 4.10 (3.59–4.89) | 4.05 (3.50–4.67) | ||
| DPA | 0.76 | ||||
| Mean ± SD | 2.72 ± 0.38 | 2.73 ± 0.39 | 2.69 ± 0.33 | ||
| Median (Q1–Q3) | 2.65 (2.46–2.91) | 2.66 (2.43–2.91) | 2.64 (2.52–2.85) | ||
| Total ω6 | 0.21 | ||||
| Mean ± SD | 28.52 ± 1.67 | 28.40 ± 1.79 | 28.90 ± 1.18 | ||
| Median (Q1–Q3) | 28.76 (27.75–29.65) | 28.66 (27.48–29.55) | 28.82 (28.16–29.86) | ||
| ω3/ω6 ratio | 0.30 | ||||
| Mean ± SD | 0.28 ± 0.07 | 0.29 ± 0.07 | 0.27 ± 0.05 | ||
| Median (Q1–Q3) | 0.27 (0.24–0.31) | 0.27 (0.24–0.31) | 0.26 (0.23–0.31) | ||
| LCω3/ω6 ratio | 0.36 | ||||
| Mean ± SD | 0.27 ± 0.07 | 0.28 ± 0.07 | 0.26 ± 0.05 | ||
| Median (Q1–Q3) | 0.26 (0.23–0.31) | 0.26 (0.24–0.31) | 0.25 (0.22–0.31) | ||
| Prostate tissue ‡ | Total ω3 | 0.05 | |||
| Mean ± SD | 3.52 ± 1.01 | 3.62 ± 1.05 | 3.23 ± 0.81 | ||
| Median (Q1–Q3) | 3.36 (2.75–4.13) | 3.52 (2.76–4.20) | 3.08 (2.57–3.84) | ||
| ALA | 0.40 | ||||
| Mean ± SD | 0.45 ± 0.33 | 0.44 ± 0.33 | 0.48 ± 0.33 | ||
| Median (Q1–Q3) | 0.46 (0.17–0.69) | 0.43 (0.17–0.65) | 0.57 (0.16–0.73) | ||
| LCω3 | 0.13 | ||||
| Mean ± SD | 2.75 ± 1.13 | 2.84 ± 1.17 | 2.50 ± 0.98 | ||
| Median (Q1–Q3) | 2.70 (1.90–3.40) | 2.76 (1.96–3.50) | 2.29 (1.82–3.22) | ||
| EPA | 0.01 | ||||
| Mean ± SD | 0.14 ± 0.15 | 0.16 ± 0.16 | 0.09 ± 0.08 | ||
| Median (Q1–Q3) | 0.13 (0.00–0.20) | 0.14 (0.05–0.21) | 0.10 (0.00–0.15) | ||
| DHA | 0.20 | ||||
| Mean ± SD | 1.76 ± 0.80 | 1.81 ± 0.81 | 1.61 ± 0.75 | ||
| Median (Q1–Q3) | 1.75 (1.10–2.35) | 1.83 (1.10–2.39) | 1.44(1.03–2.21) | ||
| DPA | 0.20 | ||||
| Mean ± SD | 0.85 ± 0.31 | 0.87 ± 0.32 | 0.80 ± 0.28 | ||
| Median (Q1–Q3) | 0.82 (0.60–0.98) | 0.83 (0.61–0.98) | 0.72 (0.60–1.00) | ||
| Total ω6 | 0.95 | ||||
| Mean ± SD | 21.97 ± 3.74 | 21.98 ± 3.70 | 21.97 ± 3.89 | ||
| Median (Q1–Q3) | 22.10 (19.19–24.25) | 22.32 (19.19–24.15) | 21.69 (18.89–25.96) | ||
| ω3/ω6 ratio | <0.01 | ||||
| Mean ± SD | 0.16 ± 0.04 | 0.17 ± 0.04 | 0.15 ± 0.02 | ||
| Median (Q1–Q3) | 0.16 (0.14–0.17) | 0.16 (0.14–0.18) | 0.14 (0.13–0.16) | ||
| LCω3/ω6 ratio | 0.04 | ||||
| Mean ± SD | 0.12 ± 0.04 | 0.13 ± 0.04 | 0.11 ± 0.03 | ||
| Median (Q1–Q3) | 0.12 (0.10–0.14) | 0.12 (0.10–0.14) | 0.11 (0.09–0.13) |
| Fatty Acids (%) * | Fatty Acids (mg/g) † | ||||||
|---|---|---|---|---|---|---|---|
| Fatty Acid | Tertile | n High-Grade/ n Low-Grade | Multivariable Models ‡ OR (95% CI) p-Value § | n High-Grade/ n Low-Grade | Multivariable Models ‡ OR (95% CI) p-Value § | ||
| ω3 total | 1 | 15/38 | 1 | 16/39 | 1 | ||
| 2 | 16/37 | 1.24 (0.50–3.07) | 0.64 | 10/40 | 0.68 (0.26–1.81) | 0.44 | |
| 3 | 8/43 | 0.49 (0.18–1.36) | 0.17 | 13/39 | 0.79 (0.31–2.02) | 0.63 | |
| p–trend || | 0.15 | 0.68 | |||||
| ALA | 1 | 14/37 | 1 | 13/40 | 1 | ||
| 2 | 8/46 | 0.39 (0.14–1.12) | 0.08 | 11/41 | 0.92 (0.35–2.41) | 0.86 | |
| 3 | 17/35 | 1.35 (0.54–3.42) | 0.51 | 15/37 | 1.21 (0.48–3.07) | 0.68 | |
| p-trend || | 0.68 | 0.65 | |||||
| LCω3 | 1 | 17/37 | 1 | 14/37 | 1 | ||
| 2 | 11/40 | 0.68 (0.26–1.78) | 0.44 | 16/39 | 1.03 (0.41–2.57) | 0.95 | |
| 3 | 11/41 | 0.59 (0.23–1.51) | 0.27 | 9/42 | 0.59 (0.21–1.65) | 0.31 | |
| p-trend || | 0.27 | 0.28 | |||||
| EPA | 1 | 16/37 | 1 | 15/31 | 1 | ||
| 2 | 18/36 | 1.35 (0.55–3.31) | 0.50 | 14/28 | 1.02 (0.39–2.69) | 0.95 | |
| 3 | 5/45 | 0.25 (0.08–0.79) | 0.02 | 10/59 | 0.35 (0.13–0.92) | 0.03 | |
| p-trend || | 0.03 | 0.03 | |||||
| DHA | 1 | 16/37 | 1 | 13/39 | 1 | ||
| 2 | 11/41 | 0.78 (0.29–2.08) | 0.62 | 16/38 | 1.43 (0.57–3.62) | 0.45 | |
| 3 | 12/40 | 0.74 (0.29–1.90) | 0.54 | 10/41 | 0.74 (0.27–2.10) | 0.58 | |
| p-trend || | 0.54 | 0.55 | |||||
| DPA | 1 | 16/36 | 1 | 17/34 | 1 | ||
| 2 | 12/40 | 0.73 (0.29–1.86) | 0.24 | 11/40 | 0.57 (0.22–1.48) | 0.25 | |
| 3 | 11/42 | 0.59 (0.23–1.53) | 0.28 | 11/44 | 0.50 (0.19–1.27) | 0.14 | |
| p-trend || | 0.28 | 0.17 | |||||
| ω6 total | 1 | 13/40 | 1 | 16/37 | 1 | ||
| 2 | 12/38 | 1.35 (0.49–3.74) | 0.55 | 6/46 | 0.32 (0.11–0.96) | 0.04 | |
| 3 | 14/40 | 1.28 (0.48–3.40) | 0.62 | 17/35 | 1.14 (0.47–2.77) | 0.77 | |
| p-trend || | 0.64 | 0.54 | |||||
| Ratio | 1 | 19/34 | 1 | 19/34 | 1 | ||
| ω3/ω6 | 2 | 14/39 | 0.55 (0.22–1.34) | 0.19 | 13/40 | 0.50 (0.20–1.24) | 0.13 |
| 3 | 6/45 | 0.20 (0.07–0.59) | <0.01 | 7/44 | 0.24 (0.09–0.68) | <0.01 | |
| p-trend || | <0.01 | <0.01 | |||||
| Ratio | 1 | 17/36 | 1 | 17/36 | 1 | ||
| LCω3/ω6 | 2 | 13/39 | 0.73 (0.29–1.86) | 0.51 | 13/39 | 0.79 (0.31–2.00) | 0.62 |
| 3 | 9/43 | 0.38 (0.14–1.00) | 0.05 | 9/43 | 0.42 (0.16–1.10) | 0.07 | |
| p-trend || | 0.05 | 0.07 | |||||
| EPA Level * | n | Frequency, n (%) | p-Trend † | Adjusted p-Trend ‡ | |
|---|---|---|---|---|---|
| Low-Grade | High-Grade | ||||
| 0 | 44 | 29 (66%) | 15 (34%) | <0.01 | 0.01 |
| 0–0.2 | 73 | 52 (71%) | 21 (29%) | ||
| 0.2–0.4 | 33 | 30 (91%) | 3 (9%) | ||
| ≥0.4 | 7 | 7 (100%) | 0 (0%) | ||
| Fatty Acid Ratio | Fatty Acid Ratio | Enzymatic Activity | mean ± SD | p-Value * | |
|---|---|---|---|---|---|
| High-Grade | Low-Grade | ||||
| 20:3n6/18:3n6 | DGLA/GLA | Elovl5 elongase | 14.07 ± 6.06 | 15.27 ± 5.14 | 0.42 |
| 22:4n6/20:4n6 | Adrenic/AA | Elovl2 elongase | 0.16 ± 0.03 | 0.15 ± 0.04 | 0.13 |
| 20:4n3/18:4n3 | ETA/Stearidonic | Elovl5 elongase | 0.61 ± 0.35 | 0.76 ± 0.50 | 0.77 |
| 22:5n3/20:5n3 | DPA/EPA | Elovl2 elongase | 6.00 ± 1.68 | 5.32 ± 2.14 | 0.01 |
| 18:1n9/18:0 | Oleic/Stearic | ∆9-desaturase | 3.22 ± 1.96 | 2.90 ± 1.86 | 0.42 |
| 18:3n6/18:2n6 | GLA/LA | ∆6-desaturase | 0.01 ± 0.01 | 0.01 ± 0.01 | 0.50 |
| 18:4n3/18:3n3 | Stearidonic/ALA | ∆6-desaturase | 0.82 ± 0.81 | 0.84 ± 0.88 | 0.58 |
| 20:4n6/20:3n6 | AA/DGLA | ∆5-desaturase | 9.80 ± 21.21 | 4.86 ± 1.17 | 0.36 |
| 20:5n3/20:4n3 | EPA/ETA | ∆5-desaturase | 1.32 ± 0.73 | 1.72 ± 1.07 | 0.02 |
| Fatty Acid | Tertile | n High-Grade/ n Low-Grade | Multivariable Models * | ||
|---|---|---|---|---|---|
| OR (95% CI) | p-Value † | p-Trend ‡ | |||
| ω3 total | 1 | 17/36 | 1 | 0.24 | |
| 2 | 11/42 | 0.52 (0.20–1.31) | 0.16 | ||
| 3 | 11/40 | 0.58 (0.23–1.48) | 0.25 | ||
| ALA | 1 | 14/37 | 1 | 0.68 | |
| 2 | 17/43 | 1.23 (0.50–3.00) | 0.65 | ||
| 3 | 8/38 | 0.60 (0.23–1.83) | 0.42 | ||
| LCω3 | 1 | 15/37 | 1 | 0.43 | |
| 2 | 13/41 | 0.70 (0.27–1.76) | 0.44 | ||
| 3 | 11/40 | 0.68 (0.26–1.76) | 0.42 | ||
| EPA | 1 | 12/39 | 1 | 0.33 | |
| 2 | 18/37 | 1.46 (0.58–3.65) | 0.42 | ||
| 3 | 9/42 | 0.61 (0.21–1.73) | 0.35 | ||
| DHA | 1 | 13/40 | 1 | 0.50 | |
| 2 | 16/37 | 1.11 (0.44–2.81) | 0.82 | ||
| 3 | 10/41 | 0.73 (0.27–1.99) | 0.54 | ||
| DPA | 1 | 10/43 | 1 | 0.93 | |
| 2 | 19/33 | 2.85 (1.06–7.70) | 0.04 | ||
| 3 | 10/42 | 1.18 (0.42–3.36) | 0.75 | ||
| ω6 total | 1 | 9/43 | 1 | 0.20 | |
| 2 | 15/37 | 1.95 (0.72–5.32) | 0.18 | ||
| 3 | 15/38 | 1.92 (0.70–5.26) | 0.20 | ||
| Ratio ω3/ω6 | 1 | 16/37 | 1 | 0.23 | |
| 2 | 13/40 | 0.70 (0.28–1.76) | 0.45 | ||
| 3 | 10/41 | 0.55 (0.21–1.45) | 0.22 | ||
| Ratio LCω3/ω–6 | 1 | 15/38 | 1 | 0.24 | |
| 2 | 14/39 | 0.80 (0.32–2.00) | 0.64 | ||
| 3 | 10/41 | 0.56 (0.21–1.49) | 0.25 | ||
| Fatty Acid | Tertile | n High-Grade/ n Low-Grade | Multivariable Models * | ||
|---|---|---|---|---|---|
| OR (95% CI) | p-Value † | p-Trend ‡ | |||
| ω3 total | 1 | 11/43 | 1 | 0.75 | |
| 2 | 15/39 | 1.69 (0.61–4.70) | 0.31 | ||
| 3 | 13/36 | 1.40 (0.39–5.02) | 0.60 | ||
| ALA | 1 | 12/42 | 1 | 0.17 | |
| 2 | 10/43 | 0.99 (0.32–3.05) | 0.99 | ||
| 3 | 17/33 | 2.29 (0.58–9.07) | 0.24 | ||
| LCω3 | 1 | 19/34 | 1 | 0.02 | |
| 2 | 11/43 | 0.38(0.15–0.98) | 0.04 | ||
| 3 | 9/41 | 0.30 (0.11–0.83) | 0.02 | ||
| EPA | 1 | 16/37 | 1 | 0.13 | |
| 2 | 13/41 | 0.63 (0.25–1.60) | 0.33 | ||
| 3 | 10/40 | 0.46 (0.17–1.26) | 0.13 | ||
| DHA | 1 | 18/35 | 1 | 0.02 | |
| 2 | 13/41 | 0.52 (0.20–1.30) | 0.16 | ||
| 3 | 8/42 | 0.29 (0.10–0.83) | 0.02 | ||
| DPA | 1 | 14/39 | 1 | 0.12 | |
| 2 | 17/37 | 1.05 (0.43–2.58) | 0.90 | ||
| 3 | 8/42 | 0.47 (0.17–1.32) | 0.15 | ||
| ω6 total | 1 | 13/40 | 1 | 0.04 | |
| 2 | 5/46 | 0.33 (0.10–1.13) | 0.08 | ||
| 3 | 21/32 | 2.22 (0.64–7.78) | 0.20 | ||
| Ratio ω3/ω6 | 1 | 17/36 | 1 | 0.17 | |
| 2 | 13/40 | 0.75 (0.31–1.87) | 0.55 | ||
| 3 | 9/42 | 0.50 (0.19–1.36) | 0.18 | ||
| Ratio LCω3/ω6 | 1 | 21/32 | 1 | 0.03 | |
| 2 | 9/43 | 0.27 (0.10–0.71) | <0.01 | ||
| 3 | 9/43 | 0.29 (0.11–0.76) | 0.01 | ||
© 2019 by the authors. Licensee MDPI, Basel, Switzerland. This article is an open access article distributed under the terms and conditions of the Creative Commons Attribution (CC BY) license (http://creativecommons.org/licenses/by/4.0/).
Share and Cite
Moussa, H.; Nguile-Makao, M.; Robitaille, K.; Guertin, M.-H.; Allaire, J.; Pelletier, J.-F.; Moreel, X.; Gevariya, N.; Diorio, C.; Desmeules, P.; et al. Omega-3 Fatty Acids Survey in Men under Active Surveillance for Prostate Cancer: from Intake to Prostate Tissue Level. Nutrients 2019, 11, 1616. https://doi.org/10.3390/nu11071616
Moussa H, Nguile-Makao M, Robitaille K, Guertin M-H, Allaire J, Pelletier J-F, Moreel X, Gevariya N, Diorio C, Desmeules P, et al. Omega-3 Fatty Acids Survey in Men under Active Surveillance for Prostate Cancer: from Intake to Prostate Tissue Level. Nutrients. 2019; 11(7):1616. https://doi.org/10.3390/nu11071616
Chicago/Turabian StyleMoussa, Hanane, Molière Nguile-Makao, Karine Robitaille, Marie-Hélène Guertin, Janie Allaire, Jean-François Pelletier, Xavier Moreel, Nikunj Gevariya, Caroline Diorio, Patrice Desmeules, and et al. 2019. "Omega-3 Fatty Acids Survey in Men under Active Surveillance for Prostate Cancer: from Intake to Prostate Tissue Level" Nutrients 11, no. 7: 1616. https://doi.org/10.3390/nu11071616