Coffee Abundant in Chlorogenic Acids Reduces Abdominal Fat in Overweight Adults: A Randomized, Double-Blind, Controlled Trial

 ,
,
Abstract
:1. Introduction
2. Materials and Methods
2.1. Subjects
2.2. Materials
2.3. Study Design
2.4. Measurements
2.5. Dietary Record and Physical Activity
2.6. Adverse Events
2.7. Statistical Analysis
3. Results
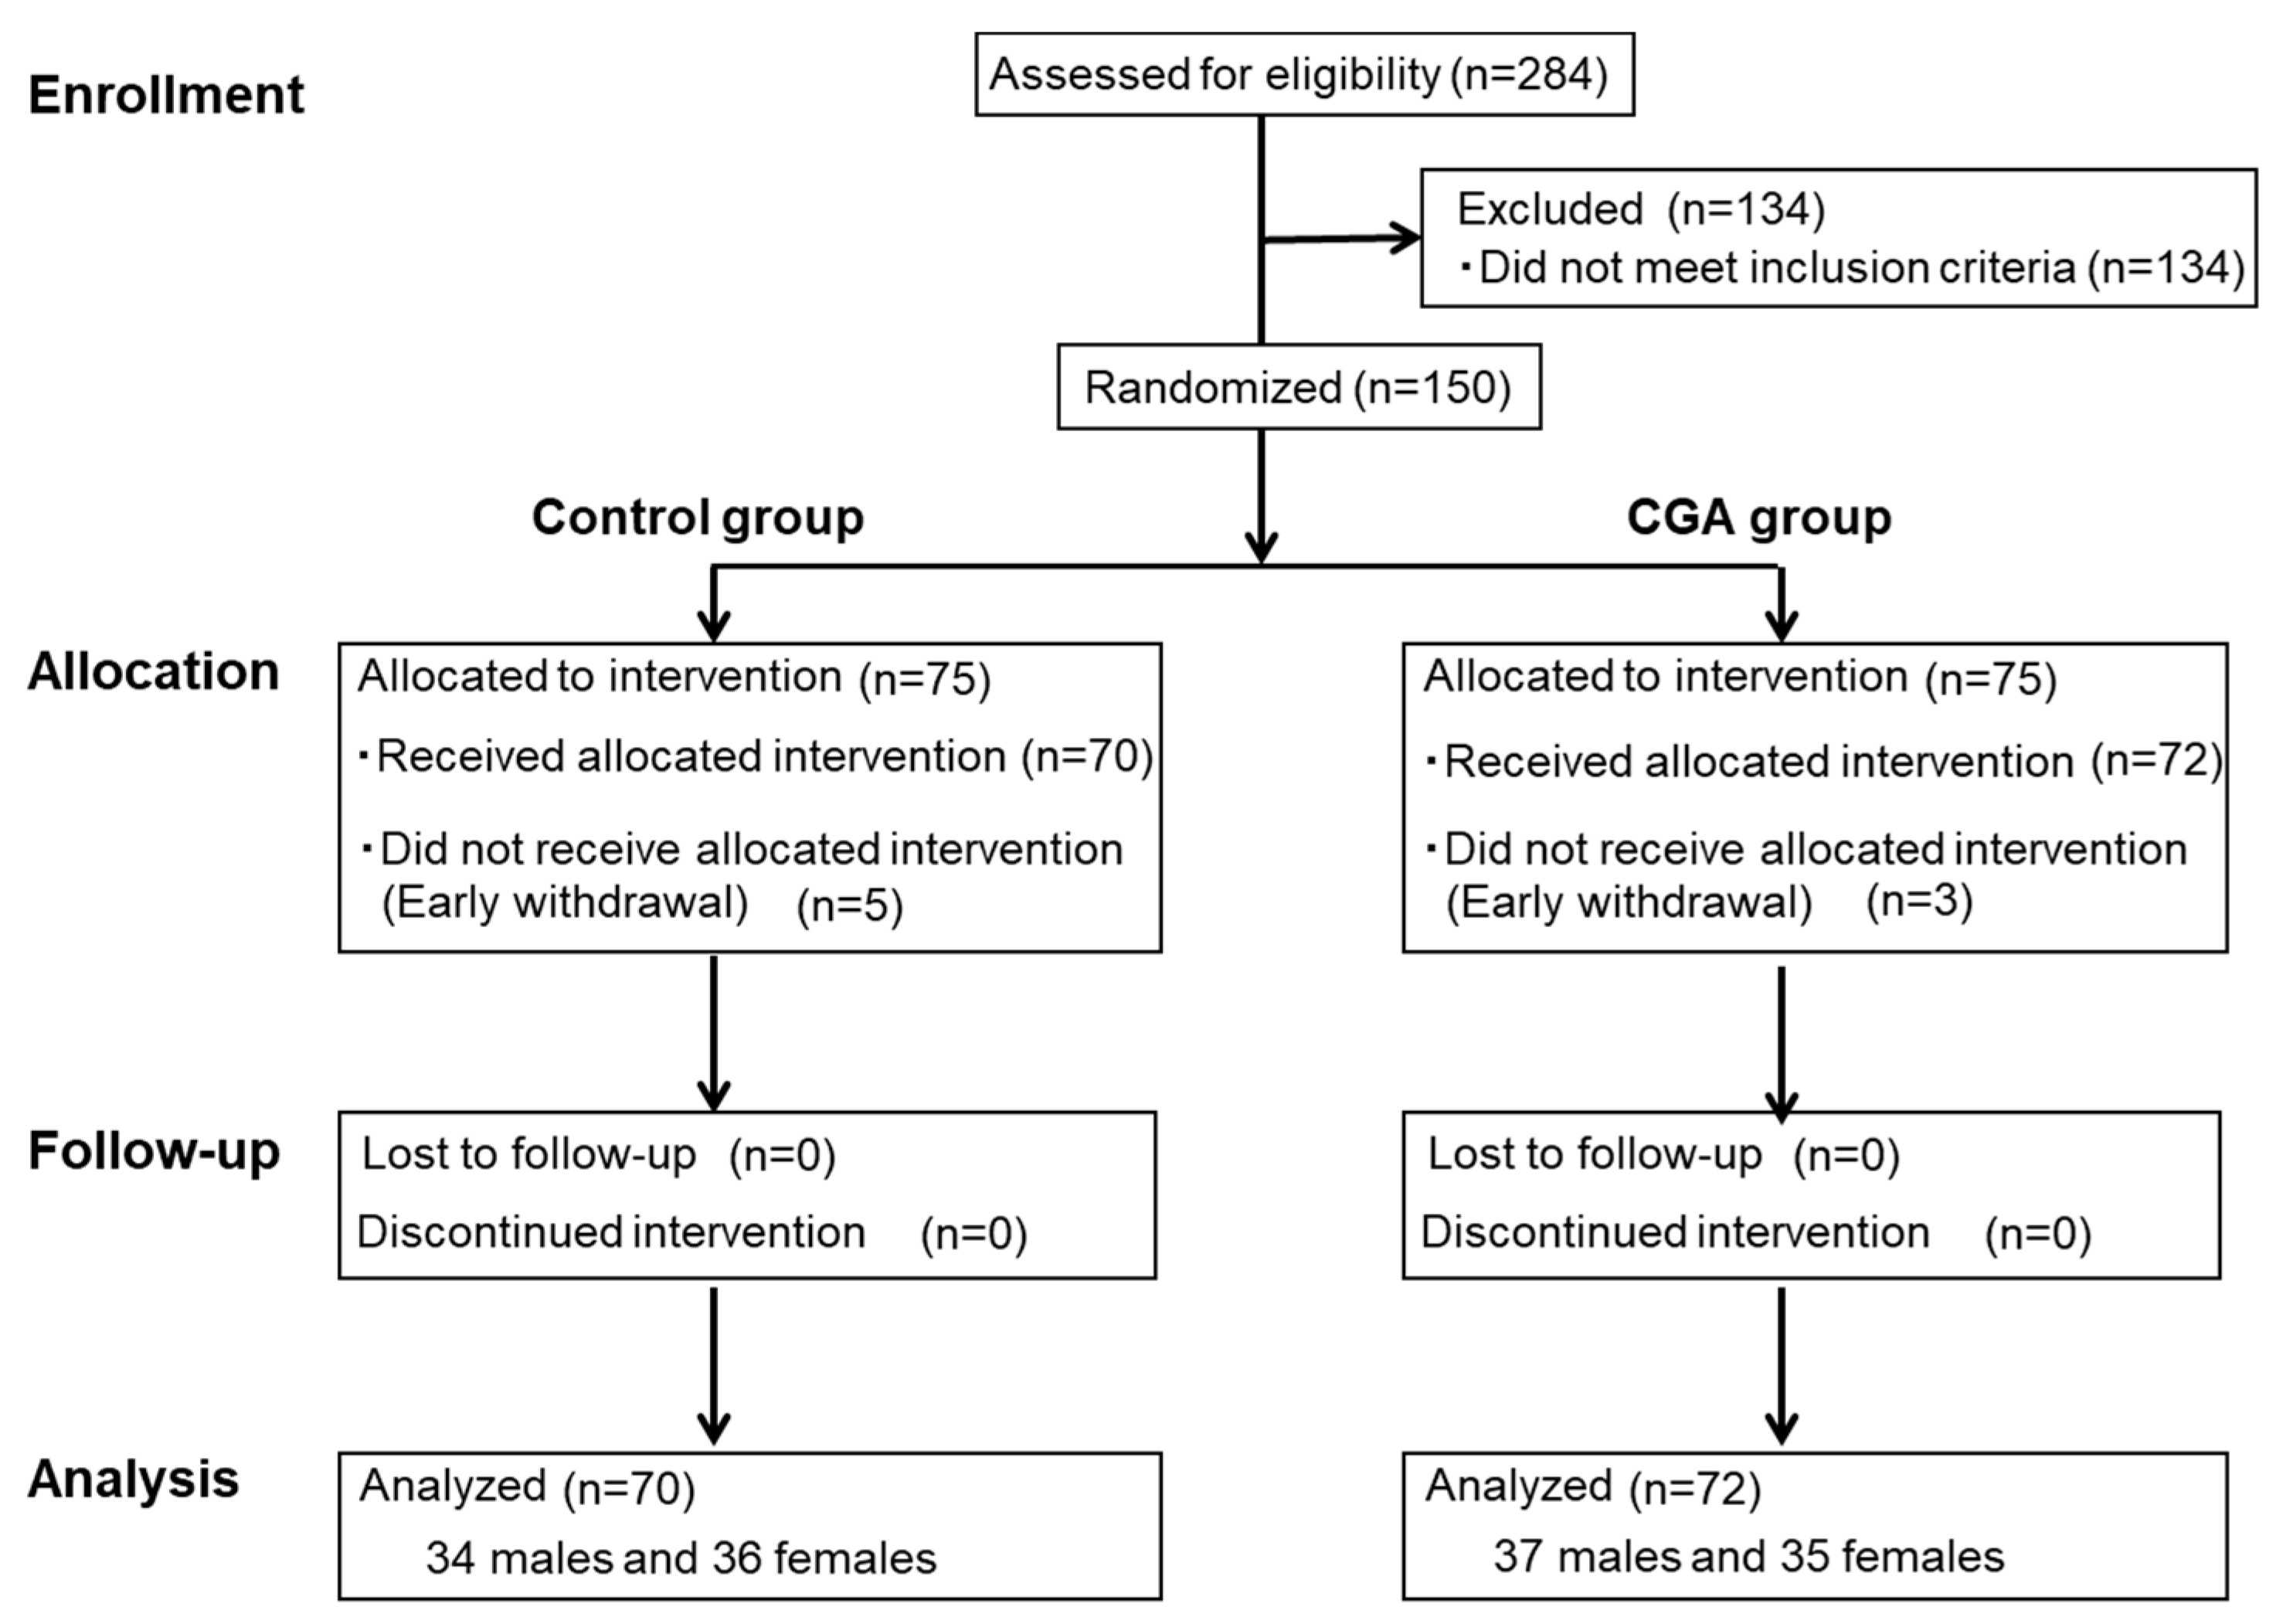
3.1. Subjects
3.2. Abdominal Fat Area and Anthropometric Measurements
3.3. Blood and Urine Tests
3.4. Adverse Events
4. Discussion
5. Conclusions
Author Contributions
Funding
Conflicts of Interest
References
- Van, R.M.; Feskens, E.J. Coffee consumption and risk of type 2 diabetes mellitus. Lancet 2002, 360, 1477–1478. [Google Scholar]
- Kokubo, Y.; Iso, H.; Saito, I.; Yamagishi, K.; Yatsuya, H.; Ishihara, J.; Inoue, M.; Tsugane, S. The impact of green tea and coffee consumption on the reduced risk of stroke incidence in Japanese population: The Japan public health center-based study cohort. Stroke 2013, 44, 1369–1374. [Google Scholar] [CrossRef] [PubMed]
- Huxley, R.; Lee, C.M.; Barzi, F.; Timmermeister, L.; Czernichow, S.; Perkovic, V.; Grobbee, D.E.; Batty, D.; Woodward, M. Coffee, decaffeinated coffee, and tea consumption in relation to incident type 2 diabetes mellitus: A systematic review with meta-analysis. Arch. Intern. Med. 2009, 169, 2053–2063. [Google Scholar] [CrossRef] [PubMed]
- Xie, C.; Cui, L.; Zhu, J.; Wang, K.; Sun, N.; Sun, C. Coffee consumption and risk of hypertension: A systematic review and dose-response meta-analysis of cohort studies. J. Hum. Hypertens. 2018, 32, 83–93. [Google Scholar] [CrossRef] [PubMed]
- Ding, M.; Bhupathiraju, S.N.; Satija, A.; van Dam, R.M.; Hu, F.B. Long-term coffee consumption and risk of cardiovascular disease: A systematic review and a dose-response meta-analysis of prospective cohort studies. Circulation 2014, 129, 643–659. [Google Scholar] [CrossRef] [PubMed]
- Crippa, A.; Discacciati, A.; Larsson, S.C.; Wolk, A.; Orsini, N. Coffee consumption and mortality from all causes, cardiovascular disease, and cancer: A dose-response meta-analysis. Am. J. Epidemiol. 2014, 180, 763–775. [Google Scholar] [CrossRef] [PubMed]
- Grobbee, D.E.; Rimm, E.B.; Giovannucci, E.; Colditz, G.; Stampfer, M.; Willett, W. Coffee, caffeine, and cardiovascular disease in men. N. Engl. J. Med. 1990, 323, 1026–1032. [Google Scholar] [CrossRef] [PubMed]
- Mostofsky, E.; Rice, M.S.; Levitan, E.B.; Mittleman, M.A. Habitual coffee consumption and risk of heart failure: A dose-response meta-analysis. Circ. Heart Fail. 2012, 5, 401–405. [Google Scholar] [CrossRef]
- Gonzalez de Mejia, E.; Ramirez-Mares, M.V. Impact of caffeine and coffee on our health. Trends Endocrinol. Metab. 2014, 25, 489–492. [Google Scholar] [CrossRef]
- Martini, D.; Del Bo’, C.; Tassotti, M.; Riso, P.; Del Rio, D.; Brighenti, F.; Porrini, M. Coffee Consumption and Oxidative Stress: A Review of Human Intervention Studies. Molecules 2016, 21, 979. [Google Scholar] [CrossRef]
- Fukushima, Y.; Ohie, T.; Yonekawa, Y.; Yonemoto, K.; Aizawa, H.; Mori, Y.; Watanabe, M.; Takeuchi, M.; Hasegawa, M.; Taguchi, C.; et al. Coffee and green tea as a large source of antioxidant polyphenols in the Japanese population. J. Agric. Food Chem. 2009, 57, 1253–1359. [Google Scholar] [CrossRef] [PubMed]
- IUPAC Commission on the Nomenclature of Organic Chemistry (CNOC); IUPAC-IUB Commission on Biochemical Nomenclature (CBN). Nomenclature of cyclitols. Recommendations, 1973. Biochem. J. 1976, 153, 23–31. [Google Scholar]
- Tajik, N.; Tajik, M.; Mack, I.; Enck, P. The potential effects of chlorogenic acid, the main phenolic components in coffee, on health: A comprehensive review of the literature. Eur. J. Nutr. 2017, 56, 2215–2244. [Google Scholar] [CrossRef] [PubMed]
- Clifford, M.N.; Wight, J. The measurement of feruloylquinic acids and caffeoylquinic acids in coffee beans. Development of the technique and its preliminary application to green coffee beans. J. Sci. Food Agric. 1976, 27, 73–84. [Google Scholar] [CrossRef] [PubMed]
- Ochiai, R.; Sugiura, Y.; Shioya, Y.; Otsuka, K.; Katsuragi, Y.; Hashiguchi, T. Coffee polyphenols improve peripheral endothelial function after glucose loading in healthy male adults. Nutr. Res. 2014, 34, 155–159. [Google Scholar] [CrossRef] [PubMed]
- Jokura, H.; Watanabe, I.; Umeda, M.; Hase, T.; Shimotoyodome, A. Coffee polyphenol consumption improves postprandial hyperglycemia associated with impaired vascular endothelial function in healthy male adults. Nutr. Res. 2015, 35, 873–881. [Google Scholar] [CrossRef]
- Watanabe, T.; Arai, Y.; Mitsui, Y.; Kusaura, T.; Okawa, W.; Kajihara, Y.; Saito, I. The blood pressure-lowering effect and safety of chlorogenic acid from green coffee bean extract in essential hypertension. Clin. Exp. Hypertens. 2006, 28, 439–449. [Google Scholar] [CrossRef]
- Park, I.; Ochiai, R.; Ogata, H.; Kayaba, M.; Hari, S.; Hibi, M.; Katsuragi, Y.; Satoh, M.; Tokuyama, K. Effects of subacute ingestion of chlorogenic acids on sleep architecture and energy metabolism through activity of the autonomic nervous system: A randomised, placebo-controlled, double-blinded cross-over trial. Br. J. Nutr. 2017, 117, 979–984. [Google Scholar] [CrossRef]
- Saitou, K.; Ochiai, R.; Kozuma, K.; Sato, H.; Koikeda, T.; Osaki, N.; Katsuragi, Y. Effect of chlorogenic acids on cognitive function: A randomized, double-blind, placebo-controlled trial. Nutrients 2018, 10, 1337. [Google Scholar] [CrossRef]
- Nagao, T.; Ochiai, R.; Katsuragi, Y.; Hayakawa, H.; Kataoka, K.; Komikado, M. Hydroxyhydroquinone-reduced milk coffee decreases blood pressure in individuals with mild hypertension and high-normal blood pressure. Prog. Med. 2007, 27, 2649–2664. [Google Scholar]
- Roshan, H.; Nikpayam, O.; Sedaghat, M.; Sohrab, G. Effects of green coffee extract supplementation on anthropometric indices, glycaemic control, blood pressure, lipid profile, insulin resistance and appetite in patients with the metabolic syndrome: A randomised clinical trial. Br. J. Nutr. 2018, 119, 250–258. [Google Scholar] [CrossRef] [PubMed]
- Gavrieli, A.; Karfopoulou, E.; Kardatou, E.; Spyreli, E.; Fragopoulou, E.; Mantzoros, C.S.; Yannakoulia, M. Effect of different amounts of coffee on dietary intake and appetite of normal-weight and overweight/obese individuals. Obesity 2013, 21, 1127–1132. [Google Scholar] [CrossRef] [PubMed]
- Kempf, K.; Kolb, H.; Gärtner, B.; Bytof, G.; Stiebitz, H.; Lantz, I.; Lang, R.; Hofmann, T.; Martin, S. Cardiometabolic effects of two coffee blends differing in content for major constituents in overweight adults: A randomized controlled trial. Eur. J. Nutr. 2015, 54, 845–854. [Google Scholar] [CrossRef]
- Kotyczka, C.; Boettler, U.; Lang, R.; Stiebitz, H.; Bytof, G.; Lantz, I.; Hofmann, T.; Marko, D.; Somoza, V. Dark roast coffee is more effective than light roast coffee in reducing body weight, and in restoring red blood cell vitamin E and glutathione concentrations in healthy volunteers. Mol. Nutr. Food Res. 2011, 55, 1582–1586. [Google Scholar] [CrossRef] [PubMed]
- Thom, E. The effect of chlorogenic acid enriched coffee on glucose absorption in healthy volunteers and its effect on body mass when used long-term in overweight and obese people. J. Int. Med. Res. 2007, 35, 900–908. [Google Scholar] [CrossRef] [PubMed]
- Nagao, T.; Ochiai, R.; Watanabe, T.; Kataoka, K.; Komikado, M.; Tokimitsu, I.; Tsuchida, T. Visceral fat-reducing effect of continuous coffee beverage consumption in obese subjects. Jpn. Pharmacol. Ther. 2009, 37, 333–344. [Google Scholar]
- Dupas, C.; Marsset, B.A.; Ordonaud, C.; Tomé, D.; Maillard, M.N. Chlorogenic acid is poorly absorbed, independently of the food matrix: A Caco-2 cells and rat chronic absorption study. Mol. Nutr. Food Res. 2006, 50, 1053–1060. [Google Scholar] [CrossRef] [PubMed]
- Ochiai, R.; Chikama, A.; Kataoka, K.; Tokimitsu, I.; Maekawa, Y.; Ohishi, M.; Rakugi, H.; Mikami, H. Effects of hydroxyhydroquinone-reduced coffee on vasoreactivity and blood pressure. Hypertens. Res. 2009, 32, 969–974. [Google Scholar] [CrossRef]
- Kajikawa, M.; Maruhashi, T.; Hidaka, T.; Nakano, Y.; Kurisu, S.; Matsumoto, T.; Iwamoto, Y.; Kishimoto, S.; Matsui, S.; Aibara, Y.; et al. Coffee with a high content of chlorogenic acids and low content of hydroxyhydroquinone improves postprandial endothelial dysfunction in patients with borderline and stage 1 hypertension. Eur. J. Nutr. 2019, 58, 989–996. [Google Scholar] [CrossRef]
- Tokunaga, K.; Matsuzawa, Y.; Ishikawa, K.; Tarui, S. A novel technique for the determination of body fat by computed tomography. Int. J. Obes. 1983, 7, 437–445. [Google Scholar]
- Greenberg, J.A.; Boozer, C.N.; Geliebter, A. Coffee, diabetes, and weight control. Am. J. Clin. Nutr. 2006, 84, 682–693. [Google Scholar] [CrossRef] [PubMed] [Green Version]
- Bakuradze, T.; Boehm, N.; Janzowski, C.; Lang, R.; Hofmann, T.; Stockis, J.P.; Albert, F.W.; Stiebitz, H.; Bytof, G.; Lantz, I.; et al. Antioxidant-rich coffee reduces DNA damage, elevates glutathione status and contributes to weight control: Results from an intervention study. Mol. Nutr. Food Res. 2011, 55, 793–797. [Google Scholar] [CrossRef] [PubMed]
- Japan Society for the Study of Obesity. Examination Committee of Criteria for ‘Obesity Disease’ in Japan. New criteria for ‘obesity disease’ in Japan. Circ. J. 2002, 66, 987–992. [Google Scholar]
- Ota, N.; Soga, S.; Murase, T.; Shimotoyodome, A.; Hase, T. Consumption of coffee polyphenols increases fat utilization in humans. J. Health. Sci. 2010, 56, 745–751. [Google Scholar] [CrossRef]
- Murase, T.; Misawa, K.; Minegishi, Y.; Aoki, M.; Ominami, H.; Suzuki, Y.; Shibuya, Y.; Hase, T. Coffee polyphenols suppress diet-induced body fat accumulation by downregulating SREBP-1c and related molecules in C57BL/6J mice. Am. J. Physiol. Endocrinol. Metab. 2011, 300, E122–E133. [Google Scholar] [CrossRef] [PubMed] [Green Version]
- Yamaguchi, T.; Chikama, A.; Inaba, M.; Ochiai, R.; Katsuragi, Y.; Yokimitsu, I.; Tsuchida, T.; Saito, I. Antihypertensive effects of hydroxyhydroquinone-reduced coffee on high-normal blood pressure subjects. Prog. Med. 2007, 27, 683–694. [Google Scholar]
- Chikama, A.; Yamaguchi, T.; Watanabe, T.; Mori, K.; Katsuragi, Y.; Tokimitsu, I.; Kajimoto, O.; Kitakaze, M. Effects of chlorogenic acids in hydroxyhydroquinone-reduced coffee on blood pressure and vascular endothelial function in humans. Prog. Med. 2016, 26, 1723–1736. [Google Scholar]
- Katada, S.; Watanabe, T.; Mizuno, T.; Kobayashi, S.; Takeshita, M.; Osaki, N.; Kobayashi, S.; Katsuragi, Y. Effects of chlorogenic acid-enriched and hydroxyhydroquinone-reduced coffee on postprandial fat oxidation and antioxidative capacity in healthy men: A randomized, double-blind, placebo-controlled, crossover trial. Nutrients 2018, 10, 525. [Google Scholar] [CrossRef]


| Control Group | CGA Group | |
|---|---|---|
| Composition | ||
| Chlorogenic acid (mg) six analogues | 30 | 319 |
| Chlorogenic acid (mg) nine analogues | 35 | 369 |
| Caffeine (mg) | 38 | 37 |
| Hydroxyhydroquinone (mg) | 0.858 | 0.054 |
| Nutritional content | ||
| Energy (kcal) | 5 | 14 |
| Protein (g) | 0.28 | 0.70 |
| Carbohydrate (g) | 0.97 | 2.83 |
| Fat (g) | 0 | 0.61 |
| Control Group | CGA Group | |
|---|---|---|
| (n = 70) | (n = 72) | |
| Age (years) | 49.5 ± 8.4 | 49.8 ± 8.0 |
| Height (cm) | 162.0 ± 9.2 | 162.9 ± 9.7 |
| Body weight (kg) | 72.0 ± 9.1 | 72.5 ± 8.5 |
| BMI (kg/m2) | 27.3 ± 1.4 | 27.3 ± 1.4 |
| SBP (mmHg) | 135.9 ± 14.4 | 132.1 ± 13.1 |
| DBP (mmHg) | 84.0 ± 10.1 | 80.6 ± 9.2 * |
| 0 Weeks | 12 Weeks | p-Value | ||||
|---|---|---|---|---|---|---|
| Group | Time | Group × Time | ||||
| Energy intake (kcal) | ||||||
| Control | 1884.6 ± 331.1 | 1831.2 ± 365.5 | 0.540 | 0.030 | 0.760 | |
| CGA | 1935.4 ± 421.1 | 1864.5 ± 408.1 | ||||
| Protein (g) | ||||||
| Control | 69.3 ± 15.3 | 66.6 ± 15.6 | 0.332 | 0.052 | 0.860 | |
| CGA | 72.3 ± 20.5 | 69.1 ± 19.8 | ||||
| Fat (g) | ||||||
| Control | 62.2 ± 16.5 | 61.3 ± 18.4 | 0.572 | 0.288 | 0.699 | |
| CGA | 64.9 ± 19.8 | 62.5 ± 22.0 | ||||
| Carbohydrate (g) | ||||||
| Control | 248.9 ± 60.7 | 239.0 ± 52.5 | 0.668 | 0.069 | 0.636 | |
| CGA | 251.9 ± 61.9 | 245.2 ± 51.9 | ||||
| Exercise (Steps) | ||||||
| Control | 7323.0 ± 3910.1 | 7280.1 ± 3745.4 | 0.552 | 0.613 | 0.503 | |
| CGA | 7400.8 ± 3864.9 | 7740.4 ± 3420.6 | ||||
| Baseline | 8 Weeks | 12 Weeks | p-Value | ||||
|---|---|---|---|---|---|---|---|
| Group | Time | Group × Time | |||||
| VFA (cm2) | Control | 117.9 ± 24.4 | 116.3 ± 26.4 | 116.9 ± 24.4 | 0.111 | <0.001 | <0.001 |
| CGA | 116.6 ± 25.2 | 106.9 ± 25.7 * | 107.6 ± 25.2 * | ||||
| ΔVFA (cm2) | Control | −1.6 ± 15.4 | −1.0 ± 14.3 | <0.001 | 0.541 | 0.811 | |
| CGA | −9.7 ± 12.4 ** | −9.0 ± 13.9 *** | |||||
| SFA (cm2) | Control | 223.0 ± 58.4 | 223.1 ± 57.0 | 222.1 ± 58.7 | 0.584 | 0.030 | 0.279 |
| CGA | 219.3 ± 52.7 | 216.2 ± 52.2 | 214.5 ± 54.9 | ||||
| ΔSFA (cm2) | Control | 0.1 ± 12.6 | −0.9 ± 12.0 | 0.118 | 0.217 | 0.772 | |
| CGA | −3.1 ± 14.5 | −4.8 ± 14.9 | |||||
| TFA (cm2) | Control | 341.0 ± 53.9 | 339.4 ± 56.1 | 339.0 ± 58.0 | 0.203 | <0.001 | 0.001 |
| CGA | 335.9 ± 52.8 | 323.1 ± 54.1 | 322.1 ± 54.6 | ||||
| ΔTFA (cm2) | Control | −1.6 ± 20.3 | −2.0 ± 16.2 | <0.001 | 0.717 | 0.713 | |
| CGA | −12.8 ± 21.2 ** | −13.8 ± 22.9 *** | |||||
| 0 Weeks | 4 Weeks | 8 Weeks | 12 Weeks | Post-Intervention | p-Value | ||||
|---|---|---|---|---|---|---|---|---|---|
| Group | Time | Group × Time | |||||||
| Body weight (kg) | Control | 71.8 ± 9.1 | 71.9 ± 9.2 | 71.9 ± 9.2 | 71.9 ± 9.2 | 71.8 ± 9.2 | 0.809 | 0.005 | 0.025 |
| CGA | 72.0 ± 8.5 | 72.3 ± 8.4 | 72.0 ± 8.5 | 71.8 ± 8.5 | 71.9 ± 8.5 | ||||
| ΔBody weight (kg) | Control | 0.1 ± 0.8 | 0.1 ± 1.0 | 0.1 ± 1.1 | 0.0 ± 1.3 | 0.592 | 0.008 | 0.010 | |
| CGA | 0.3 ± 0.9 | 0.0 ± 0.9 | −0.2 ± 1.0 | −0.1 ± 1.3 | |||||
| BMI (kg/m2) | Control | 27.3 ± 1.5 | 27.3 ± 1.5 | 27.3 ± 1.5 | 27.3 ± 1.6 | 27.3 ± 1.6 | 0.375 | 0.005 | 0.015 |
| CGA | 27.1 ± 1.3 | 27.2 ± 1.4 | 27.1 ± 1.3 | 27.0 ± 1.3 | 27.0 ± 1.3 | ||||
| ΔBMI (kg/m2) | Control | 0.04 ± 0.03 | 0.05 ± 0.38 | 0.06 ± 0.42 | 0.02 ± 0.48 | 0.612 | 0.012 | 0.006 | |
| CGA | 0.12 ± 0.34 | −0.01 ± 0.33 | −0.07 ± 0.37 | −0.04 ± 0.48 | |||||
| Waist circumference (cm) | Control | 92.8 ± 4.5 | 92.6 ± 4.5 | 92.5 ± 4.5 | 92.9 ± 4.6 | 92.7 ± 4.7 | 0.525 | 0.002 | 0.001 |
| CGA | 92.7 ± 5.2 | 92.2 ± 5.1 | 92.0 ± 5.1 | 92.0 ± 5.0 | 92.3 ± 4.9 | ||||
| ΔWaist circumference (cm) | Control | −0.2 ± 1.3 | −0.3 ± 1.6 | 0.1 ± 1.6 | −0.1 ± 2.0 | 0.023 | 0.065 | 0.012 | |
| CGA | −0.5 ± 1.3 | −0.7 ± 1.6 | −0.7 ± 1.4 ** | −0.4 ± 1.7 | |||||
| SBP (mmHg) | Control | 134.0 ± 12.0 | 133.7 ± 13.1 | 132.5 ± 13.3 | 134.5 ± 12.4 | 130.1 ± 14.9 | 0.520 | 0.326 | 0.812 |
| CGA | 132.5 ± 13.5 | 132.4 ± 13.1 | 131.5 ± 13.0 | 132.5 ± 13.9 | 125.8 ± 12.4 | ||||
| DBP (mmHg) | Control | 82.7 ± 9.5 | 81.7 ± 10.0 | 81.4 ± 9.6 | 82.8 ± 9.5 | 78.9 ± 10.5 | 0.144 | 0.260 | 0.395 |
| CGA | 80.7 ± 9.4 | 80.3 ± 8.5 | 79.3 ± 8.9 | 79.8 ± 9.5 | 75.5 ± 10.1 | ||||
| 0 Weeks | 4 Weeks | 8 Weeks | 12 Weeks | Post-Intervention | p-Value | ||||
|---|---|---|---|---|---|---|---|---|---|
| Group | Time | Group × Time | |||||||
| White blood cell count (/μL) | |||||||||
| Control | 6673 ± 1771 | 6759 ± 1852 | 6773 ± 1567 | 6906 ± 1596 | 6870 ± 1660 | 0.893 | 0.211 | 0.583 | |
| CGA | 6858 ± 1558 | 6849 ± 1546 | 6701 ± 1476 | 6892 ± 1658 | 6732 ± 1599 | ||||
| Red blood cell count (×104/μL) | |||||||||
| Control | 478 ± 38 | 475 ± 37 | 475 ± 39 | 475 ± 39 | 471 ± 40 | 0.586 | <0.001 | 0.218 | |
| CGA | 477 ± 39 | 469 ± 42 | 471 ± 40 | 471 ± 40 | 464 ± 41 | ||||
| Hemoglobin (g/dL) | |||||||||
| Control | 14.3 ± 1.6 | 14.3 ± 1.6 | 14.2 ± 1.5 | 14.3 ± 1.5 | 14.1 ± 1.5 | 0.819 | <0.001 | 0.204 | |
| CGA | 14.0 ± 1.3 | 14.2 ± 1.2 | 14.3 ± 1.2 | 14.3 ± 1.2 | 14.0 ± 1.3 | ||||
| Hematocrit (%) | |||||||||
| Control | 42.8 ± 3.7 | 42.4 ± 3.5 | 42.3 ± 3.6 | 42.5 ± 3.6 | 42.7 ± 3.6 | 0.532 | <0.001 | 0.219 | |
| CGA | 43.3 ± 3.1 | 42.5 ± 3.2 | 42.7 ± 3.2 | 43.0 ± 3.2 | 42.6 ± 3.4 | ||||
| Platelets (×104/μL) | |||||||||
| Control | 25.8 ± 5.6 | 26.0 ± 5.8 | 26.5 ± 6.1 | 26.0 ± 5.9 | 25.9 ± 5.6 | 0.355 | 0.339 | 0.282 | |
| CGA | 25.4 ± 5.2 | 25.3 ± 5.6 | 25.3 ± 6.5 | 25.2 ± 5.7 | 25.1 ± 5.4 | ||||
| MCV (fL) | |||||||||
| Control | 89.7 ± 4.9 | 89.4 ± 4.8 | 89.2 ± 4.7 | 89.6 ± 4.2 | 90.6 ± 4.2 | 0.045 | <0.001 | 0.466 | |
| CGA | 91.0 ± 4.4 | 90.8 ± 4.2 | 90.8 ± 4.3 * | 91.3 ± 4.4 ** | 92.2 ± 4.7 | ||||
| MCH (pg) | |||||||||
| Control | 30.0 ± 2.2 | 30.0 ± 2.2 | 29.9 ± 2.1 | 30.0 ± 1.9 | 29.9 ± 1.9 | 0.212 | 0.051 | 0.764 | |
| CGA | 30.4 ± 1.6 | 30.4 ± 1.6 | 30.4 ± 1.6 | 30.4 ± 1.6 | 30.3 ± 1.7 | ||||
| MCHC (%) | |||||||||
| Control | 33.4 ± 1.2 | 33.5 ± 1.2 | 33.5 ± 1.2 | 33.5 ± 1.1 | 33.0 ± 1.1 | 0.504 | 0.070 | 0.251 | |
| CGA | 33.4 ± 0.8 | 33.5 ± 0.9 | 33.4 ± 0.8 | 33.3 ± 0.9 | 32.9 ± 0.9 | ||||
| Total protein (g/dL) | |||||||||
| Control | 7.5 ± 0.4 | 7.4 ± 0.4 | 7.4 ± 0.4 | 7.3 ± 0.4 | 7.4 ± 0.5 | 0.051 | <0.001 | 0.951 | |
| CGA | 7.4 ± 0.3 | 7.3 ± 0.3 | 7.3 ± 0.3 | 7.2 ± 0.3 | 7.2 ± 0.4 | ||||
| Albumin (g/dL) | |||||||||
| Control | 4.5 ± 0.2 | 4.5 ± 0.3 | 4.5 ± 0.3 | 4.5 ± 0.3 | 4.4 ± 0.3 | 0.644 | 0.550 | 0.846 | |
| CGA | 4.5 ± 0.3 | 4.4 ± 0.3 | 4.5 ± 0.3 | 4.4 ± 0.3 | 4.4 ± 0.2 | ||||
| Total bilirubin (mg/dL) | |||||||||
| Control | 0.66 ± 0.30 | 0.63 ± 0.25 | 0.62 ± 0.20 | 0.64 ± 0.24 | 0.66 ± 0.26 | 0.636 | 0.100 | 0.999 | |
| CGA | 0.68 ± 0.27 | 0.66 ± 0.27 | 0.65 ± 0.24 | 0.67 ± 0.26 | 0.67 ± 6.70 | ||||
| AST (U/L) | |||||||||
| Control | 23.2 ± 8.6 | 22.2 ± 6.6 | 22.4 ± 7.2 | 22.6 ± 7.3 | 21.1 ± 6.3 | 0.214 | 0.042 | 0.990 | |
| CGA | 22.7 ± 10.0 | 21.5 ± 8.0 | 21.7 ± 9.6 | 22.6 ± 12.2 | 22.5 ± 10.3 | ||||
| ALT (U/L) | |||||||||
| Control | 28.9 ± 18.7 | 27.0 ± 16.2 | 27.5 ± 16.5 | 29.9 ± 17.3 | 26.2 ± 13.5 | 0.164 | <0.001 | 0.975 | |
| CGA | 26.3 ± 18.6 | 24.0 ± 14.8 | 25.0 ± 16.9 | 27.3 ± 17.0 | 26.3 ± 16.5 | ||||
| LDH (U/L) | |||||||||
| Control | 175.0 ± 30.2 | 176.2 ± 31.4 | 177.1 ± 33.4 | 174.9 ± 33.9 | 180.6 ± 4.7 | 0.645 | 0.701 | 0.349 | |
| CGA | 175.1 ± 22.9 | 174.0 ± 28.6 | 173.1 ± 26.0 | 173.2 ± 28.8 | 182.2 ± 29.2 | ||||
| ALP (U/L) | |||||||||
| Control | 223.6 ± 60.6 | 228.9 ± 61.2 | 224.4 ± 57.9 | 224.6 ± 62.7 | 227.3 ± 62.5 | 0.110 | 0.025 | 0.182 | |
| CGA | 212.5 ± 52.5 | 211.9 ± 56.5 | 207.6 ± 53.4 | 209.0 ± 57.6 | 208.0 ± 53.0 | ||||
| γ-GT (U/L) | |||||||||
| Control | 38.1 ± 27.6 | 37.7 ± 23.9 | 37.3 ± 24.2 | 39.7 ± 28.6 | 39.5 ± 28.3 | 0.005 | 0.053 | 0.129 | |
| CGA | 30.6 ± 19.1 | 27.4 ± 14.3 | 27.8 ± 15.4 | 28.5 ± 16.3 | 29.6 ± 17.6 | ||||
| Total cholesterol (mg/dL) | |||||||||
| Control | 218.4 ± 34.0 | 218.8 ± 33.7 | 218.2 ± 32.6 | 218.3 ± 35.3 | 217.3 ± 32.6 | 0.390 | 0.284 | 0.341 | |
| CGA | 220.8 ± 35.0 | 225.4 ± 38.0 | 224.8 ± 36.6 | 227.1 ± 35.8 | 216.7 ± 36.2 | ||||
| HDL cholesterol (mg/dL) | |||||||||
| Control | 56.9 ± 12.7 | 56.0 ± 12.6 | 55.3 ± 11.5 | 56.2 ± 13.9 | 57.1 ± 13.0 | 0.332 | 0.163 | 0.666 | |
| CGA | 58.3 ± 13.7 | 57.7 ± 14.4 | 57.8 ± 13.7 | 58.4 ± 13.9 | 58.8 ± 13.3 | ||||
| LDL cholesterol (mg/dL) | |||||||||
| Control | 141.4 ± 29.7 | 138.1 ± 27.5 | 139.3 ± 26.8 | 139.9 ± 29.6 | 136.5 ± 26.5 | 0.262 | 0.762 | 0.364 | |
| CGA | 145.0 ± 34.3 | 146.3 ± 35.8 | 146.2 ± 35.3 | 148.6 ± 33.5 | 139.0 ± 34.3 | ||||
| Triglycerides (mg/dL) | |||||||||
| Control | 141.8 ± 73.9 | 153.7 ± 113.0 | 144.5 ± 74.1 | 145.3 ± 90.7 | 158.3 ± 104.4 | 0.087 | 0.324 | 0.965 | |
| CGA | 122.6 ± 69.3 | 132.5 ± 79.3 | 125.9 ± 63.3 | 128.8 ± 89.8 | 117.7 ± 62.0 | ||||
| Fasting blood glucose (mg/dL) | |||||||||
| Control | 87.8 ± 7.7 | 88.8 ± 7.9 | 88.3 ± 10.1 | 89.3 ± 9.4 | 89.4 ± 7.9 | 0.488 | 0.059 | 0.545 | |
| CGA | 89.6 ± 10.2 | 90.2 ± 11.3 | 88.1 ± 9.2 | 89.9 ± 11.9 | 88.9 ± 8.5 | ||||
| HbA1c (%) | |||||||||
| Control | 5.3 ± 0.4 | 5.4 ± 0.4 | 5.4 ± 0.4 | 5.4 ± 0.4 | 5.3 ± 0.4 | 0.499 | <0.001 | 0.976 | |
| CGA | 5.4 ± 0.5 | 5.4 ± 0.5 | 5.5 ± 0.5 | 5.5 ± 0.5 | 5.4 ± 0.6 | ||||
| Uric acid (mg/dL) | |||||||||
| Control | 5.6 ± 1.4 | 5.5 ± 1.4 | 5.4 ± 1.3 | 5.5 ± 1.3 | 5.5 ± 1.3 | 0.387 | <0.001 | 0.063 | |
| CGA | 5.5 ± 1.3 | 5.3 ± 1.3 | 5.1 ± 1.3 | 5.4 ± 1.3 | 5.4 ± 1.3 | ||||
| Urea nitrogen (mg/dL) | |||||||||
| Control | 12.8 ± 3.2 | 12.7 ± 3.4 | 12.9 ± 3.6 | 12.7 ± 3.2 | 13.9 ± 4.1 | 0.824 | 0.357 | 0.086 | |
| CGA | 12.7 ± 3.0 | 13.1 ± 2.9 | 12.4 ± 2.8 | 12.5 ± 2.8 | 13.6 ± 3.2 | ||||
| Creatinine (mg/dL) | |||||||||
| Control | 0.70 ± 0.16 | 0.68 ± 0.15 | 0.72 ± 0.17 | 0.76 ± 0.15 | 0.76 ± 0.16 | 0.537 | <0.001 | 0.827 | |
| CGA | 0.71 ± 0.16 | 0.70 ± 0.16 | 0.74 ± 0.17 | 0.78 ± 0.17 | 0.77 ± 0.17 | ||||
| Sodium (mEq/L) | |||||||||
| Control | 140.1 ± 1.5 | 139.5 ± 2.0 | 140.8 ± 1.4 | 139.8 ± 1.5 | 141.9 ± 1.7 | 0.271 | <0.001 | 0.834 | |
| CGA | 140.3 ± 1.5 | 139.9 ± 2.0 | 140.9 ± 1.4 | 140.0 ± 1.4 | 141.8 ± 1.6 | ||||
| Chloride (mEq/L) | |||||||||
| Control | 102.9 ± 1.7 | 102.3 ± 2.0 | 103.4 ± 1.7 | 102.4 ± 1.9 | 104.4 ± 1.8 | 0.515 | <0.001 | 0.528 | |
| CGA | 102.9 ± 2.0 | 102.7 ± 2.2 | 103.3 ± 1.9 | 102.5 ± 2.0 | 103.9 ± 1.9 | ||||
| Potassium (mEq/L) | |||||||||
| Control | 4.1 ± 0.3 | 4.2 ± 0.3 | 4.2 ± 0.3 | 3.9 ± 0.3 | 3.7 ± 0.3 | 0.012 | 0.053 | 0.025 | |
| CGA | 4.1 ± 0.2 | 4.3 ± 0.4 * | 4.3 ± 0.3 * | 4.1 ± 0.3 ** | 3.7 ± 0.3 | ||||
© 2019 by the authors. Licensee MDPI, Basel, Switzerland. This article is an open access article distributed under the terms and conditions of the Creative Commons Attribution (CC BY) license (http://creativecommons.org/licenses/by/4.0/).
Share and Cite
Watanabe, T.; Kobayashi, S.; Yamaguchi, T.; Hibi, M.; Fukuhara, I.; Osaki, N. Coffee Abundant in Chlorogenic Acids Reduces Abdominal Fat in Overweight Adults: A Randomized, Double-Blind, Controlled Trial. Nutrients 2019, 11, 1617. https://doi.org/10.3390/nu11071617
Watanabe T, Kobayashi S, Yamaguchi T, Hibi M, Fukuhara I, Osaki N. Coffee Abundant in Chlorogenic Acids Reduces Abdominal Fat in Overweight Adults: A Randomized, Double-Blind, Controlled Trial. Nutrients. 2019; 11(7):1617. https://doi.org/10.3390/nu11071617
Chicago/Turabian StyleWatanabe, Takuya, Shinichi Kobayashi, Tohru Yamaguchi, Masanobu Hibi, Ikuo Fukuhara, and Noriko Osaki. 2019. "Coffee Abundant in Chlorogenic Acids Reduces Abdominal Fat in Overweight Adults: A Randomized, Double-Blind, Controlled Trial" Nutrients 11, no. 7: 1617. https://doi.org/10.3390/nu11071617