Abstract
Food insecurity is a stressor associated with adverse health outcomes, including the consumption of sugar-sweetened beverages (SSBs). Our study tests the hypothesis that other socioeconomic vulnerabilities may magnify this effect using cross-sectional data from the 2017 New York City (NYC) Kids Survey. Households providing an affirmative response to one or both food security screener questions developed by the US Department of Agriculture were coded as households with low food security. The number of sodas plus other SSBs consumed was standardized per day and categorized as 1 = none, 2 = less than one, and 3 = one or more. We tested the joint effect of low food security with chronic hardship, receipt of federal aid, and immigrant head of household on a sample of n = 2362 kids attending kindergarten and beyond using ordinal logistic regression and accounting for the complex survey design. Only having a US-born parent substantially magnified the effect of low household food security on SSB consumption (OR = 4.2, 95%CI: 2.9–6.3, p < 0.001) compared to the reference group of high household food security with an immigrant parent. The effect of low food security on SSB consumption among NYC children warrants intersectional approaches, especially to elucidate US-based SSB norms in low-food-security settings.
1. Introduction
Low levels of household food security, defined as a lack of consistent access to enough food to support an active healthy life, are associated with poverty and negative outcomes related to health, educational attainment, and social mobility [1,2,3,4,5,6,7]. Low food security is also associated with the presence of children: 12.5% of US households with children experienced low food security, compared to 10.2% of US households overall, in 2021 [8].
Research is increasingly focusing on the negative dietary consequences of low household food security levels, and findings suggest that households with fewer monetary resources tend to have less healthier eating habits [9]. For example, studies looking at households with low food security suggest that people in them are more likely to think of energy-dense items like SSBs as “cheap” and “better value than water” [10], and taste is a major reason for consumption among children and young adults [11]. Qualitative research also highlights that parents perceive sugary treats, including soda, as small pleasures that they should grant to their children and that they have a powerful symbolic value for families that have to sacrifice on a regular basis [12]. Research on patterns also suggests the importance of parents in determining the SSB intake of their children as well as the time and location of this intake. For example, studies have shown that low food security is significantly associated with greater SSB intake among children when they are out of school, such as in the summer [13]. This relationship was consistent for younger children [14,15], adolescents [16], and young adults [17,18]. Children with high SSB consumption typically consume SSBs at home, including during meals and in the evenings [19].
The data from the CDC’s Youth Risk Behavior Surveys (YRBSs) corroborate a higher prevalence of sugar-sweetened beverage (SSB) consumption among youth in lower-socioeconomic-status (SES) households [20]. However, the national YRBS does not have a measure of household food security, has limited sociodemographic indicators (e.g., race/ethnicity, free and reduced-price lunch eligibility), and only samples students in grades 9–12 [21]. However, a few studies have focused on socioeconomic factors that may magnify or offset the negative dietary consequences of low food security among children. For example, some evidence suggests that federally funded programs designed to address food security, a variable examined here, have differential effects on SSB consumption among children. In one study using multiple waves of data from the National Health and Nutrition Examination Survey, Supplemental Nutrition Assistance Program (SNAP) benefits were associated with greater SSB consumption, but the benefits from the Special Supplemental Nutrition Program for Women, Infants, and Children (WIC) were not [22]. Parental nativity as a proxy for immigration, another variable examined here, may also be important, for multiple reasons. On the one hand, immigrant families may have more difficulty accessing SNAP, WIC, and other food insecurity amelioration programs [23]. On the other hand, the dietary acculturation process immigrant children and their families face is replete with complexities. Concerns about the impact of acculturation on their children may exacerbate the dynamic in which low-income parents provide sugary treats to their children to offset the challenges of poverty [14]. Epidemiological research suggests that greater consumption of processed foods in general is associated with greater acculturation to the US, and the same dynamic may apply to SSBs [24]. Animal studies and psychological experiments have also shown an important link between glucose consumption as a coping strategy under stressful circumstances, which is a possible reason why low food security may heighten SSB consumption and why chronic stress is examined here specifically. No study of food security and SBB consumption focuses on New York City, the context for the current study. The one such study that focuses on New York State adults [20] found that SSB consumption remained high among African Americans and Latinos in 2016 despite decreases across time.
This paper investigates whether and, if so, how the receipt of federal aid, parental immigration status, and chronic stress modify the association between low food security of households and SSB consumption among children. We draw on data from the Healthy People 2030 framework of Social Determinants of Health (SDOH) [25] to examine how other important socioeconomic factors may serve to modify the effect of household food security levels on SSB consumption in children (see Figure 1). We hypothesize that the three variables of interest would magnify the main effect among children experiencing low levels of household food security, causing them to have a higher SSB consumption (main effect). New York City is an excellent setting to test this hypothesis, given that low food security was as high as 12.6% before 2019, but few datasets exist to derive estimates at this level of geographic granularity. This is valuable since we know that food security rates are not uniform across the US, and more research is needed to understand the micro-level policies and economic conditions that give rise to these differences in prevalence [8]. For example, the average meal cost in NYC is double the national average (e.g., USD 6.31 vs. USD 3.25), and the high cost of food may be particularly impactful among at-risk families [22].
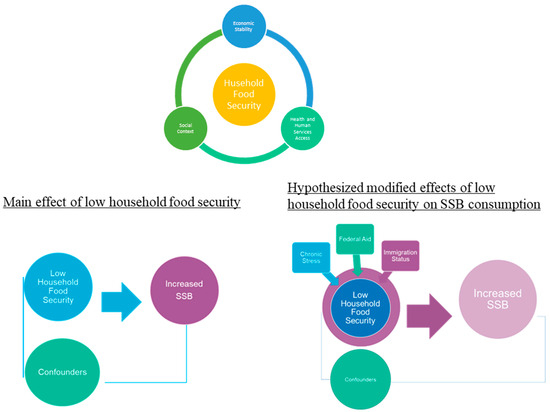
Figure 1.
Conceptual figure drawing on a modified Social Determinants of Health Framework; hypothesized relationships.
2. Materials and Methods
2.1. Data Source
The NYC Department of Health and Mental Hygiene conducted the NYC KIDS Survey in 2017, which provides estimates that are representative of NYC children ages 0–13. The sampling frame included 7507 households with one or more child/children aged 0–13 years across all five NYC boroughs: Bronx, Brooklyn, Manhattan, Queens, and Staten Island. The survey data were collected via telephone with parents, guardians, or other family members knowledgeable about the randomly selected child’s health, doctor visits, and family and neighborhood characteristics, conducted in their preferred language if other than English. The questions were drawn from national surveys on children’s health, such as the National Health Interview Survey and the National Survey of Children’s Health, as well as prior NYC surveys, such as the 2009 NYC Child Community Health Survey and the 2015 NYC Child Health, Emotional Wellness, and Development Survey. A data use agreement between the authors and the NYC Department of Health and Mental Hygiene was obtained for the present study. The Institutional Review Board of the NYC Department of Health and Mental Hygiene determined that the activity was exempt (Re:20-068).
2.2. Outcome Variable
Overall sweetened beverage consumption per day: The data contained a constructed variable based on the number of sodas and other SSBs consumed, standardized per day, and categorized as follows in regression models: 1 = none, 2 = less than one, 3 = one or more. For soda, the parents/guardians were asked to report how often their child drank sugar-sweetened soda per day. For other SSBs, they were asked to report how often their child consumed sweetened drinks, such as sweetened iced tea, sports drinks, fruit punches, or other fruit-flavored drinks, excluding diet soda, sugar-free drinks, or 100% juice. Unfortunately, there were no specific probes for culturally specific SSBs, such as aguas frescas, which Latino parents perceive as healthy due to their “natural” ingredients [23].
2.3. Exposures
Household food security: A validated 2-item screener from the US Department of Agriculture (USDA) was used to identify families’ levels of household food security [8]. The parent/adult caregivers of the NYC Kids Survey responded on a 5-point Likert scale (very often, often, sometimes, rarely, or never) to the following items: (1) “Within the past 12 months, we worried whether our food would run out before we got money to buy more” and (2) “Within the past 12 months, the food we bought just didn’t last and we didn’t have money to get more.” Following the USDA’s standards for scoring, households were classified as having low food security if their responses were affirmative (very often, often, or sometimes) to one or both of the items.
Chronic stress: Respondents were asked to rate the extent to which it was difficult “to cover the basics (e.g., housing) since the child was born” on a 4-point Likert scale that ranged from very often, somewhat often, not very often, never. Affirmative responses were coded as follows: 1 = chronic hardship (very often, somewhat often) and 0 = no chronic hardship (not very often, never). Given the similar nature of chronic hardship and low food security, we tested for collinearity using a variance inflation factor (VIF). Our result was 1.34, far below the VIF value of 10 that may merit further investigation [24].
Receipt of federal aid: The parents/guardians were asked, “At any time in the past 12 months, even for one month, did you or anyone living or staying with you receive any cash aid from the Family Assistance program or Temporary Aid to Needy Families Program (TANF/TAN-IF), Food Stamps (referring to SNAP) or Electronic Benefit Transfer (EBT), or any other benefit or welfare programs?”.
Parental immigration status: The respondents were asked about their place of birth; their responses were coded as 1 = US if the parent was born in the continental US and any of the US territories and 0 = immigrant for anyone born outside of the US/US territories.
Confounders: At the child level, we used age (continuous), sex (female, male), and race and ethnicity (non-Latino White, non-Latino Black, non-Latino Asian, Latino, non-Latino Other). At the household/parental level, these variables included the age of the adult respondent (16–24; 25–44; 45–65+), their highest educational level (elementary school; 9–11; high school or GED (General Equivalency Diploma); college 1–3 years; college 4+), children in households other than those sampled (none; one; two; three; three or more), and whether the household was above or below the federal poverty level (FPL; <200%, 200%+).
2.4. Analysis
As children age, they have greater opportunities for unhealthy beverage consumption through socialization in school [26]. Hence, we only included children attending kindergarten or beyond. We excluded children who were too young to go to school or those attending pre-kindergarten (pre-K) (n = 4522) as well as children who were homeschooled (n = 29) or for whom the type of school they attended was unknown (n = 4). We then listwise deleted observations with missing data on outcomes (n = 46 soda; n = 54 for any other SSBs), food security (n = 71), and any covariates (n = 419) for a complete-case analytical sample size of n = 2362 school-aged children.
About 13.1% of the observations in the original dataset had missing values in at least one variable intended for our analysis. The percentage of missing values by variable ranged from 2.7% for highest parental education to less than 0.01% for parent’s age. We assessed the patterns of missingness for all the variables to be used in our analysis and found that patterns in the missing data were largely consistent with the missing completely at random (MCAR) assumption, and we therefore conducted the listwise deletion of missing values and performed the analysis on complete cases.
The initial analyses included bivariate analysis using the chi-square test for our primary predictor variable, household food security, and our outcome variables of SSB consumption with related covariates. Given the multinomial ordinal response variable, we used ordinal logistic regression to estimate odds ratios (ORs) and their corresponding 95% confidence intervals. Ordinal logistic regression is an extension of logistic regression that is suitable for analyzing ordinal responses. We hypothesize a specific ordinal regression model called the proportional odds model (also known as the cumulative logic model) [27,28], which takes the following form:
where is an ordinal outcome and are participant ’s values for some k covariates with and . While this model form allows each ordinal level a different intercept , it assumes an identical log-odds ratio for all outcome levels, which is known as the parallel lines assumption. This contrasts with alternative model forms such as the partial proportional odds model that allows different log-odds, i.e., , to be estimated for each outcome level. We assessed the appropriateness of the parallel lines assumption by performing the Brandt test and found that the parallel regression assumption in the proportional odds model holds for each model we discuss in this paper.
Consistent with previous studies testing the joint effect of food insecurity [29], we examined the effects of low food security with chronic stress, receipt of federal aid, and parental immigration with SSB. Specifically, we tested the joint effect of low food security and chronic stress by classifying children into (a) high food security/no stress (reference), (b) high food security/stress, (c) low food security/no stress, or (d) low foods security/stress. This same 4-level categorization scheme was followed for the other joint effect models, using as the reference category the stratum with the lowest risk following best practices [30]. All marginal effects were computed for each joint effect model, except for immigration status since this variable was hypothesized to be an effect modifier. We also used Stata survey commands, which enabled us to adjust for the survey weighting [31]. The statistical significance was set at p < 0.05, and all tests were two-tailed.
3. Results
Descriptive characteristics at the child and household/parent levels, by food security level, are shown in Table 1. The food security level did not predict the children’s age or sex. However, households with low food security had a disproportionately higher percentage of Latino (51.4%) and Black non-Latino children (26.9%). In terms of household- and parent-level characteristics, households with low food security had disproportionately higher percentages of parents aged 25–44 and were categorized below the federal poverty level.

Table 1.
Descriptive characteristics by food security levels, NYC Kids 2017.
They also had a higher prevalence of chronic stress, receipt of aid, being headed by an immigrant parent, and having parents/guardians with a high school or lower level of educational attainment. Figure 2 outlines the SSB consumption for children as reported by a parent or guardian based on household food security levels. A higher percentage of children in low-food-security households consumed one or more SSBs (43%) compared to children residing in high-food-security households (26%). Conversely, a lower percentage of children in low-food-security households consumed no SSBs (17%) compared to children in high-food-security households (30%). Table 2 shows both the crude and adjusted associations between household food security and SSB consumption. After adjusting for confounders, we found that children living in households with low food security had higher odds of consuming SSBs (OR = 2.00, 95% CI:1.6–2.6, p < 0.001).
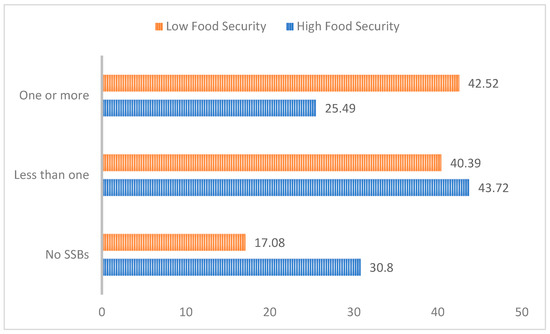
Figure 2.
SSB consumption by household food security.
Table 2.
Crude and adjusted models for food security on SSB consumption a, NYC Kids 2017.
Table 3 presents the summary of regression models to investigate whether chronic stress modifies the effect of household food security on its children’s SSB consumption. It shows that, within the no chronic-stress stratum, chronic stress magnifies the effect of low food security, while its effect is less clear within the chronic-stress stratum. Similarly, among the low-food-security households, chronic stress brings about a statistically significant increase in SSB consumption among children, while the interaction is less evident in the food-secure stratum.
Table 3.
Interaction of food security and chronic stress on odds of sugar-sweetened beverage consumption a, NYC Kids 2017.
Table 4 presents the effect between household food security and federal aid receipt. It demonstrates that the ORs of low food security are comparable across federal aid levels, indicating that there is no interaction effect between low food security and federal aid on SSB consumption.
Table 4.
Interaction of food security and receipt of federal aid on odds of sugar-sweetened beverage consumption a, NYC Kids 2017.
Table 5 presents the regression analysis to assess whether parental immigration status modifies the effect of household food security on SSB consumption. It shows that parents who are US born magnify the effect of low food security on increased SSB consumption. Specifically, children in low-food-security households with a US-born parent had higher odds of SSB consumption (OR = 4.2, 95%CI: 2.9–6.3, p < 0.001) compared to their counterparts in high-food-security households with immigrant parents.
Table 5.
Interaction of food security and immigration on odds of sugar-sweetened beverage consumption a, NYC Kids 2017.
4. Discussion
Given that food security is a poverty-related condition, this study sought to elucidate the socioeconomic factors that may amplify or offset the negative dietary consequences of low household food security such as greater SSB consumption. Our findings are consistent with the previous literature, which shows that children living in households with low food security had higher SSB consumption [14,15,16,17,18,32]. The novel findings in our study are that (1) parental US nativity strengthens the effect of low food security on SSB consumption among children; (2) chronic stress strengthens the effect of low food security; and (3) there is no interaction between receipt of federal aid and household food security. Specifically, our study suggests that US-born parents in low-food-security households may uphold more permissive SSB consumption norms than immigrant parents. Given evidence that parents determine their children’s SSB consumption [13,14,15,16,17,18,19], this is consistent with past research on nativity and dietary patterns, which suggests that immigrants often consume a more nutritious diet even in the face of a low SES [33,34]. However, this advantage quickly dwindles for ultra-processed foods, [35] and in the case of soda, our study is consistent with research showing SSB consumption increases with acculturation [36]. Longitudinal, in-depth qualitative studies that follow the experience of both US-born and immigrant food-insecure families could shed light on important dietary shifts experienced by children and provide important intervention components, targets, and sequencing for the reducing SSB consumption in this population.
Our findings also suggest the importance of the intersection between food security and stress. Research has shown important differences between acute and chronic stress, with the latter correlating with sustained low-grade inflammation that has severe long-term health consequences [37]. Indeed, Leddy et al. recently proposed a conceptual model whereby food insecurity affects health outcomes through three distinct pathways: (1) inflammation, (2) household stress, and (3) behavioral changes [38]. Although all of these proposed pathways could potentially impact the relationship between low food security and SSB consumption, our research suggests the importance in distinguishing acute vs. chronic forms of stress, and future research should investigate how this might shape the inflammation and behavior of low-food-secure families. Datasets with biometric measures of chronic stress should be mined, given the strong relationship between glucose and stress in animal and human experiments [39,40,41]. That is, glucose may play a role in alleviating cognitive overload and restoring feelings of self-control and may be one of the reasons why those with low food security might turn to sugar, including SSBs. This would add an important dimension to past research that suggests that those experiencing food insecurity consume cheap, highly processed foods to compensate for feeling stressed as well as to obtain more calories for less money [42,43,44].
Finally, we interpret the null findings in light of the gap in access to food amelioration programs here in NYC and the need to incorporate a concept related to food insecurity—that of nutrition security, defined by the USDA as having consistent access, availability, and affordability of foods and beverages that promote well-being and prevent (and if needed, treat) disease [45]. There are no validated measures to assess nutrition security among vulnerable populations in NYC, although measures are being developed in other parts of the country (e.g., Nebraska). Future studies should explore the role of SSBs in preventing achievements in nutrition security as well as how food-specific programs generally or SNAP specifically may help reduce SSB consumption. For example, SNAP Education, a nutrition education component of SNAP, has modules such as “Eat right when money’s tight”, which are designed to lower SSB consumption as well as other non-healthful choices [46].
Limitations
Our indicator of chronic stress was limited in that it used only one item based on a subjective assessment of the parent/guardian’s ability to cover basic expenses since the child was born; this item might not have captured other essential components of economic security that would be associated with child-level outcomes. Our federal aid indicator pooled all aid from different federally funded sources, which means it sheds little light on specific programs and their impact. The overall response rate for NYC KIDS was only 24.4%, but this is comparable to other telephone-based surveys. For example, the Pew Research Center report indicated a 9% response rate for this type of survey methodology, with a trend of decreasing response rates over time [47]. Our consumption outcomes were not derived using gold standard methodology such as 24 h dietary recalls from the child, as this analysis relied on parental reports of intake. There is a concern of bias, because parents/guardians may underreport the consumption of SSBs, particularly among older children who may consume SSBs in other settings (e.g., friends’ homes). The exclusion of the Latino cultural sweetened beverages is also a limitation. Given the cross-sectional nature of our data, we cannot make any causal statements, and SSBs may be particularly problematic for reverse causation with physical outcomes because some obese children may switch to diet soda as part of a weight-loss strategy [39]. Future research should capture the consumption of diet SSBs if weight outcomes are to be explored.
5. Conclusions
Our study found that US parental nativity and chronic stress amplify the association between low household food security and increased SSB consumption among NYC children, which highlights the importance of broader sociodemographic determinants shaping this relationship among vulnerable children in urban settings.
Author Contributions
Overall integrity of the work from inception to publication: K.R.F., S.S.A., E.C., Y.L., M.D. and F.M.G. Design, acquisition of data, or analysis and interpretation of data: K.R.F., S.S.A. and N.H. Preparation and review of the manuscript for important intellectual content: K.R.F., S.S.A., E.C. and N.H. Final approval of the version to be published: K.R.F., S.S.A., N.H., E.C., Y.L., M.D. and F.M.G. All authors have read and agreed to the published version of the manuscript.
Funding
This study was also partially supported by a grant to Flórez from PSC CUNY (Cycle 53) and a grant to Albrecht (5K01DK107791) from the National Institutes of Health/National Institute of Diabetes and Digestive and Kidney Diseases (NIDDK). The content is solely the responsibility of the authors and does not represent the official views of PSC CUNY or NIH/NIDDK.
Institutional Review Board Statement
The Institutional Review Board (IRB) of the NYC Department of Health and Mental Hygiene determined that the activity was exempt (Re:20-068), accessed on 29 October 2020.
Informed Consent Statement
Informed consent was obtained from all individual participants included in this study under protocol number 20-068 from the NYC Department of Health and Mental Hygiene Institutional Review Board.
Data Availability Statement
The dataset analyzed during the current study is publicly available, though a data use agreement between the authors and the NYC Department of Health and Mental Hygiene was obtained for the present study.
Acknowledgments
This study was conducted through the Marginalized Populations Health Data for New York City (HD4NYC) Working Group. The HD4NYC, funded by the Robert Wood Johnson Foundation and led by the New York Academy of Medicine and the New York City Department of Health and Mental Hygiene, is a multi-institutional research platform that seeks to advance health equity by producing actionable, policy-relevant research and promoting the careers of academic and applied public health researchers. We also thank Darryl Diaz, Nneka Lundy de la Cruz, and Diksha Brahmbhatt for their help in the early stages of this project as well as Sandra Echeverria for her invaluable comments regarding joint effect modeling.
Conflicts of Interest
The authors of this study have no financial or other disclosure to declare.
References
- Alaimo, K.; Olson, C.M.; Frongillo, E.A. Family food insufficiency, but not low family income, is positively associated with dysthymia and suicide symptoms in adolescents. J. Nutr. 2002, 132, 719–725. [Google Scholar] [CrossRef]
- Alaimo, K.; Olson, C.M.; Frongillo, E.A., Jr. Food insufficiency and American school-aged children’s cognitive, academic, and psychosocial development. Pediatrics 2001, 108, 44–53. [Google Scholar] [CrossRef]
- Alaimo, K.; Olson, C.M.; Frongillo, E.A., Jr.; Briefel, R.R. Food insufficiency, family income, and health in US preschool and school-aged children. Am. J. Public Health 2001, 91, 781–786. [Google Scholar]
- Heflin, C.M.; Siefert, K.; Williams, D.R. Food insufficiency and women’s mental health: Findings from a 3-year panel of welfare recipients. Soc. Sci. Med. 2005, 61, 1971–1982. [Google Scholar] [CrossRef] [PubMed]
- Seligman, H.K.; Bindman, A.B.; Vittinghoff, E.; Kanaya, A.M.; Kushel, M.B. Food insecurity is associated with diabetes mellitus: Results from the National Health Examination and Nutrition Examination Survey (NHANES) 1999–2002. J. Gen. Intern. Med. 2007, 22, 1018–1023. [Google Scholar] [CrossRef] [PubMed]
- Seligman, H.K.; Jacobs, E.A.; Lopez, A.; Tschann, J.; Fernandez, A. Food insecurity and glycemic control among low-income patients with type 2 diabetes. Diabetes Care 2012, 35, 233–238. [Google Scholar] [CrossRef] [PubMed]
- Smith, M.D.; Coleman-Jensen, A. Food insecurity, acculturation and diagnosis of CHD and related health outcomes among immigrant adults in the USA. Public Health Nutr. 2020, 23, 416–431. [Google Scholar] [CrossRef]
- Coleman-Jensen, A.; Rabbitt, M.P.; Gregory, C.A.; Singh, A. Household food security in the United States. Econ. Res. Rep. 2022, 155, 51. [Google Scholar]
- Dhurandhar, E.J. The food-insecurity obesity paradox: A resource scarcity hypothesis. Physiol. Behav. 2016, 162, 88–92. [Google Scholar] [CrossRef]
- Dono, J.; Ettridge, K.; Wakefield, M.; Pettigrew, S.; Coveney, J.; Roder, D.; Durkin, S.; Wittert, G.; Martin, J.; Miller, C. Nothing beats taste or convenience: A national survey of where and why people buy sugary drinks in Australia. Aust. N. Z. J. Public Health 2020, 44, 291–294. [Google Scholar] [CrossRef]
- Block, J.P.; Gillman, M.W.; Linakis, S.K.; Goldman, R.E. “If it tastes good, I’m drinking it”: Qualitative study of beverage consumption among college students. J. Adolesc. Health 2013, 52, 702–706. [Google Scholar] [CrossRef] [PubMed]
- Fielding-Singh, P. How the Other Half Eats: The Untold Story of Food Inequality in America; Little, Brown Spark: New York, NY, USA, 2023. [Google Scholar]
- Lee, J.; Kubik, M.Y.; Fulkerson, J.A. Diet Quality and Fruit, Vegetable, and Sugar-Sweetened Beverage Consumption by Household Food Insecurity among 8- to 12-Year-Old Children during Summer Months. J. Acad. Nutr. Diet. 2019, 119, 1695–1702. [Google Scholar] [CrossRef] [PubMed]
- Cunningham, T.J.; Barradas, D.T.; Rosenberg, K.D.; May, A.L.; Kroelinger, C.D.; Ahluwalia, I.B. Is maternal food security a predictor of food and drink intake among toddlers in Oregon? Matern. Child Health J. 2012, 16 (Suppl. S2), 339–346. [Google Scholar] [CrossRef][Green Version]
- Tomayko, E.J.; Mosso, K.L.; Cronin, K.A.; Carmichael, L.; Kim, K.; Parker, T.; Yaroch, A.L.; Adams, A.K. Household food insecurity and dietary patterns in rural and urban American Indian families with young children. BMC Public Health 2017, 17, 611. [Google Scholar] [CrossRef] [PubMed]
- Duke, N.N. Adolescent-Reported Food Insecurity: Correlates of Dietary Intake and School Lunch Behavior. Int. J. Environ. Res. Public Health 2021, 18, 6647. [Google Scholar] [CrossRef] [PubMed]
- Larson, N.; Laska, M.N.; Neumark-Sztainer, D. Food Insecurity, Diet Quality, Home Food Availability, and Health Risk Behaviors Among Emerging Adults: Findings from the EAT 2010–2018 Study. Am. J. Public Health 2020, 110, 1422–1428. [Google Scholar] [CrossRef]
- Mei, J.; Fulay, A.P.; Wolfson, J.A.; Leung, C.W. Food Insecurity and Dietary Intake among College Students with Unlimited Meal Plans at a Large, Midwestern University. J. Acad. Nutr. Diet 2021, 121, 2267–2274. [Google Scholar] [CrossRef]
- Vinke, P.C.; Blijleven, K.A.; Luitjens, M.; Corpeleijn, E. Young Children’s Sugar-Sweetened Beverage Consumption and 5-Year Change in BMI: Lessons Learned from the Timing of Consumption. Nutrients 2020, 12, 2486. [Google Scholar] [CrossRef]
- Lundeen, E.A.; Park, S.; Pan, L.; Blanck, H.M. Daily Intake of Sugar-Sweetened Beverages Among US Adults in 9 States, by State and Sociodemographic and Behavioral Characteristics, 2016. Prev. Chronic Dis. 2018, 15, E154. [Google Scholar] [CrossRef]
- Miller, G.; Merlo, C.; Demissie, Z.; Sliwa, S.; Park, S. Trends in Beverage Consumption Among High School Students—United States, 2007–2015. MMWR Morb. Mortal Wkly. Rep. 2017, 66, 112–116. [Google Scholar] [CrossRef]
- Acciai, F.; Srinivasan, M.; Ohri-Vachaspati, P. Sugar-Sweetened Beverage Consumption in Children: The Interplay of Household SNAP and WIC Participation. Am. J. Prev. Med. 2021, 61, 665–673. [Google Scholar] [CrossRef] [PubMed]
- Bogart, L.M.; Cowgill, B.O.; Sharma, A.J.; Uyeda, K.; Sticklor, L.A.; Alijewicz, K.E.; Schuster, M.A. Parental and home environmental facilitators of sugar-sweetened beverage consumption among overweight and obese Latino youth. Acad. Pediatr. 2013, 13, 348–355. [Google Scholar] [CrossRef] [PubMed]
- Checking for Multicollinearity. Available online: https://campusguides.lib.utah.edu/c.php?g=160853&p=1054159 (accessed on 1 June 2023).
- Gómez, C.A.; Kleinman, D.V.; Pronk, N.; Gordon, G.L.W.; Ochiai, E.; Blakey, C.; Johnson, A.; Brewer, K.H. Practice full report: Addressing health equity and social determinants of health through healthy people 2030. J. Public Health Manag. Pract. 2021, 27, S249. [Google Scholar] [CrossRef] [PubMed]
- Eck, K.M.; Dinesen, A.; Garcia, E.; Delaney, C.L.; Famodu, O.A.; Olfert, M.D.; Byrd-Bredbenner, C.; Shelnutt, K.P. “Your Body Feels Better When You Drink Water”: Parent and School-Age Children’s Sugar-Sweetened Beverage Cognitions. Nutrients 2018, 10, 1232. [Google Scholar] [CrossRef] [PubMed]
- McCullagh, P. Regression models for ordinal data. J. R. Stat. Soc. 1980, 42, 109–127. [Google Scholar] [CrossRef]
- Walker, S.; Duncan, D.B. Estimation of the probability of an event as a function of several independent variables. Biometrika 1967, 54, 167–179. [Google Scholar] [CrossRef] [PubMed]
- Florez, K.R.; Katic, B.J.; Lopez-Cevallos, D.F.; Murillo, R.; Cancel-Tirado, D.; Aponte-Soto, L.; Echeverria, S.E. The double burden of food insecurity and obesity among Latino youth: Understanding the role of generational status. Pediatr. Obes. 2019, 14, e12525. [Google Scholar] [CrossRef]
- Knol, M.J.; VanderWeele, T.J. Recommendations for presenting analyses of effect modification and interaction. Int. J. Epidemiol. 2012, 41, 514–520. [Google Scholar] [CrossRef]
- STATACorp. Stata Statistical Software: Release 15; StataCorp LLC: College Station, TX, USA, 2017. [Google Scholar]
- Fernandez, C.R.; Chen, L.; Cheng, E.R.; Charles, N.; Meyer, D.; Monk, C.; Baidal, J.W. Food Insecurity and Sugar-Sweetened Beverage Consumption Among WIC-Enrolled Families in the First 1,000 Days. J. Nutr. Educ. Behav. 2020, 52, 796–800. [Google Scholar] [CrossRef]
- Perez-Escamilla, R. Acculturation, nutrition, and health disparities in Latinos. Am. J. Clin. Nutr. 2011, 93, 1163S–1167S. [Google Scholar] [CrossRef]
- Greer, S.; Naidoo, M.; Hinterland, K.; Archer, A.; Lundy De La Cruz, N.; Crossa, A.; Gould, L.H. Health of Latinos in NYC; Bureau of Vital Statistics: New York, NY, USA, 2017.
- Steele, E.M.; Khandpur, N.; Sun, Q.; Monteiro, C.A. The impact of acculturation to the US environment on the dietary share of ultra-processed foods among US adults. Prev. Med. 2020, 141, 106261. [Google Scholar] [CrossRef] [PubMed]
- Allen, M.L.; Elliott, M.N.; Morales, L.S.; Diamant, A.L.; Hambarsoomian, K.; Schuster, M.A. Adolescent participation in preventive health behaviors, physical activity, and nutrition: Differences across immigrant generations for Asians and Latinos compared with Whites. Am. J. Public Health 2007, 97, 337–343. [Google Scholar] [CrossRef] [PubMed]
- Rohleder, N. Stress and inflammation–The need to address the gap in the transition between acute and chronic stress effects. Psychoneuroendocrinology 2019, 105, 164–171. [Google Scholar] [CrossRef] [PubMed]
- Leddy, A.M.; Weiser, S.D.; Palar, K.; Seligman, H. A conceptual model for understanding the rapid COVID-19-related increase in food insecurity and its impact on health and healthcare. Am. J. Clin. Nutr. 2020, 112, 1162–1169. [Google Scholar] [CrossRef] [PubMed]
- Hu, F.B. Obesity Epidemiology; Oxford Press: New York, NY, USA, 2008. [Google Scholar]
- Baumeister, F.A.; Rolinski, B.; Busch, R.; Emmrich, P. Glucose monitoring with long-term subcutaneous microdialysis in neonates. Pediatrics 2001, 108, 1187–1192. [Google Scholar] [CrossRef] [PubMed]
- Baumeister, R.F.; Tice, D.M.; Vohs, K.D. The Strength Model of Self-Regulation: Conclusions From the Second Decade of Willpower Research. Perspect. Psychol. Sci. 2018, 13, 141–145. [Google Scholar] [CrossRef]
- Hanson, K.L.; Connor, L.M. Food insecurity and dietary quality in US adults and children: A systematic review. Am. J. Clin. Nutr. 2014, 100, 684–692. [Google Scholar] [CrossRef]
- Drewnowski, A.; Specter, S.E. Poverty and obesity: The role of energy density and energy costs. Am. J. Clin. Nutr. 2004, 79, 6–16. [Google Scholar] [CrossRef]
- Leung, C.W.; Epel, E.S.; Ritchie, L.D.; Crawford, P.B.; Laraia, B.A. Food insecurity is inversely associated with diet quality of lower-income adults. J. Acad. Nutr. Diet 2014, 114, 1943–1953.e2. [Google Scholar] [CrossRef]
- U.S. Department of Agriculture. Food and Nutrition Security 2022. Available online: https://www.usda.gov/nutrition-security (accessed on 1 June 2023).
- Eat Right When Money’s Tight 2022. Available online: https://snaped.fns.usda.gov/nutrition-education/nutrition-education-materials/eat-right-when-moneys-tight (accessed on 1 June 2023).
- Keeter, S.; Hatley, N.; Kennedy, C.; Lau, A. What low response rates mean for telephone surveys Pew Research Center 2017. Available online: https://www.pewresearch.org/methods/2017/05/15/what-low-response-rates-mean-for-telephone-surveys/ (accessed on 1 June 2023).
Disclaimer/Publisher’s Note: The statements, opinions and data contained in all publications are solely those of the individual author(s) and contributor(s) and not of MDPI and/or the editor(s). MDPI and/or the editor(s) disclaim responsibility for any injury to people or property resulting from any ideas, methods, instructions or products referred to in the content. |
© 2023 by the authors. Licensee MDPI, Basel, Switzerland. This article is an open access article distributed under the terms and conditions of the Creative Commons Attribution (CC BY) license (https://creativecommons.org/licenses/by/4.0/).