
Diet and Meal Pattern Determinants of Glucose Levels and Variability in Adults with and without Prediabetes or Early-Onset Type 2 Diabetes: A Pilot Study
 , ,
, ,  ,
,  ,
,
Abstract
:1. Introduction
2. Methods
2.1. Study Design
2.2. Participants
2.3. Blood Pressure and Anthropometry
2.4. Glucose
2.5. Dietary Intake
2.6. Eating Patterns
2.7. Statistical Analyses
3. Results
3.1. Participant Characteristics
3.2. Effect of Meal Pattern and Its Variability on Mean Glucose, Glucose Excursions and GV
3.3. Effect of Diet Composition and Its Variability on Mean Glucose, Glucose Excursions and GV
4. Discussion
5. Conclusions
Supplementary Materials
Author Contributions
Funding
Institutional Review Board Statement
Informed Consent Statement
Data Availability Statement
Conflicts of Interest
References
- Sheard, N.F.; Clark, N.G.; Brand-Miller, J.C.; Franz, M.J.; Pi-Sunyer, F.X.; Mayer-Davis, E.; Kulkarni, K.; Geil, P. Dietary carbohydrate (amount and type) in the prevention and management of diabetes: A statement by the american diabetes association. Diabetes Care 2004, 27, 2266–2271. [Google Scholar] [CrossRef] [PubMed]
- Franz, M.J.; Bantle, J.P.; Beebe, C.A.; Brunzell, J.D.; Chiasson, J.L.; Garg, A.; Holzmeister, L.A.; Hoogwerf, B.; Mayer-Davis, E.; Mooradian, A.D.; et al. Evidence-based nutrition principles and recommendations for the treatment and prevention of diabetes and related complications. Diabetes Care 2002, 25, 148–198. [Google Scholar] [CrossRef] [PubMed]
- Hall, K.D.; Ayuketah, A.; Brychta, R.; Cai, H.; Cassimatis, T.; Chen, K.Y.; Chung, S.T.; Costa, E.; Courville, A.; Darcey, V.; et al. Ultra-Processed Diets Cause Excess Calorie Intake and Weight Gain: An Inpatient Randomized Controlled Trial of Ad Libitum Food Intake. Cell Metab. 2019, 30, 67–77.e63. [Google Scholar] [CrossRef]
- Mansoor, N.; Vinknes, K.J.; Veierød, M.B.; Retterstøl, K. Effects of low-carbohydrate diets v. low-fat diets on body weight and cardiovascular risk factors: A meta-analysis of randomised controlled trials. Br. J. Nutr. 2016, 115, 466–479. [Google Scholar] [CrossRef] [PubMed]
- Tobias, D.K.; Chen, M.; Manson, J.E.; Ludwig, D.S.; Willett, W.; Hu, F.B. Effect of low-fat diet interventions versus other diet interventions on long-term weight change in adults: A systematic review and meta-analysis. Lancet Diabetes Endocrinol. 2015, 3, 968–979. [Google Scholar] [CrossRef]
- Zimmet, P.Z. Diabetes and its drivers: The largest epidemic in human history? Clin. Diabetes Endocrinol. 2017, 3, 1. [Google Scholar] [CrossRef] [PubMed]
- Blüher, M. Obesity: Global epidemiology and pathogenesis. Nat. Rev. Endocrinol. 2019, 15, 288–298. [Google Scholar] [CrossRef] [PubMed]
- Hutchison, A.T.; Regmi, P.; Manoogian, E.N.C.; Fleischer, J.G.; Wittert, G.A.; Panda, S.; Heilbronn, L.K. Time-Restricted Feeding Improves Glucose Tolerance in Men at Risk for Type 2 Diabetes: A Randomized Crossover Trial. Obesity 2019, 27, 724–732. [Google Scholar] [CrossRef] [PubMed]
- Xiao, Q.; Garaulet, M.; Scheer, F. Meal timing and obesity: Interactions with macronutrient intake and chronotype. Int. J. Obes. 2019, 43, 1701–1711. [Google Scholar] [CrossRef]
- Almoosawi, S.; Vingeliene, S.; Karagounis, L.G.; Pot, G.K. Chrono-nutrition: A review of current evidence from observational studies on global trends in time-of-day of energy intake and its association with obesity. Proc. Nutr. Soc. 2016, 75, 487–500. [Google Scholar] [CrossRef]
- Palomar-Cros, A.; Srour, B.; Andreeva, V.A.; Fezeu, L.K.; Bellicha, A.; Kesse-Guyot, E.; Hercberg, S.; Romaguera, D.; Kogevinas, M.; Touvier, M. Associations of meal timing, number of eating occasions and night-time fasting duration with incidence of type 2 diabetes in the NutriNet-Santé cohort. Int. J. Epidemiol. 2023, 52, 1486–1497. [Google Scholar] [CrossRef] [PubMed]
- Frontoni, S.; Di Bartolo, P.; Avogaro, A.; Bosi, E.; Paolisso, G.; Ceriello, A. Glucose variability: An emerging target for the treatment of diabetes mellitus. Diabetes Res. Clin. Pract. 2013, 102, 86–95. [Google Scholar] [CrossRef] [PubMed]
- Dimova, R.; Chakarova, N.; Del Prato, S.; Tankova, T. The Relationship Between Dietary Patterns and Glycemic Variability in People with Impaired Glucose Tolerance. J. Nutr. 2023, 153, 1427–1438. [Google Scholar] [CrossRef] [PubMed]
- Prasad, M.; Fine, K.; Gee, A.; Nair, N.; Popp, C.J.; Cheng, B.; Manoogian, E.N.C.; Panda, S.; Laferrère, B. A Smartphone Intervention to Promote Time Restricted Eating Reduces Body Weight and Blood Pressure in Adults with Overweight and Obesity: A Pilot Study. Nutrients 2021, 13, 2148. [Google Scholar] [CrossRef] [PubMed]
- Martin, C.K.; Han, H.; Coulon, S.M.; Allen, H.R.; Champagne, C.M.; Anton, S.D. A novel method to remotely measure food intake of free-living individuals in real time: The remote food photography method. Br. J. Nutr. 2009, 101, 446–456. [Google Scholar] [CrossRef] [PubMed]
- Gill, S.; Panda, S. A Smartphone App Reveals Erratic Diurnal Eating Patterns in Humans that Can Be Modulated for Health Benefits. Cell Metab. 2015, 22, 789–798. [Google Scholar] [CrossRef] [PubMed]
- Kim, J.; Campbell, A.S.; de Ávila, B.E.; Wang, J. Wearable biosensors for healthcare monitoring. Nat. Biotechnol. 2019, 37, 389–406. [Google Scholar] [CrossRef] [PubMed]
- Santos-Báez, L.S.; Garbarini, A.; Shaw, D.; Cheng, B.; Popp, C.J.; Manoogian, E.N.C.; Panda, S.; Laferrère, B. Time-restricted eating to improve cardiometabolic health: The New York Time-Restricted EATing randomized clinical trial—Protocol overview. Contemp. Clin. Trials 2022, 120, 106872. [Google Scholar] [CrossRef] [PubMed]
- Blum, A. Freestyle Libre Glucose Monitoring System. Clin. Diabetes 2018, 36, 203–204. [Google Scholar] [CrossRef] [PubMed]
- Hill, N.R.; Oliver, N.S.; Choudhary, P.; Levy, J.C.; Hindmarsh, P.; Matthews, D.R. Normal reference range for mean tissue glucose and glycemic variability derived from continuous glucose monitoring for subjects without diabetes in different ethnic groups. Diabetes Technol. Ther. 2011, 13, 921–928. [Google Scholar] [CrossRef]
- Subar, A.F.; Kirkpatrick, S.I.; Mittl, B.; Zimmerman, T.P.; Thompson, F.E.; Bingley, C.; Willis, G.; Islam, N.G.; Baranowski, T.; McNutt, S. The Automated Self-Administered 24-hour Dietary Recall (ASA24): A resource for researchers, clinicians and educators from the National Cancer Institute. J. Acad. Nutr. Diet. 2012, 112, 1134. [Google Scholar] [CrossRef]
- Manoogian, E.N.C.; Wei-Shatzel, J.; Panda, S. Assessing temporal eating pattern in free living humans through the myCircadianClock app. Int. J. Obes. 2022, 46, 696–706. [Google Scholar] [CrossRef] [PubMed]
- Wilkinson, M.J.; Manoogian, E.N.C.; Zadourian, A.; Lo, H.; Fakhouri, S.; Shoghi, A.; Wang, X.; Fleischer, J.G.; Navlakha, S.; Panda, S.; et al. Ten-Hour Time-Restricted Eating Reduces Weight, Blood Pressure, and Atherogenic Lipids in Patients with Metabolic Syndrome. Cell Metab. 2020, 31, 92–104.e105. [Google Scholar] [CrossRef] [PubMed]
- 2. Diagnosis and Classification of Diabetes: Standards of Care in Diabetes-2024. Diabetes Care 2024, 47 (Suppl. S1), S20–S42. [CrossRef] [PubMed]
- Sierra-Johnson, J.; Undén, A.L.; Linestrand, M.; Rosell, M.; Sjogren, P.; Kolak, M.; De Faire, U.; Fisher, R.M.; Hellénius, M.L. Eating meals irregularly: A novel environmental risk factor for the metabolic syndrome. Obesity 2008, 16, 1302–1307. [Google Scholar] [CrossRef] [PubMed]
- Bernardes da Cunha, N.; Teixeira, G.P.; Madalena Rinaldi, A.E.; Azeredo, C.M.; Crispim, C.A. Late meal intake is associated with abdominal obesity and metabolic disorders related to metabolic syndrome: A chrononutrition approach using data from NHANES 2015–2018. Clin. Nutr. 2023, 42, 1798–1805. [Google Scholar] [CrossRef]
- Parr, E.B.; Steventon-Lorenzen, N.; Johnston, R.; Maniar, N.; Devlin, B.L.; Lim, K.H.C.; Hawley, J.A. Time-restricted eating improves measures of daily glycaemic control in people with type 2 diabetes. Diabetes Res. Clin. Pract. 2023, 197, 110569. [Google Scholar] [CrossRef] [PubMed]
- Parr, E.B.; Devlin, B.L.; Radford, B.E.; Hawley, J.A. A Delayed Morning and Earlier Evening Time-Restricted Feeding Protocol for Improving Glycemic Control and Dietary Adherence in Men with Overweight/Obesity: A Randomized Controlled Trial. Nutrients 2020, 12, 505. [Google Scholar] [CrossRef] [PubMed]
- Chow, L.S.; Manoogian, E.N.C.; Alvear, A.; Fleischer, J.G.; Thor, H.; Dietsche, K.; Wang, Q.; Hodges, J.S.; Esch, N.; Malaeb, S.; et al. Time-Restricted Eating Effects on Body Composition and Metabolic Measures in Humans who are Overweight: A Feasibility Study. Obesity 2020, 28, 860–869. [Google Scholar] [CrossRef] [PubMed]
- Samkani, A.; Skytte, M.J.; Thomsen, M.N.; Astrup, A.; Deacon, C.F.; Holst, J.J.; Madsbad, S.; Rehfeld, J.F.; Krarup, T.; Haugaard, S.B. Acute Effects of Dietary Carbohydrate Restriction on Glycemia, Lipemia and Appetite Regulating Hormones in Normal-Weight to Obese Subjects. Nutrients 2018, 10, 1285. [Google Scholar] [CrossRef] [PubMed]
- Samkani, A.; Skytte, M.J.; Kandel, D.; Kjaer, S.; Astrup, A.; Deacon, C.F.; Holst, J.J.; Madsbad, S.; Rehfeld, J.F.; Haugaard, S.B.; et al. A carbohydrate-reduced high-protein diet acutely decreases postprandial and diurnal glucose excursions in type 2 diabetes patients. Br. J. Nutr. 2018, 119, 910–917. [Google Scholar] [CrossRef] [PubMed]
- Stephenson, E.J.; Smiles, W.; Hawley, J.A. The Relationship between Exercise, Nutrition and Type 2 Diabetes; Medicine and Sport Science; Karger: Basel, Switzerland, 2014; Volume 60, pp. 1–10. [Google Scholar] [CrossRef]
- Gannon, M.C.; Nuttall, F.Q. Effect of a high-protein, low-carbohydrate diet on blood glucose control in people with type 2 diabetes. Diabetes 2004, 53, 2375–2382. [Google Scholar] [CrossRef] [PubMed]
- Basu, S.; Yoffe, P.; Hills, N.; Lustig, R.H. The relationship of sugar to population-level diabetes prevalence: An econometric analysis of repeated cross-sectional data. PLoS ONE 2013, 8, e57873. [Google Scholar] [CrossRef] [PubMed]
- Dorans, K.S.; Bazzano, L.A.; Qi, L.; He, H.; Chen, J.; Appel, L.J.; Chen, C.S.; Hsieh, M.H.; Hu, F.B.; Mills, K.T.; et al. Effects of a Low-Carbohydrate Dietary Intervention on Hemoglobin A1c: A Randomized Clinical Trial. JAMA Netw. Open 2022, 5, e2238645. [Google Scholar] [CrossRef] [PubMed]
- Wolever, T.M.; Nuttall, F.Q.; Lee, R.; Wong, G.S.; Josse, R.G.; Csima, A.; Jenkins, D.J. Prediction of the relative blood glucose response of mixed meals using the white bread glycemic index. Diabetes Care 1985, 8, 418–428. [Google Scholar] [CrossRef]
- Wolever, T.M.; Miller, J.B. Sugars and blood glucose control. Am. J. Clin. Nutr. 1995, 62, 212S–221S, discussion 221S–227S. [Google Scholar] [CrossRef] [PubMed]
- Huang, T.; Xu, M.; Lee, A.; Cho, S.; Qi, L. Consumption of whole grains and cereal fiber and total and cause-specific mortality: Prospective analysis of 367,442 individuals. BMC Med. 2015, 13, 59. [Google Scholar] [CrossRef] [PubMed]
- Oba-Yamamoto, C.; Takeuchi, J.; Nakamura, A.; Nomoto, H.; Kameda, H.; Cho, K.Y.; Atsumi, T.; Miyoshi, H. Impact of low-starch high-fiber pasta on postprandial blood glucose. Nutr. Metab. Cardiovasc. Dis. 2022, 32, 487–493. [Google Scholar] [CrossRef] [PubMed]
- Korczak, R.; Slavin, J.L. Definitions, regulations, and new frontiers for dietary fiber and whole grains. Nutr. Rev. 2020, 78 (Suppl. S1), 6–12. [Google Scholar] [CrossRef] [PubMed]
- Tettamanzi, F.; Bagnardi, V.; Louca, P.; Nogal, A.; Monti, G.S.; Mambrini, S.P.; Lucchetti, E.; Maestrini, S.; Mazza, S.; Rodriguez-Mateos, A.; et al. A High Protein Diet Is More Effective in Improving Insulin Resistance and Glycemic Variability Compared to a Mediterranean Diet-A Cross-Over Controlled Inpatient Dietary Study. Nutrients 2021, 13, 4380. [Google Scholar] [CrossRef]
- Goyenechea, E.; Holst, C.; van Baak, M.A.; Saris, W.H.; Jebb, S.; Kafatos, A.; Pfeiffer, A.; Handjiev, S.; Hlavaty, P.; Stender, S.; et al. Effects of different protein content and glycaemic index of ad libitum diets on diabetes risk factors in overweight adults: The DIOGenes multicentre, randomized, dietary intervention trial. Diabetes Metab. Res. Rev. 2011, 27, 705–716. [Google Scholar] [CrossRef] [PubMed]
- de la Cruz-Ares, S.; Gutiérrez-Mariscal, F.M.; Alcalá-Díaz, J.F.; Quintana-Navarro, G.M.; Podadera-Herreros, A.; Cardelo, M.P.; Torres-Peña, J.D.; Arenas-de Larriva, A.P.; Pérez-Martínez, P.; Delgado-Lista, J.; et al. Quality and Quantity of Protein Intake Influence Incidence of Type 2 Diabetes Mellitus in Coronary Heart Disease Patients: From the CORDIOPREV Study. Nutrients 2021, 13, 1217. [Google Scholar] [CrossRef] [PubMed]
- Fappi, A.; Mittendorfer, B. Dietary protein intake and obesity-associated cardiometabolic function. Curr. Opin. Clin. Nutr. Metab. Care 2020, 23, 380–386. [Google Scholar] [CrossRef] [PubMed]
- Chan, K.K.; Neighbors, C.; Gilson, M.; Larimer, M.E.; Alan Marlatt, G. Epidemiological trends in drinking by age and gender: Providing normative feedback to adults. Addict. Behav. 2007, 32, 967–976. [Google Scholar] [CrossRef] [PubMed]
- Tarragon, E. Alcohol and energy drinks: Individual contribution of common ingredients on ethanol-induced behaviour. Front. Behav. Neurosci. 2023, 17, 1057262. [Google Scholar] [CrossRef] [PubMed]
- Bantle, A.E.; Thomas, W.; Bantle, J.P. Metabolic effects of alcohol in the form of wine in persons with type 2 diabetes mellitus. Metabolism 2008, 57, 241–245. [Google Scholar] [CrossRef] [PubMed]
- Ma, Y.; Olendzki, B.C.; Pagoto, S.L.; Hurley, T.G.; Magner, R.P.; Ockene, I.S.; Schneider, K.L.; Merriam, P.A.; Hébert, J.R. Number of 24-hour diet recalls needed to estimate energy intake. Ann. Epidemiol. 2009, 19, 553–559. [Google Scholar] [CrossRef] [PubMed]
- Park, J.H.; Lee, M.Y.; Shin, H.K.; Yoon, K.J.; Lee, J.; Park, J.H. Lower skeletal muscle mass is associated with diabetes and insulin resistance: A cross-sectional study. Diabetes Metab. Res. Rev. 2023, 39, e3681. [Google Scholar] [CrossRef]
- Mizgier, M.L.; Casas, M.; Contreras-Ferrat, A.; Llanos, P.; Galgani, J.E. Potential role of skeletal muscle glucose metabolism on the regulation of insulin secretion. Obes. Rev. 2014, 15, 587–597. [Google Scholar] [CrossRef] [PubMed]
- Wyatt, P.; Berry, S.E.; Finlayson, G.; O’Driscoll, R.; Hadjigeorgiou, G.; Drew, D.A.; Khatib, H.A.; Nguyen, L.H.; Linenberg, I.; Chan, A.T.; et al. Postprandial glycaemic dips predict appetite and energy intake in healthy individuals. Nat. Metab. 2021, 3, 523–529. [Google Scholar] [CrossRef] [PubMed]


| Variable | N-GLYC | D-GLYC | Pearson Chi-Sq | |
|---|---|---|---|---|
| n (%) | n (%) | |||
| Gender | Male | 5 (35.7) | 7 (26.9) | 0.563 |
| Female | 9 (64.3) | 19 (73.1) | ||
| Age group | <35 years | 4 (28.6) | 0 (0) | <0.001 |
| 35–44 years | 3 (21.4) | 0 (0) | ||
| 45–54 years | 2 (14.3) | 3 (11.5) | ||
| 55–64 years | 5 (35.7) | 14 (53.8) | ||
| >65 years | 0 (0) | 9 (34.6) | ||
| Ethnicity | Hispanic | 2 (14.3) | 6 (23.1) | 0.507 |
| Non-Hispanic | 12 (85.7) | 20 (76.9) | ||
| Race | White | 9 (64.3) | 9 (34.6) | 0.072 |
| Non-White | 5 (35.7) | 17 (65.4) | ||
| Status | Prediabetes | 0 (0) | 23 (88.5) | <0.001 |
| T2D | 0 (0) | 3 (11.5) | ||
| Variable | N-GLYC (n = 14) | D-GLYC (n = 26) | p Value |
|---|---|---|---|
| Anthropometrics | |||
| Systolic BP | 113.8 ± 10.9 | 121.9 ± 12.8 | 0.052 |
| Diastolic BP | 71.0 ± 9.2 | 77.9 ± 9.8 | 0.036 * |
| Height (cm) | 170.2 ± 10.6 | 165.4 ± 9.8 | 0.154 |
| Weight (kg) | 71.5 ± 11.8 | 88.9 ± 19.3 | 0.004 * |
| BMI (kg/m2) | 24.9 ± 5.1 | 32.3 ± 5.3 | <0.001 * |
| Glucose | |||
| Glycosylated hemoglobin (HbA1c) | N/A | 5.9 ± 0.3 | N/A |
| Homeostatic model assessment for insulin resistance (HOMA-IR) | N/A | 4.9 ± 4.1 | N/A |
| Total number of CGM readings | 1117 ± 277 | 962 ± 201 | <0.001 * |
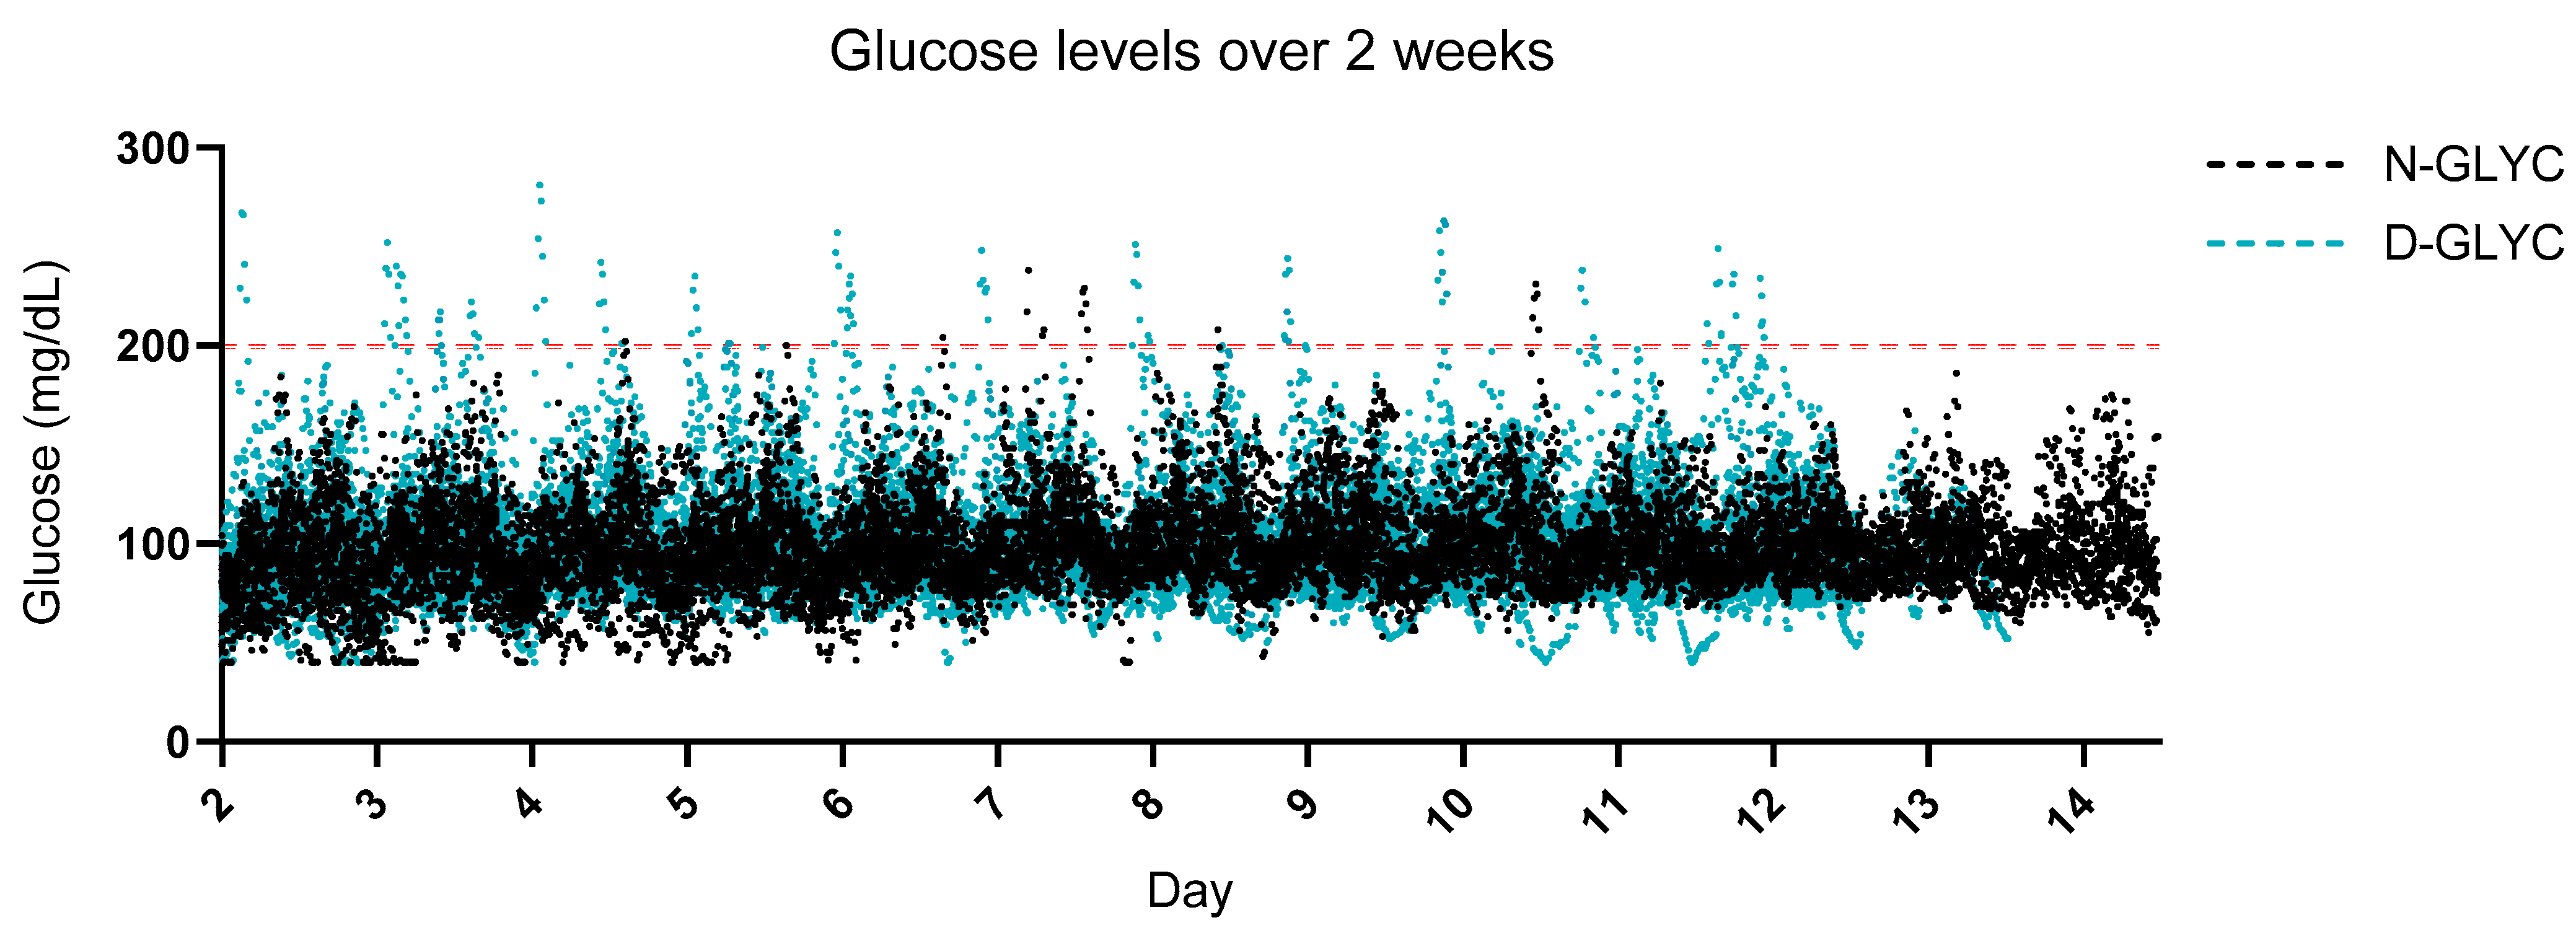
| Mean glucose | 96.40 ± 10.37 | 97.5 ± 10.4 | 0.754 |
| Glucose variability | 18.6 ± 4.7 | 19.7 ± 7.7 | 0.865 |
| Mean amplitude of glycemic excursions (MAGE) | 46.5 ± 10.8 | 51.8 ± 20.7 | 0.610 |
| Largest amplitude of glycemic excursions (LAGE) | 130.93 ± 23.61 | 136.8 ± 44.3 | 0.585 |
| Min glucose reading | 50.1 ± 11.9 | 52.2 ± 9.8 | 0.496 |
| Max glucose reading | 181.0 ± 21.7 | 189.0 ± 42.5 | 1.000 |
| % in range | 93.0 ± 7.9 | 94.8 ± 6.4 | 0.744 |
| Eating patterns | |||
| Number of days logging | 13.4 ± 1.9 | 11.1 ± 0.3 | <0.001 * |
| Good logging days (%) | 92.3 ± 12.7 | 91.3 ± 11.1 | 0.429 |
| Daily number of EOs | 6 ± 2.3 | 6.2 ± 2.8 | 0.966 |
| Eating window duration (hh:mm) | 13:37 ± 1:05 | 14:21 ± 2:05 | 0.452 |
| Time of first eating occasion (hh:mm) | 9:19 ± 1:51 | 9:15 ± 1:44 | 0.903 |
| Time of last eating occasion (hh:mm) | 20:09 ± 1:37 | 19:46 ± 1:51 | 0.522 |
| Eating midpoint (hh:mm) | 15:10 ± 1:51 | 14:40 ± 1:44 | 0.398 |
| Dietary composition | |||
| Mean number of recalls | 5.4 ± 1.3 | 4.8 ± 1.0 | 0.050 |
| Calories | 1827 ± 415 | 1824.9 ± 628 | 0.571 |
| Protein (gr) | 81.5 ± 25.3 | 75.4 ± 19.89 | 0.403 |
| Total fat (gr) | 73.3 ± 24.0 | 82.7 ± 32.9 | 0.411 |
| Carbohydrate (gr) | 206.0 ± 47.5 | 189.4 ± 87.3 | 0.119 |
| Sugar (gr) | 81.7 ± 24.7 | 78.5 ± 39.6 | 0.379 |
| Sugar-to-carbohydrate ratio | 0.4 ± 0.1 | 0.4 ± 0.1 | 0.568 |
| Fiber (gr) | 20.0 ± 7.6 | 20.9 ± 11.6 | 0.989 |
| Fiber-to-carbohydrate ratio | 0.1 ± 0.0 | 0.1 ± 0.0 | 0.357 |
| Protein (%) | 17.9 ± 3.7 | 17.4 ± 3.9 | 0.496 |
| Total fat (%) | 35.4 ± 5.4 | 39.7 ± 7.0 | 0.051 |
| Carbohydrate (%) | 46.0 ± 7.2 | 43.3 ± 8.1 | 0.303 |
| Alcohol (gr) | 7.2 ± 5.9 | 4.6 ± 10.2 | 0.008 * |
Disclaimer/Publisher’s Note: The statements, opinions and data contained in all publications are solely those of the individual author(s) and contributor(s) and not of MDPI and/or the editor(s). MDPI and/or the editor(s) disclaim responsibility for any injury to people or property resulting from any ideas, methods, instructions or products referred to in the content. |
© 2024 by the authors. Licensee MDPI, Basel, Switzerland. This article is an open access article distributed under the terms and conditions of the Creative Commons Attribution (CC BY) license (https://creativecommons.org/licenses/by/4.0/).
Share and Cite
Santos-Báez, L.S.; Díaz-Rizzolo, D.A.; Popp, C.J.; Shaw, D.; Fine, K.S.; Altomare, A.; St-Onge, M.-P.; Manoogian, E.N.C.; Panda, S.; Cheng, B.; et al. Diet and Meal Pattern Determinants of Glucose Levels and Variability in Adults with and without Prediabetes or Early-Onset Type 2 Diabetes: A Pilot Study. Nutrients 2024, 16, 1295. https://doi.org/10.3390/nu16091295
Santos-Báez LS, Díaz-Rizzolo DA, Popp CJ, Shaw D, Fine KS, Altomare A, St-Onge M-P, Manoogian ENC, Panda S, Cheng B, et al. Diet and Meal Pattern Determinants of Glucose Levels and Variability in Adults with and without Prediabetes or Early-Onset Type 2 Diabetes: A Pilot Study. Nutrients. 2024; 16(9):1295. https://doi.org/10.3390/nu16091295
Chicago/Turabian StyleSantos-Báez, Leinys S., Diana A. Díaz-Rizzolo, Collin J. Popp, Delaney Shaw, Keenan S. Fine, Annemarie Altomare, Marie-Pierre St-Onge, Emily N. C. Manoogian, Satchidananda Panda, Bin Cheng, and et al. 2024. "Diet and Meal Pattern Determinants of Glucose Levels and Variability in Adults with and without Prediabetes or Early-Onset Type 2 Diabetes: A Pilot Study" Nutrients 16, no. 9: 1295. https://doi.org/10.3390/nu16091295