1. Introduction
Obesity and diseases associated with it, represent a rapidly growing health problem in both developed and developing countries [
1]. Type 2 diabetes (T2D) is the most prevalent co-morbidity of obesity [
2]. There are clear biochemical relations between obesity and T2D, where changes in obesity predispose susceptible individuals to develop T2D. An important mechanism is that the expansion of adipose tissue depots that occurs in obesity leads to elevated levels of adipocyte-derived hormones, circulating free fatty acids and pro-inflammatory cytokines. Some of these factors contribute to peripheral insulin resistance in the liver, adipose tissue and skeletal muscle [
3]. The insulin resistance in turn would cause impaired glucose tolerance, however most individuals are able to adapt to the insulin resistance through a compensatory increase in insulin secretion resulting in normal circulating glucose levels. Adaptation to the insulin resistance by increasing insulin secretion reaches a critical point in some individuals where they can no longer maintain insulin secretion at such high levels [
4]. Pancreatic beta cell function becomes at this point insufficient resulting in fasting and postprandial hyperglycemia and eventually type 2 diabetes. It is known that reduced beta cell volume and function are associated with the insulin insufficiency seen in impaired glucose tolerance and T2D [
4,
5]. With the reduced beta cell volume and function, the counter-regulation of glucagon secretion is lost resulting in fasting and postprandial hyperglucagonemia which contributes to the existing hyperglycemia [
6]. As islet adaptation to insulin resistance is critical to preventing the onset of T2D, treatment strategies that involve restoring or maintaining beta cell function are currently in use and new treatments are actively being pursued.
In the development of new treatments for T2D the necessity for reliable animal models is of the utmost importance. The C57BL/6 mouse strain has been shown to become obese, insulin resistant and glucose intolerant in response to consumption of a high (58%–60%) fat diet and is the most used model for studying diet induced obesity and its co-morbidities [
7,
8]. In response to the high fat diet C57BL/6 mice show an initial impairment of glucose tolerance and insulin secretion [
9]. However after several weeks, high fat fed mice show increases in their acute insulin response to a glucose challenge and improved glucose disposal resulting in a near normalization of glucose tolerance [
9]. This adaptation to insulin resistance is due to the remarkable capacity for C57BL/6 mice to increase beta cell mass and volume in response to high fat feeding [
10,
11]. The increased beta cell mass and insulin secretion result in higher fasting and postprandial insulin levels and normalized glycemia [
10,
11]. The ability of C57BL/6 mice to adapt to insulin resistance by increasing insulin secretion is similar to the adaptation to insulin resistance seen in humans [
12]. There are however key differences that limit the high fat diet fed mouse model in the study of diabetes. In mice fed a high fat diet for 1 year, beta cell volume increases 2–3 fold [
10,
11]. In human obesity, more modest increases in beta cell volume from 20% to 50% have been reported [
13,
14]. Some obese insulin resistant humans will experience beta cell failure and insulin levels will no longer be sufficient to maintain normal glycemia. Once this process begins, fasting and post-prandial hyperglycemia and eventually overt diabetes is the result. Mice fed a high fat diet do not develop the progressive beta cell failure seen in human diabetes [
8], so diet induced obesity mouse models do not develop overt T2D as is the case in the human disease.
Metabolic studies performed in rodents from different research labs have yielded some variable results. There are many reasons why this may be the case, such as gender, age, mouse substrain, use of anesthetics among others. Whether or not the different high fat diets used to induce obesity and insulin resistance in mice contributes to this variation may also be discussed. Other diets which are proposed to more closely mimic human diets have been described [
15,
16,
17]. Although all of the diets are reported to induce obesity, the amount and source (animal or vegetable) of fat and the composition of other macronutrients are different in different diets. It is likely that differences in the type and composition of different macronutrients in the diets could induce glucose intolerance and/or beta cell dysfunction in different manners, although this has not been investigated thoroughly. In order to determine which dietary regime results in the most appropriate mouse model for studies on obesity, glucose intolerance and islet adaptation to insulin resistance, the diets need to be evaluated in head to head comparisons. This study describes a head to head comparison of the two most commonly utilized diet induced obesity models for the study of obesity and type 2 diabetes, with a focus on the increased insulin secretion in response to insulin resistance as the primary endpoint.
3. Results
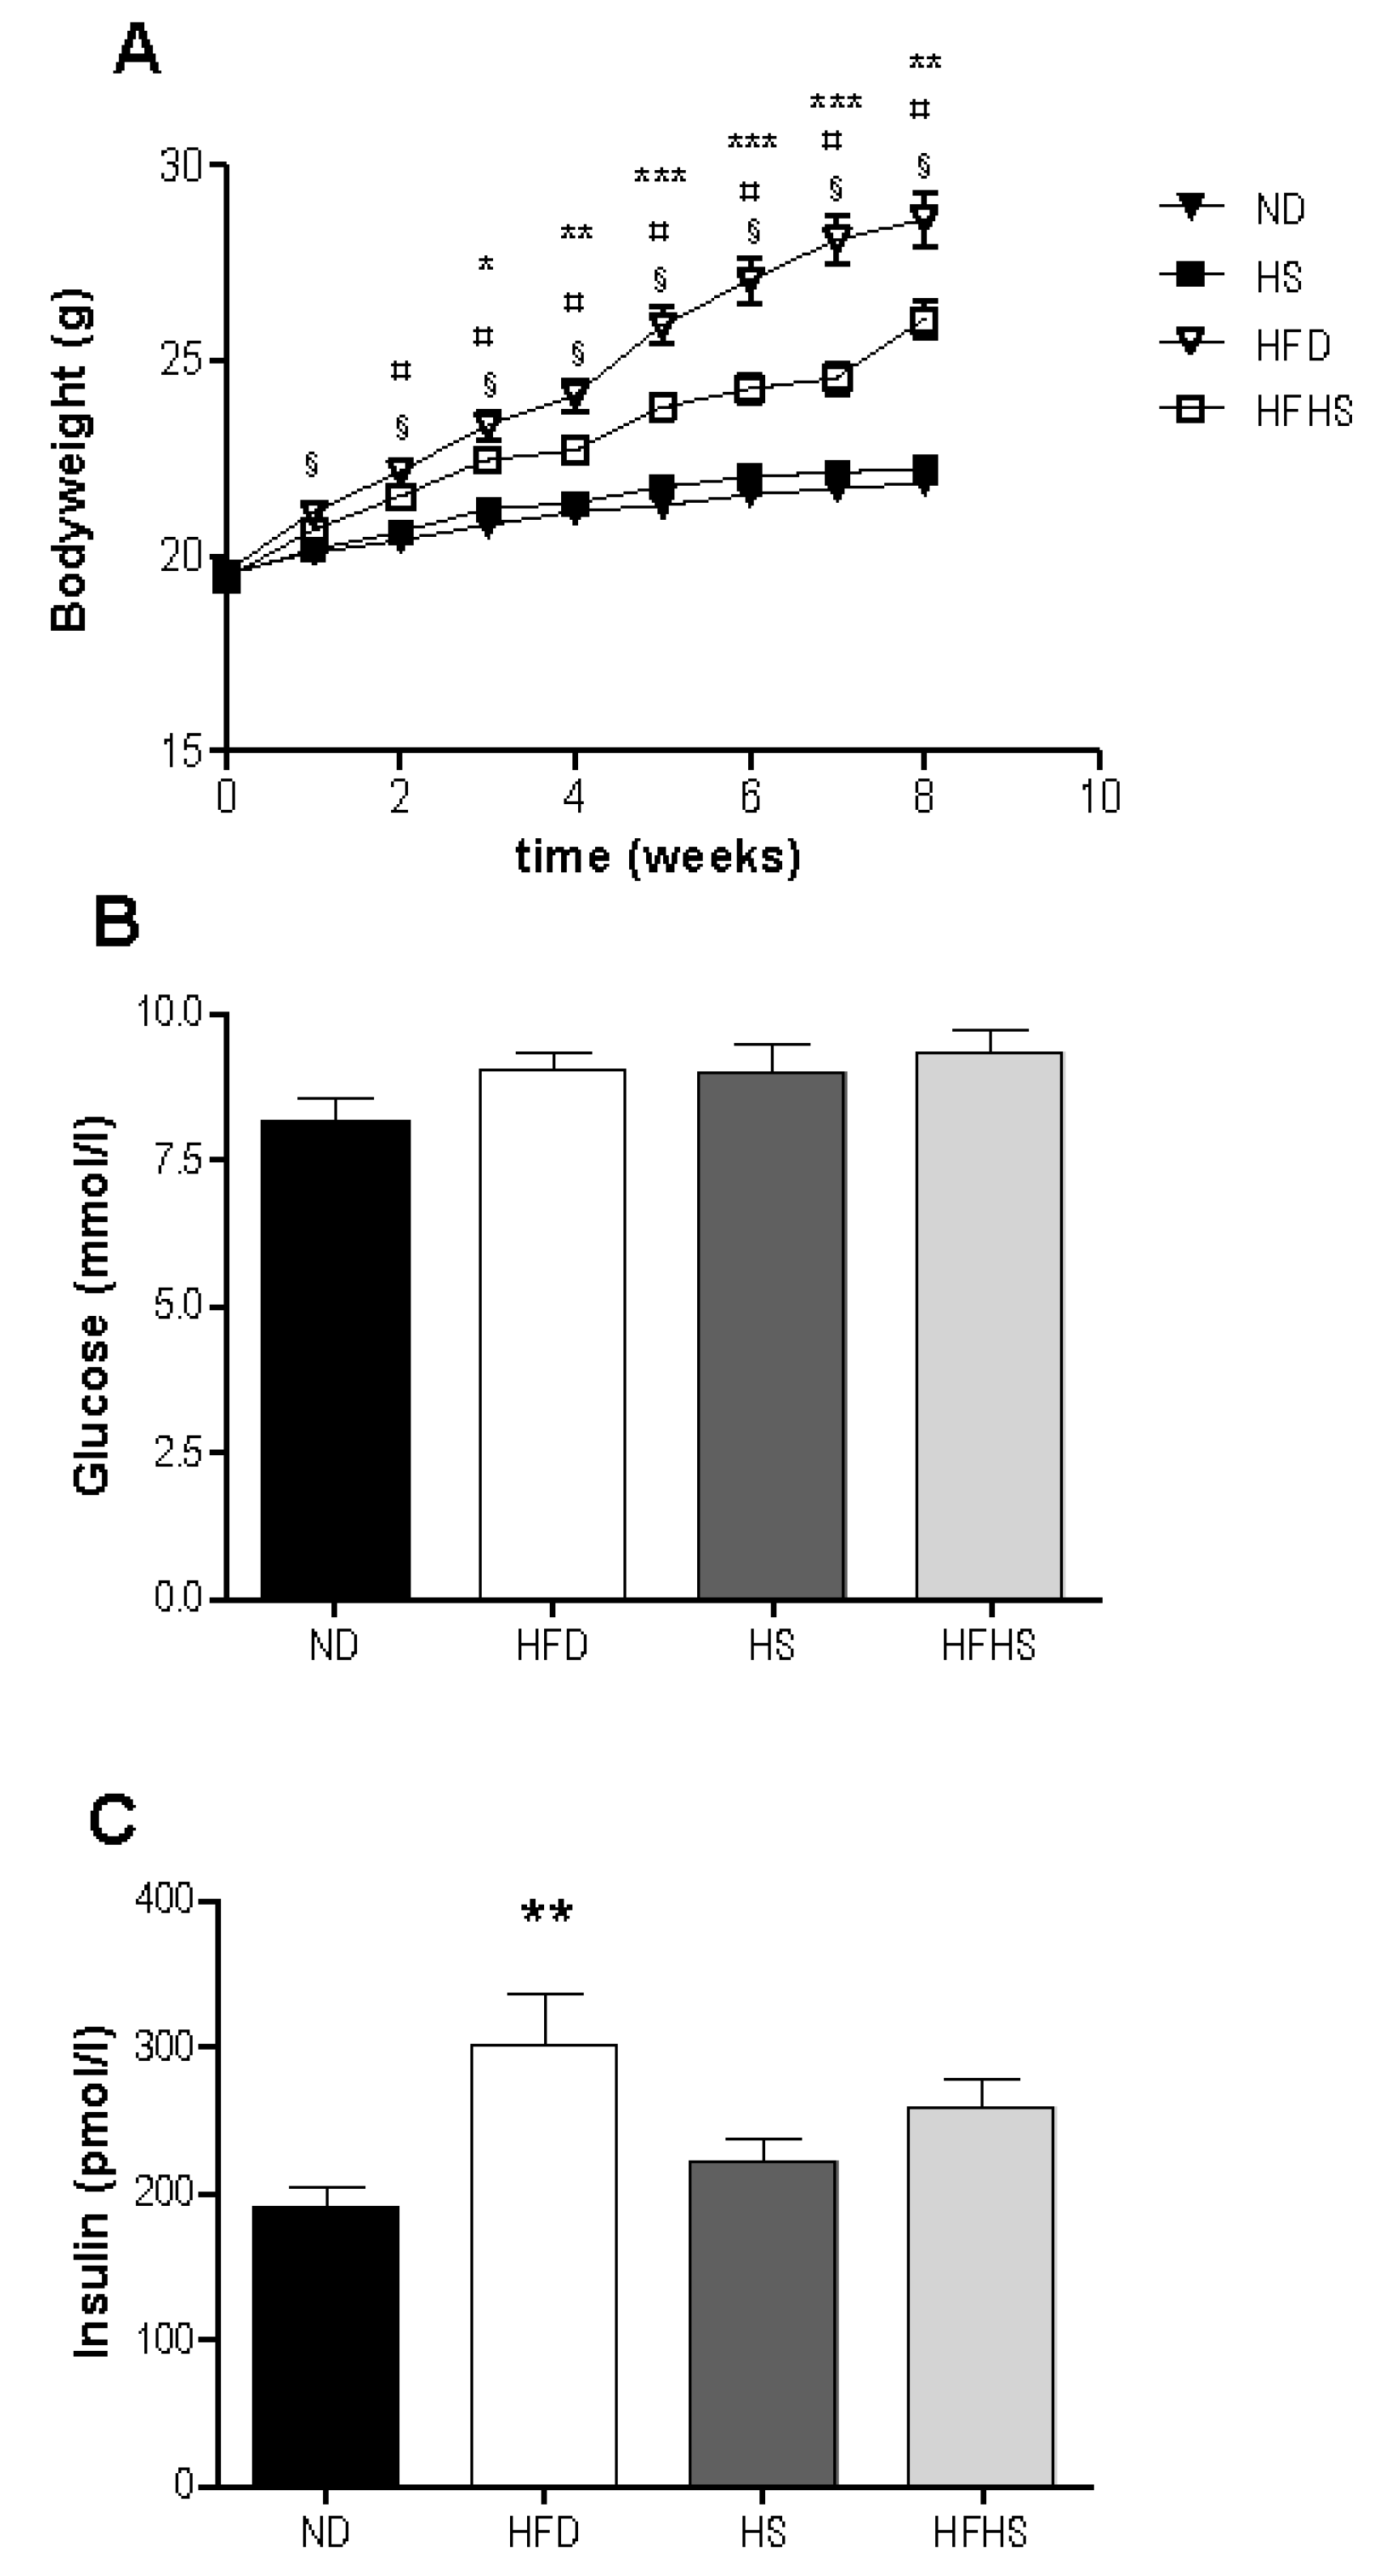
There was an increase in bodyweight in response to high fat feeding in both groups with significant differences between the high fat diet groups and their respective low fat controls evident after only two weeks (
Figure 1A). The high fat diet fed group gained significantly more weight than did the high fat-high sucrose diet group, despite consuming nearly identical amounts of energy (2695 ± 88 kJ
vs. 2646 ± 153 kJ). Food consumption was not significantly different between the diet groups (
Table 2). Metabolic efficiency was lower in both high fat diet groups than in their respective normal diet controls, but there were no significant differences between high fat diet groups (
Table 3). Feed efficiency was greater in both high fat diet models compared to their respective controls. In addition high fat diet fed mice had significantly higher feed efficiency than the high fat-high sucrose diet fed mice (
Table 3).
Basal glucose levels were not significantly different between any of the diet groups (
Figure 1B). Basal insulin levels were significantly higher in the high fat diet group than in the normal diet group, but not significantly different between the high sucrose control and high fat-high sucrose diet groups (
Figure 1C).
Figure 1.
Weight gain and basal blood glucose and insulin, (A) Bodyweight was measured once weekly for the 8 week study period. n = 34 per diet group, § p < 0.001 normal rodent diet (ND) vs. high fat diet (HFD), ¤ p < 0.01 high sucrose control diet (HS) vs. high fat-high sucrose Surwit diet (HFHS), * p < 0.05, ** p < 0.01, *** p < 0.001 HFD vs. HFHS. Blood samples were taken from the retrobulbar intraorbital plexus after a 5 h fast and plasma was assayed for glucose (B) and insulin (C). n = 11–12 per diet group, ** p < 0.01.
Table 3.
Feed consumption, metabolic efficiency and feed efficiency.
Table 3.
Feed consumption, metabolic efficiency and feed efficiency.
| Feed Consumption | ND | HFD | HS | HFHS |
|---|
| g/mouse | 132 ± 3 | 123 ± 4 | 133 ± 5 | 114 ± 7 b,c |
| kcal/mouse | 509 ± 13 | 644 ± 21 a | 542 ± 20 | 632 ± 36 |
| kJ/mouse | 2132 ± 55 | 2695 ± 87 a | 2268 ± 86 | 2646 ± 153 |
| Weight gain (g) | 2.2 ± 0.4 | 9.5 ± 0.8 a | 2.8 ± 0.2 | 6.7 ± 0.4 b |
| Metabolic efficiency (kJ/g) | 869 ± 91 | 291 ± 20 a | 767 ± 25 | 407 ± 51 b |
| Feed efficiency (g/kcal) | 0.4 ± 0.1 | 1.5 ± 0.1 a | 0.5 ± 0.03 | 1.1 ± 0.1 b,c |
Figure 2.
Intravenous glucose tolerance tests (IVGTT). 0.35g/kg bw D-glucose was injected into the tail vein and blood was sampled from the retrobulbar intraorbital plexus at 0, 1, 5, 10, 20, 50 and 75 min. (A) Plasma glucose concentrations during the IVGTT. (B) Incremental area under the curve for glucose from 0 to 50 min after the glucose injection. (C) The glucose elimination constant KG was determined as the rate of change in the logarithmic glucose concentration between 5 and 20 min after the glucose injection. (D) Plasma insulin concentrations during the IVGTT. (E) Incremental area under the curve (AUC) for insulin from 0 to 50 min after the glucose injection. (F) The acute insulin response (AIR) calculated as the mean of the suprabasal 1 and 5 min plasma insulin values. n = 11–12 per diet group, * p < 0.05, ** p < 0.01.
Intravenous glucose tolerance tests were performed after 8 weeks of feeding with the respective diets. Plasma glucose was significantly elevated during the 75 min IVGTT in the high fat diet group compared to the normal diet control, whereas there were no significant differences in plasma glucose levels between the high fat-high sucrose diet and the high sucrose control diet groups (
Figure 2A,B). Glucose tolerance, as assessed by the glucose elimination constant KG, was however significantly impaired in both high fat diet groups compared to their respective controls (
Figure 2C). Insulin secretion varied significantly between the two diet models (
Figure 2D,E). The incremental area under the curve (AUC) for insulin was similar between the normal and high fat diet groups, whereas there was a 2.7 fold increase in AUC in the high fat-high sucrose group compared to the high sucrose control diet group (
Figure 2E). The acute insulin response (AIR) to the glucose challenge was not different between the normal diet and the high fat diet groups, but it was significantly higher in the high fat-high sucrose group than in the high sucrose control diet group (
Figure 2F). Surprisingly, the high sucrose control diet group had a lower acute insulin response than the normal diet group, although this did not reach statistical significance (
p = 0.069) (
Figure 2F).
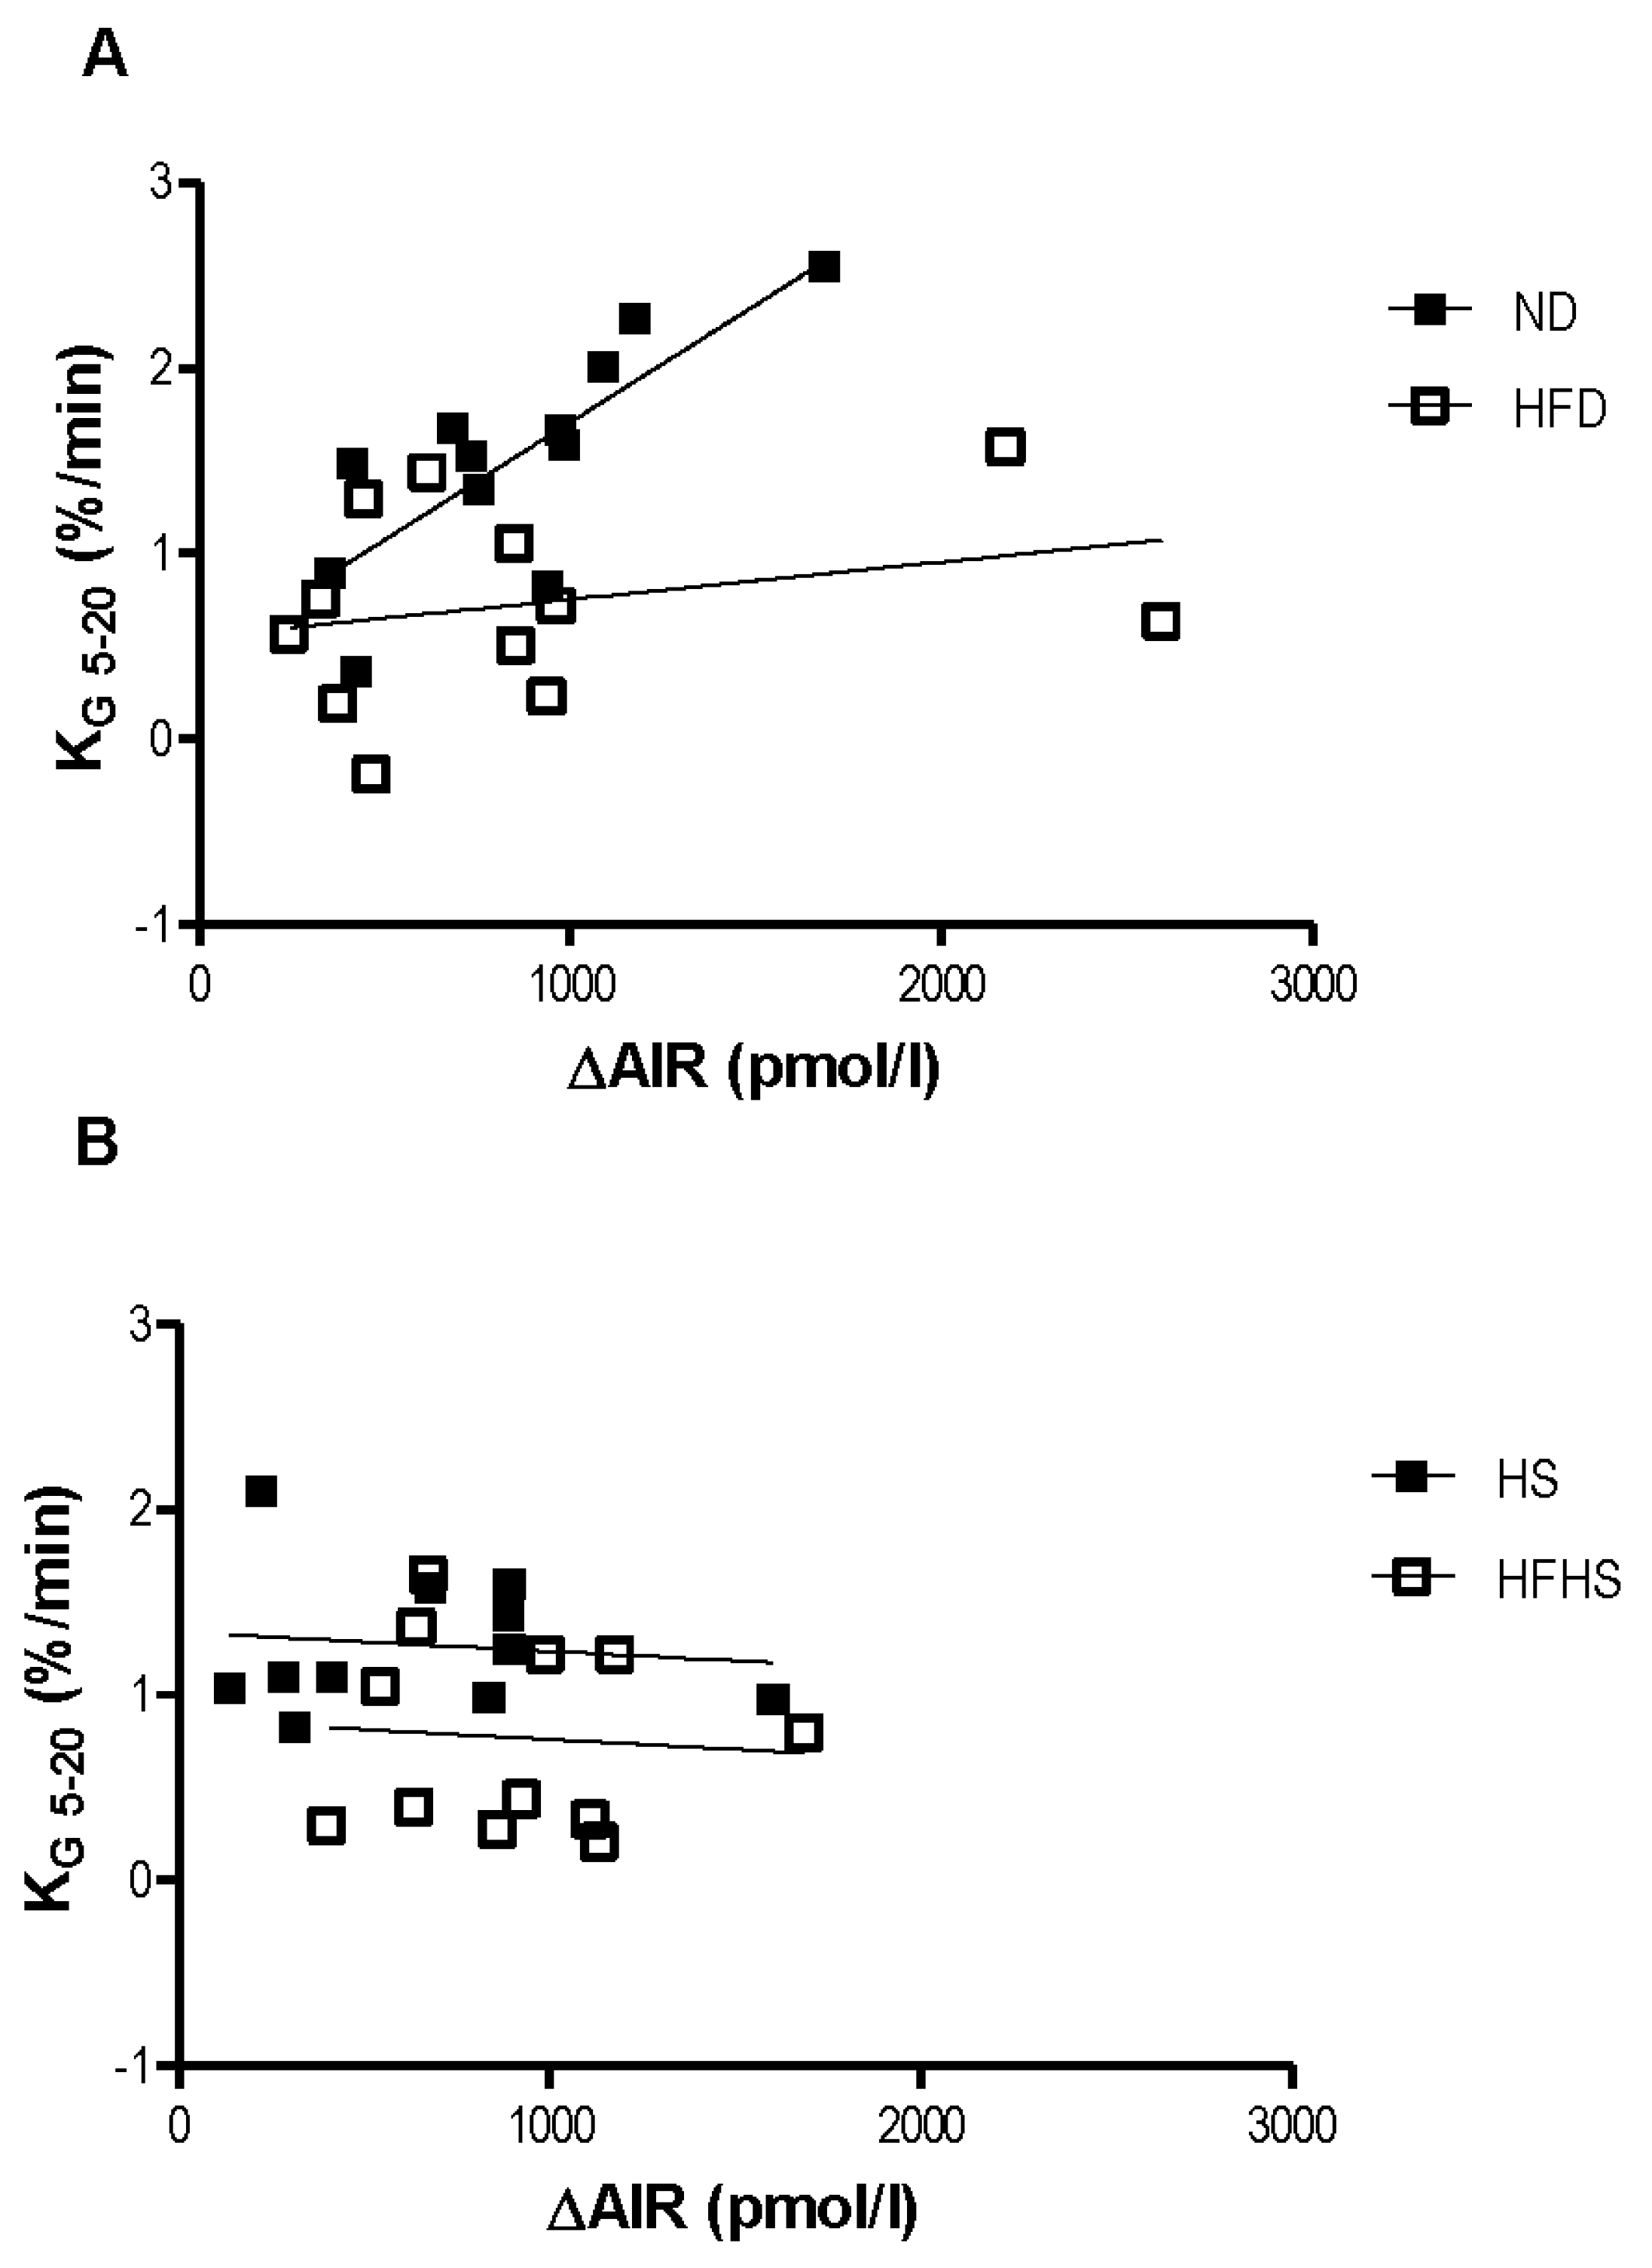
The relationship between the acute insulin response to the glucose challenge and the rate of glucose elimination was dramatically different between the two diet models. In the normal diet group the rate of glucose elimination (KG) positively correlated with the acute insulin response (
Figure 3A). This positive correlation is nearly ablated in the high fat diet group (
Figure 3A). Surprisingly, there was no relationship at all between KG and the acute insulin response in either of the high sucrose diet groups (
Figure 3B).
Figure 3.
Relationship between insulin secretion and glucose clearance. Linear regressions between the glucose elimination rate (KG) and the acute insulin response (ΔAIR) for the normal and high fat diet groups (A) and the Surwit high sucrose and high-fat high sucrose diet groups (B). n = 11–12 per group.
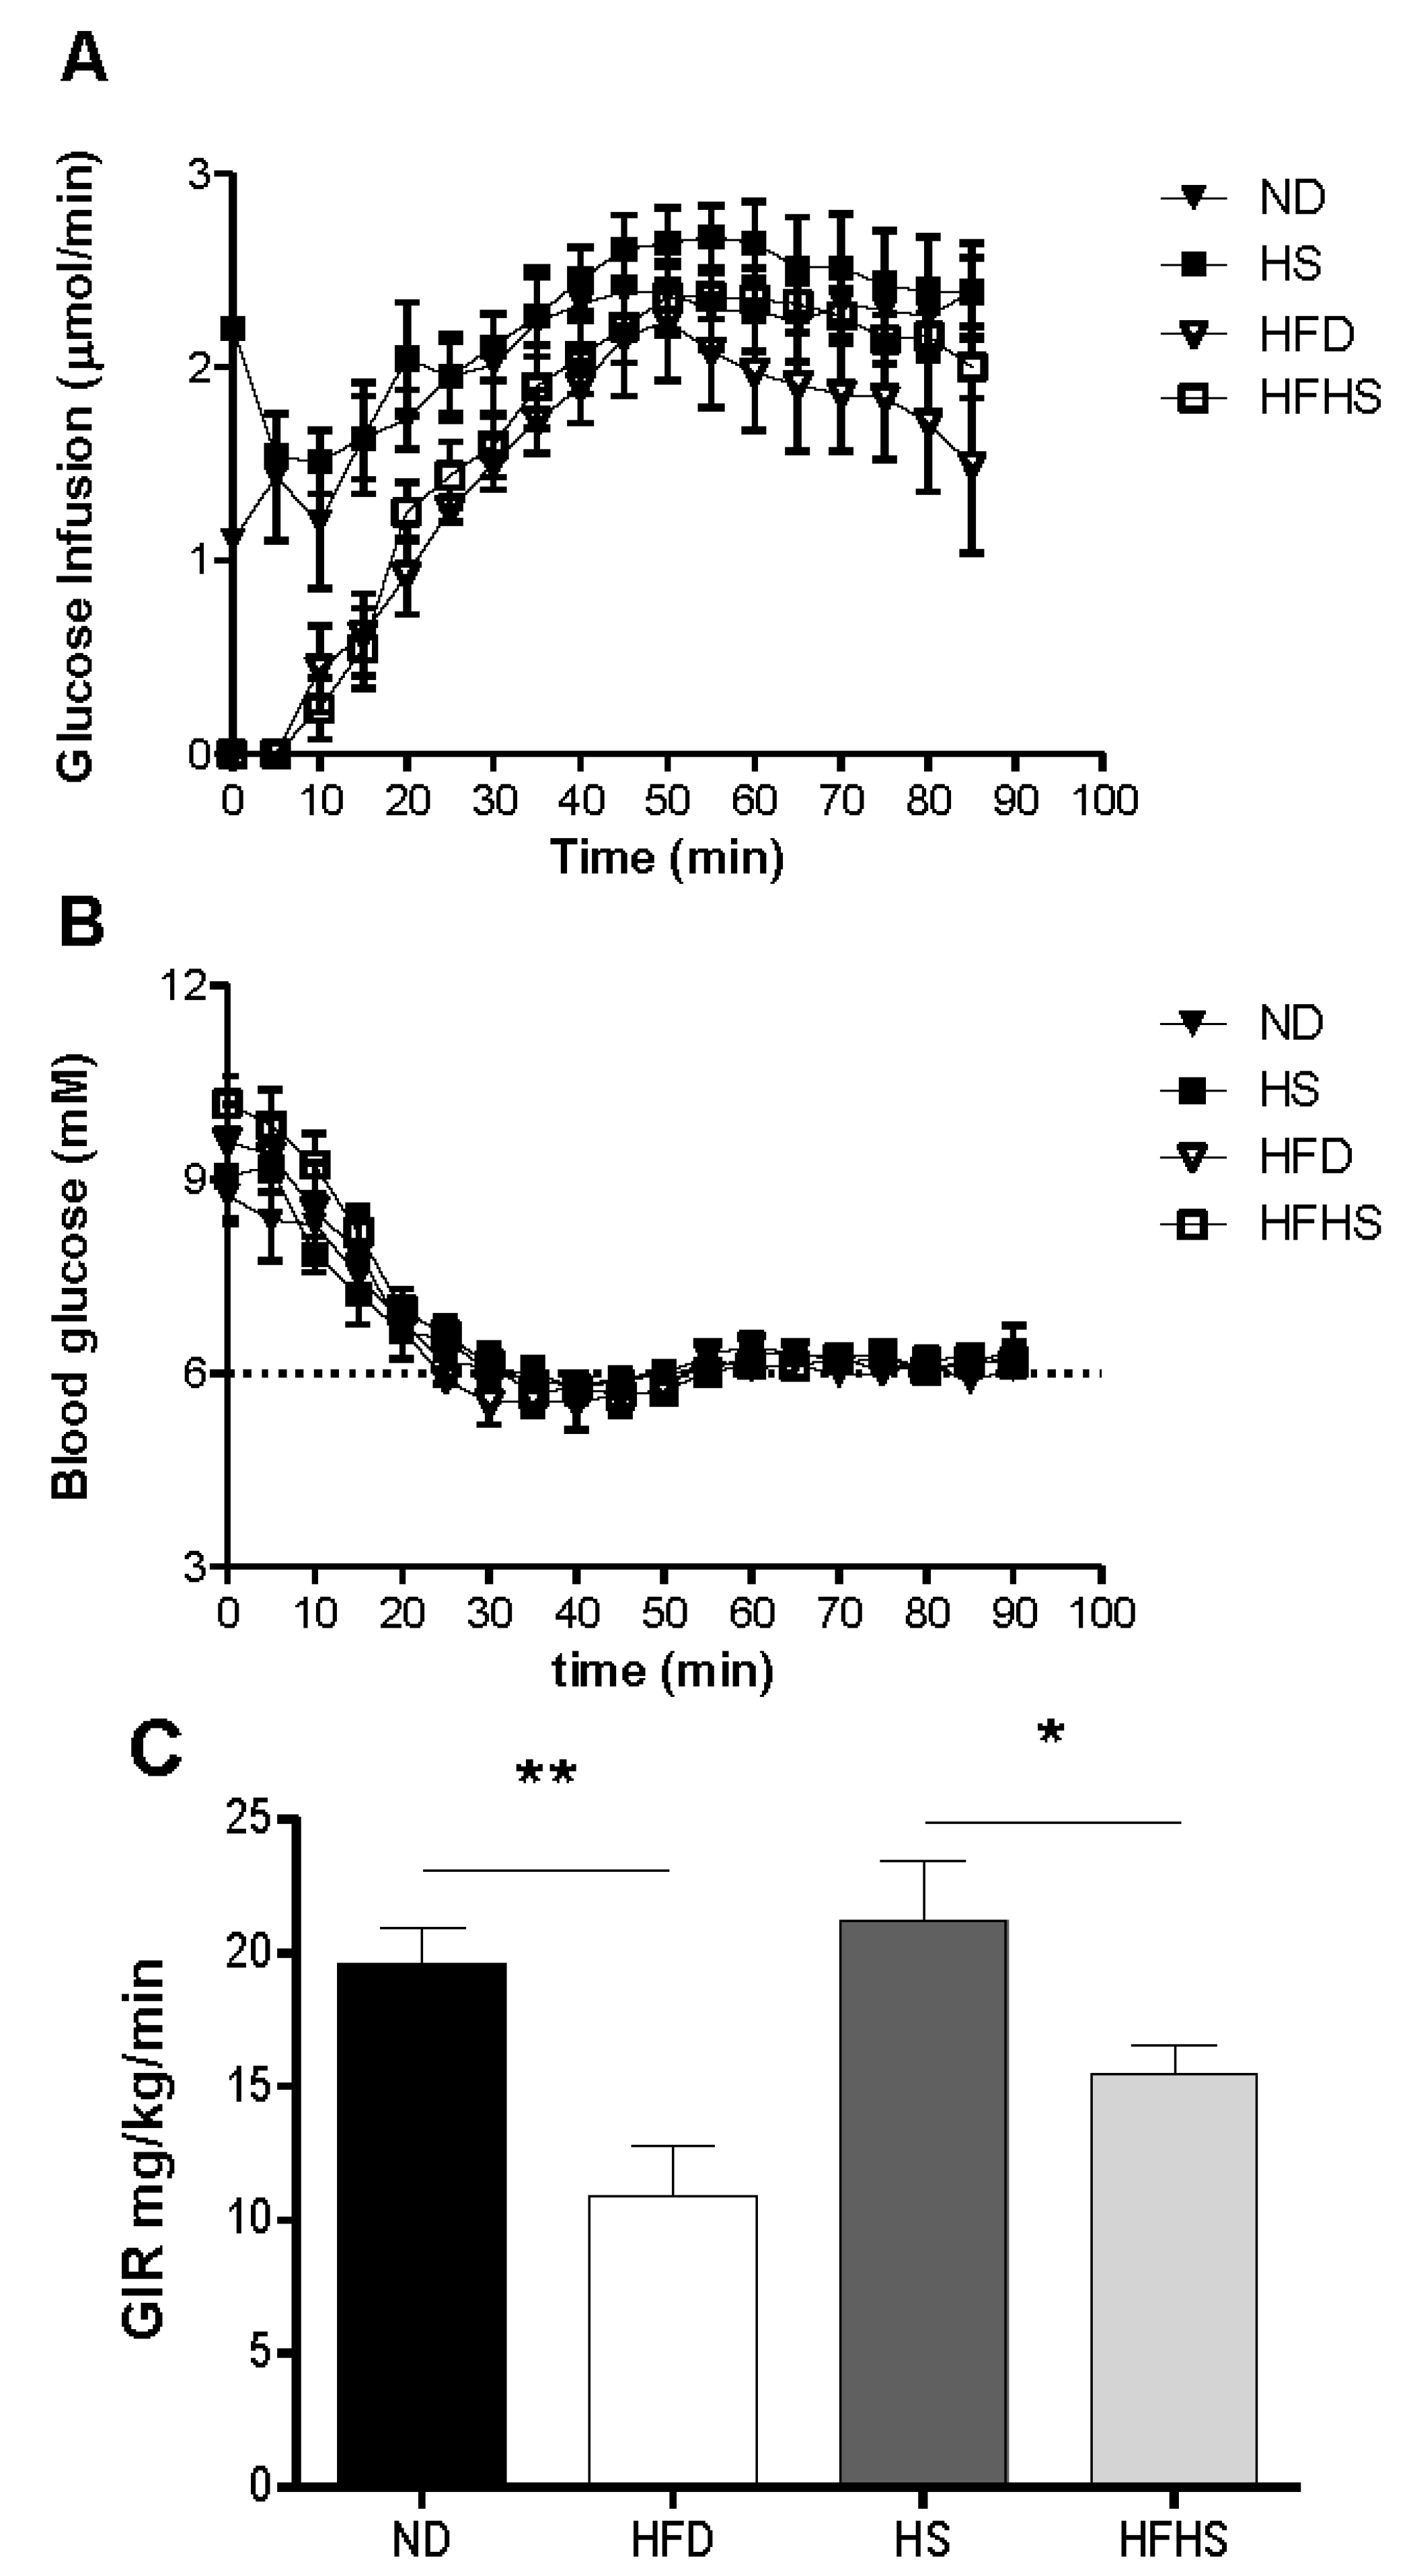
A most critical property of any diet induced obesity model used to study T2D, is the induction of insulin resistance by the diet. We evaluated this by the euglycemic-hyperinsulinemic clamp, which is the most accurate method for determining insulin sensitivity. Mice that had been fed one of each of the experimental diets were subjected to euglycemic-hyperinsulinemic clamp studies. A variable rate of glucose was infused (
Figure 4A) to reach a steady state blood glucose concentration of 6 mM during the final 30 min of the clamp (
Figure 4B). The glucose infusion rate for the high fat diet group was 80% lower than that of the normal diet group (
Figure 4C). The glucose infusion rate in the high fat-high sucrose diet group however, was only 37% lower than that of the high sucrose control diet group (
Figure 4C). Insulin sensitivity can be more accurately assessed by the M/I ratio, which relates the total amount of glucose infused to the final concentration of plasma insulin. The M/I ratio for the high fat diet group was 4-fold lower than that of the normal diet group, whereas in the high fat-high sucrose diet group the M/I ratio was only 1.9 fold lower than the high sucrose control diet group and did not reach statistical significance (
Figure 5A). Both of the high sucrose diet groups had slightly higher M/I ratios than their respective low sucrose diet groups, which was significant between diet groups receiving high fat (
Figure 5A). The blood insulin level at the end of the 90 min euglycemic-hyperinsulinemic clamp (clamp insulin) was significantly elevated for the HFD group compared to all other groups (
Figure 5B).
Figure 4.
Insulin sensitivity determined by euglycemic-hyperinsulinemic clamp. Anesthetized mice received continuous infusion of insulin (15 mU kg−1·min−1) and variable infusion of glucose to maintain blood glucose between 5.5 and 6.5 mM. (A) The glucose infusion rate for the entire 90 min. (B) The blood glucose concentration during the 90 min clamp. (C) The mean glucose infusion rate (GIR) for the 60–90 min steady state. n = 6–7 per group.
Figure 5.
The M/I index derived from the euglycemic-hyperinsulinemic clamp. (A) M/I expressed as the ratio of glucose infused (M) to the plasma concentration of insulin (I) at the end of the clamp experiment (90 min). (B) The plasma insulin concentration at 90 min. n = 6–7 per group, * p < 0.05, ** p < 0.01.
4. Discussion
Diet induced obesity mouse models are used for the development of treatments for many of the co-morbidities of obesity including type 2 diabetes. Two diet induced obesity models frequently used in the study of type 2 diabetes, the 60% high fat diet and the Surwit high fat-high sucrose diet, were evaluated in a head to head comparison of their potential to induce glucose intolerance. The most commonly used mouse strain for the study of diet induced obesity is the C57BL/6 strain, which has been shown to become obese and glucose intolerant after short term feeding with high fat diets [
7]. It should be noted that there are many substrains of C57BL/6 and the choice of substrain for this type of study should be carefully considered. The C57BL6/J BomTac line used in this study is derived from the original C57BL6/J line from the Jackson laboratory in Bar Harbor Maine. The C57BL6/J Bom line diverged from the C57BL6/J line in 1971 when it was shipped to Hamburg Germany and the C57BL6/J BomTac line diverged in 1988 when it was sent to Skensved Denmark. At some point between 1976 and 1984 a mutation in the Nicotinamide Nucleotide Transhydrogenase (Nnt) gene arose in the C57BL/6J colony at the Jackson laboratory. This mutation is reported to affect glucose homeostasis and insulin secretion [
19]. As the C57BL6/J Bom line was derived at least five years prior to emergence of the mutation, they do not contain the Nnt mutation. This has been confirmed by PCR genotyping. As the point of our study is to determine how the different diets affect beta cell function and adaptation to insulin resistance it is important that there are no genetic factors in the C57BL6 strain used that could affect these parameters.
There are many differences between the diets including the macronutrient composition. Although the two diet models have nearly identical amounts of dietary kilocalories from fat, the sources of fat differ between all of the diets (
Table 2). The normal rodent diet contains approximately equal amounts of kilocalories from animal fat (lard) and vegetable oils (soybean oil). The Surwit diets obtain all of their fat kilocalories from vegetable oils (coconut and soybean oils). This is of relevance for the high fat diets in particular as lard, which is the primary fat source in the high fat diet, has a much different fatty acid composition than coconut oil, the primary fat source in the high fat-high sucrose diet (see
Table 2). The different sources of fat are likely the main contributing factor to the differences in weight gain between the two high fat diet models despite having the same energy intake. It has been shown that high fat diets rich in medium chain fatty acids result in less weight gain and adiposity than diets rich in long chain fatty acids. This is due to an increase in fat oxidation and energy expenditure in mice fed the medium chain fatty acid rich diet [
20]. The coconut oil based Surwit high fat high sucrose diet has 57% of its fat content from medium chain fatty acids, whereas the lard based high fat diet has virtually no (<0.5%) medium chain fatty acids. The most common fatty acids consumed by humans in a typical “western” diet are long chain fatty acids. In the Surwit high fat-high sucrose diet, 93% of the fat content is from saturated fatty acids. In contrast, the high fat diet obtains 32% of its fat content from saturated fatty acids. Certain fatty acids have been shown to induce lipotoxicity and dysfunction in beta cells [
21]. Chronic exposure to palmitate causes diminished glucose stimulated insulin secretion in isolated islets [
22]. The standard 60% high fat diet contains more than twice as much palmitate as does the high fat-high sucrose Surwit diet. In contrast the predominant saturated fatty acid in the Surwit high fat-high sucrose diet is laurate which has been shown to have a stimulatory effect on insulin secretion in perifused islets [
23].
There were several differences in the insulin secretory response to the glucose challenge in each of the diets. The acute insulin response to glucose was lower in the high sucrose diet group than in any other diet group. This suggests that the relatively high sucrose content of the Surwit control diet has a negative effect on beta cell function independent of dietary fat content. An inhibitory effect of sucrose on the acute insulin response was suggested, but not demonstrated, previously in mice fed high sucrose diets for long periods of time [
24]. However in that study oral glucose tolerance tests were used. We decided to use intravenous, as opposed to oral, glucose tolerance tests as intravenous administration of glucose results in direct (<30 s) exposure of the beta cells to supraphysiological concentrations of glucose. This allows for the calculation of the AIR, glucose elimination constant KG and other data points that can be obtained from mathematical modeling of glucose and insulin dynamics. Thus the IVGTT provides powerful tools for determining beta cell function. Oral glucose tolerance tests, while physiological in route of delivery, do not result in direct exposure of the beta cells to glucose as gastric emptying rate, glucose absorption and incretin effects are major factors determining the insulin secretion response to the glucose challenge.
Sucrose is a disaccharide consisting of a glucose monomer and a fructose monomer connected by glycosidic linkage. Recently, the deleterious effects of a fructose rich diet on islet function were described [
25]. Mice fed a high fructose diet for 16 weeks had diminished glucose stimulated insulin secretion
ex-vivo and increased expression of pro-inflammatory cytokines in islets. The fructose component of sucrose may therefore be a contributing factor to the diminished acute insulin response seen in mice fed a high sucrose diet. The acute insulin response was not different between the two high fat diet models but there were differences in other measures of insulin secretion. Basal insulin was increased in the high fat diet group compared to the control group. Basal insulin in the high fat-high sucrose Surwit diet was not significantly different than in the high sucrose control diet. The increase in basal insulin secretion in response to consumption of a high fat diet in mice corresponds to an increase in beta cell area [
11]. It is possible that there is a greater increase in beta cell area in mice fed a high fat diet than that of the high fat-high sucrose diet, although further studies need to be done to confirm this. The high fat-high sucrose diet group had a much higher incremental area under the curve for insulin during the first 50 min of the IVGTT than any of the other diet groups. This difference was primarily the result of the high fat-high sucrose fed group having significantly higher insulin levels after the insulin peak (5, 10, and 20 min). Whether this difference represents increased late stage insulin secretion or decreased insulin clearance in the high-fat diet group can only be definitively determined by C-peptide measurement. However, insulin levels after the euglycemic-hyperinsulinemic clamp were significantly lower in this group; therefore it is unlikely that higher insulin levels during the IVGTT would be the result of decreased insulin clearance. We noted that the high fat-high sucrose group had the highest AUC for insulin secretion even though there was a trend towards a decreased insulin secretion in the high sucrose group. As the HS diet contains 80% kcal from sucrose and the HFHS has 12.5% it is likely that the concentration of sucrose that the islets are exposed to in the HFHS diet is too low have the kind of deleterious effects on insulin secretion that are seen in the HS diet.
One method for evaluating beta cell function in the context of glucose tolerance is to compare the relationship between the acute insulin response to the intravenous glucose load and the corresponding rate of systemic glucose elimination. In mice fed a normal diet increases in the acute insulin response corresponded with increases in the rate of glucose elimination. This relationship was nearly ablated in mice fed a high fat diet as increases in the acute insulin response only resulted in minimal increases to the rate of glucose elimination. Surprisingly, this relationship was not seen at all in either of the high sucrose diets regardless of fat content. Increases in the acute insulin response did not change the rate of glucose elimination, which remained fairly constant across a range of AIR values. This was not a result of insulin resistance as these mice were more insulin sensitive than the high fat diet fed mice, as determined by the euglycemic-hyperinsulinemic clamp. The relationship between glucose elimination and insulin secretion in the high sucrose diet models will be examined in more detail in subsequent studies.
When evaluating diet-induced obesity models for the study of type 2 diabetes a most important factor for the model is the robust induction of insulin resistance. The euglycemic-hyperinsulinemic clamp was used to determine insulin sensitivity in the diet models, as in previous studies we have shown that high fat diet fed mice have insulin resistance as determined by this technique [
18]. We confirmed now that insulin resistance, as determined by the euglycemic clamp, was robustly induced after 8 weeks of feeding the high fat diet. In contrast, we found that there was a much more modest induction of insulin resistance with the high fat-high sucrose diet after 8 weeks. The M/I ratio was thus significantly higher in the high fat-high sucrose diet group than in the high fat diet group. This difference between the two diets, the mechanism of which needs to be explored in further studies, is important to acknowledge when selecting diet for experimental studies in obesity and diabetes.


