Effects of Glycerol and Creatine Hyperhydration on Doping-Relevant Blood Parameters

Abstract
:1. Introduction
2. Methods
2.1. Subjects
 max): 61.0 ± 4.0 mL·kg−1·min−1) gave their written informed consent to take part in the present study that was approved by the Ethics Committee for Non-Clinical Research Involving Human Subjects, University of Glasgow and was performed according to the code of ethics of the World Medical Association (Declaration of Helsinki).
2.2. Study Design: Supplementation
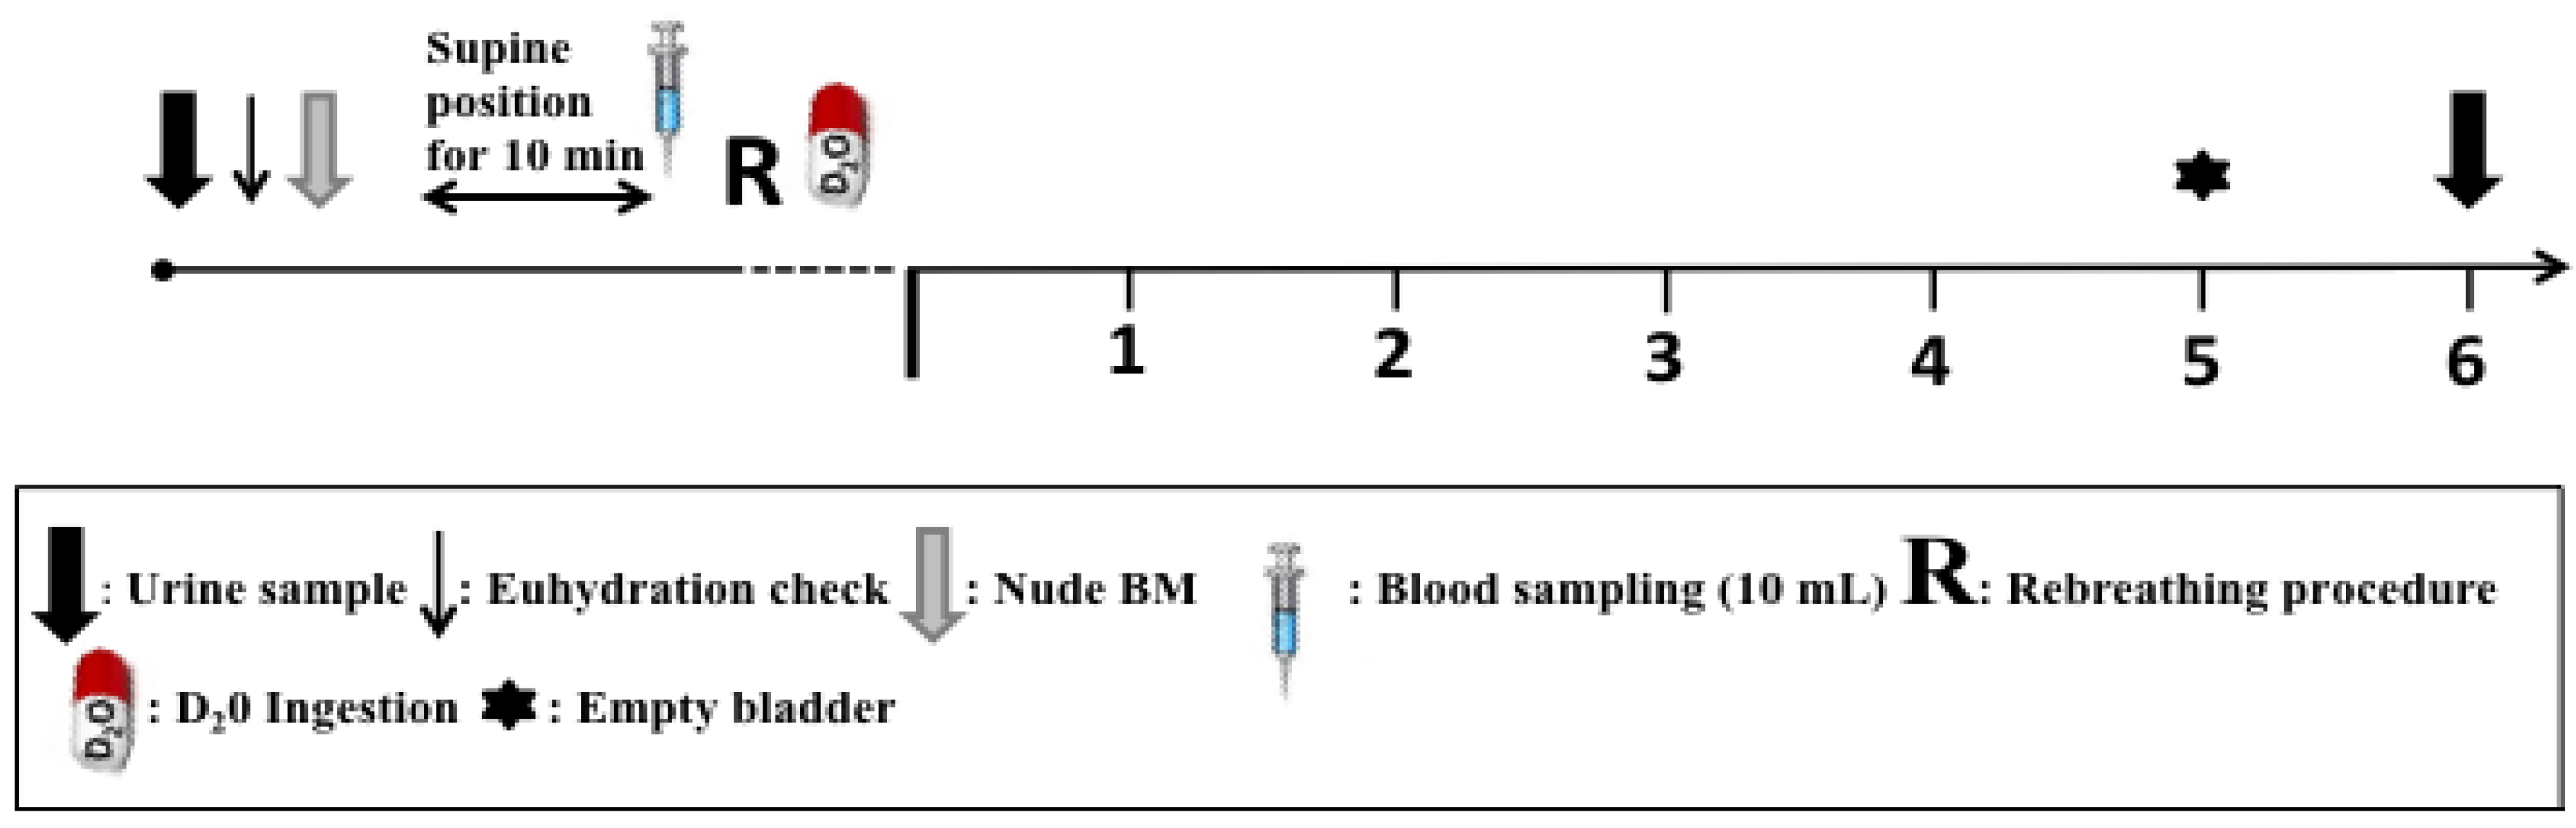
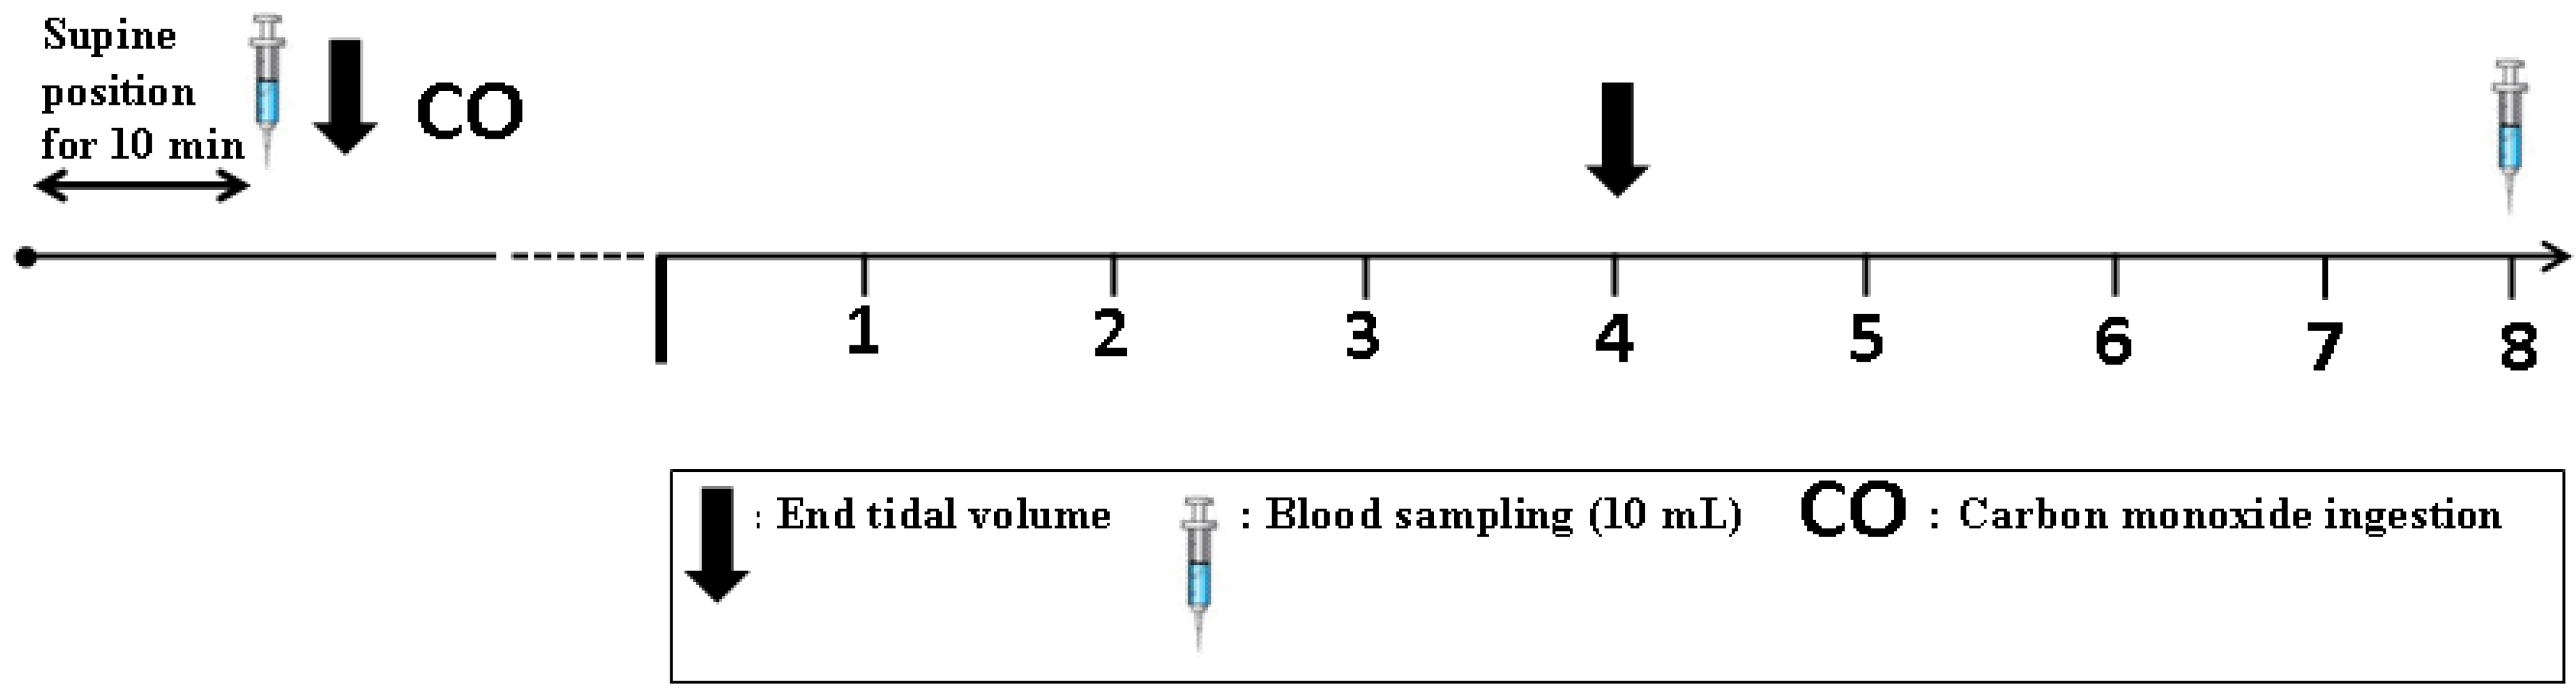
2.3. Procedures
2.4. Blood Treatment and Analysis
2.5. Total Hemoglobin Mass (tHb-Mass) Analysis
2.6. Blood Modeling Calculations


2.7. Gly Excretion Study
2.8. Statistical Analysis
3. Results
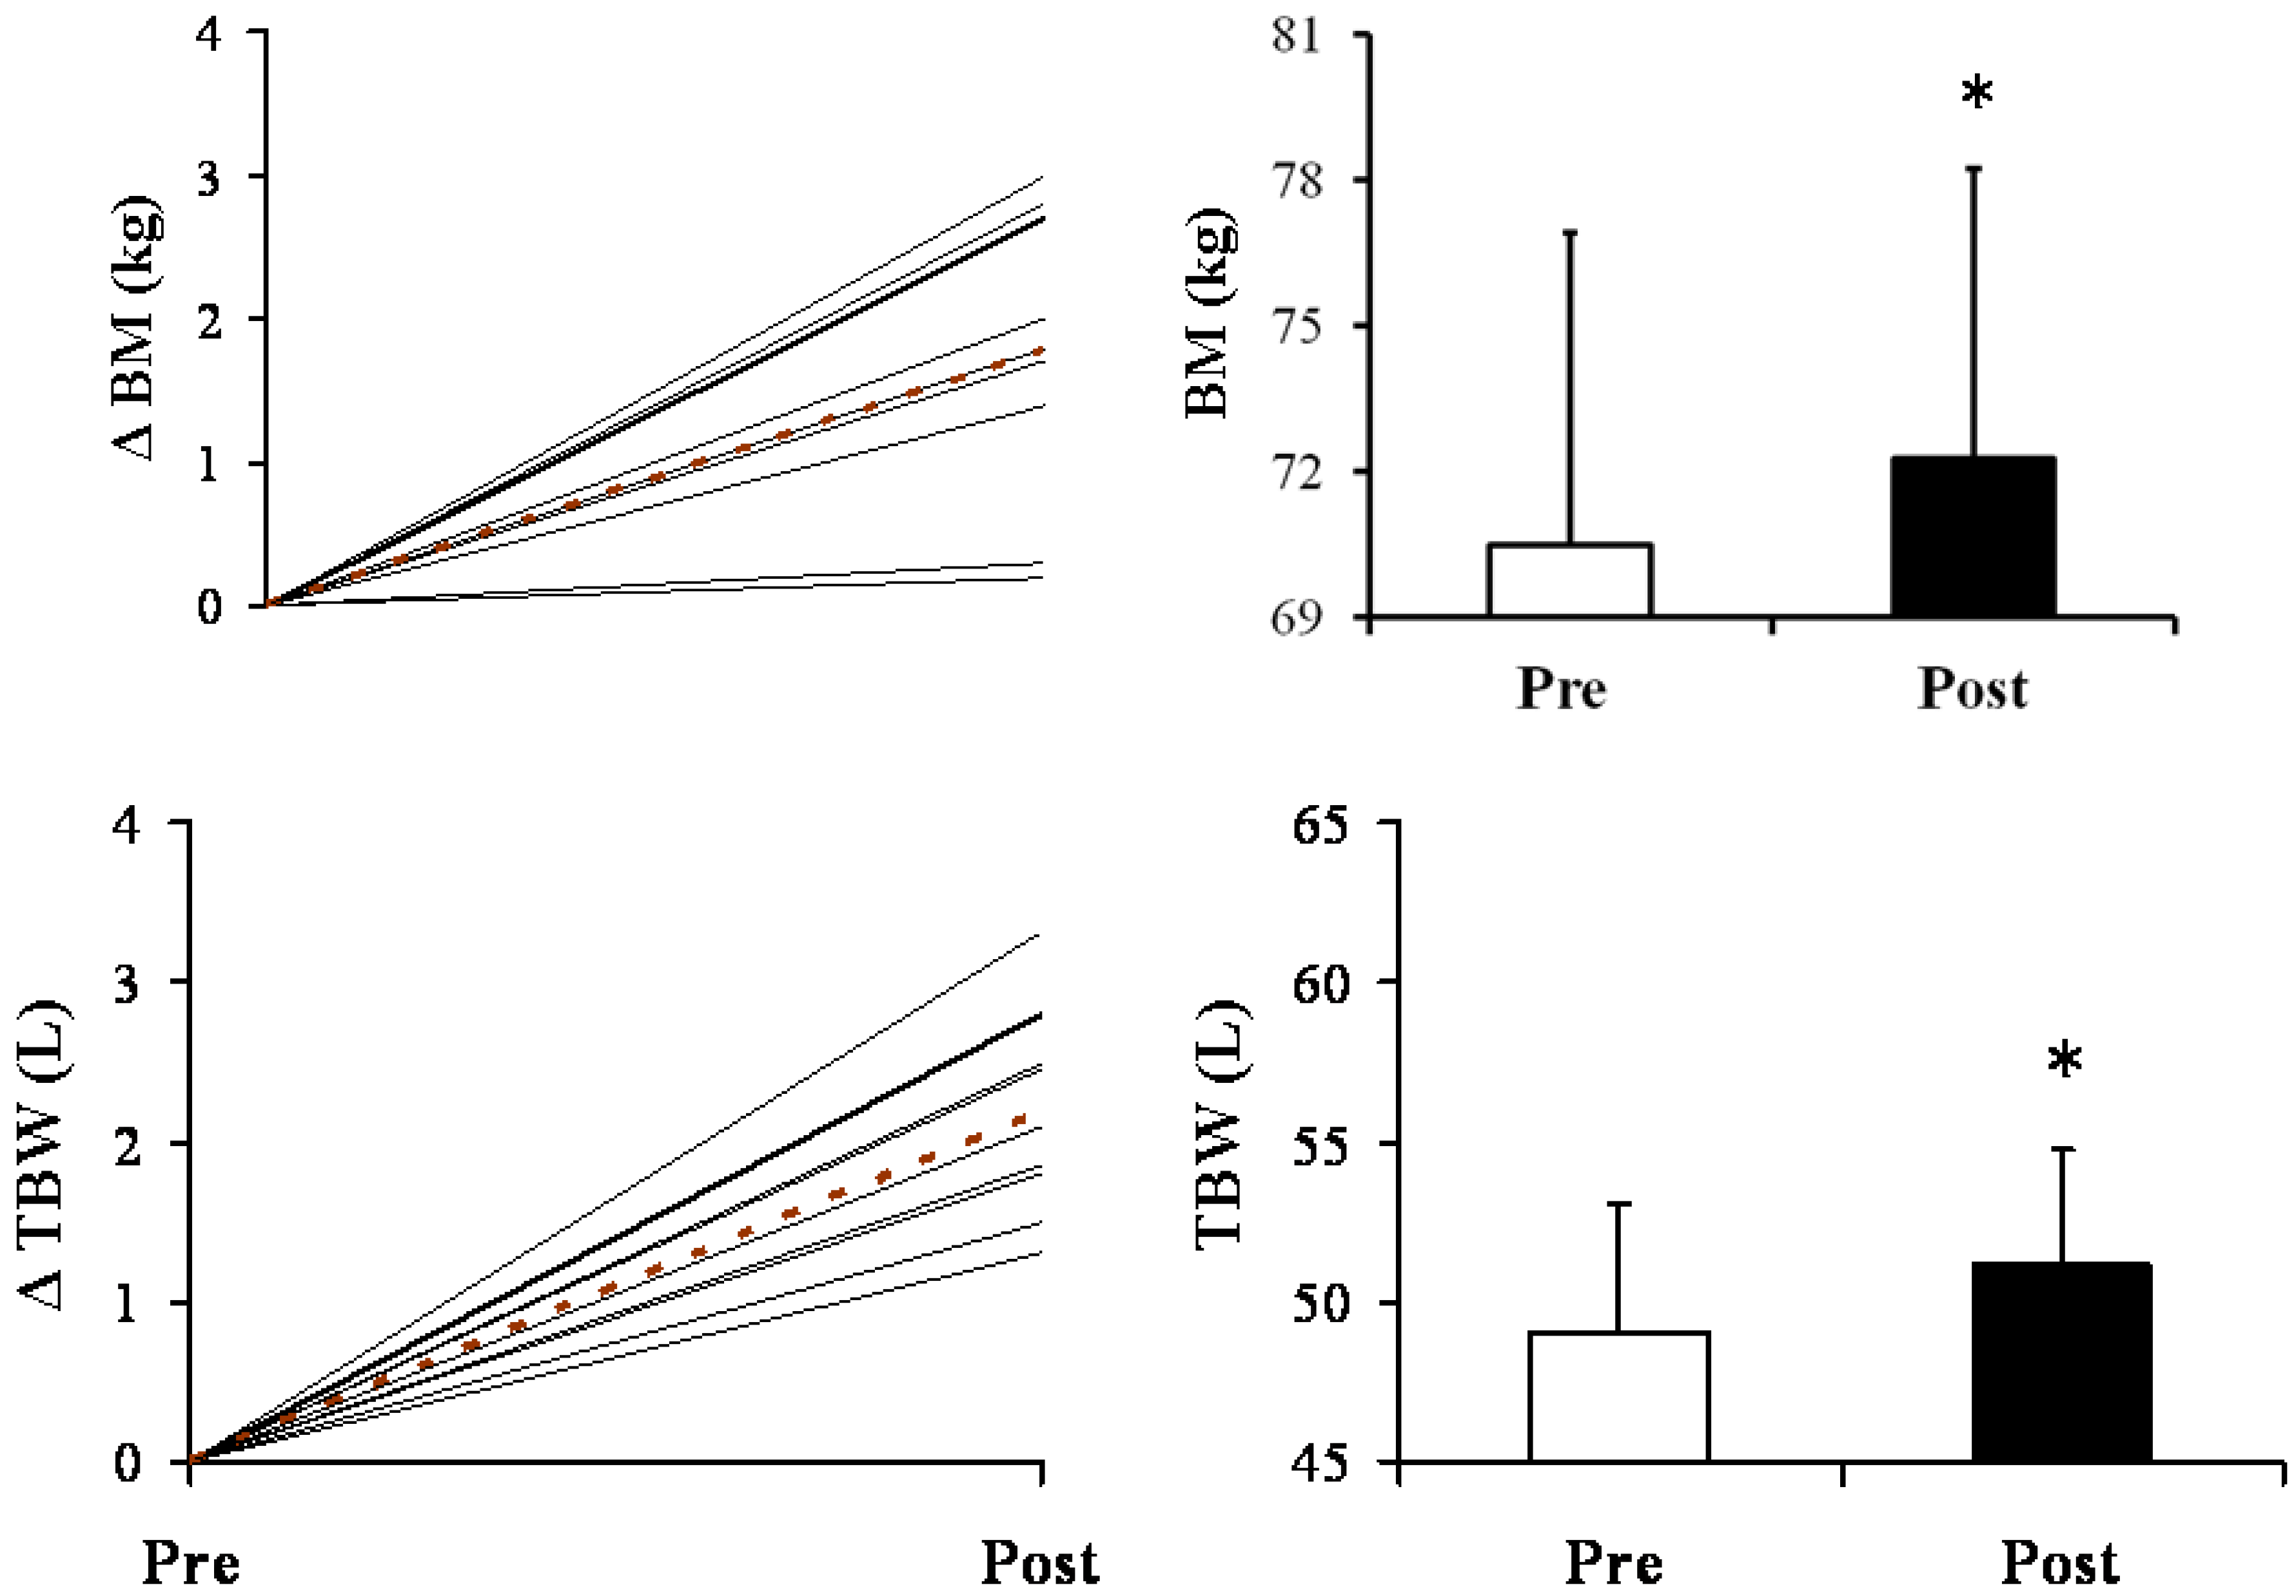
3.1. Main Study


| Doping Markers | Pre | Post | Mean Difference |
|---|---|---|---|
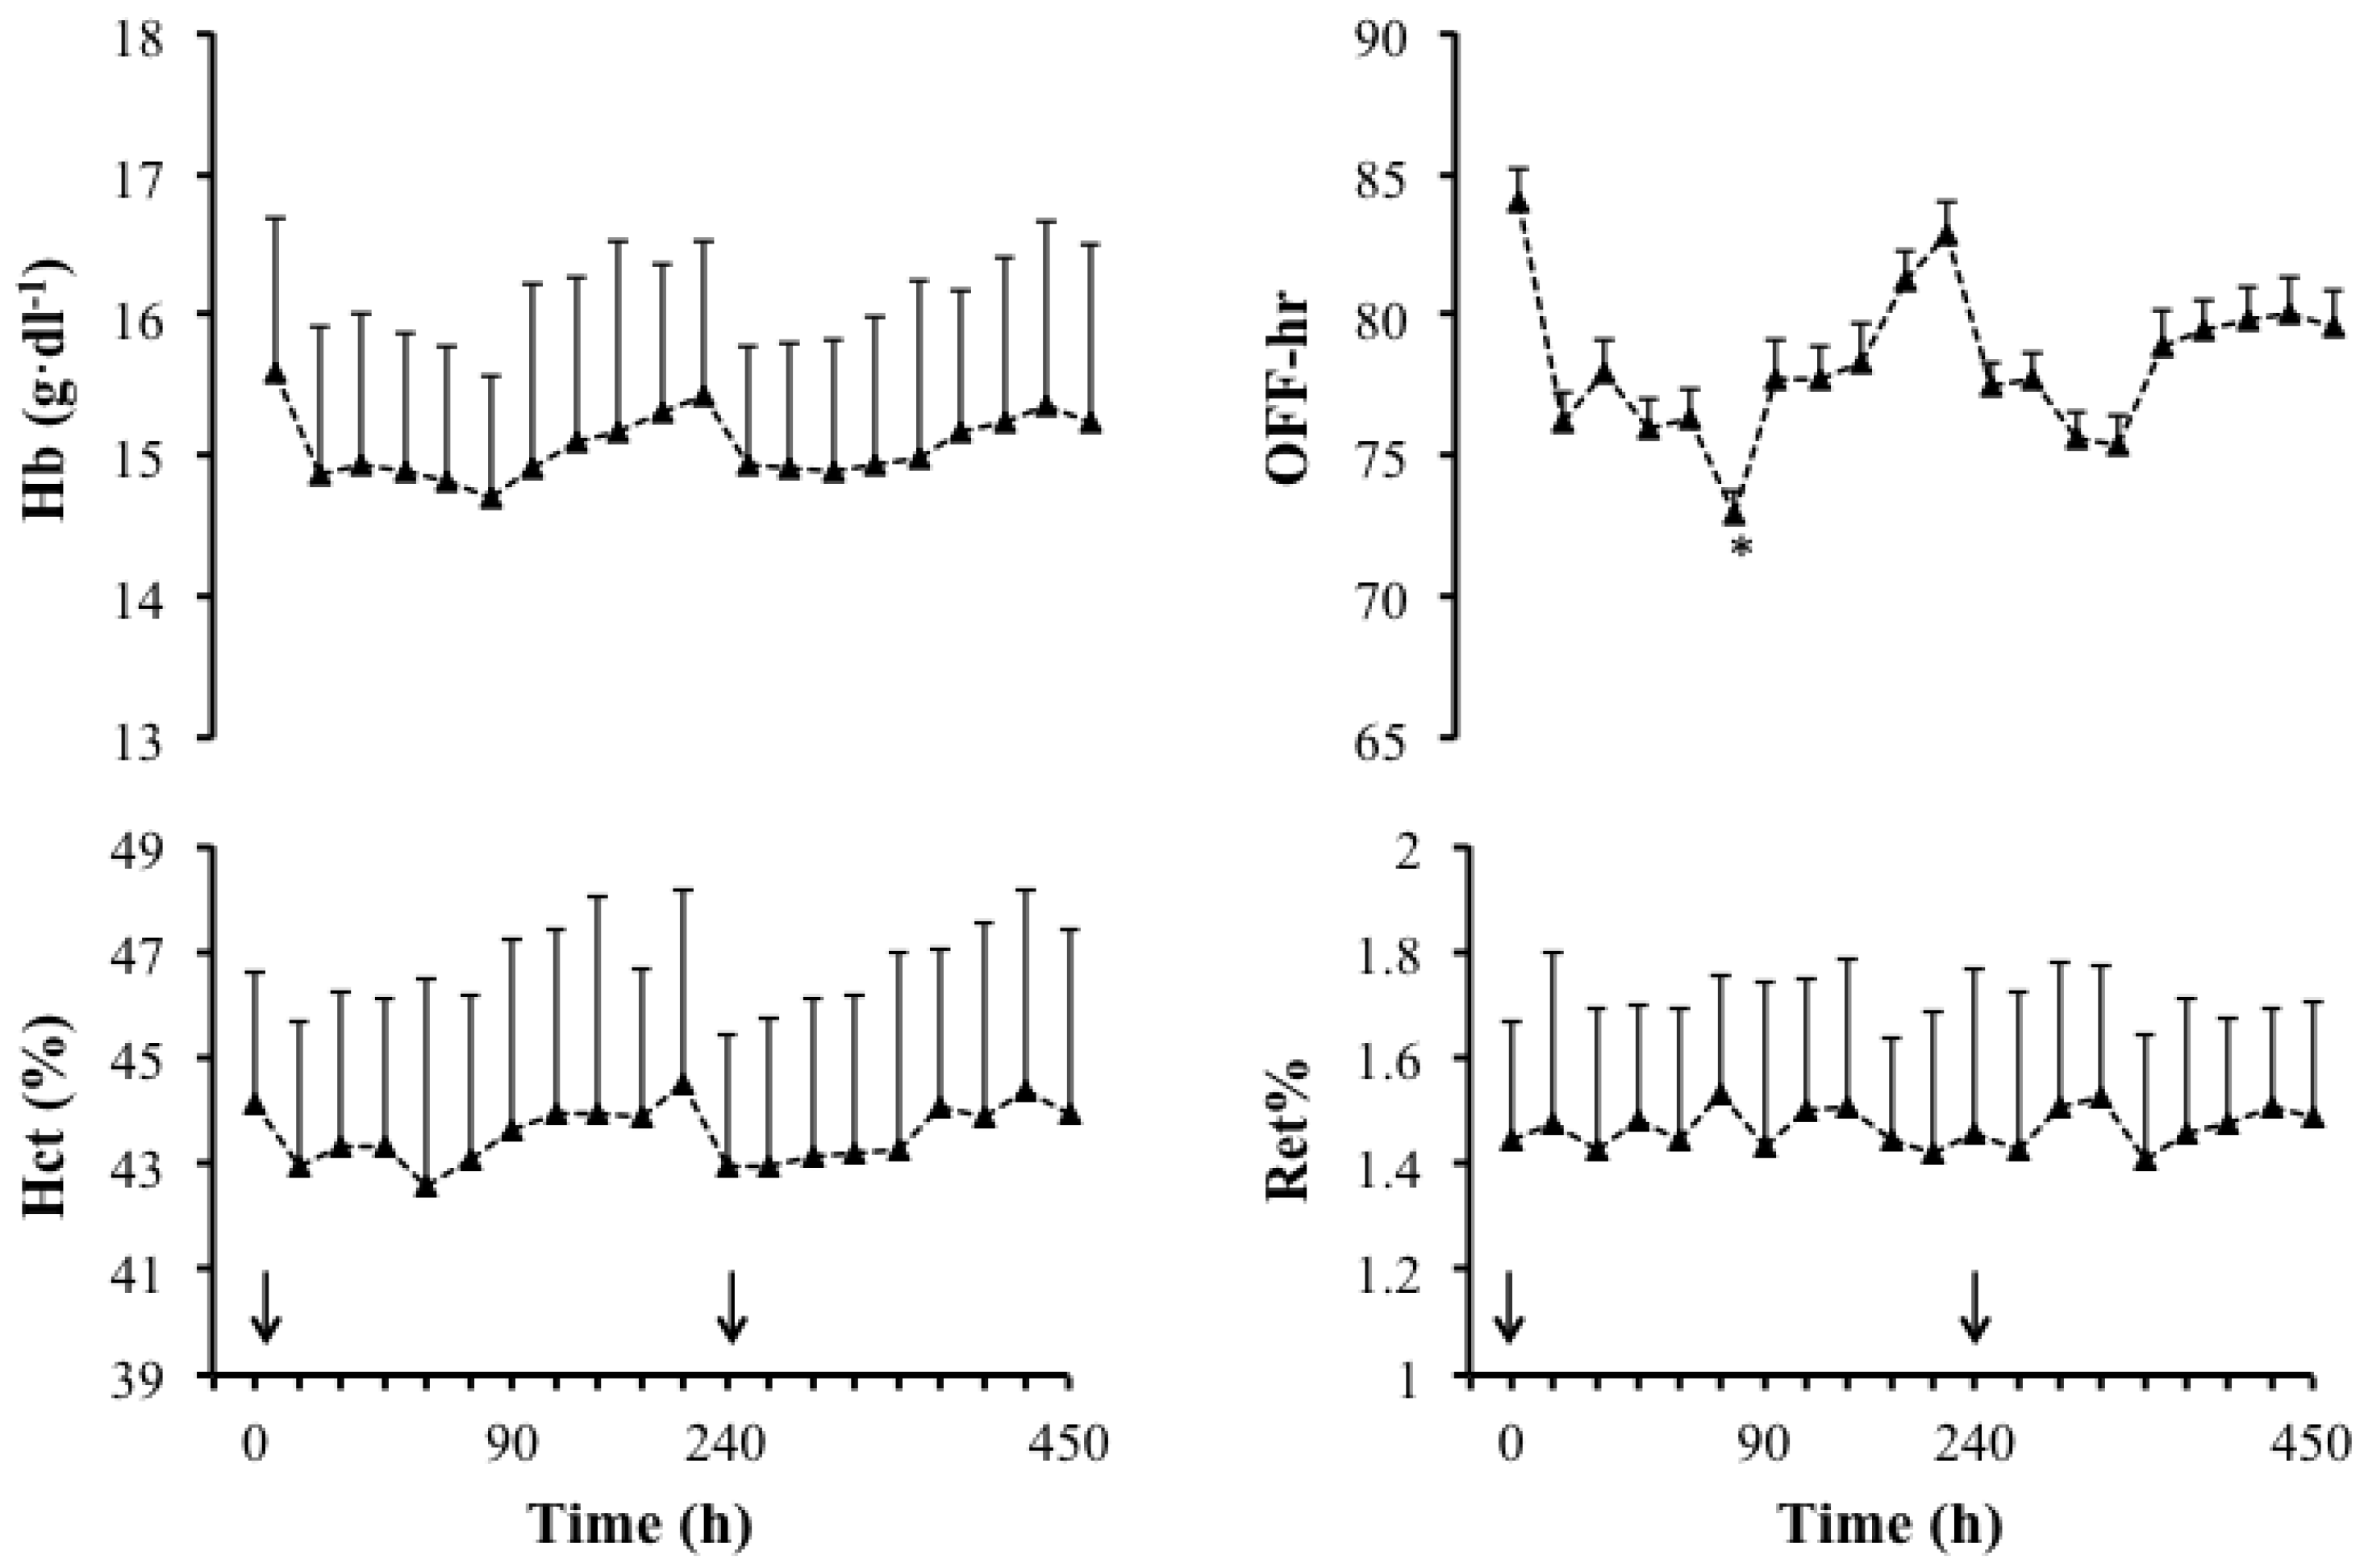
| Ret% | 1.0 ± 0.3 | 1.2 ± 0.4 | −0.2 ± 0.3 |
| OFF-hr score | 83.4 ± 9.4 | 75.5 ± 9.1 | −7.9 ± 4.0 |
| Hbmr | 29.9 ± 0.5 | 29.8 ± 0.5 | −0.1 ± 0.1 |
3.2. Data from Gly Excretion Study


3.3. Side Effects
4. Discussion
5. Conclusion
Conflict of Interest
Acknowledgements
References
- Armstrong, L.E.; Costill, D.L.; Fink, W.J. Influence of diuretic-induced dehydration on competitive running performance. Med. Sci. Sports Exerc. 1985, 17, 456–461. [Google Scholar] [CrossRef]
- Craig, E.N.; Cummings, E.G. Dehydration and muscular work. J. Appl. Physiol. 1966, 21, 670–674. [Google Scholar]
- Maresh, C.M.; Gabaree-Boulant, C.L.; Armstrong, L.E.; Judelson, D.A.; Hoffman, J.R.; Castellani, J.W.; Kenefick, R.W.; Bergeron, M.F.; Casa, D.J. Effect of hydration status on thirst, drinking, and related hormonal responses during low-intensity exercise in the heat. J. Appl. Physiol. 2004, 97, 39–44. [Google Scholar] [CrossRef]
- Easton, C.; Turner, S.; Pitsiladis, Y.P. Creatine and glycerol hyperhydration in trained subjects before exercise in the heat. Int. J. Sport Nutr. Exerc. Metab. 2007, 17, 70–91. [Google Scholar]
- Beis, L.Y.; Polyviou, T.; Malkova, D.; Pitsiladis, Y.P. The effects of creatine and glycerol hyperhydration on running economy in well trained endurance runners. J. Int. Soc. Sports Nutr. 2011, 8, 24. [Google Scholar] [CrossRef] [Green Version]
- Kilduff, L.P.; Georgiades, E.; James, N.; Minnion, R.H.; Mitchell, M.; Kingsmore, D.; Hadjicharlambous, M.; Pitsiladis, Y.P. The effects of creatine supplementation on cardiovascular, metabolic, and thermoregulatory responses during exercise in the heat in endurance-trained humans. Int. J. Sport Nutr. Exerc. Metab. 2004, 14, 443–460. [Google Scholar]
- Haugland, R.B.; Chang, D.T. Insulin effect on creatine transport in skelatal muscle (38464). Proc. Soc. Exp. Biol. Med. 1975, 148, 1–4. [Google Scholar]
- Koehler, K.; Braun, H.; de Marees, M.; Geyer, H.; Thevis, M.; Mester, J.; Schaenzer, W. Urinary excretion of exogenous glycerol administration at rest. Drug Test. Anal. 2011, 3, 877–882. [Google Scholar] [CrossRef]
- Sottas, P.E.; Robinson, N.; Saugy, M. The athlete’s biological passport and indirect markers of blood doping. Handb. Exp. Pharmacol. 2010, 195, 305–326. [Google Scholar]
- Schumacher, Y.O.; Saugy, M.; Pottgiesser, T.; Robinson, N. Detection of epo doping and blood doping: The haematological module of the athlete biological passport. Drug Test. Anal. 2012. [Google Scholar]
- Parisotto, R.; Gore, C.J.; Emslie, K.R.; Ashenden, M.J.; Brugnara, C.; Howe, C.; Martin, D.T.; Trout, G.J.; Hahn, A.G. A novel method utilising markers of altered erythropoiesis for the detection of recombinant human erythropoietin abuse in athletes. Haematologica 2000, 85, 564–572. [Google Scholar]
- Kavouras, S.A.; Armstrong, L.E.; Maresh, C.M.; Casa, D.J.; Herrera-Soto, J.A.; Scheett, T.P.; Stoppani, J.; Mack, G.W.; Kraemer, W.J. Rehydration with glycerol: Endocrine, cardiovascular, and thermoregulatory responses during exercise in the heat. J. Appl. Physiol. 2006, 100, 442–450. [Google Scholar]
- Polyviou, T.P.; Pitsiladis, Y.P.; Lee, W.C.; Pantazis, T.; Hambly, C.; Speakman, J.R.; Malkova, D. Thermoregulatory and cardiovascular responses to creatine, glycerol and alpha lipoic acid in trained cyclists. J. Int. Soc. Sports Nutr. 2012, 9, 29. [Google Scholar] [Green Version]
- Harris, R.C.; Soderlund, K.; Hultman, E. Elevation of creatine in resting and exercised muscle of normal subjects by creatine supplementation. Clin. Sci. (Lond.) 1992, 83, 367–374. [Google Scholar]
- Green, A.L.; Hultman, E.; Macdonald, I.A.; Sewell, D.A.; Greenhaff, P.L. Carbohydrate ingestion augments skeletal muscle creatine accumulation during creatine supplementation in humans. Am. J. Physiol. 1996, 271, E821–E826. [Google Scholar]
- Schmidt, W.; Prommer, N. The optimised co-rebreathing method: A new tool to determine total haemoglobin mass routinely. Eur. J. Appl. Physiol. 2005, 95, 486–495. [Google Scholar] [CrossRef]
- Holland, B.; Welch, A.A.; Unwin, I.D.; Buss, D.H.; Paul, A.A.; Southgate, D.A.T. McCance and Widdowson’s the Composition of Foods, 5th ed; Royal Society of Chemistry: Cambridge, UK, 1991. [Google Scholar]
- Vandenberghe, K.; Goris, M.; van Hecke, P.; van Leemputte, M.; Vangerven, L.; Hespel, P. Long-term creatine intake is beneficial to muscle performance during resistance training. J. Appl. Physiol. 1997, 83, 2055–2063. [Google Scholar]
- Gore, C.J.; Bourdon, P.C.; Woolford, S.M.; Ostler, L.M.; Eastwood, A.; Scroop, G.C. Time and sample site dependency of the optimized co-rebreathing method. Med. Sci. Sports Exerc. 2006, 38, 1187–1193. [Google Scholar] [CrossRef]
- Prommer, N.; Schmidt, W. Loss of CO from the intravascular bed and its impact on the optimised CO-rebreathing method. Eur. J. Appl. Physiol. 2007, 100, 383–391. [Google Scholar] [CrossRef]
- Hagan, R.D.; Diaz, F.J.; Horvath, S.M. Plasma volume changes with movement to supine and standing positions. J. Appl. Physiol. Respir. Environ. Exerc. Physiol. 1978, 45, 414–417. [Google Scholar]
- Fjeld, C.R.; Brown, K.H.; Schoeller, D.A. Validation of the deuterium oxide method for measuring average daily milk intake in infants. Am. J. Clin. Nutr. 1988, 48, 671–679. [Google Scholar]
- van Marken Lichtenbelt, W.D.; Westerterp, K.R.; Wouters, L. Deuterium dilution as a method for determining total body water: Effect of test protocol and sampling time. Br. J. Nutr. 1994, 72, 491–497. [Google Scholar] [CrossRef]
- Speakman, J.R.; Visser, G.H.; Ward, S.; Krol, E. The Isotope Dilution Method for the Evaluation of Body Composition. In Body Composition Analysis of Animals—A Handbook of Non-Destructive Methods; Speakman, J.R., Ed.; Cambridge University Press: Cambridge, UK, 2001; pp. 56–98. [Google Scholar]
- Heinicke, K.; Wolfarth, B.; Winchenbach, P.; Biermann, B.; Schmid, A.; Huber, G.; Friedmann, B.; Schmidt, W. Blood volume and hemoglobin mass in elite athletes of different disciplines. Int. J. Sports Med. 2001, 22, 504–512. [Google Scholar] [CrossRef]
- Gore, C.J.; Parisotto, R.; Ashenden, M.J.; Stray-Gundersen, J.; Sharpe, K.; Hopkins, W.; Emslie, K.R.; Howe, C.; Trout, G.J.; Kazlauskas, R.; et al. Second-generation blood tests to detect erythropoietin abuse by athletes. Haematologica 2003, 88, 333–344. [Google Scholar]
- Morkeberg, J.; Sharpe, K.; Belhage, B.; Damsgaard, R.; Schmidt, W.; Prommer, N.; Gore, C.J.; Ashenden, M.J. Detecting autologous blood transfusions: A comparison of three passport approaches and four blood markers. Scand. J. Med. Sci. Sports 2011, 21, 235–243. [Google Scholar]
- Sharpe, K.; Ashenden, M.J.; Schumacher, Y.O. A third generation approach to detect erythropoietin abuse in athletes. Haematologica 2006, 91, 356–363. [Google Scholar]
- Sommer, S.; Nau, R.; Wieland, E.; Prange, H.W. Pharmacokinetics of glycerol administered orally in healthy volunteers. Arzneim. Forsch. 1993, 43, 744–747. [Google Scholar]
- Dill, D.B.; Costill, D.L. Calculation of percentage changes in volumes of blood, plasma, and red cells in dehydration. J. Appl. Physiol. 1974, 37, 247–248. [Google Scholar]
- Thevis, M.; Guddat, S.; Flenker, U.; Schanzer, W. Quantitative analysis of urinary glycerol levels for doping control purposes using gas chromatography-mass spectrometry. Eur. J. Mass. Spectrom. (Chichester, Eng.) 2008, 14, 117–125. [Google Scholar] [CrossRef]
- Montner, P.; Stark, D.M.; Riedesel, M.L.; Murata, G.; Robergs, R.; Timms, M.; Chick, T.W. Pre-exercise glycerol hydration improves cycling endurance time. Int. J. Sports Med. 1996, 17, 27–33. [Google Scholar] [CrossRef]
- Gleeson, M.; Maughan, R.J.; Greenhaff, P.L. Comparison of the effects of pre-exercise feeding of glucose, glycerol and placebo on endurance and fuel homeostasis in man. Eur. J. Appl. Physiol. Occup. Physiol. 1986, 55, 645–653. [Google Scholar] [CrossRef]
- Riedesel, M.L.; Allen, D.Y.; Peake, G.T.; Al-Qattan, K. Hyperhydration with glycerol solutions. J. Appl. Physiol. 1987, 63, 2262–2268. [Google Scholar]
- Latzka, W.A.; Sawka, M.N.; Montain, S.J.; Skrinar, G.S.; Fielding, R.A.; Matott, R.P.; Pandolf, K.B. Hyperhydration: Tolerance and cardiovascular effects during uncompensable exercise-heat stress. J. Appl. Physiol. 1998, 84, 1858–1864. [Google Scholar]
- Lyons, T.P.; Riedesel, M.L.; Meuli, L.E.; Chick, T.W. Effects of glycerol-induced hyperhy dration prior to exercise in the heat on sweating and core temperature. Med. Sci. Sports Exerc. 1990, 22, 477–483. [Google Scholar]
- Hitchins, S.; Martin, D.T.; Burke, L.; Yates, K.; Fallon, K.; Hahn, A.; Dobson, G.P. Glycerol hyperhydration improves cycle time trial performance in hot humid conditions. Eur. J. Appl. Physiol. Occup. Physiol. 1999, 80, 494–501. [Google Scholar] [CrossRef]
- Jimenez, C.; Melin, B.; Koulmann, N.; Allevard, A.M.; Launay, J.C.; Savourey, G. Plasma volume changes during and after acute variations of body hydration level in humans. Eur. J. Appl. Physiol. Occup. Physiol. 1999, 80, 1–8. [Google Scholar] [CrossRef]
- Garvican, L.A.; Eastwood, A.; Martin, D.T.; Ross, M.L.; Gripper, A.; Gore, C.J. Stability of hemoglobin mass during a 6-day UCI ProTour cycling race. Clin. J. Sport Med. 2010, 20, 200–204. [Google Scholar] [CrossRef]
- Borno, A.; Aachmann-Andersen, N.J.; Munch-Andersen, T.; Hulston, C.J.; Lundby, C. Screening for recombinant human erythropoietin using [Hb], reticulocytes, the OFF(hr score), OFF(z score) and Hb(z score): Status of the Blood Passport. Eur. J. Appl. Physiol. 2010, 109, 537–543. [Google Scholar] [CrossRef]
- Freund, B.J.; Montain, S.J.; Young, A.J.; Sawka, M.N.; DeLuca, J.P.; Pandolf, K.B.; Valeri, C.R. Glycerol hyperhydration: Hormonal, renal, and vascular fluid responses. J. Appl. Physiol. 1995, 79, 2069–2077. [Google Scholar]
- Nelson, J.L.; Robergs, R.A. Exploring the potential ergogenic effects of glycerol hyperhydration. Sports Med. 2007, 37, 981–1000. [Google Scholar] [CrossRef]
© 2012 by the authors; licensee MDPI, Basel, Switzerland. This article is an open-access article distributed under the terms and conditions of the Creative Commons Attribution license (http://creativecommons.org/licenses/by/3.0/).
Share and Cite
Polyviou, T.P.; Easton, C.; Beis, L.; Malkova, D.; Takas, P.; Hambly, C.; Speakman, J.R.; Koehler, K.; Pitsiladis, Y.P. Effects of Glycerol and Creatine Hyperhydration on Doping-Relevant Blood Parameters. Nutrients 2012, 4, 1171-1186. https://doi.org/10.3390/nu4091171
Polyviou TP, Easton C, Beis L, Malkova D, Takas P, Hambly C, Speakman JR, Koehler K, Pitsiladis YP. Effects of Glycerol and Creatine Hyperhydration on Doping-Relevant Blood Parameters. Nutrients. 2012; 4(9):1171-1186. https://doi.org/10.3390/nu4091171
Chicago/Turabian StylePolyviou, Thelma P., Chris Easton, Lukas Beis, Dalia Malkova, Pantazis Takas, Catherine Hambly, John R. Speakman, Karsten Koehler, and Yannis P. Pitsiladis. 2012. "Effects of Glycerol and Creatine Hyperhydration on Doping-Relevant Blood Parameters" Nutrients 4, no. 9: 1171-1186. https://doi.org/10.3390/nu4091171