Predictive Validity of the Body Adiposity Index in Overweight and Obese Adults Using Dual-Energy X-ray Absorptiometry

 , , , and
Abstract
:1. Introduction
2. Methods
2.1. Participants
2.2. Design and Procedure
2.3. Statistical Analysis
3. Results
4. Discussion
5. Conclusions
Acknowledgments
Author Contributions
Conflicts of Interest
Abbreviations
| BAI | Body adiposity index |
| BF% | Body fat percentage |
| BMI | Body mass index |
| CEMA | Centre for Studies in Physical Activity Measurements (in Spanish) |
| DEXA | Dual-energy X-ray absorptiometry |
| LMICs | Low-to-middle income countries |
| WC | Waist circumference |
| WHtR | Waist-to-height ratio |
| ρc | Lin’s concordance correlation coefficient |
References
- World Health Organization (WHO). Obesity: Preventing and Managing the Global Epidemic. Report of a WHO Consultation. World Health Organ. Tech. Rep. Ser. 2000, 894, 1–253. [Google Scholar]
- Lam, B.C.; Koh, G.C.; Chen, C.; Wong, M.T.; Fallows, S.J. Comparison of Body Mass Index (BMI), Body AdiposityIndex (BAI), Waist Circumference (WC), Waist-To-Hip Ratio (WHR) and Waist-To-Height Ratio (WHtR) as predictors of cardiovascular disease risk factors in an adult population in Singapore. PLoS ONE 2015, 10, e0122985. [Google Scholar] [CrossRef] [PubMed]
- Antonopoulos, A.S.; Oikonomou, E.K.; Antoniades, C.; Tousoulis, D. From the BMI paradox to the obesity paradox: The obesity-mortality association in coronary heartdisease. Obes. Rev. 2016, 17, 989–1000. [Google Scholar] [CrossRef] [PubMed]
- Maddaloni, E.; Cavallari, I.; de Pascalis, M.; Keenan, H.; Park, K.; Manfrini, S.; Buzzetti, R.; Patti, G.; di Sciascio, G.; Pozzilli, P. Relation of body circumferences to cardiometabolic disease in overweight-obese subjects. Am. J. Cardiol. 2016, 118, 822–827. [Google Scholar] [CrossRef] [PubMed]
- Guh, D.P.; Zhang, W.; Bansback, N.; Amarsi, Z.; Birmingham, C.L.; Anis, A.H. The incidence of co-morbidities related to obesity and overweight: A systematic review and meta-analysis. BMC Public Health 2009, 9, 88. [Google Scholar] [CrossRef] [PubMed]
- Lee, S.Y.; Gallagher, D. Assessment methods in human body composition. Curr. Opin. Clin. Nutr. Metab. Care 2008, 11, 566–572. [Google Scholar] [CrossRef] [PubMed]
- Ramírez-Vélez, R.; Correa-Bautista, J.E.; Martínez-Torres, J.; Méneses-Echavez, J.F.; González-Ruiz, K.; González-Jiménez, E.; Schmidt-RioValle, J.; Lobelo, F. LMS tables for waist circumference and waist–height ratio in Colombian adults: Analysis of nationwide data 2010. Eur. J. Clin. Nutr. 2016, 70, 1189–1196. [Google Scholar] [CrossRef] [PubMed]
- Amato, M.C.; Guarnotta, V.; Giordano, C. Body composition assessment for the definition of cardiometabolic risk. J. Endocrinol. Investig. 2013, 36, 537–543. [Google Scholar]
- Bergman, R.N.; Stefanovski, D.; Buchanan, T.A.; Sumner, A.E.; Reynolds, J.C.; Sebring, N.G.; Xiang, A.H.; Watanabe, R.M. A better index of body adiposity. Obesity (Silver Spring) 2011, 19, 1083–1089. [Google Scholar] [CrossRef] [PubMed]
- Silva, M.I.; Vale, B.S.; Lemos, C.C.; Torres, M.R.; Bregman, R. Body adiposity index assess body fat with high accuracy in nondialyzed chronic kidney disease patients. Obesity 2013, 21, 546–552. [Google Scholar] [CrossRef] [PubMed]
- Bernhard, A.B.; Scabim, V.M.; Serafim, M.P.; Gadducci, A.V.; Santo, M.A.; de Cleva, R. Modified body adiposity index for body fat estimation in severe obesity. J. Hum. Nutr. Diet. 2016. [Google Scholar] [CrossRef] [PubMed]
- Cerqueira, M.; Amorim, P.; Magalhaes, F.; Castro, E.; Franco, F.; Franceschini, S.; Cerqueira, L.; Marins, J.; Doimo, L. Validity of body adiposity index in predicting body fat in a sample of Brazilian women. Obesity (Silver Spring) 2013, 21, E696–E699. [Google Scholar] [CrossRef] [PubMed]
- Kuhn, P.C.; Vieira Filho, J.P.; Franco, L.; dal Fabbro, A.; Franco, L.J.; Moises, R.S. Evaluation of body adiposity index (BAI) to estimate percent body fat in an indigenous population. Clin. Nutr. 2014, 33, 287–290. [Google Scholar] [CrossRef] [PubMed]
- Geliebter, A.; Atalayer, D.; Flancbaum, L.; Gibson, C.D. Comparison of body adiposity index (BAI) and BMI with estimations of % body fat in clinically severe obese women. Obesity 2013, 21, 493–498. [Google Scholar] [CrossRef] [PubMed]
- Carpio-Rivera, E.; Hernández-Elizondo, J.; Salicetti-Fonseca, A.; Solera-Herrera, A.; Moncada-Jiménez, J. Predictive validity of the body adiposity index in costarican students. Am. J. Hum. Biol. 2016, 28, 394–397. [Google Scholar] [CrossRef] [PubMed]
- Segheto, W.; Coelho, F.A.; Guimarães da Silva, C.D.; Hallal, P.C.; Marins, J.C.; Ribeiro, A.Q.; Pessoa, M.C.; Morais, S.H.; Longo, G.Z. Validity of body adiposity index in predicting body fat in Brazilians adults. Am. J. Hum. Biol. 2016. [Google Scholar] [CrossRef] [PubMed]
- Lopez-Jaramillo, P.; Lahera, V.; Lopez-Lopez, J. Epidemic of cardiometabolic diseases: A Latin American point of view. Ther. Adv. Cardiovasc. Dis. 2011, 5, 119–131. [Google Scholar] [CrossRef] [PubMed]
- Parra, D.C.; Iannotti, L.; Gomez, L.F.; Pachón, H.; Haire-Joshu, D.; Sarmiento, O.L.; Kuhlmann, A.S.; Brownson, R.C. The nutrition transition in Colombia over a decade: A novel household classification system of anthropometric measures. Arch. Public Health 2015, 73, 12. [Google Scholar] [CrossRef] [PubMed]
- Cetin, D.; Lessig, B.A.; Nasr, E. Comprehensive Evaluation for Obesity: Beyond Body Mass Index. J. Am. Osteopath. Assoc. 2016, 116, 376–382. [Google Scholar] [CrossRef] [PubMed]
- Kahn, H.S.; Bullard, K.M. Beyond Body Mass Index: Advantages of Abdominal Measurements for Recognizing Cardiometabolic Disorders. Am. J. Med. 2016, 129, 74–81. [Google Scholar] [CrossRef] [PubMed]
- Johnson Stoklossa, C.A.; Forhan, M.; Padwal, R.S.; Gonzalez, M.C.; Prado, C.M. Practical considerations for body composition assessment of adults with class II/III obesity using bioelectrical impedance analysis or dual-energy X-ray absorptiometry. Curr. Obes. Rep. 2016. [Google Scholar] [CrossRef] [PubMed]
- González-Ruíz, K.; Correa-Bautista, J.E.; Ramírez-Vélez, R. Evaluation of the body adiposity index in predicting percentage body fat among Colombian adults. Nutr. Hosp. 2015, 32, 55–60. [Google Scholar] [PubMed]
- González-Ruíz, K.; Correa-Bautista, J.E.; Ramírez-Vélez, R. Body adiposity and its relationship of metabolic syndrome components in Colombian adults. Nutr. Hosp. 2015, 32, 1468–1475. [Google Scholar] [PubMed]
- Marfell-Jones, M.; Olds, T.; Stewart, A. International Standards for Anthropometric Assessment; International Society for the Advancement of Kinanthropometry (ISAK): Potchefstroom, South Africa, 2006. [Google Scholar]
- World Health Organization. Obesity: Preventing and Managing the Global Epidemic; Report of a WHO Consultation on Obesity, 3–5 June 1997, WHO/NUT/NCD/98.1 1997; World Health Organization: Geneva, Switzerland, 1997. [Google Scholar]
- Lin, L.I. A concordance correlation coefficient to evaluate reproducibility. Biometrics 1989, 45, 255–268. [Google Scholar] [CrossRef] [PubMed]
- Bland, J.M.; Altman, D.G. Statistical methods for assessing agreement between two methods of clinical measurement. Lancet 1986, 8476, 307–310. [Google Scholar] [CrossRef]
- Thivel, D.; O’Malley, G.; Pereira, B.; Duché, P.; Aucouturier, J. Comparison of total body and abdominal adiposity indexes to dual x-ray absorptiometry scan in obese adolescents. Am. J. Hum. Biol. 2015, 27, 334–338. [Google Scholar] [CrossRef] [PubMed]
- Esco, M.R. The accuracy of the body adiposity index for predicting body fat percentage in collegiate women athletes. J. Strength Cond. Res. 2013, 27, 1679–1683. [Google Scholar] [CrossRef] [PubMed]
- Chang, H.; Simonsick, E.M.; Ferrucci, L.; Cooper, J.A. Validation study of the body adiposity index as a predictor of percent body fat in older individuals: Findings from the BLSA. J. Gerontol. A Biol. Sci. Med. Sci. 2013, 69, 165. [Google Scholar] [CrossRef] [PubMed]
- Lemacks, J.L.; Liu, P.Y.; Shin, H.; Ralston, P.A.; Ilich, J.Z. Validation of body adiposity index as a measure of obesity in overweight and obese postmenopausal white women and its comparison with body mass index. Menopause 2012, 19, 1277–1279. [Google Scholar] [CrossRef] [PubMed]
- Vinknes, K.J.; Elshorbagy, A.K.; Drevon, C.A.; Gjesdal, C.G.; Tell, G.S.; Nygard, O.; Vollset, S.E.; Refsum, H. Evaluation of the body adiposity index in a Caucasian population: The Hordaland health study. Am. J. Epidemiol. 2013, 177, 586–592. [Google Scholar] [CrossRef] [PubMed]
- Johnson, W.; Chumlea, W.C.; Czerwinski, S.A.; Demerath, E.W. Concordance of the recently published body adiposity index with measured body fat percent in European-American adults. Obesity 2012, 20, 900–903. [Google Scholar] [CrossRef] [PubMed]
- Freedman, D.S.; Thornton, J.C.; Pi-Sunyer, F.X.; Heymsfield, S.B.; Wang, J.; Pierson, R.N., Jr.; Blanck, H.M.; Gallagher, D. The body adiposity index (hip circumference ÷ height(1.5)) is not a more accurate measure of adiposity than is BMI, waist circumference, or hip circumference. Obesity 2012, 20, 2438–2444. [Google Scholar] [CrossRef] [PubMed]
- Appelhans, B.M.; Kazlauskaite, R.; Karavolos, K.; Janssen, I.; Kravitz, H.M.; Dugan, S.; Burns, J.W.; Shipp-Johnson, K.; Powell, L.H. How well does the body adiposity index capture adiposity change in midwife women?: The SWAN fat patterning study. Am. J. Hum. Biol. 2012, 24, 866–869. [Google Scholar] [CrossRef] [PubMed]
- Bennasar-Veny, M.; Lopez-Gonzalez, A.A.; Tauler, P.; Cespedes, M.L.; Vicente-Herrero, T.; Yanez, A.; Tomas-Salva, M.; Aguilo, A. Body adiposity index and cardiovascular health risk factors in Caucasians: A comparison with the body mass index and others. PLoS ONE 2013, 8, e63999. [Google Scholar] [CrossRef] [PubMed]


| Women (n = 26) | Men (n = 22) | Total (n = 48) | p | |
|---|---|---|---|---|
| Age (years) | 42.3 (8.2) | 39.3 (6.0) | 41.0 (7.3) | 0.157 |
| Height (m) | 1.63 (7.6) | 1.65 (9.0) | 1.64 (8.2) | 0.375 |
| Weight (kg) | 78.2 (12.3) | 89.8 (12.4) | 83.5 (13.6) | 0.002 |
| Waist (cm) | 90.7 (8.1) | 100.9 (8.8) | 95.4 (9.8) | 0.001 |
| Hip (cm) | 110.3 (9.7) | 105.2 (6.2) | 107.9 (8.6) | 0.038 |
| WHtR | 0.57 (0.05) | 0.59 (0.04) | 0.58 (0.05) | 0.272 |
| BF% DEXA | 42.6 (4.8) | 34.8 (4.8) | 39.0 (6.1) | 0.001 |
| BF% BAI | 37.2 (5.6) | 28.8 (3.1) | 33.4 (6.2) | 0.001 |
| BMI (kg/m2) | 31.0 (4.5) | 30.4 (3.3) | 30.7 (4.0) | 0.611 |
| BMI ≥ 30 (kg/m2) a | 13 (50.0) | 10 (45.4) | 23 (47.8) | 0.753 |
| Women (n = 26) | Men (n = 22) | Total (n = 48) | |
|---|---|---|---|
| BF% DEXA | 0.763 * | 0.677 * | 0.844 * |
| Weight (kg) | 0.696 * | 0.465 * | 0.668 * |
| Waist (cm) | 0.574 * | 0.596 * | 0.546 * |
| Hip (cm) | 0.874 * | 0.685 * | 0.613 * |
| WHtR | 0.667 * | 0.639 * | 0.336 * |
| BMI (kg/m2) | 0.716 * | 0.739 * | 0.557 * |
| Women (n = 26) | Men (n = 22) | |||||||||
|---|---|---|---|---|---|---|---|---|---|---|
| n | BF% by DEXA | BAI | p Value | Difference between Measures | n | BF% by DEXA | BAI | p Value | Difference between Measures | |
| All | 26 | 42.5 (4.7) | 37.1 (5.5) | 0.001 | −5.3 (3.3) | 22 | 34.8 (4.8) | 28.8 (3.0) | 0.001 | −6.0 (3.2) |
| Level of adiposity (%) | ||||||||||
| 20–30 | – | – | – | – | – | 5 | 28.8 (1.7) | 26.5 (2.3) | 0.127 | −2.3 (2.6) |
| 31–40 | 9 | 37.4 (2.1) | 33.1 (3.1) | 0.001 | −4.2 (1.3) | 14 | 35.3 (3.1) | 28.9 (3.0) | 0.001 | −6.4 (1.2) |
| >41 | 17 | 45.2 (3.2) | 39.3 (5.4) | 0.005 | −5.9 (3.2) | 3 | 42.1 (0.7) | 31.9 (1.4) | 0.048 | −10.2 (1.9) |
| Weight status | ||||||||||
| BMI > 25 < 30 (kg/m2) | 13 | 39.6 (3.3) | 33.7 (2.4) | 0.001 | –5.8 (3.7) | 12 | 32.4 (4.0) | 27.7 (2.9) | 0.001 | −4.7 (2.8) |
| BMI ≥ 30 (kg/m2) | 13 | 45.5 (4.2) | 40.6 (5.8) | 0.001 | −4.8 (2.9) | 10 | 37.6 (4.2) | 30.0 (2.8) | 0.001 | −7.5 (3.2) |
| Study | Sample | Age (Years) | Agreement between Measurement Methods/Bias | Main Finding |
|---|---|---|---|---|
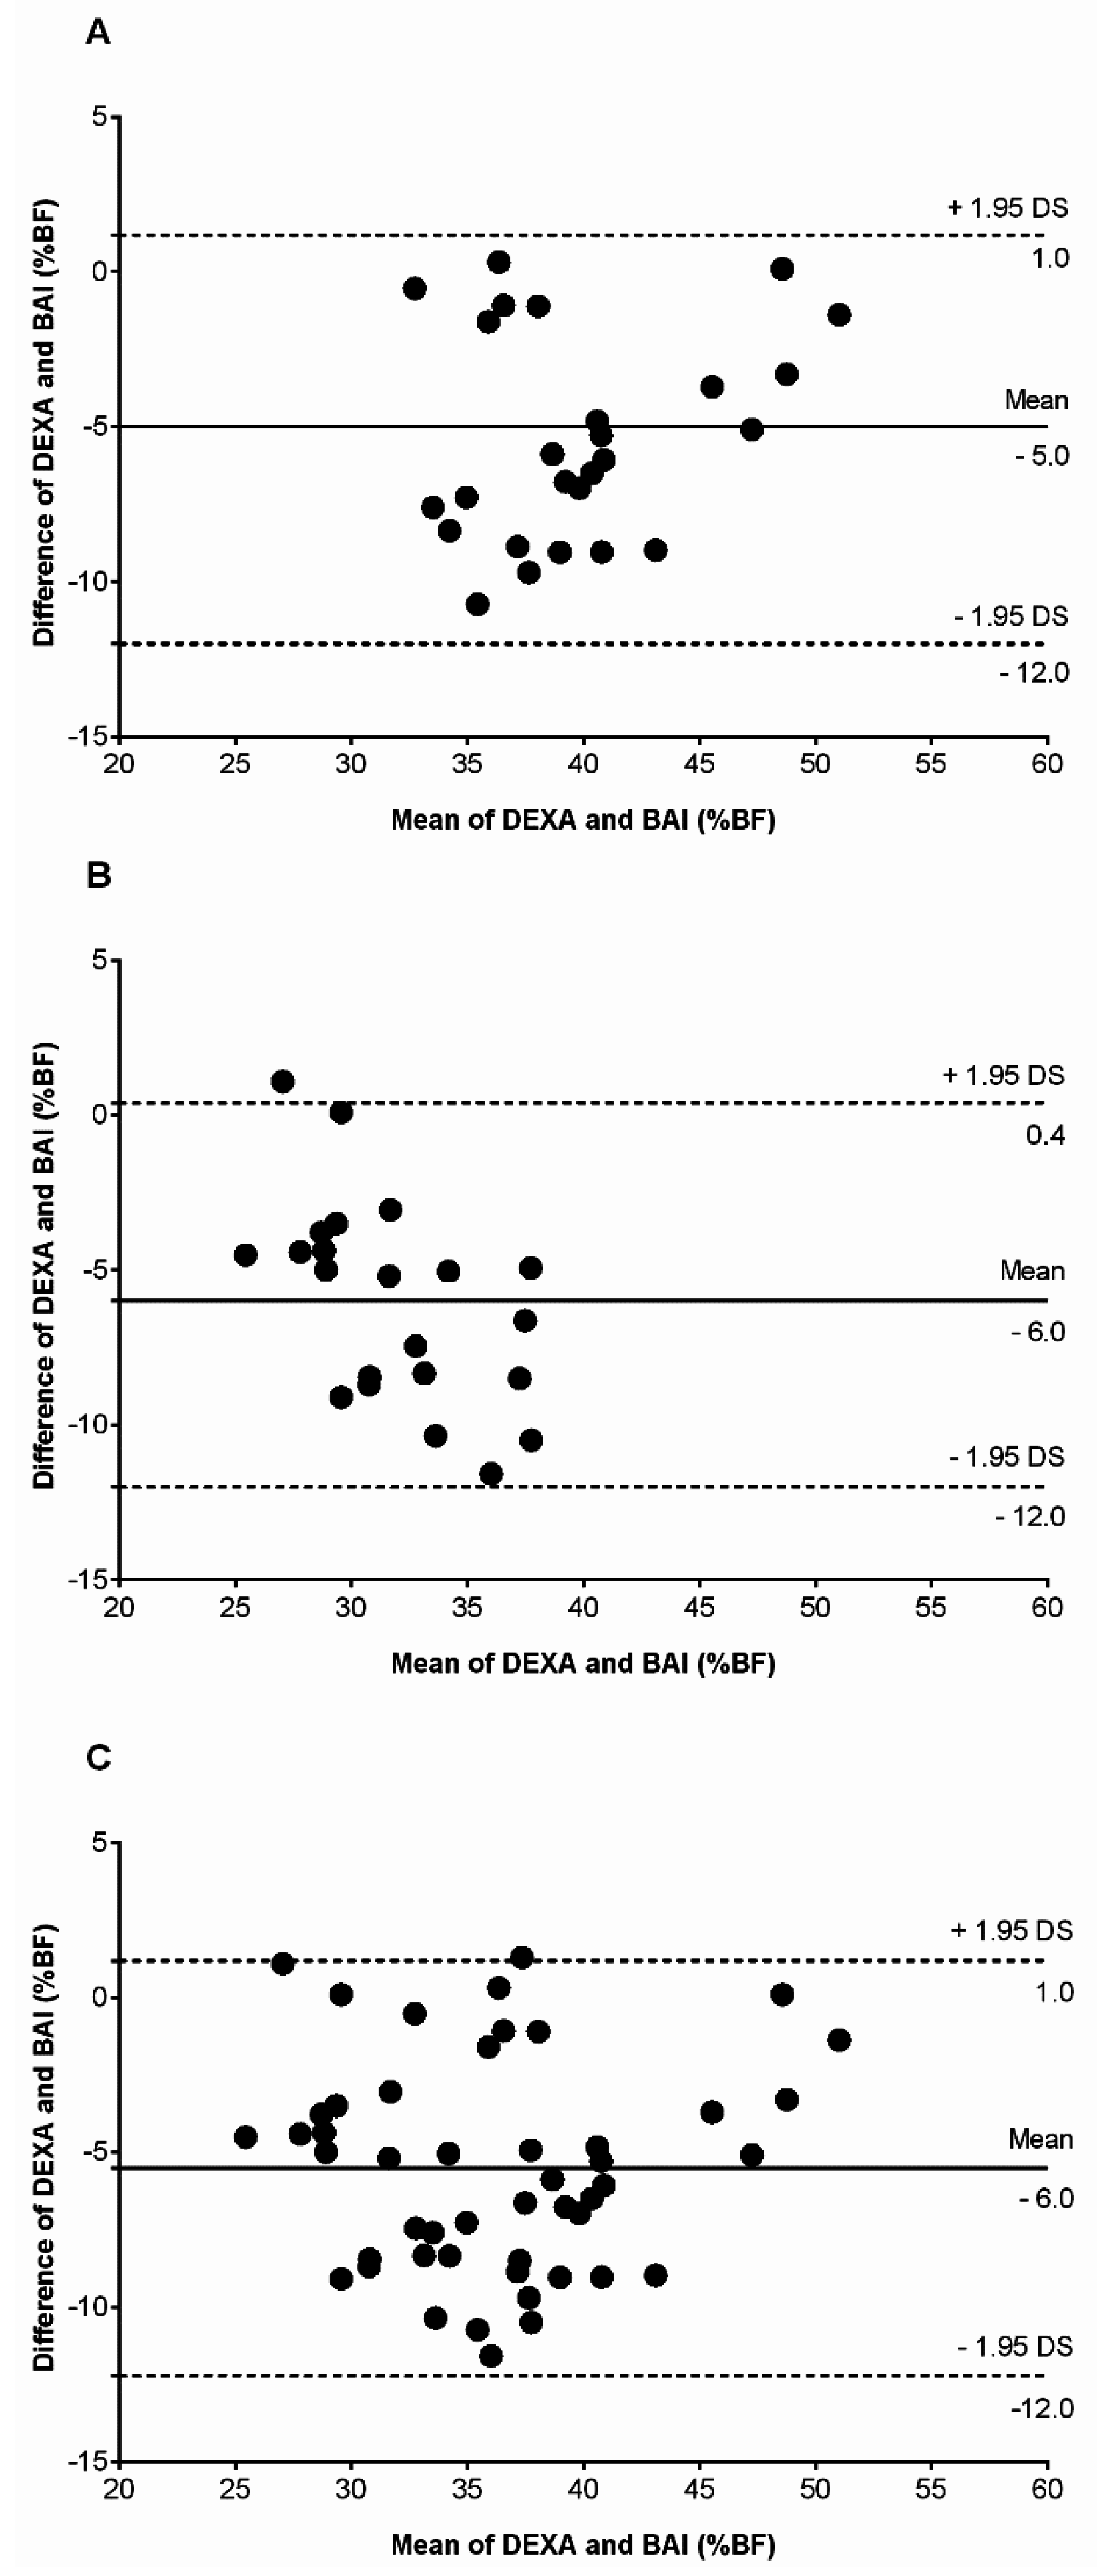
| Present study | 22 men, and 26 women | 30–50 | Bland–Altman plots Women bias 5.0%; Men bias 6.0% | In both sexes, BAI underestimated BF% |
| Thivel et al. [28] | 58 girls, and 61 boys: adolescents | 12–16 | Bland–Altman plots Bias 3.4% | In both sexes, BAI overestimated BF% |
| Bergman et al. [9] | 1733 Mexican American subjects | 20–50 | Correlation between DEXA–BAI ρc = 0.95 | In both sexes, BAI had adequate accuracy |
| Segheto et al. [16] | 331 men, and 395 women | 20–59 | Bland–Altman plots Women bias 5.0%; Men bias 5.4% | In both sexes, BAI overestimated BF% |
| Carpio-Rivera et al. [15] | 106 men, and 93 women: college students | Mean age 18.9 ± 2.6 | Bland–Altman plots Women bias 7.2%; Men bias 2.9% | In women, BAI underestimated BF%; In men, BAI overestimated BF% |
| Cerqueira et al. [12] | 102 womens | Mean age 60.3 ± 9.8 | Bland–Altman plots Bias 3.2% | BAI overestimated BF% |
| Esco et al. [29] | 30 women athletes | Mean age 20.0 ± 1.3 | Bland–Altman plots Bias 5.8% | BAI overestimated BF% |
| Chang et al. [30] | 483 mens, and 471 womens college students | 55–96 | Bland–Altman plots Bias 5.1% | BAI overestimated BF% |
| Lemacks et al. [31] | 187 overweight/obese postmenopausal womens | Mean age 55.8 ± 3.3 | Concordance correlation coefficient ρc = 0.39 | Poor agreement strength between DEXA BF% and BAI; BAI overestimated BF% |
| Vinknes et al. [32] | 5193 middle-aged (47–49 years) and elderly (71–74 years) men and womens | 47–72 | Bland–Altman plots | BAI overestimated adiposity in subjects with lower BF% (particularly in men) and underestimated it in overweight and obese subjects. |
© 2016 by the authors; licensee MDPI, Basel, Switzerland. This article is an open access article distributed under the terms and conditions of the Creative Commons Attribution (CC-BY) license (http://creativecommons.org/licenses/by/4.0/).
Share and Cite
Ramírez-Vélez, R.; Correa-Bautista, J.E.; González-Ruíz, K.; Vivas, A.; García-Hermoso, A.; Triana-Reina, H.R. Predictive Validity of the Body Adiposity Index in Overweight and Obese Adults Using Dual-Energy X-ray Absorptiometry. Nutrients 2016, 8, 737. https://doi.org/10.3390/nu8120737
Ramírez-Vélez R, Correa-Bautista JE, González-Ruíz K, Vivas A, García-Hermoso A, Triana-Reina HR. Predictive Validity of the Body Adiposity Index in Overweight and Obese Adults Using Dual-Energy X-ray Absorptiometry. Nutrients. 2016; 8(12):737. https://doi.org/10.3390/nu8120737
Chicago/Turabian StyleRamírez-Vélez, Robinson, Jorge Enrique Correa-Bautista, Katherine González-Ruíz, Andrés Vivas, Antonio García-Hermoso, and Hector Reynaldo Triana-Reina. 2016. "Predictive Validity of the Body Adiposity Index in Overweight and Obese Adults Using Dual-Energy X-ray Absorptiometry" Nutrients 8, no. 12: 737. https://doi.org/10.3390/nu8120737