Relationship between Vitamin Intake and Depressive Symptoms in Elderly Japanese Individuals: Differences with Gender and Body Mass Index

 ,
,
Abstract
:1. Introduction
2. Materials and Methods
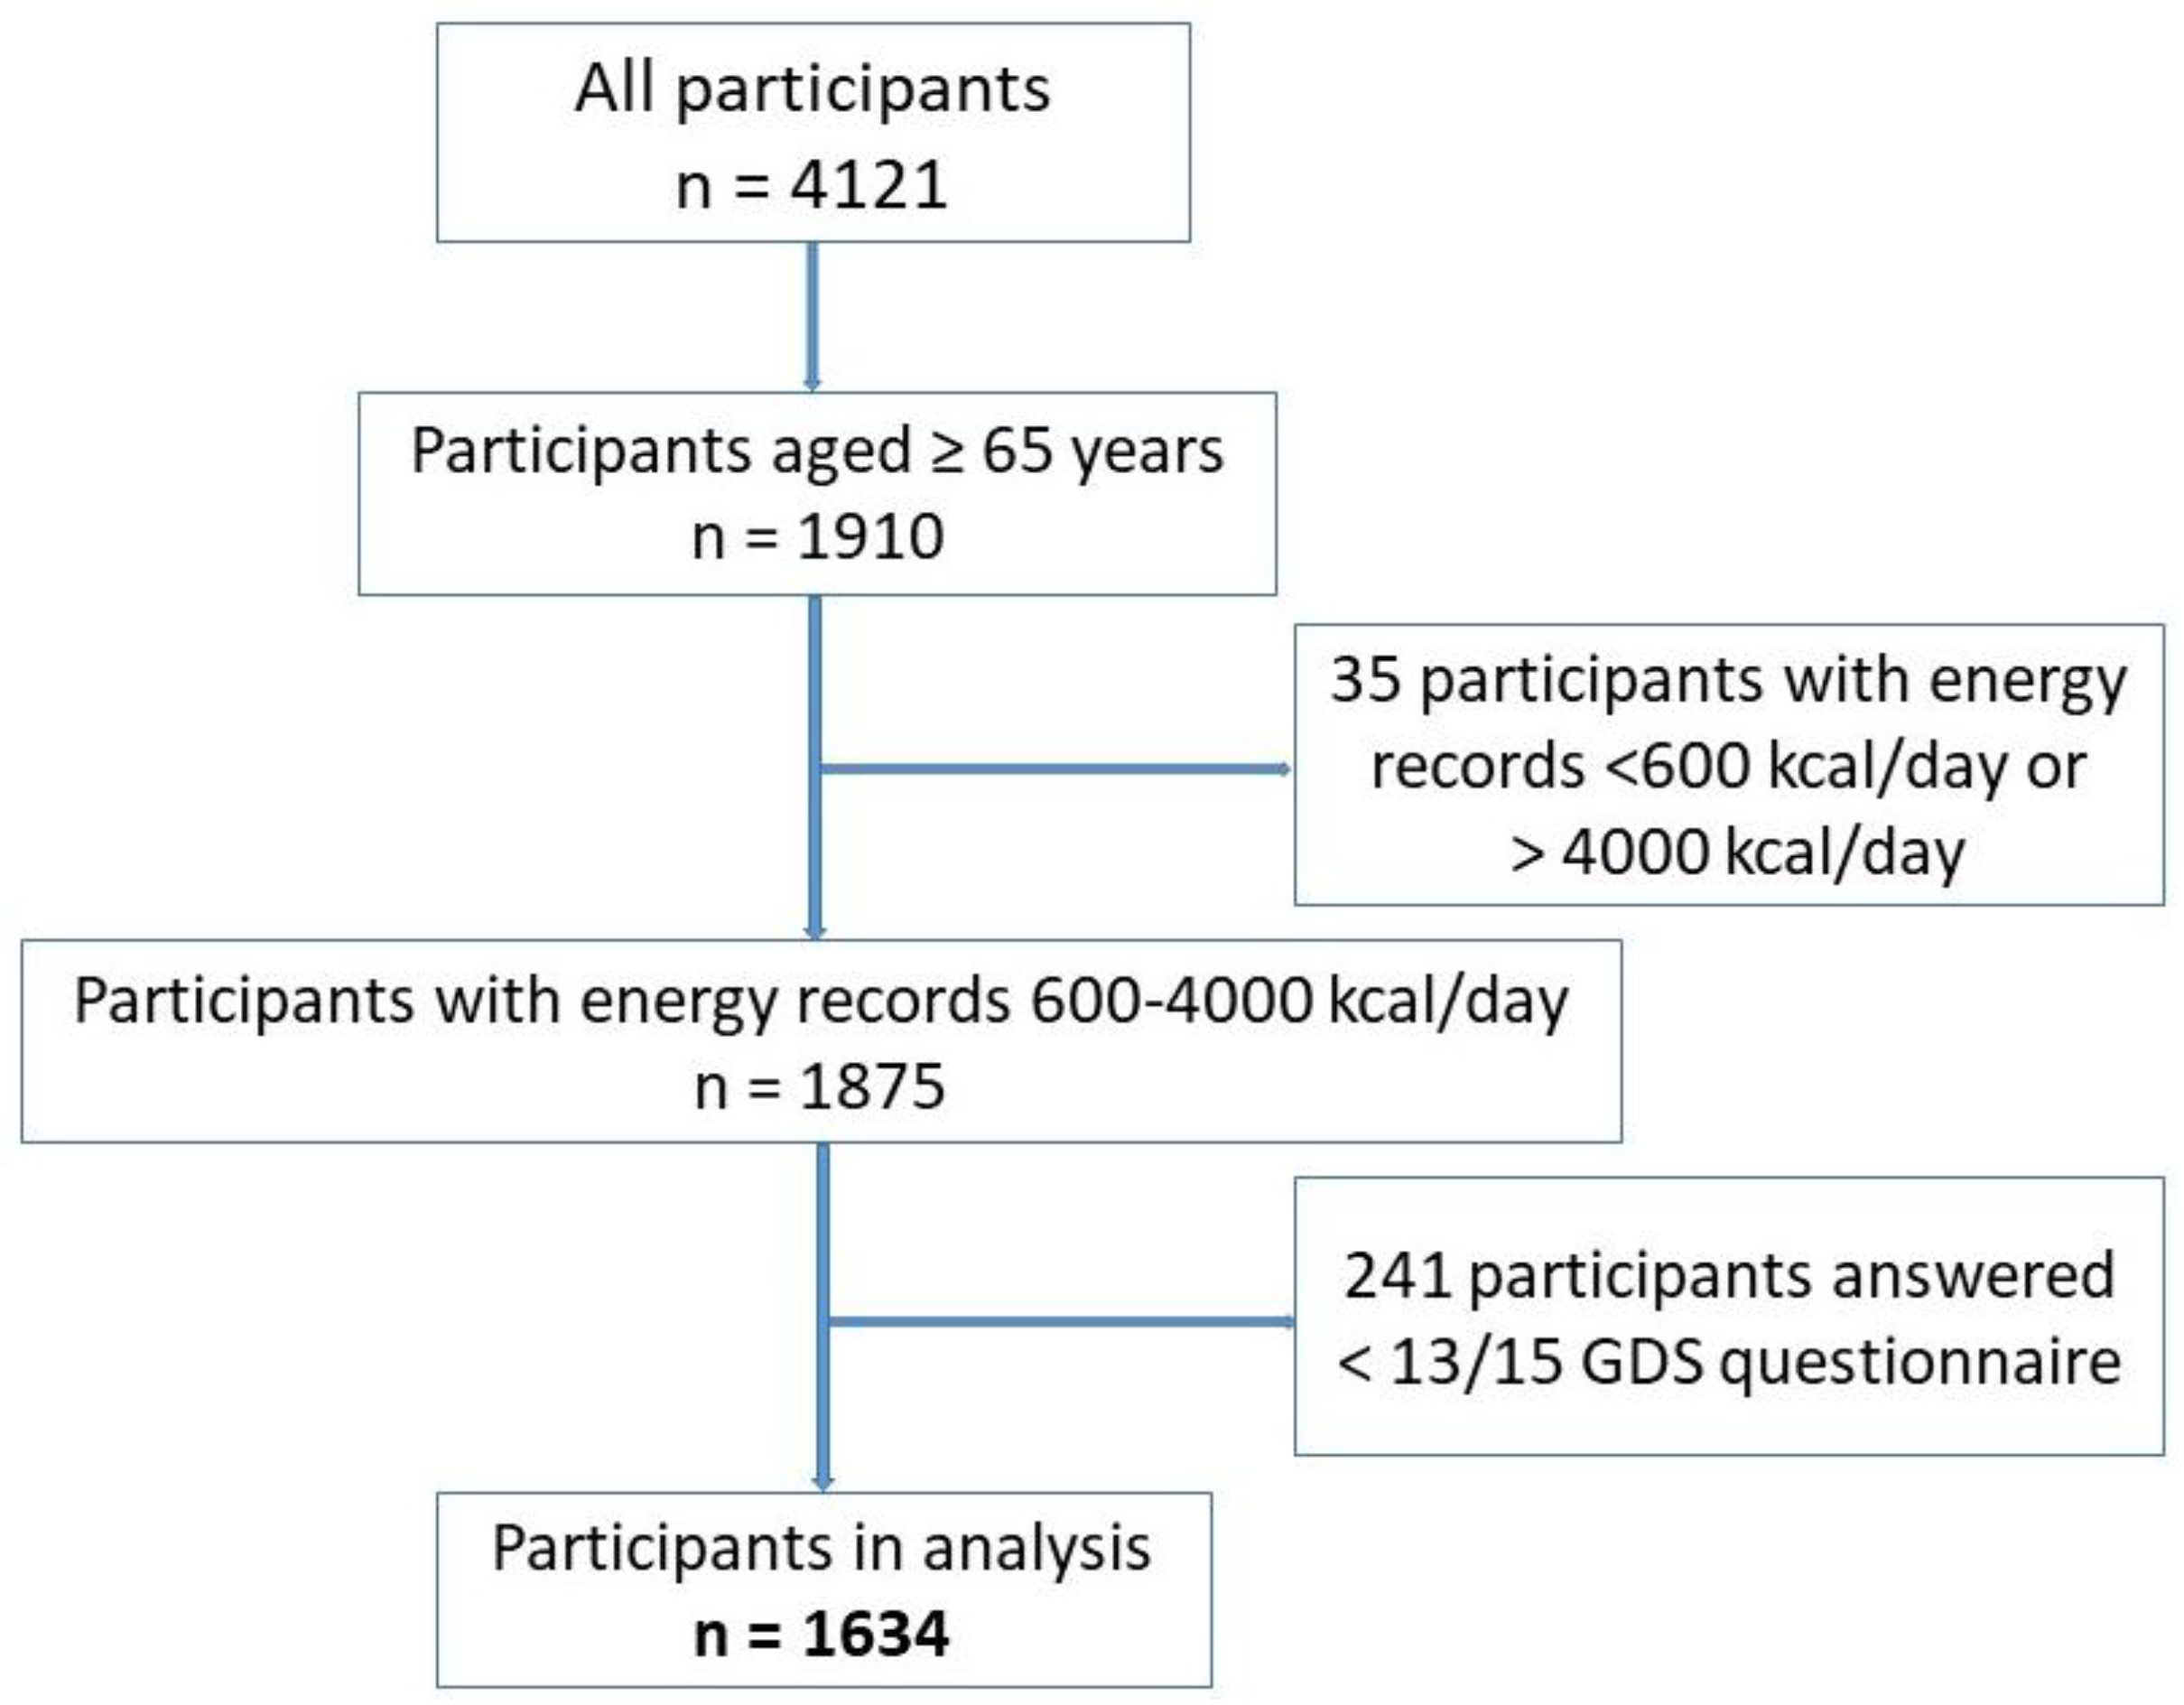
2.1. Study Population
2.2. Depression
2.3. Nutrients Assessment
2.4. Other Variables
2.5. Statistical Analysis
3. Results
3.1. Participant Characteristics According to the Depressive Symptoms Status
3.2. Vitamin Intake in Different Groups of Participants
3.3. Influence of Gender and BMI on the Relationship between Vitamin Intake and Depressive Symptoms
4. Discussion
Limitations
5. Conclusions
Supplementary Materials
Acknowledgments
Author Contributions
Conflicts of Interest
Abbreviations
| BDHQ | Brief-type self-administered diet history questionnaire |
| GDS | Geriatric Depression Scale |
| BMI | Body mass index |
| 25(OH)D | 25-hydroxyvitamin D |
| SPSS | Statistical Package for Social Sciences |
| SD | Standard deviation |
| B | Beta coefficient |
| OR | Odd ratio |
| CI | Confidence interval |
References
- Wittchen, H.U.; Jacobi, F.; Rehm, J.; Gustavsson, A.; Svensson, M.; Jönsson, B.; Olesen, J.; Allgulander, C.; Alonso, J.; Faravelli, C.; et al. The size and burden of mental disorders and other disorders of the brain in Europe 2010. Eur. Neuropsychopharmacol. 2011, 21, 655–679. [Google Scholar] [CrossRef] [PubMed]
- Depression and Other Common Mental Disorders Global Health Estimates. Available online: http://apps.who.int/iris/bitstream/10665/254610/1/WHO-MSD-MER-2017.2-eng.pdf?ua=1 (accessed on 22 May 2017).
- GBD 2015 Disease and Injury Incidence and Prevalence Collaborators. Global, regional, and national incidence, prevalence, and years lived with disability for 310 diseases and injuries, 1990–2015: A systematic analysis for the Global Burden of Disease Study 2015. Lancet 2016, 388, 1545–1602. [Google Scholar] [CrossRef]
- Doraiswamy, P.M.; Khan, Z.M.; Donahue, R.M.J.; Richard, N.E. The spectrum of quality-of-life impairments in recurrent geriatric depression. J. Gerontol. A Biol. Sci. Med. Sci. 2002, 57, M134–M137. [Google Scholar] [CrossRef] [PubMed]
- Blazer, D.G. Depression in Late Life: Review and Commentary. J. Gerontol. Ser. A Biol. Sci. Med. Sci. 2003, 58, M249–M265. [Google Scholar] [CrossRef]
- Blazer, D.; Burchett, B.; Service, C.; George, L.K. The Association of Age and Depression Among the Elderly: An Epidemiologic Exploration. J. Gerontol. 1991, 46, M210–M215. [Google Scholar] [CrossRef] [PubMed]
- Ra, J.S.; Kim, H.S. Sex-based Association between Depression and Metabolic Syndrome in Korean Middle-aged and Older Adults. Osong Public Heal. Res. Perspect. 2017, 8, 130–137. [Google Scholar] [CrossRef] [PubMed]
- Guo, J.; Guan, L.; Fang, L.; Liu, C.; Fu, M.; He, H.; Wang, X. Depression among Chinese older adults: A perspective from Hukou and health inequities. J. Affect. Disord. 2017, 223, 115–120. [Google Scholar] [CrossRef] [PubMed]
- Sekita, A.; Arima, H.; Ninomiya, T.; Ohara, T.; Doi, Y.; Hirakawa, Y.; Fukuhara, M.; Hata, J.; Yonemoto, K.; Ga, Y.; et al. Elevated depressive symptoms in metabolic syndrome in a general population of Japanese men: A cross-sectional study. BMC Public Health 2013, 13, 862. [Google Scholar] [CrossRef] [PubMed]
- Pereira-Miranda, E.; Costa, P.R.F.; Queiroz, V.A.O.; Pereira-Santos, M.; Santana, M.L.P. Overweight and Obesity Associated with Higher Depression Prevalence in Adults: A Systematic Review and Meta-Analysis. J. Am. Coll. Nutr. 2017, 36, 223–233. [Google Scholar] [CrossRef] [PubMed]
- Luppino, F.S.; de Wit, L.M.; Bouvy, P.F.; Stijnen, T.; Cuijpers, P.; Penninx, B.W.; Zitman, F.G. Overweight, Obesity, and Depression A Systematic Review and Meta-analysis of Longitudinal Studies. Arch. Gen. Psychiatry 2010, 67, 220. [Google Scholar] [CrossRef] [PubMed]
- Brewis, A.A.; Han, S.Y.; SturtzSreetharan, C.L. Weight, gender, and depressive symptoms in South Korea. Am. J. Hum. Biol. 2017, e22972. [Google Scholar] [CrossRef] [PubMed]
- Sachs-Ericsson, N.; Burns, A.B.; Gordon, K.H.; Eckel, L.A.; Wonderlich, S.A.; Crosby, R.D.; Blazer, D.G. Body Mass Index and Depressive Symptoms in Older Adults: The Moderating Roles of Race, Sex, and Socioeconomic Status. Am. J. Geriatr Psychiatry 2007, 15, 815–825. [Google Scholar] [CrossRef] [PubMed]
- Ho, R.C.M.; Niti, M.; Kua, E.H.; Ng, T.-P. Body mass index, waist circumference, waist–hip ratio and depressive symptoms in Chinese elderly: A population-based study. Int. J. Geriatr. Psychiatry 2008, 23, 401–408. [Google Scholar] [CrossRef] [PubMed]
- John, U.; Meyer, C.; Rumpf, H.-J.; Hapke, U. Relationships of psychiatric disorders with overweight and obesity in an adult general population. Obes Res. 2005, 13, 101–109. [Google Scholar] [CrossRef] [PubMed]
- Mikkelsen, K.; Stojanovska, L.; Apostolopoulos, V. The Effects of Vitamin B in Depression. Curr. Med. Chem. 2016, 23, 4317–4337. [Google Scholar] [CrossRef] [PubMed]
- Mikkelsen, K.; Stojanovska, L.; Prakash, M.; Apostolopoulos, V. The effects of vitamin B on the immune/cytokine network and their involvement in depression. Maturitas 2017, 96, 58–71. [Google Scholar] [CrossRef] [PubMed]
- Banikazemi, Z.; Mokhber, N.; Safarian, M.; Mazidi, M.; Mirzaei, H.; Esmaily, H.; Azarpazhooh, M.R.; Ghafouri-Taleghani, F.; Ghayour-Mobarhan, M.; Ferns, G.A. Dietary vitamin E and fat intake are related to Beck’s depression score. Clin. Nutr. ESPEN 2015, 10, e61–e65. [Google Scholar] [CrossRef] [PubMed]
- Maes, M.; De Vos, N.; Pioli, R.; Demedts, P.; Wauters, A.; Neels, H.; Christophe, A. Lower serum vitamin E concentrations in major depression: Another marker of lowered antioxidant defenses in that illness. J. Affect. Disord. 2000, 58, 241–246. [Google Scholar] [CrossRef]
- Bertone-Johnson, E.R.; Powers, S.I.; Spangler, L.; Brunner, R.L.; Michael, Y.L.; Larson, J.C.; Millen, A.E.; Bueche, M.N.; Salmoirago-Blotcher, E.; Liu, S.; et al. Vitamin D intake from foods and supplements and depressive symptoms in a diverse population of older women. Am. J. Clin. Nutr. 2011, 94, 1104–1112. [Google Scholar] [CrossRef] [PubMed]
- Hoogendijk, W.J.G.; Lips, P.; Dik, M.G.; Deeg, D.J.; Beekman, A.T.; Penninx, B.W. Depression Is Associated With Decreased 25-Hydroxyvitamin D and Increased Parathyroid Hormone Levels in Older Adults. Arch. Gen. Psychiatry 2008, 65, 508. [Google Scholar] [CrossRef] [PubMed]
- Ju, S.-Y.; Lee, Y.-J.; Jeong, S.-N. Serum 25-hydroxyvitamin D levels and the risk of depression: A systematic review and meta-analysis. J. Nutr. Health Aging 2013, 17, 447–455. [Google Scholar] [CrossRef] [PubMed]
- Morgan, A.J.; Jorm, A.F. Self-help interventions for depressive disorders and depressive symptoms: A systematic review. Ann. Gen. Psychiatry 2008, 7, 13. [Google Scholar] [CrossRef] [PubMed]
- Bremner, J.D.; Shearer, K.D.; McCaffery, P.J. Retinoic acid and affective disorders: The evidence for an association. J. Clin. Psychiatry 2012, 73, 37–50. [Google Scholar] [CrossRef] [PubMed]
- Ludot, M.; Mouchabac, S.; Ferreri, F. Inter-relationships between isotretinoin treatment and psychiatric disorders: Depression, bipolar disorder, anxiety, psychosis and suicide risks. World J. Psychiatry 2015, 5, 222–227. [Google Scholar] [CrossRef] [PubMed]
- Oishi, J.; Doi, H.; Kawakami, N. Nutrition and depressive symptoms in community-dwelling elderly persons in Japan. Acta Medica Okayama 2009, 63, 9–17. [Google Scholar] [CrossRef] [PubMed]
- Lee, H.K.; Kim, S.Y.; Sok, S.R. Effects of Multivitamin Supplements on Cognitive Function, Serum Homocysteine Level, and Depression of Korean Older Adults With Mild Cognitive Impairment in Care Facilities. J. Nurs. Scholarsh. 2016, 48, 223–231. [Google Scholar] [CrossRef] [PubMed]
- Sparling, T.M.; Henschke, N.; Nesbitt, R.C.; Gabrysch, S. The role of diet and nutritional supplementation in perinatal depression: A systematic review. Matern. Child. Nutr. 2017, 13. [Google Scholar] [CrossRef] [PubMed]
- Coppen, A.; Bolander-Gouaille, C. Treatment of depression: Time to consider folic acid and vitamin B12. J. Psychopharmacol. 2005, 19, 59–65. [Google Scholar] [CrossRef] [PubMed]
- Bromet, E.; Andrade, L.H.; Hwang, I.; Sampson, N.A.; Alonso, J.; de Girolamo, G.; de Graaf, R.; Demyttenaere, K.; Hu, C.; Iwata, N.; et al. Cross-national epidemiology of DSM-IV major depressive episode. BMC Med. 2011, 9, 90. [Google Scholar] [CrossRef] [PubMed] [Green Version]
- Patient Survey|Ministry of Health, Labor and Welfare. Available online: http://www.mhlw.go.jp/toukei/list/10-20.html (accessed on 14 August 2017).
- Shikatown Population. Available online: http://www.town.shika.ishikawa.jp/jyuumin/shika_town_pop/shika_population.html (accessed on 30 August 2017).
- Burke, W.J.; Roccaforte, W.H.; Wengel, S.P. The Short Form of the Geriatric Depression Scale: A Comparison With the 30-Item Form. Top. Geriatr. 1991, 4, 173–178. [Google Scholar] [CrossRef]
- Wancata, J.; Alexandrowicz, R.; Marquart, B.; Weiss, M.; Friedrich, F. The criterion validity of the Geriatric Depression Scale: A systematic review. Acta Psychiatr. Scand. 2006, 114, 398–410. [Google Scholar] [CrossRef] [PubMed]
- Sugishita, K.; Sugishita, M.; Hemmi, I.; Asada, T.; Tanigawa, T. A Validity and Reliability Study of the Japanese Version of the Geriatric Depression Scale 15 (GDS-15-J). Clin. Gerontol. 2017, 40, 233–240. [Google Scholar] [CrossRef] [PubMed]
- Schreiner, A.S.; Hayakawa, H.; Morimoto, T.; Kakuma, T. Screening for late life depression: Cut-off scores for the Geriatric Depression Scale and the Cornell Scale for Depression in Dementia among Japanese subjects. Int. J. Geriatr Psychiatry 2003, 18, 498–505. [Google Scholar] [CrossRef] [PubMed]
- Okubo, H.; Sasaki, S.; Rafamantanantsoa, H.H.; Ishikawa-Takata, K.; Okazaki, H.; Tabata, I. Validation of self-reported energy intake by a self-administered diet history questionnaire using the doubly labeled water method in 140 Japanese adults. Eur. J. Clin Nutr. 2008, 62, 1343–1350. [Google Scholar] [CrossRef] [PubMed]
- Kobayashi, S.; Murakami, K.; Sasaki, S.; Okubo, H.; Hirota, N.; Notsu, A.; Fukui, M.; Date, C. Comparison of relative validity of food group intakes estimated by comprehensive and brief-type self-administered diet history questionnaires against 16 d dietary records in Japanese adults. Public Health Nutr. 2011, 14, 1200–1211. [Google Scholar] [CrossRef] [PubMed]
- Kobayashi, S.; Honda, S.; Murakami, K.; Sasaki, S.; Okubo, H.; Hirota, N.; Notsu, A.; Fukui, M.; Date, C. Both comprehensive and brief self-administered diet history questionnaires satisfactorily rank nutrient intakes in Japanese adults. J. Epidemiol. 2012, 22, 151–159. [Google Scholar] [CrossRef] [PubMed]
- Ministry of Health, Labour and Welfare of Japan. National Health and Nutrition Survey 2013. Available online: http://ghdx.healthdata.org/record/japan-national-health-and-nutrition-survey-2013 (accessed on 25 August 2017).
- Standard Tables of Food Composition in Japan—2015—(Seventh Revised Version). Ministry of Education, Culture, Sports, Science and Technology-Japan. 2015. Available online: http://www.mext.go.jp/en/policy/science_technology/policy/title01/detail01/1374030.htm (accessed on 25 August 2017).
- Satoshi, S.; Ryoko, Y.; Keiko, A. Self-administered diet history questionnaire developed for health education: A relative validation of the test-version by comparison with 3-day diet record in women. J. Epidemiol. 1998, 8, 203–215. [Google Scholar] [CrossRef]
- Mikkelsen, K.; Stojanovska, L.; Tangalakis, K.; Bosevski, M.; Apostolopoulos, V. Cognitive decline: A vitamin B perspective. Maturitas. 2016, 93, 108–113. [Google Scholar] [CrossRef] [PubMed]
- Westhofen, P.; Watzka, M.; Marinova, M.; Hass, M.; Kirfel, G.; Müller, J.; Bevans, C.G.; Müller, C.R.; Oldenburg, J. Human vitamin K 2,3-epoxide reductase complex subunit 1-like 1 (VKORC1L1) mediates vitamin K-dependent intracellular antioxidant function. J. Biol Chem. 2011, 286, 15085–15094. [Google Scholar] [CrossRef] [PubMed]
- Li, J.; Lin, J.C.; Wang, H.; Peterson, J.W.; Furie, B.C.; Furie, B.; Booth, S.L.; Volpe, J.J.; Rosenberg, P.A. Novel Role of Vitamin K in Preventing Oxidative Injury to Developing Oligodendrocytes and Neurons. J. Neurosci. 2003, 23, 5816–5826. [Google Scholar] [PubMed]
- Josey, B.J.; Inks, E.S.; Wen, X.; Chou, C.J. Structure-activity relationship study of vitamin k derivatives yields highly potent neuroprotective agents. J. Med. Chem. 2013, 56, 1007–1022. [Google Scholar] [CrossRef] [PubMed]
- Gancheva, S.M.; Zhelyazkova-Savova, M.D. Vitamin K2 Improves Anxiety and Depression but not Cognition in Rats with Metabolic Syndrome: A Role of Blood Glucose? Folia Medica I Folia Medica 2016, 5858, 264–272. [Google Scholar] [CrossRef] [PubMed]
- Rubio-López, N.; Morales-Suárez-Varela, M.; Pico, Y.; Livianos-Aldana, L.; Llopis-González, A. Nutrient Intake and Depression Symptoms in Spanish Children: The ANIVA Study. Int. J. Environ. Res. Public Health 2016, 13, 352. [Google Scholar] [CrossRef] [PubMed]
- Brody, S. High-dose ascorbic acid increases intercourse frequency and improves mood: A randomized controlled clinical trial. Biol. Psychiatry 2002, 52, 371–374. [Google Scholar] [CrossRef]
- Khajehnasiri, F.; Mortazavi, S.B.; Allameh, A.; Akhondzadeh, S. Effect of omega-3 and ascorbic acid on inflammation markers in depressed shift workers in Shahid Tondgoyan Oil Refinery, Iran: A randomized double-blind placebo-controlled study. J. Clin. Biochem. Nutr. 2013, 53, 36–40. [Google Scholar] [CrossRef] [PubMed]
- Mazloom, Z.; Ekramzadeh, M.; Hejazi, N. Efficacy of Supplementary Vitamins C and E on Anxiety, Depression and Stress in Type 2 Diabetic Patients: A Randomized, Single-blind, Placebo-controlled Trial. Pak. J. Biol Sci. 2013, 16, 1597–1600. [Google Scholar] [CrossRef] [PubMed]
- Payne, M.E.; Steck, S.E.; George, R.R.; Steffens, D.C. Fruit, Vegetable, and Antioxidant Intakes Are Lower in Older Adults with Depression. J. Acad. Nutr. Diet. 2012, 112, 2022–2027. [Google Scholar] [CrossRef] [PubMed]
- Gougeon, L.; Payette, H.; Morais, J.A.; Gaudreau, P.; Shatenstein, B.; Gray-Donald, K. Intakes of folate, vitamin B6 and B12 and risk of depression in community-dwelling older adults: The Quebec Longitudinal Study on Nutrition and Aging. Eur. J. Clin Nutr. 2016, 70, 380–385. [Google Scholar] [CrossRef] [PubMed]
- Hodge, A.; Almeida, O.P.; English, D.R.; Giles, G.G.; Flicker, L. Patterns of dietary intake and psychological distress in older Australians: Benefits not just from a Mediterranean diet. Int. Psychogeriatr. 2013, 25, 456–466. [Google Scholar] [CrossRef] [PubMed]
- Tolmunen, T.; Voutilainen, S.; Hintikka, J.; Rissanen, T.; Tanskanen, A.; Viinamäki, H.; Kaplan, G.A.; Salonen, J.T. Dietary folate and depressive symptoms are associated in middle-aged Finnish men. J. Nutr. 2003, 133, 3233–3236. [Google Scholar] [PubMed]
- Wang, Y.; Yang, H.; Meng, P.; Han, Y. Association between low serum 25-hydroxyvitamin D and depression in a large sample of Chinese patients with type 2 diabetes mellitus. J. Affect. Disord. 2016. [Google Scholar] [CrossRef] [PubMed]
- Murphy, P.; Wagner, C. Vitamin D and Mood Disorders Among Women: An Integrative Review. J. Midwifery Womens Health 2008, 53, 440–446. [Google Scholar] [CrossRef] [PubMed]
- Pan, A.; Lu, L.; Franco, O.H.; Yu, Z.; Li, H.; Lin, X. Association between depressive symptoms and 25-hydroxyvitamin D in middle-aged and elderly Chinese. J. Affect. Disord. 2009, 118, 240–243. [Google Scholar] [CrossRef] [PubMed]
- Zhao, G.; Ford, E.S.; Li, C.; Balluz, L.S. No associations between serum concentrations of 25-hydroxyvitamin D and parathyroid hormone and depression among US adults. Br. J. Nutr. 2010, 104, 1696–1702. [Google Scholar] [CrossRef] [PubMed]
- Jääskeläinen, T.; Knekt, P.; Suvisaari, J.; Männistö, S.; Partonen, T.; Sääksjärvi, K.; Kaartinen, N.E.; Kanerva, N.; Lindfors, O. Higher serum 25-hydroxyvitamin D concentrations are related to a reduced risk of depression. Br. J. Nutr. 2017. [Google Scholar] [CrossRef] [PubMed]
- Zhang, Z.; Pereira, S.; Luo, M.; Matheson, E. Evaluation of Blood Biomarkers Associated with Risk of Malnutrition in Older Adults: A Systematic Review and Meta-Analysis. Nutrients 2017, 9, 829. [Google Scholar] [CrossRef] [PubMed]
- Smoliner, C.; Norman, K.; Wagner, K.-H.; Hartig, W.; Lochs, H.; Pirlich, M. Malnutrition and depression in the institutionalised elderly. Br. J. Nutr. 2017. [Google Scholar] [CrossRef] [PubMed]
- Stunkard, A.J.; Faith, M.S.; Allison, K.C. Depression and obesity. Biol. Psychiatry 2003, 54, 330–337. [Google Scholar] [CrossRef]
- Faith, M.S.; Matz, P.E.; Jorge, M.A. Obesity–depression associations in the population. J. Psychosom. Res. 2002, 53, 935–942. [Google Scholar] [CrossRef]
- Ministry of Health, Labour and Welfare Japan. The National Health and Nutrition Survey in Japan, 2012. 2014. Available online: http://www.mhlw.go.jp/bunya/kenkou/eiyou/h24-houkoku.html (accessed on 25 August 2017).
- Nanri, A.; Kimura, Y.; Matsushita, Y.; Ohta, M.; Sato, M.; Mishima, N.; Sasaki, S.; Mizoue, T. Dietary patterns and depressive symptoms among Japanese men and women. Eur. J. Clin Nutr. 2010, 64, 832–839. [Google Scholar] [CrossRef] [PubMed]
- Miki, T.; Kochi, T.; Kuwahara, K.; Eguchi, M.; Kurotani, K.; Tsuruoka, H.; Ito, R.; Kabe, I.; Kawakami, N.; Mizoue, T.; Nanri, A. Dietary patterns derived by reduced rank regression (RRR) and depressive symptoms in Japanese employees: The Furukawa nutrition and health study. Psychiatry Res. 2015, 229, 214–219. [Google Scholar] [CrossRef] [PubMed]
- Livingstone, M.B.E.; Black, A.E. Markers of the validity of reported energy intake. J. Nutr. 2003, 133, 895S–920S. [Google Scholar] [PubMed]


| Male | Female | ||||||
|---|---|---|---|---|---|---|---|
| Non-Depressive Symptoms (n = 528) | Depressive Symptoms (n = 192) | p1 | Non-Depressive Symptoms (n = 669) | Depressive Symptoms (n = 245) | p2 | ||
| Age (years) (mean ± SD) | 73.0 ± 6.6 | 75.1 ± 7.3 | 0.001 | 74.10 ± 7.3 | 78.3 ± 8.2 | <0.001 | |
| Height (cm) (mean ± SD) | 163.6 ± 6.1 | 162.8 ± 6.4 | 0.091 | 150.1 ± 5.7 | 148.1 ± 6.6 | <0.001 | |
| Weight (kg) (mean ± SD) | 62.5 ± 9.3 | 61.6 ± 10.0 | 0.224 | 51.6 ±8.2 | 47.9 ± 8.1 | <0.001 | |
| BMI (mean ± SD) | 23.3 ± 2.9 | 23.3 ± 3.3 | 0.707 | 22.9 ± 3.2 | 21.8 ± 3.4 | <0.001 | |
| BMI groups | Underweight (115) | 22 (4.2%) | 10 (5.2%) | 0.741 | 46 (6.9%) | 37 (15.1%) | <0.001 |
| Normal weight (1141) | 371 (70.3%) | 130 (67.7%) | 466 (69.7%) | 174 (71.0%) | |||
| Overweight (378) | 135 (35.6%) | 52 (27.1%) | 157 (23.5%) | 34 (13.9%) | |||
| Energy | (kcal/day) | 2058.7 ± 644.4 | 1893.0 ± 582.1 | 0.001 | 1697.7 ± 544.3 | 1607.3 ± 557.0 | 0.027 |
| Protein | (g/1000 kcal) | 38.1 ± 7.8 | 38.3 ± 8.1 | 0.744 | 40.9 ± 8.6 | 38.8 ± 7.8 | 0.001 |
| Lipids (g/1000 kcal) | 26.1 ± 6.2 | 26.2 ± 6.4 | 0.846 | 28.9 ± 6.5 | 27.5 ± 6.8 | 0.005 | |
| Carbohydrates (g/1000 kcal) | 133.9 ± 22.2 | 137.8 ± 21.8 | 0.036 | 139.9 ± 20.3 | 144.7 ± 19.8 | 0.001 | |
| Vitamin (g/1000 kcal) | Non-Depressive Symptoms (n = 1197) | Depressive Symptoms (n = 437) | p |
|---|---|---|---|
| Vitamin Intake (mean ± SD) | |||
| Retinol | 218.11 ± 266.03 | 197.54 ± 169.56 | 0.132 |
| Retinol equivalent | 401.32 ± 294.33 | 361.63 ± 203.53 | 0.011 |
| Beta-carotene equivalent | 2176.61 ± 1412.54 | 1958.11 ± 1368.00 | 0.005 |
| Vitamin D | 9.64 ± 5.75 | 9.05 ± 5.53 | 0.064 |
| Alpha-tocopherol | 4.02 ± 1.15 | 3.08 ± 1.11 | 0.001 |
| Vitamin K | 181.96 ± 100.73 | 156.02 ± 89.51 | <0.001 |
| Vitamin B1 | 0.42 ± 0.10 | 0.41 ± 0.10 | 0.002 |
| Vitamin B2 | 0.72 ± 0.21 | 0.69 ± 0.20 | 0.007 |
| Vitamin B3 | 9.48 ± 2.89 | 8.80 ± 2.64 | <0.001 |
| Vitamin B5 | 3.58 ± 0.79 | 3.45 ± 0.72 | 0.002 |
| Vitamin B6 | 0.73 ± 0.20 | 0.68 ± 0.18 | <0.001 |
| Vitamin B9 | 190.29 ± 75.91 | 171.72 ± 65.14 | <0.001 |
| Vitamin B12 | 6.35 ± 3.35 | 5.84 ± 3.09 | 0.006 |
| Vitamin C | 65.78 ± 32.96 | 58.61 ± 30.65 | <0.001 |
| Cryptoxanthine | 165.19 ± 148.49 | 145.59 ± 152.49 | 0.019 |
| Vitamin (g/1000 kcal) | Male (n = 720) | Female (n = 914) | ||||
|---|---|---|---|---|---|---|
| Non-Depressive Symptoms (n = 528, 73.3%) | Depressive Symptoms (n = 192, 26.7%) | p1 | Non-Depressive Symptoms (n = 669, 73.2%) | Depressive Symptoms (n = 245, 26.8%) | p2 | |
| Vitamin Intake (mean ± SD) | Vitamin Intake (mean ± SD) | |||||
| Retinol | 237.11 ± 361.04 | 223.85 ± 221.95 | 0.633 | 203.11 ± 152.85 | 176.92 ± 108.81 | 0.004 |
| Retinol equivalent | 394.48 ± 377.24 | 368.73 ± 242.38 | 0.378 | 406.72 ± 206.79 | 357.85 ± 167.28 | <0.001 |
| Beta-carotene equivalent | 1866.66 ± 1232.40 | 1715.04 ± 1181.41 | 0.140 | 2421.24 ± 1496.10 | 2148.59 ± 1472.59 | 0.014 |
| Vitamin D | 9.10 ± 5.37 | 9.35 ± 5.63 | 0.590 | 10.06 ± 6.01 | 8.82 ± 5.46 | 0.005 |
| Alpha-tocopherol | 3.69 ± 1.04 | 3.65 ± 1.04 | 0.609 | 4.28 ± 1.17 | 3.93 ± 1.16 | <0.001 |
| Vitamin K | 165.52 ± 89.82 | 148.69 ± 83.04 | 0.024 | 194.94 ± 106.87 | 161.76 ± 94.01 | <0.001 |
| Vitamin B1 | 0.39 ± 0.09 | 0.39 ± 0.09 | 0.578 | 0.45 ± 0.10 | 0.42 ± 0.10 | 0.001 |
| Vitamin B2 | 0.68 ± 0.20 | 0.68 ± 0.20 | 0.969 | 0.74 ± 0.21 | 0.69 ± 0.20 | <0.001 |
| Vitamin B3 | 9.20 ± 2.78 | 8.82 ± 2.53 | 0.095 | 9.70 ± 2.95 | 8.77 ± 2.73 | <0.001 |
| Vitamin B5 | 3.39 ± 0.73 | 3.39 ± 0.72 | 0.933 | 3.74 ± 0.81 | 3.50 ± 0.72 | <0.001 |
| Vitamin B6 | 0.70 ± 0.18 | 0.68 ± 0.18 | 0.155 | 0.75 ± 0.21 | 0.69 ± 0.19 | <0.001 |
| Vitamin B9 | 178.17 ± 70.28 | 168.11 ± 62.62 | 0.081 | 199.87 ± 78.83 | 174.56 ± 67.03 | <0.001 |
| Vitamin B12 | 6.22 ± 3.32 | 6.12 ± 3.31 | 0.708 | 6.45 ± 3.37 | 5.62 ± 2.91 | 0.001 |
| Vitamin C | 57.45 ± 29.89 | 55.11 ± 32.27 | 0.363 | 72.34 ± 33.79 | 61.36 ± 29.09 | <0.001 |
| Cryptoxanthine | 132.53 ± 124.92 | 142.65 ± 176.63 | 0.394 | 190.97 ± 160.18 | 147.89 ± 130.84 | <0.001 |
| Vitamin (g/1000 kcal) | Underweight | Normal Weight | Overweight | ||||||
|---|---|---|---|---|---|---|---|---|---|
| Non-Depressive Symptoms (n = 68) | Depressive Symptoms (n = 47) | p1 | Non-Depressive Symptoms (n = 837) | Depressive Symptoms (n = 304) | p2 | Non-Depressive Symptoms (n = 292) | Depressive Symptoms (n = 86) | p3 | |
| Vitamin Intake (mean ± SD) | Vitamin Intake (mean ± SD) | Vitamin Intake (mean ± SD) | |||||||
| Retinol | 210.08 ± 151.47 | 193.65 ± 156.16 | 0.573 | 218.76 ± 294.58 | 204.49 ± 183.80 | 0.429 | 218.09 ± 190.09 | 175.06 ± 114.67 | 0.010 |
| Retinol equivalent | 388.40 ± 194.04 | 386.42 ± 199.02 | 0.958 | 405.21 ± 318.96 | 374.21 ± 215.49 | 0.117 | 393.19 ± 234.44 | 308.70 ± 147.56 | <0.001 |
| Beta-carotene equivalent | 2117.37 ± 1544.73 | 2286.89 ± 1619.20 | 0.572 | 2215.12 ± 1395.75 | 2013.97 ± 1405.64 | 0.033 | 2080.02 ± 1428.29 | 1580.93 ± 960.37 | <0.001 |
| Vitamin D | 9.29 ± 5.09 | 10.14 ± 5.54 | 0.398 | 9.66 ± 5.88 | 9.10 ± 5.46 | 0.150 | 9.67 ± 5.55 | 8.27 ± 5.75 | 0.043 |
| Alpha-tocopherol | 4.05 ± 1.09 | 4.02 ± 1.28 | 0.897 | 4.02 ± 1.17 | 3.83 ± 1.09 | 0.016 | 4.02 ± 1.11 | 3.58 ± 1.08 | 0.001 |
| Vitamin K | 180.55 ± 98.0 | 153.55 ± 86.23 | 0.130 | 183.08 ± 100.47 | 162.02 ± 92.38 | 0.001 | 179.10 ± 102.37 | 136.16 ± 78.27 | <0.001 |
| Vitamin B1 | 0.42 ± 0.10 | 0.43 ± 0.11 | 0.461 | 0.42 ± 0.10 | 0.41 ± 0.09 | 0.037 | 042 ± 0.10 | 0.38 ± 0.09 | 0.001 |
| Vitamin B2 | 0.72 ± 0.20 | 0.70 ± 0.18 | 0.600 | 0.72 ± 0.21 | 0.69 ± 0.21 | 0.145 | 0.72 ± 0.22 | 0.65 ± 0.19 | 0.005 |
| Vitamin B3 | 9.17 ± 2.63 | 8.81 ± 2.79 | 0.488 | 9.49 ± 2.91 | 8.90 ± 2.55 | 0.001 | 9.55 ± 2.89 | 8.41 ± 2.88 | 0.001 |
| Vitamin B5 | 3.62 ± 0.76 | 3.56 ± 0.66 | 0.707 | 3.58 ± 0.79 | 3.48 ± 0.72 | 0.043 | 3.59 ± 0.81 | 3.31 ± .073 | 0.003 |
| Vitamin B6 | 0.72 ± 0.20 | 0.71 ± 0.20 | 0.829 | 0.73 ± 0.20 | 0.69 ± 0.18 | 0.002 | 0.73 ± 0.19 | 0.64 ± 0.19 | <0.001 |
| Vitamin B9 | 185.01 ± 69.89 | 174.95 ± 69.57 | 0.449 | 191.74 ± 76.54 | 176.09 ± 66.01 | 0.001 | 187.39 ± 75.58 | 154.52 ± 56.90 | <0.001 |
| Vitamin B12 | 6.10 ± 3.01 | 6.08 ± 3.37 | 0.966 | 6.33 ± 3.39 | 5.92 ± 3.06 | 0.065 | 6.48 ± 3.33 | 5.44 ± 3.09 | 0.010 |
| Vitamin C | 63.48 ± 29.69 | 60.49 ± 35.16 | 0.623 | 66.30 ± 33.55 | 60.32 ± 3.17 | 0.005 | 64.81 ± 32.01 | 51.51 ± 24.98 | <0.001 |
| Cryptoxanthine | 158.82 ± 124.14 | 148.58 ± 162.53 | 0.703 | 164.99 ± 149.82 | 146.52 ± 153.02 | 0.067 | 167.25 ± 150.27 | 140.65 ± 146.56 | 0.148 |
| Vitamin (g/1000 kcal) | Male | Female | ||||
|---|---|---|---|---|---|---|
| B | OR (95% CI) | p | B | OR (95% CI) | p | |
| Retinol | 0.000 | 1.000 (0.999–1.000) | 0.779 | −0.001 | 0.999 (0.997–1.000) | 0.098 |
| Retinol equivalent | 0.000 | 1.000 (0.999–1.000) | 0.459 | −0.001 | 0.999 (0.997–1.000) | 0.006 |
| Beta-carotene equivalent | 0.000 | 1.000 (1.000–1.000) | 0.065 | 0.000 | 1.000 (1.000–1.000) | 0.024 |
| Vitamin D | 0.037 | 1.038 (0.998–1.080) | 0.063 | −0.032 | 0.969 (0.935–1.004) | 0.080 |
| Alpha-tocopherol | 0.014 | 1.014 (0.830–1.239) | 0.889 | −0.239 | 0.788 (0.645–0.962) | 0.020 |
| Vitamin K | −0.002 | 0.998 (0.996–1.000) | 0.052 | −0.003 | 0.997 (0.995–0.999) | 0.001 |
| Vitamin B1 | −0.585 | 0.557 (0.066–4.729) | 0.592 | −2.148 | 0.117 (0.014–0.949) | 0.044 |
| Vitamin B2 | −0.045 | 0.956 (0.345–2.649) | 0.931 | −1.183 | 0.306 (0.102–0.921) | 0.035 |
| Vitamin B3 | −0.019 | 0.981 (0.902–1.067) | 0.652 | −0.082 | 0.921 (0.847–1.002) | 0.055 |
| Vitamin B5 | −0.013 | 0.987 (0.754–1.291) | 0.923 | −0.388 | 0.678 (0.511–0.901) | 0.007 |
| Vitamin B6 | −0.323 | 0.724 (0.213–2.458) | 0.605 | −1.656 | 0.191 (0.064–0.570) | 0.003 |
| Vitamin B9 | −0.003 | 0.997 (0.995–1.000) | 0.073 | −0.005 | 0.995 (0.993–0.998) | 0.000 |
| Vitamin B12 | 0.029 | 1.030 (0.964–1.099) | 0.383 | −0.079 | 0.924 (0.862–0.989) | 0.023 |
| Vitamin C | −0.004 | 0.996 (0.990–1.003) | 0.245 | −0.010 | 0.990 (0.985–0.996) | 0.001 |
| Cryptoxanthine | 0.000 | 1.000 (0.999–1.002) | 0.542 | −0.002 | 0.998 (0.997–0.999) | 0.003 |
| Vitamin (g/1000 kcal) | B | Underweight | p | B | Normal Weight | p | B | Overweight | p |
|---|---|---|---|---|---|---|---|---|---|
| OR (95% CI) | OR (95% CI) | OR (95% CI) | |||||||
| Retinol | 0.000 | 1.000 (0.994–1.007) | 0.892 | −0.002 | 0.998 (0.997–1.000) | 0.134 | −0.005 | 0.995 (0.990–1.000) | 0.061 |
| Retinol equivalent | 0.000 | 1.000 (0.996–1.004) | 0.991 | −0.002 | 0.998 (0.997–1.000) | 0.012 | −0.004 | 0.996 (0.992–0.999) | 0.022 |
| Beta-carotene equivalent | 0.000 | 1.000 (1.000–1.000) | 0.926 | 0.000 | 1.000 (1.000–1.000) | 0.039 | 0.000 | 1.000 (0.999–1.000) | 0.201 |
| Vitamin D | 0.080 | 1.083 (0.934–1.257) | 0.290 | −0.029 | 0.971 (0.933–1.011) | 0.153 | −0.133 | 0.876 (0.771–0.995) | 0.042 |
| Alpha-tocopherol | −0.299 | 0.742 (0.369–1.492) | 0.402 | −0.253 | 0.777 (0.613–0.983) | 0.036 | −0.185 | 0.831 (0.449–1.538) | 0.555 |
| Vitamin K | −0.007 | 0.993 (0.985–1.000) | 0.056 | −0.002 | 0.998 (0.996–1.000) | 0.043 | −0.009 | 0.992 (0.985–0.998) | 0.015 |
| Vitamin B1 | −1.998 | 0.136 (0.00–229.57) | 0.598 | −2.552 | 0.078 (0.006–0.963) | 0.047 | −4.167 | 0.016 (0.000–6.160) | 0.172 |
| Vitamin B2 | −1.668 | 0.189 (0.01–30.431) | 0.520 | −0.850 | 0.427 (0.119–1.535) | 0.192 | −3.852 | 0.021 (0.001–0.479) | 0.015 |
| Vitamin B3 | 0.095 | 1.099 (0.804–1.503) | 0.553 | −0.082 | 0.921 (0.834–1.017) | 0.104 | −0.136 | 0.873 (0.692–1.102) | 0.254 |
| Vitamin B5 | −0.648 | 0.523 (0.169–1.619) | 0.261 | −0.309 | 0.734 (0.524–1.029) | 0.072 | −0.950 | 0.387 (0.181–0.826) | 0.014 |
| Vitamin B6 | −1.056 | 0.348 (0.008–15.34) | 0.585 | −1.737 | 0.176 (0.047–0.657) | 0.010 | −2.692 | 0.068 (0.003–1.433) | 0.084 |
| Vitamin B9 | −0.004 | 0.996 (0.985–1.006) | 0.419 | −0.004 | 0.996 (0.993–0.999) | 0.005 | −0.010 | 0.990 (0.982–0.999) | 0.023 |
| Vitamin B12 | 0.108 | 1.114 (0.842–1.473) | 0.450 | −0.077 | 0.926 (0.855–1.003) | 0.060 | −0.196 | 0.822 (0.672–1.006) | 0.057 |
| Vitamin C | −0.008 | 0.992 (0.972–1.012) | 0.426 | −0.010 | 0.991 (0.984–0.997) | 0.004 | −0.014 | 0.986 (0.969–1.003) | 0.112 |
| Cryptoxanthin | −0.002 | 0.998 (0.994–1.002) | 0.361 | −0.002 | 0.998 (0.996–0.999) | 0.007 | −0.001 | 0.999 (0.996–1.002) | 0.588 |
© 2017 by the authors. Licensee MDPI, Basel, Switzerland. This article is an open access article distributed under the terms and conditions of the Creative Commons Attribution (CC BY) license (http://creativecommons.org/licenses/by/4.0/).
Share and Cite
Nguyen, T.T.T.; Tsujiguchi, H.; Kambayashi, Y.; Hara, A.; Miyagi, S.; Yamada, Y.; Nakamura, H.; Shimizu, Y.; Hori, D.; Suzuki, F.; et al. Relationship between Vitamin Intake and Depressive Symptoms in Elderly Japanese Individuals: Differences with Gender and Body Mass Index. Nutrients 2017, 9, 1319. https://doi.org/10.3390/nu9121319
Nguyen TTT, Tsujiguchi H, Kambayashi Y, Hara A, Miyagi S, Yamada Y, Nakamura H, Shimizu Y, Hori D, Suzuki F, et al. Relationship between Vitamin Intake and Depressive Symptoms in Elderly Japanese Individuals: Differences with Gender and Body Mass Index. Nutrients. 2017; 9(12):1319. https://doi.org/10.3390/nu9121319
Chicago/Turabian StyleNguyen, Thao Thi Thu, Hiromasa Tsujiguchi, Yasuhiro Kambayashi, Akinori Hara, Sakae Miyagi, Yohei Yamada, Haruki Nakamura, Yukari Shimizu, Daisuke Hori, Fumihiko Suzuki, and et al. 2017. "Relationship between Vitamin Intake and Depressive Symptoms in Elderly Japanese Individuals: Differences with Gender and Body Mass Index" Nutrients 9, no. 12: 1319. https://doi.org/10.3390/nu9121319
APA StyleNguyen, T. T. T., Tsujiguchi, H., Kambayashi, Y., Hara, A., Miyagi, S., Yamada, Y., Nakamura, H., Shimizu, Y., Hori, D., Suzuki, F., Hayashi, K., & Nakamura, H. (2017). Relationship between Vitamin Intake and Depressive Symptoms in Elderly Japanese Individuals: Differences with Gender and Body Mass Index. Nutrients, 9(12), 1319. https://doi.org/10.3390/nu9121319