Article

Serum Amyloid A Production Is Triggered by Sleep Deprivation in Mice and Humans: Is That the Link between Sleep Loss and Associated Comorbidities?

1
Departamento de Análises Clínicas e Toxicológicas, Universidade de São Paulo, Av. Prof. Lineu Prestes, 580, São Paulo SP 05509-000, Brazil
2
Departamento de Psicobiologia, Universidade Federal de São Paulo, Rua Napoleão de Barros, 925, São Paulo SP 04024-002, Brazil
*
Author to whom correspondence should be addressed.
Nutrients 2017, 9(3), 311; https://doi.org/10.3390/nu9030311
Submission received: 29 November 2016 / Revised: 7 March 2017 / Accepted: 16 March 2017 / Published: 21 March 2017

Abstract

:
Serum amyloid A (SAA) was recently associated with metabolic endotoxemia, obesity and insulin resistance. Concurrently, insufficient sleep adversely affects metabolic health and is an independent predisposing factor for obesity and insulin resistance. In this study we investigated whether sleep loss modulates SAA production. The serum SAA concentration increased in C57BL/6 mice subjected to sleep restriction (SR) for 15 days or to paradoxical sleep deprivation (PSD) for 72 h. Sleep restriction also induced the upregulation of Saa1.1/Saa2.1 mRNA levels in the liver and Saa3 mRNA levels in adipose tissue. SAA levels returned to the basal range after 24 h in paradoxical sleep rebound (PSR). Metabolic endotoxemia was also a finding in SR. Increased plasma levels of SAA were also observed in healthy human volunteers subjected to two nights of total sleep deprivation (Total SD), returning to basal levels after one night of recovery. The observed increase in SAA levels may be part of the initial biochemical alterations caused by sleep deprivation, with potential to drive deleterious conditions such as metabolic endotoxemia and weight gain.

1. Introduction

Obesity is now reaching pandemic proportions across much of the world and its consequences includes unprecedented health, social and economic issues. Several aggravating factors have been identified and are considered contributors to the current epidemic of obesity. Sleep disorders are among the factors that raised more concerns (for review see [1,2]).
Sleep loss induces metabolic and endocrine alterations, such as decreased glucose tolerance, decreased insulin sensitivity, increased concentrations of cortisol and ghrelin, decreased levels of leptin, and increased hunger and appetite [2]. Although these metabolic and endocrine alterations are frequently used to support a causal relationship between sleep loss and obesity/insulin resistance, it is still missing the identification of a triggering factor for weight gain in sleep disorders.
The difficulty of translating findings directly from animal models to humans and the challenge of finding an experimental model that leads to weight gain are some of the elements that prevent new discoveries regarding the mechanisms involved in weight gain led by sleep loss. Recently, using the multiple platform sleep restriction (SR) experimental model, we were able to link a past history of sleep restriction to subsequent complications arising from a high-fat diet [3].
Several possible causes linking reduced sleep and obesity, such as neuroendocrine changes, increased food intake, decreased energy expenditure and circadian disruption, share an inflammatory status as a common factor. Here, we focused in a specific inflammatory protein that has progressively gained recognition for its role in the obesity process, the acute phase protein serum amyloid A (SAA). Recently, we used SAA-targeted antisense oligonucleotide (ASOSAA) on a high-fat diet-induced obesity model and identified SAA as an additional trigger driving endotoxemia, weight gain and insulin signaling impairment [4].
SAA production is upregulated in the liver and adipose tissue in the acute inflammatory process and it has been considered to have a role in the activation of immune cells triggering inflammatory responses [5]. Moreover, SAA has growth factor–like activity, such as increasing the proliferation of different cell types, including preadipocytes [6,7]. SAA is also able to bind to members of the Toll-like receptors (TLRs) family that are involved in the inflammatory process and metabolic control in obesity [8,9]. Here, we addressed if the production of SAA is one of the biochemical factors present in sleep restriction.

2. Materials and Methods

Animals. Male C57BL/6 mouse (three months of age) from CEDEME Universidade Federal de São Paulo (UNIFESP), housed in a room maintained at 20 ± 2 °C in 12:12 h light/dark cycle, chow diet (Nuvilab CR-1, Colombo, Brazil) and water ad libitum, were submitted to sleep restriction (SR) or paradoxical sleep deprivation (PSD) protocols. For each experimental group, six to 12 animals were used. The experimental protocol was approved by the Ethical Committee of UNIFESP (approval No. 0474/09). The euthanasia occurred immediately after each last experimental period by anesthesia overdose (i.p. administration of a combination of ketamine (100 mg/kg) and xylazine (15 mg/kg)), and ensured by cervical dislocation. During terminal anesthesia, serum samples were collected by cardiac puncture.
Sleep restriction (SR) protocol. The SR method used in this study was an adaptation of the multiple platform method, originally developed for rats [10], and performed as previously described [3,11,12]. The animals were randomly assigned into control group and SR group. The SR group was sleep restricted for 15 days, 21 h daily. After each 21 h period of SR, the mice were allowed to sleep for 3 h (sleep opportunity beginning at 10 a.m.).
Paradoxical sleep deprivation (PSD) and paradoxical sleep rebound (PSR) protocols. For PSD experiments, the animals were randomly assigned into three groups: the control group, the PSD group and the PSR group. PSD animals were sleep deprived for 72 consecutive hours, using the multiple platform method as previously described [3,13,14,15]. The PSR mice were sleep deprived for 72 consecutive hours followed by 24 h in sleep rebound period. A home cage control group was in the same room for the duration of the experiment, sleeping ad libitum. During the 72 h PSD period mice were placed inside a water tank (41 cm × 34 cm × 17.5 cm), filled up to 1 cm of the upper border and containing 12 circular platforms, 3.5 cm in diameter. Animals could thus move around inside the tank by jumping from one platform to another. When PSD was reached, muscle atonia set in, animals fell into the water and woke up. Food and water were provided ad libitum. Water in the tank was changed daily throughout the study period.
Human sleep deprivation. The experimental protocol was performed as previously described [16,17] with 30 healthy male volunteers ranging from 19 to 29 years. The exclusion criteria included sleep disorders, shift work, extreme morningness-eveningness, neurological or psychiatric diseases, smoking and alcohol or substance abuse, including any medicine able to change sleep patterns. The participants had normal results on Pittsburgh Sleep Quality Index, Epworth Sleepness Scale and Beck Depression Inventory. Briefly, three experimental groups were randomly assigned (10 non-sleep deprived, 10 total sleep deprived, and 10 REM sleep deprived) and the protocol was performed on nine consecutive days: one adaptation night, one baseline night, two nights of total sleep deprivation (Total SD) or four nights of REM sleep deprivation (REM SD), followed by three nights of sleep recovery for both groups. The control group was also maintained in the laboratory during the entire experimental protocol and had regular nights of sleep monitored by polysomnography (uninterrupted sleep showing normal sleep patterns). All subjects remained in the research center throughout the study period respecting a bedtime schedule (from 11 p.m. to 8 a.m.), in accordance with their regular habits (7–9 h sleep per night), and receiving 4 meals per day [17]. Total SD volunteers could read, play games, watch television or ambulate within the building to help them stay awake. Therefore, we cannot exclude circadian interference on SAA levels. The subjects were also abstained from running or any other type of resistance exercise. The investigators were continuously present to monitor wakefulness to ensure that subjects would not fall asleep during the study. REM SD volunteers were awakened when observed desynchronized EEG without spindles or K complexes and the concomitant reduction of the tonic electromyogram amplitude. The volunteers were kept awake for a sufficient time to avoid an immediate relapse into REM sleep while keeping the waking episodes short enough to allow frequent interventions. The study was conducted at the Sleep Laboratory of the Department of Psychobiology at the Universidade Federal de São Paulo (UNIFESP) with the approval of the Ethics Committee of the University (#1163/2016). All participants provided informed consent prior to enrolling in the study. Blood samples were obtained every morning (8 a.m.) during the experimental protocol (baseline, two nights of Total SD, four nights of REM SD and three nights of recovery). Blood samples were centrifuged immediately at 4 °C, and then the plasma were stored at −80 °C until the assays were conducted.
Quantitative real-time PCR. Total RNA from epididymal adipose tissue and liver was isolated using Qiagen RNeasy® Lipid Tissue Mini kit (Qiagen, Hilden, Germany). cDNA was then synthesized from 1 μg of RNA using the High Capacity cDNA Reverse Transcription (Life Technologies®, Grand Island, NY, USA). Real-time PCR were performed using SyBr® Green Master Mix (Life Technologies®, Grand Island, NY, USA) for Saa1.1/2.1 (F-5′-AGA CAA ATA CTT CCA TGC TCG G-3′ and R-5′-CAT CAC TGA TTT TCT CAG CAG C-3′). Real-time PCR for Saa3 was performed using the TaqMan® assay (Applied Biosystems®, Grand Island, NJ, USA), catalogue number Mm00441203_m1–Saa3 and β-actin (Actb), number 4552933E, as an endogenous housekeeping gene control. Relative gene expression was determined using the 2−ΔΔCt method [18].
SAA and endotoxin quantification. Serum/plasma concentrations of SAA were determined using ELISA following the manufacturer’s instructions: mouse SAA (Tridelta Development Ltd., Maynooth, Ireland) and human SAA (Invitrogen®, Camarillo, CA, USA). Endotoxin was measured with the limulus amoebocyte lysate (LAL) chromogenic endpoint assay (Lonza, Allendale, NJ, USA).
Immunofluorescence. Using paraffin-embedded sections (5 μm thick) from epididymal adipose tissue, immunofluorescence for SAA was performed using a rabbit anti-mouse SAA (1:200 dilution, kindly produced and provided by De Beer laboratory, University of Kentucky, KY, USA) [19], subsequently incubated with the appropriate secondary fluorescent antibody (Invitrogen®, Camarillo, CA, USA) and the slides mounted using Vectashield set mounting medium with 4,6-diamidino-2-phenylindol-2-HCl (DAPI; Vector Laboratories Inc., Burlingame, CA, USA). An isotype control was used to ensure antibody specificity in each staining. Tissue sections were observed with a Nikon Eclipse 80i microscope (Nikon®, Tokyo, Japan) and digital images were captured with NIS-Element AR software (Nikon®, Tokyo, Japan).
Statistical analysis. Results were presented as mean ± SEM and the number of independent experiments is indicated in each graph. Statistical analysis was performed with Graph Pad Prism4 (Graph Pad Software, Inc., San Diego, CA, USA). When multiple samples were compared with one independent variable, one-way analysis of variance with Newman-Keuls post hoc test was performed. The level of significance was set at p < 0.05.

3. Results

Mice subjected to sleep restriction (SR) for 21 h daily during 15 days lost weight (Figure 1A). After seven and 15 days of SR, mice lost approximately 7% and 12% of weight, respectively. SR led to an increase in serum SAA and endotoxin of approximately four times (Figure 1B,C). Saa1.1/2.1 and Saa3 are inducible tissue-specific isoforms in the liver and adipose tissue, respectively [5,20,21]. Sleep restriction led to the mRNA expression of tissue-specific isoforms of SAA (Figure 1D–G). In the liver, the isoform Saa1.1/2.1 was upregulated 10–40 times (Figure 1D) and Saa3 remained unaltered (Figure 1E). In adipose tissue, whereas no difference in Saa1.1/2.1 expression was observed (Figure 1F), the isoform Saa3 was upregulated around seven times (Figure 1G). The data was confirmed by immunostaining the adipose tissue, where SAA production was induced after SR (Figure 1H).
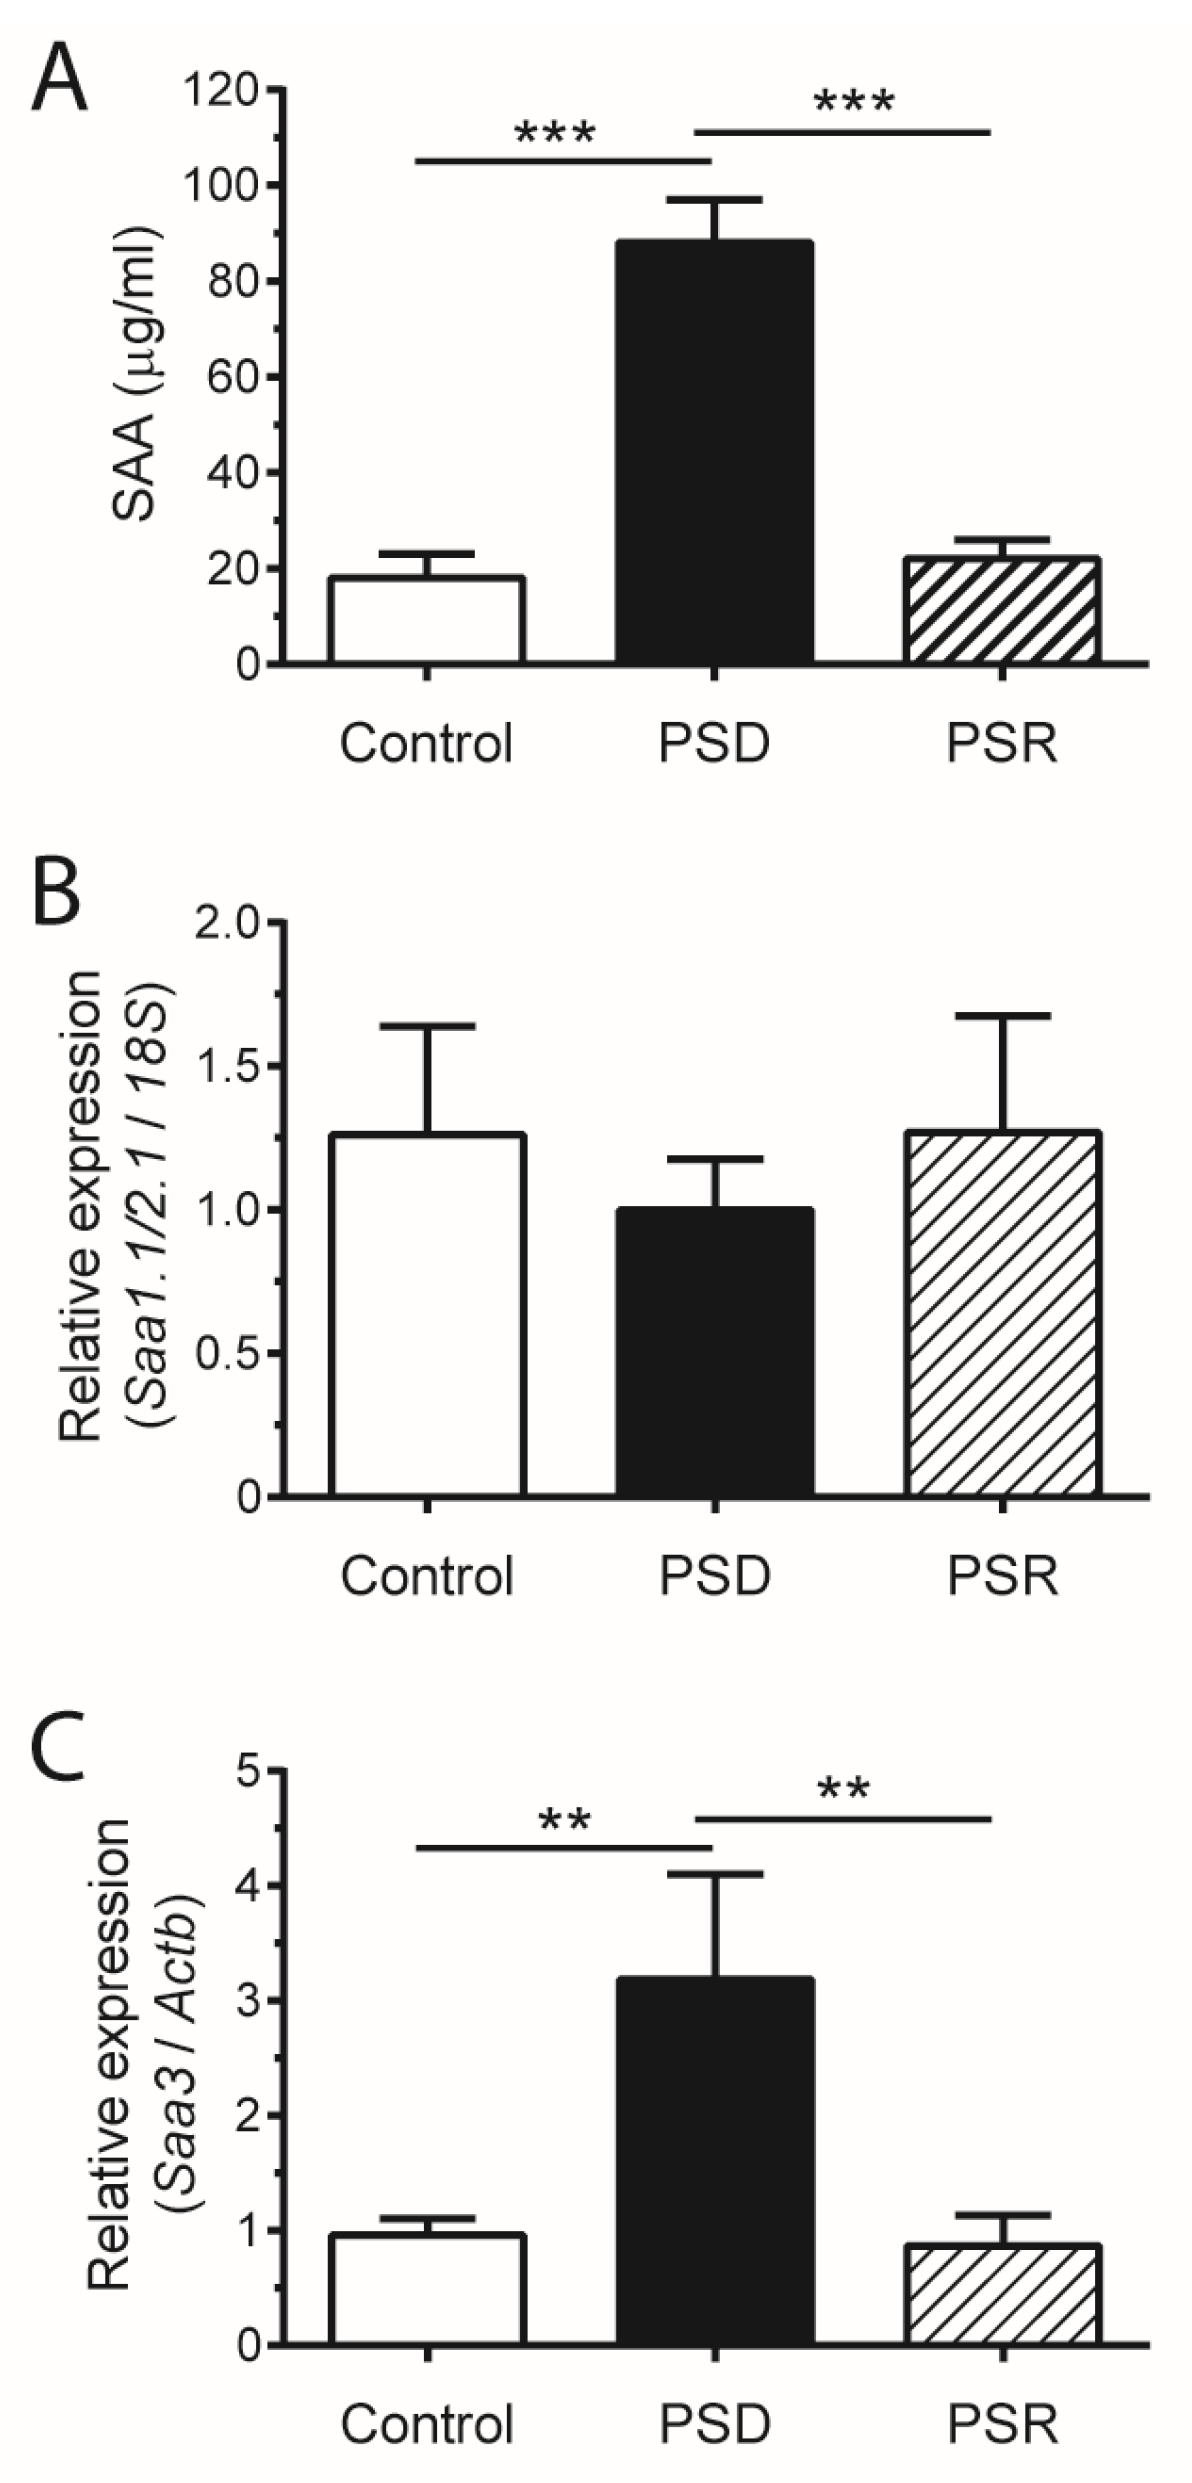
Paradoxical sleep deprivation (PSD) and paradoxical sleep rebound (PSR) were primarily used to assess the extent, severity and length of the SAA increment induced by sleep loss. Similarly to sleep restriction (SR), mice subjected to paradoxical sleep deprivation (PSD) also showed an increase in serum SAA levels (four times higher than control mice) (Figure 2A). Besides that, PSD mice showed no difference in Saa1.1/2.1 expression (Figure 2B) in the adipose tissue, with Saa3 mRNA being upregulated about three times (Figure 2C). Interestingly, PSD regulates SAA production in a stimulus-dependent manner, once it was observed that SAA serum levels and Saa3 mRNA expression in adipose tissue returned to baseline after the rebound period (Figure 2A,C).
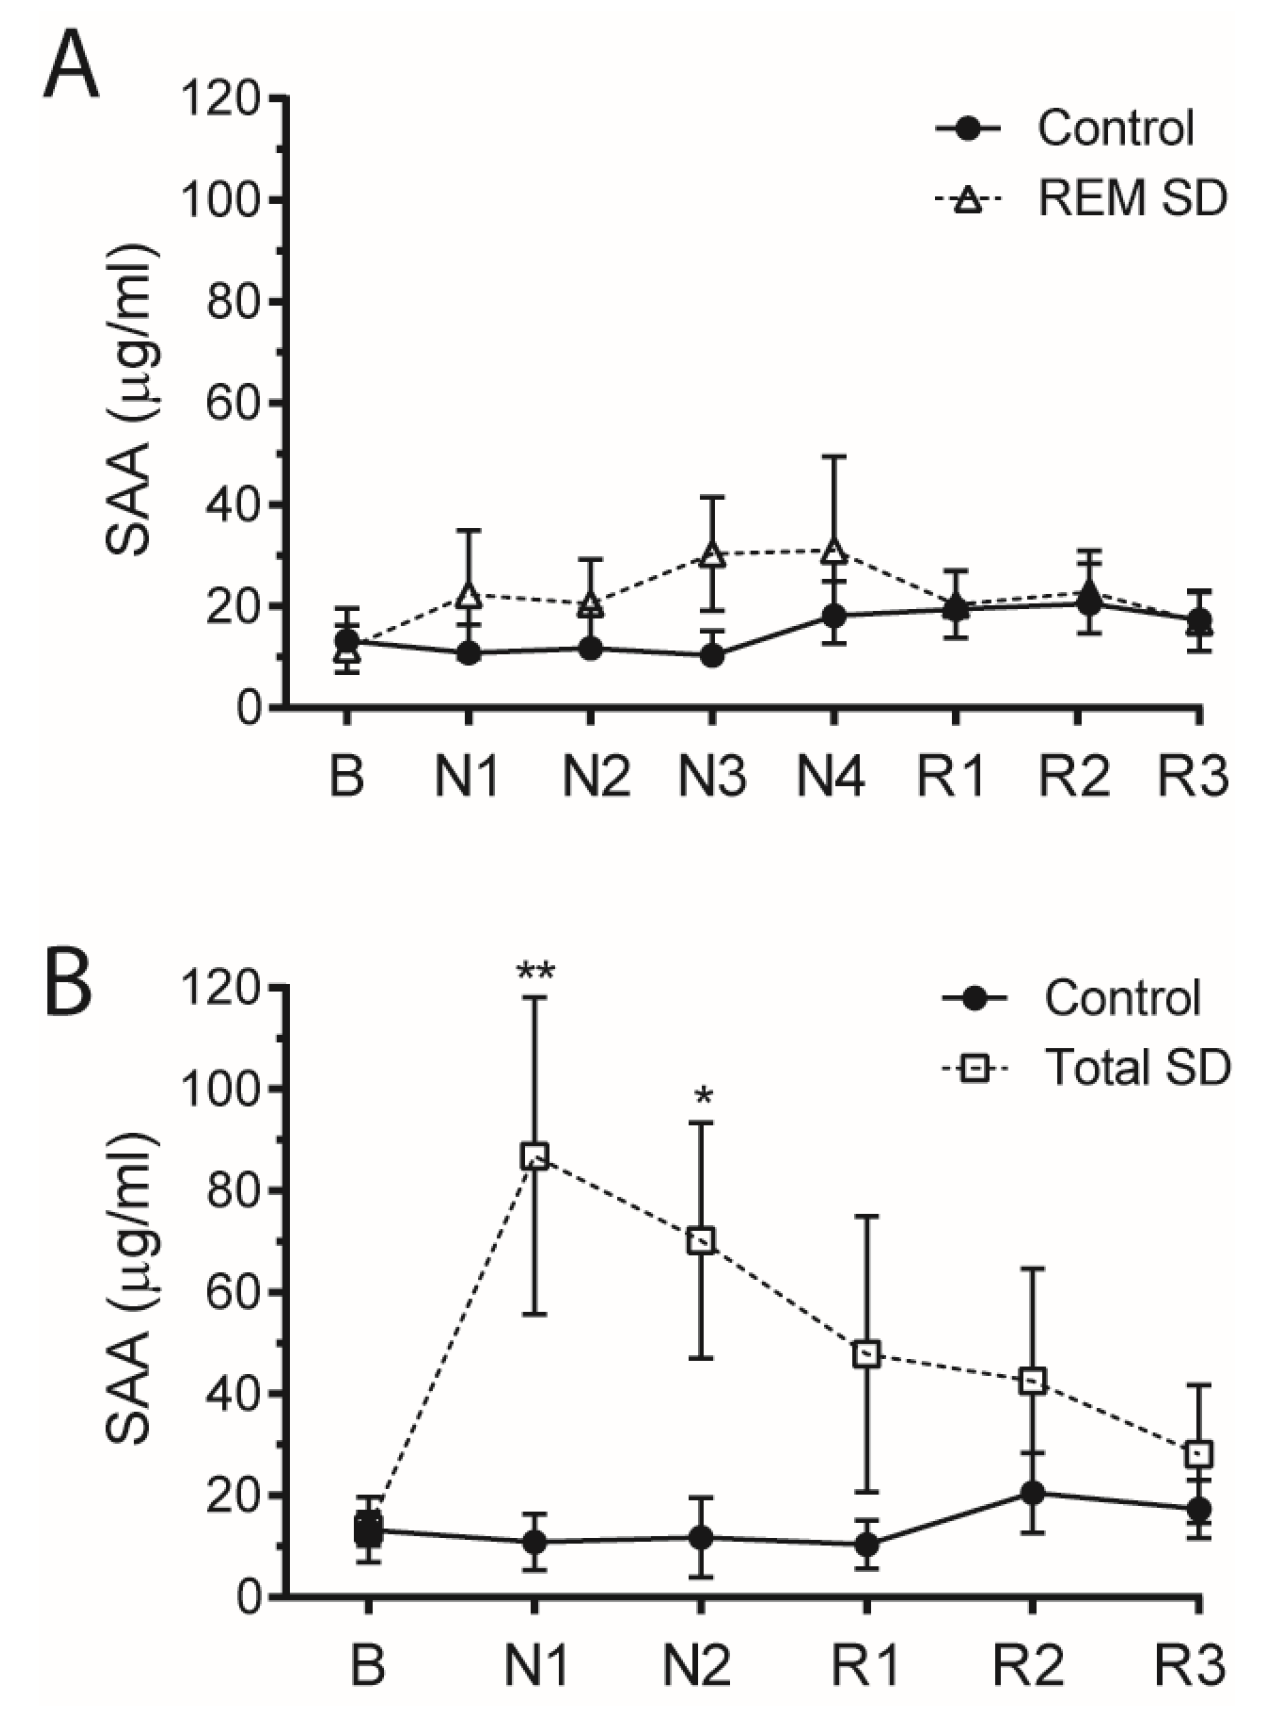
Finally, it was also possible to measure SAA from plasma derived from healthy human volunteers subjected to two nights of total sleep deprivation (Total SD) or four days in REM sleep deprivation (REM SD) (Figure 3). Although there was no difference regarding the SAA concentration when comparing the control and REM SD groups (Figure 3A), a remarkable four-fold increase in plasma SAA levels was observed after 24 or 48 h of total sleep deprivation (Total SD) (Figure 3B). Interestingly, the SAA levels also returned to basal levels after one night of recovery, showing that Total SD regulates SAA production in humans (Figure 3B).

4. Discussion

The purpose of this study was to determine whether sleep restriction is associated with SAA production. We found that sleep restriction led to an increase in the production of SAA in both mice and humans.
In obesity and diabetes, the increment in SAA serum levels reaches no more than a three-fold increase from baseline [5,22]. Considering that, the four-fold elevation in serum SAA observed in sleep restriction (21 h daily for 15 days) and also in paradoxical sleep deprivation (72 consecutive hours) seems a striking result. Moreover, sleep restriction also caused an increment in lipopolysaccharide (LPS) in serum, achieving levels similar to that observed in metabolic endotoxemia, defined as a mild increment of LPS in serum after a short time on a high-fat diet, associated with the onset of diabetes and obesity [23].
Although it was not possible to identify which specific SAA isoform was increased in the mice serum, it is expected to be the hepatic-induced isoforms Saa1.1/2.1, once Saa3 does not contribute to circulating SAA levels [5,21,24]. SAA3 is related to adipose tissue inflammation and its expression regulation may involve a direct induction by the hepatic isoforms Saa1.1/2.1 [6,25].
The interplay between SAA and LPS has been suggested to play a role in the adipose tissue, making it prone to hypertrophy and consequent weight gain [4]. Both SAA and LPS are able to cause morphologic changes in the adipose tissue, such as promoting preadipocyte proliferation and tissue inflammation [6,26,27]. Despite the direct induction of migration, adhesion and tissue infiltration of monocytes and polymorphonuclear leukocytes [28], SAA induces the release of other chemoattractive cytokines such as MCP-1 and CCL20 [26,29]. Although sleep restriction led momentarily to weight loss, the increase in Saa3 expression in adipose tissue may be an important factor to trigger obesity and insulin resistance. Our previous study in mice showed that sleep restriction predisposed them to weight gain and insulin resistance, aggravating the harmful effects of a high-fat diet [3].
Sleep restriction and sleep reestablishment seemed to be a prompt regulator for Saa3 expression in mice adipose tissue. In a stimulus-dependent manner, an increase in Saa3 expression was observed in PSD, with a rapid return to the baseline expression after 24 h in recovery.
The increment in SAA observed in humans submitted to two nights of total sleep deprivation was similar to that found in mice submitted to sleep restriction. This increment may be due to an increased SAA production or even due to a reduction in SAA clearance. Besides physiological differences between mice and humans, especially related to sleep habits, the increase in serum levels of SAA in response to sleep restriction seems to be similar between the species. However, if paradoxical sleep deprivation in mice was also able to modulate SAA production, no effect was observed when REM sleep deprivation was applied to humans. It is important to highlight that SAA was already described as being altered in obese patients with obstructive sleep apnea syndrome (OSAS) [30], possibly as a consequence of hypoxia/reoxygenation related to sleep apnea [31]. Our findings point out that even in lean and non-OSAS humans, SR is able to increase SAA levels and it may be related to the onset of subclinical inflammation, weight gain and insulin resistance. Moreover, the elevation in circulating non-esterified fatty acid (NEFA) is another event derived from SR [32] and it might be a direct effect of serum amyloid A, once it is able to induce lipolysis [6,26]. Both SAA and NEFA can lead to insulin resistance and play a central role in the development of metabolic diseases [4,32].
In addition to the role of SAA in obesity and insulin resistance, elevated serum levels of SAA is an independent and strong predictor of coronary artery disease and adverse cardiovascular outcome [33]. More recently, clearer evidence of the involvement of SAA in cardiovascular disease (CVD) showed that a brief elevation in SAA levels is sufficient to increase atherosclerosis [34]. Although no measurement of a direct cardiovascular disease risk factor was taken, it should be addressed in future studies.

5. Conclusions

In summary, our data show that sleep deprivation triggers SAA production in healthy and non-obese mice and humans. Interestingly, the transient increment in SAA levels occurred simultaneously to a metabolic endotoxemia. These results support the continued investigation of the role of SAA in metabolic diseases and also suggest that increased levels of SAA may be part of the signaling linking sleep loss to its associated comorbidities, such as obesity and type 2 diabetes.

Acknowledgments

The authors thank all the financial support and also thank Alexandre Froes Marchi and Thais Palumbo Ascar from the Departamento de Análises Clínicas e Toxicológicas, Faculdade de Ciências Farmacêuticas, Universidade de São Paulo, Brazil and Waldemarks Aires Leite from Departamento de Psicobiologia, Universidade Federal de São Paulo, Brazil, for their technical support. This study was supported by Fundação de Amparo à Pesquisa do Estado de São Paulo (FAPESP) (grant number 2011/24052-4 and 2010/18498-7 (doctoral scholarship)), Coordenação de Aperfeiçoamento de Pessoal de Nível Superior (CAPES), Conselho Nacional de Desenvolvimento Científico e Tecnológico (CNPq) (grant number 47510/2010-6) and Associação Fundo de Incentivo a Pesquisa (AFIP).

Author Contributions

E.M.O. contributed to the study conception and design, acquisition, analysis and interpretation of data, and writing of the article. B.V. contributed to the acquisition and interpretation of data. S.T., M.L.A. and J.R.C. contributed to the study conception and design, and also to the final critical revision of the manuscript. A.C. contributed to the study conception and design, analysis and interpretation of data, and writing and editing of the manuscript. All authors approved the final version of the manuscript to be published. A.C. is the guarantor of this work and, as such, has had full access to all data in the study and takes responsibility for both the integrity of the data and the accuracy of the data analysis.

Conflicts of Interest

The authors declare no conflict of interest.

References

  1. Knutson, K.L. Does inadequate sleep play a role in vulnerability to obesity? Am. J. Hum. Biol. 2012, 24, 361–371. [Google Scholar] [CrossRef] [PubMed]
  2. Taheri, S.; Lin, L.; Austin, D.; Young, T.; Mignot, E. Short sleep duration is associated with reduced leptin, elevated ghrelin, and increased body mass index. PLoS Med. 2004, 1, 210–217. [Google Scholar] [CrossRef] [PubMed]
  3. De Oliveira, E.M.; Visniauskas, B.; Sandri, S.; Migliorini, S.; Andersen, M.L.; Tufik, S.; Fock, R.A.; Chagas, J.R.; Campa, A. Late effects of sleep restriction: Potentiating weight gain and insulin resistance arising from a high-fat diet in mice. Obesity 2015, 23, 391–398. [Google Scholar] [CrossRef] [PubMed]
  4. De Oliveira, E.M.; Ascar, T.P.; Silva, J.C.; Sandri, S.; Migliorini, S.; Fock, R.A.; Campa, A. Serum amyloid A links endotoxaemia to weight gain and insulin resistance in mice. Diabetologia 2016, 59, 1760–1768. [Google Scholar] [CrossRef] [PubMed]
  5. Eklund, K.K.; Niemi, K.; Kovanen, P.T. Immune functions of Serum Amyloid A. Crit. Rev. Immunol. 2012, 32, 335–348. [Google Scholar] [CrossRef] [PubMed]
  6. Filippin-Monteiro, F.B.; de Oliveira, E.M.; Sandri, S.; Knebel, F.H.; Albuquerque, R.C.; Campa, A. Serum amyloid A is a growth factor for 3t3-l1 adipocytes, inhibits differentiation and promotes insulin resistance. Int. J. Obes. 2012, 36, 1032–1039. [Google Scholar] [CrossRef] [PubMed]
  7. Cai, X.P.; Freedman, S.B.; Witting, P.K. Serum amyloid A stimulates cultured endothelial cells to migrate and proliferate: Inhibition by the multikinase inhibitor BIBF1120. Clin. Exp. Pharm. Physiol. 2013, 40, 662–670. [Google Scholar] [CrossRef] [PubMed]
  8. Sandri, S.; Rodriguez, D.; Gomes, E.; Monteiro, H.P.; Russo, M.; Campa, A. Is serum amyloid A an endogenous TLR4 agonist? J. Leukoc. Biol. 2008, 83, 1174–1180. [Google Scholar] [CrossRef] [PubMed]
  9. Cheng, N.; He, R.; Tian, J.; Ye, P.P.; Ye, R.D. Cutting edge: TLR2 is a functional receptor for acute-phase serum amyloid a. J. Immunol. 2008, 181, 22–26. [Google Scholar] [CrossRef] [PubMed]
  10. Machado, R.B.; Suchecki, D.; Tufik, S. Comparison of the sleep pattern throughout a protocol of chronic sleep restriction induced by two methods of paradoxical sleep deprivation. Brain Res. Bull. 2006, 70, 213–220. [Google Scholar] [CrossRef] [PubMed]
  11. Kahan, V.; Ribeiro, D.A.; Egydio, F.; Barros, L.A.; Tomimori, J.; Tufik, S.; Andersen, M.L. Is lack of sleep capable of inducing dna damage in aged skin? Skin Pharm. Physiol. 2014, 27, 127–131. [Google Scholar] [CrossRef] [PubMed]
  12. Maia, L.O.; Dias, W.; Carvalho, L.S.; Jesus, L.R.; Paiva, G.D.; Araujo, P.; Costa, M.F.O.; Andersen, M.L.; Tufik, S.; Mazaro-Costa, R. Association of methamidophos and sleep loss on reproductive toxicity of male mice. Environ. Toxicol. Pharm. 2011, 32, 155–161. [Google Scholar] [CrossRef] [PubMed]
  13. Machado, R.B.; Hipolide, D.C.; Benedito-Silva, A.A.; Tufik, S. Sleep deprivation induced by the modified multiple platform technique: Quantification of sleep loss and recovery. Brain Res. 2004, 1004, 45–51. [Google Scholar] [CrossRef] [PubMed]
  14. Guariniello, L.D.; Vicari, P.; Lee, K.S.; De Oliveira, A.C.; Tufik, S. Bone marrow and peripheral white blood cells number is affected by sleep deprivation in a murine experimental model. J. Cell. Physiol. 2012, 227, 361–366. [Google Scholar] [CrossRef] [PubMed]
  15. Zager, A.; Andersen, M.L.; Ruiz, F.S.; Antunes, I.B.; Tufik, S. Effects of acute and chronic sleep loss on immune modulation of rats. Am. J. Physiol. Regul. Integr. Comp. Physiol. 2007, 293, R504–R509. [Google Scholar] [CrossRef] [PubMed]
  16. Ruiz, F.S.; Andersen, M.L.; Martins, R.C.S.; Zager, A.; Lopes, J.D.; Tufik, S. Immune alterations after selective rapid eye movement or total sleep deprivation in healthy male volunteers. Innate Immun. 2012, 18, 44–54. [Google Scholar] [CrossRef] [PubMed]
  17. Martins, R.C.S.; Andersen, M.L.; Garbuio, S.A.; Bittencourt, L.R.; Guindalini, C.; Shih, M.C.; Hoexter, M.Q.; Bressan, R.A.; Castiglioni, M.L.V.; Tufik, S. Dopamine transporter regulation during four nights of rem sleep deprivation followed by recovery—An in vivo molecular imaging study in humans. Sleep 2010, 33, 243–251. [Google Scholar] [PubMed]
  18. Livak, K.J.; Schmittgen, T.D. Analysis of relative gene expression data using real-time quantitative PCR and the 2(-Delta Delta C(T)) Method. Methods 2001, 25, 402–408. [Google Scholar] [CrossRef] [PubMed]
  19. De Beer, M.C.; Wroblewski, J.M.; Noffsinger, V.P.; Rateri, D.L.; Howatt, D.A.; Balakrishnan, A.; Ji, A.L.; Shridas, P.; Thompson, J.C.; van der Westhuyzen, D.R.; et al. Deficiency of endogenous acute phase serum amyloid a does not affect atherosclerotic lesions in apolipoprotein e-deficient mice. Arterioscler. Thromb. Vasc. Biol. 2014, 34, 255–261. [Google Scholar] [CrossRef] [PubMed]
  20. Sommer, G.; Weise, S.; Kralisch, S.; Scherer, P.E.; Lossner, U.; Bluher, M.; Stumvoll, M.; Fasshauer, M. The adipokine SAA3 is induced by interleukin-1 beta in mouse adipocytes. J. Cell. Biochem. 2008, 104, 2241–2247. [Google Scholar] [CrossRef] [PubMed]
  21. Uhlar, C.M.; Whitehead, A.S. Serum amyloid A, the major vertebrate acute-phase reactant. Eur. J. Biochem. 1999, 265, 501–523. [Google Scholar] [CrossRef] [PubMed]
  22. Hatanaka, E.; Monteagudo, P.T.; Marrocos, M.S.M.; Campa, A. Interaction between serum amyloid A and leukocytes—A possible role in the progression of vascular complications in diabetes. Immunol. Lett. 2007, 108, 160–166. [Google Scholar] [CrossRef] [PubMed]
  23. Cani, P.D.; Amar, J.; Iglesias, M.A.; Poggi, M.; Knauf, C.; Bastelica, D.; Neyrinck, A.M.; Fava, F.; Tuohy, K.M.; Chabo, C.; et al. Metabolic endotoxemia initiates obesity and insulin resistance. Diabetes 2007, 56, 1761–1772. [Google Scholar] [CrossRef] [PubMed]
  24. Chiba, T.; Han, C.Y.; Vaisar, T.; Shimokado, K.; Kargi, A.; Chen, M.H.; Wang, S.; McDonald, T.O.; O’Brien, K.D.; Heinecke, J.W.; et al. Serum amyloid A3 does not contribute to circulating SAA levels. J. Lipid Res. 2009, 50, 1353–1362. [Google Scholar] [CrossRef] [PubMed]
  25. Den Hartigh, L.J.; Wang, S.R.; Goodspeed, L.; Ding, Y.L.; Averill, M.; Subramanian, S.; Wietecha, T.; O’Brien, K.D.; Chait, A. Deletion of serum amyloid A3 improves high fat high sucrose diet-induced adipose tissue inflammation and hyperlipidemia in female mice. PLoS ONE 2014, 9. [Google Scholar] [CrossRef] [PubMed]
  26. Faty, A.; Ferre, P.; Commans, S. The acute phase protein serum amyloid A induces lipolysis and inflammation in human adipocytes through distinct pathways. PLoS ONE 2012, 7, e34031. [Google Scholar] [CrossRef] [PubMed]
  27. Luche, E.; Cousin, B.; Garidou, L.; Serino, M.; Waget, A.; Barreau, C.; André, M.; Valet, P.; Courtney, M.; Casteilla, L.; et al. Metabolic endotoxemia directly increases the proliferation of adipocyte precursors at the onset of metabolic diseases through a cd14-dependent mechanism. Mol. Metab. 2013, 2, 281–291. [Google Scholar] [CrossRef] [PubMed]
  28. Badolato, R.; Wang, J.M.; Murphy, W.J.; Lloyd, A.R.; Michiel, D.F.; Bausserman, L.L.; Kelvin, D.J.; Oppenheim, J.J. Serum amyloid-A is a chemoattractant—Induction of migration, adhesion, and tissue infiltration of monocytes and polymorphonuclear leukocytes. J. Exp. Med. 1994, 180, 203–209. [Google Scholar] [CrossRef] [PubMed]
  29. Sandri, S.; Hatanaka, E.; Franco, A.G.; Pedrosa, A.M.C.; Monteiro, H.P.; Campa, A. Serum amyloid A induces ccl20 secretion in mononuclear cells through mapk (p38 and ERK1/2) signaling pathways. Immunol. Lett. 2008, 121, 22–26. [Google Scholar] [CrossRef] [PubMed]
  30. Svatikova, A.; Wolk, R.; Shamsuzzaman, A.S.; Kara, T.; Olson, E.J.; Somers, V.K. Serum amyloid A in obstructive sleep apnea. Circulation 2003, 108, 1451–1454. [Google Scholar] [CrossRef] [PubMed]
  31. De Oliveira, E.M.; Sandri, S.; Knebel, F.H.; Iglesias Contesini, C.G.; Campa, A.; Filippin-Monteiro, F.B. Hypoxia increases serum amyloid A3 (SAA3) in differentiated 3t3-l1 adipocytes. Inflammation 2013, 36, 1107–1110. [Google Scholar] [CrossRef] [PubMed]
  32. Broussard, J.L.; Chapotot, F.; Abraham, V.; Day, A.; Delebecque, F.; Whitmore, H.R.; Tasali, E. Sleep restriction increases free fatty acids in healthy men. Diabetologia 2015, 58, 791–798. [Google Scholar] [CrossRef] [PubMed]
  33. Johnson, B.D.; Kip, K.E.; Marroquin, O.C.; Ridker, P.M.; Kelsey, S.F.; Shaw, L.J.; Pepine, C.J.; Sharaf, B.; Merz, C.N.B.; Sopko, G.; et al. Serum amyloid A as a predictor of coronary artery disease and cardiovascular outcome in women—The national heart, lung, and blood institute-sponsored women’s ischemia syndrome evaluation (wise). Circulation 2004, 109, 726–732. [Google Scholar] [CrossRef] [PubMed]
  34. Thompson, J.C.; Jayne, C.; Thompson, J.; Wilson, P.G.; Yoder, M.H.; Webb, N.; Tannock, L.R. A brief elevation of serum amyloid a is sufficient to increase atherosclerosis. J. Lipid Res. 2015, 56, 286–293. [Google Scholar] [CrossRef] [PubMed]
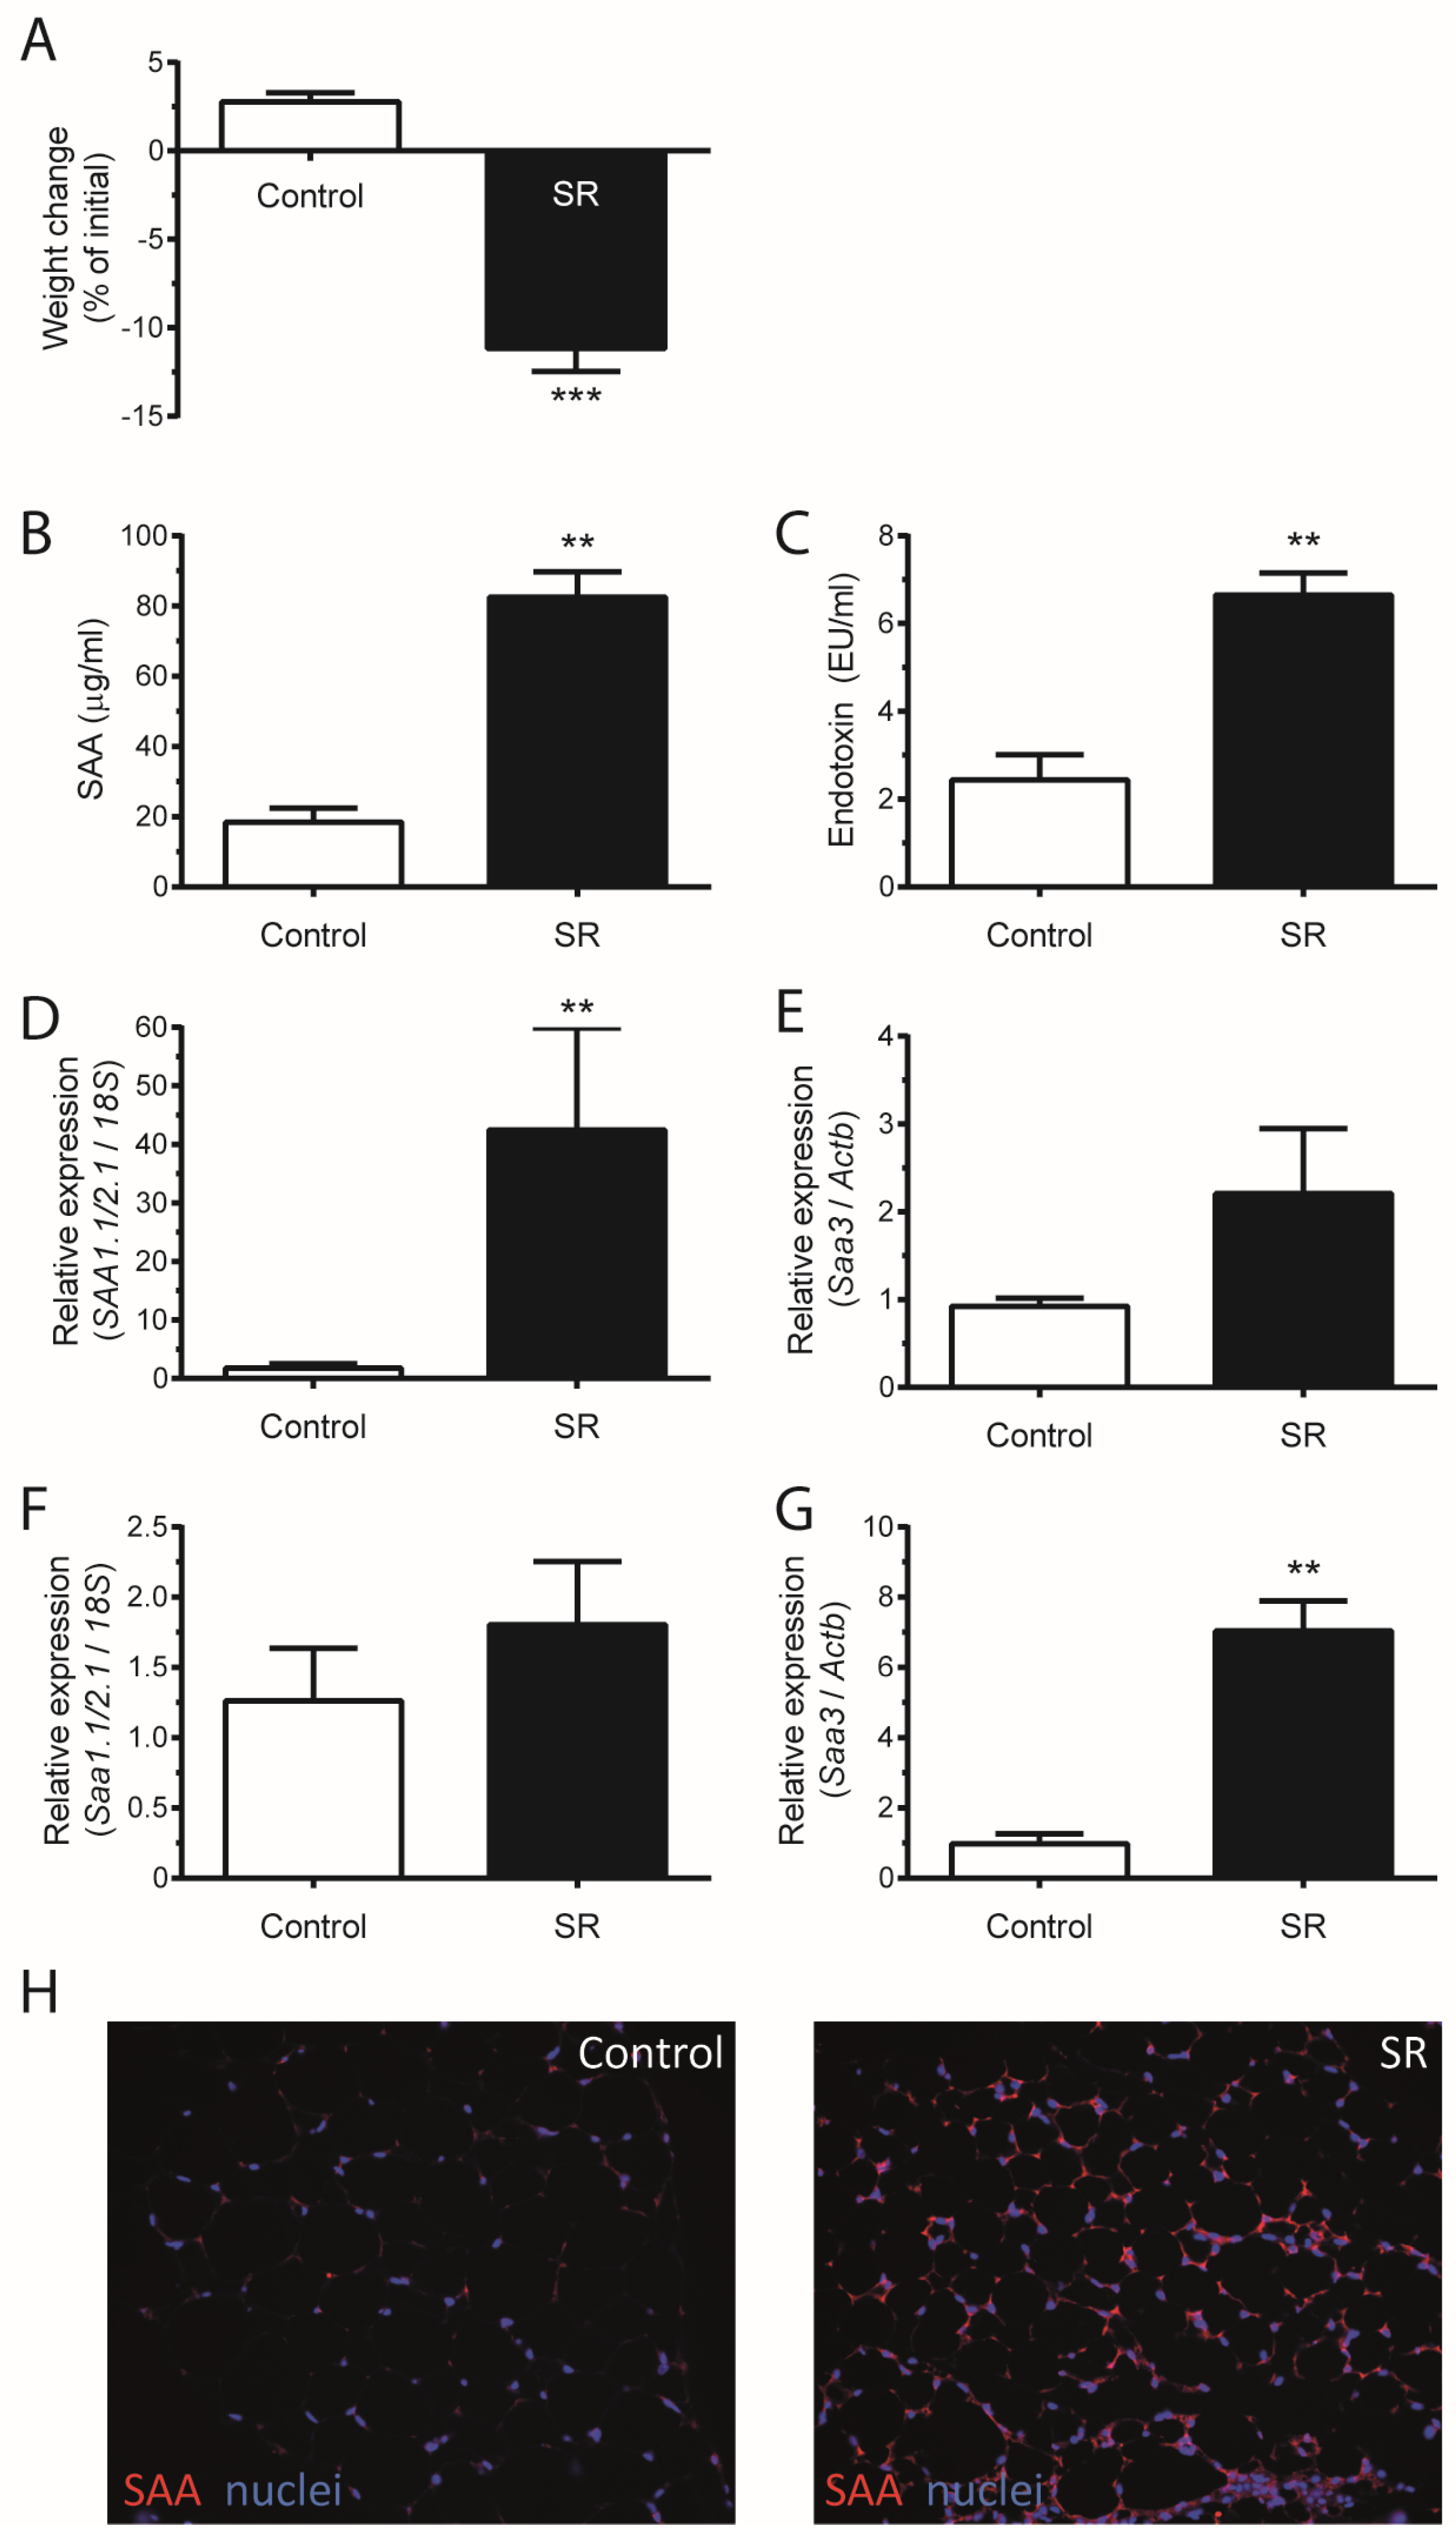
Figure 1. Sleep restriction (SR) causes weight loss and increased SAA production. Mice C57BL/6 were submitted to SR for 21 h daily for 15 days. (A) Mice weight change after SR; (B) SAA and (C) endotoxin concentration in mice serum; Real-time PCR was performed to assess mRNA expression of (D) Saa1.1/2.1 and (E) Saa3 in liver and (F) Saa1.1/2.1 and (G) Saa3 in adipose tissue; (H) Control and SR mice adipose tissue stained for SAA. Data are means ± SEM from six to 12 mice per group, with statistical analyses performed by one-way ANOVA followed by Newman-Keuls post hoc test (** p < 0.01, *** p < 0.001, vs. control).
Nutrients 09 00311 g001
Figure 2. Paradoxical sleep deprivation (PSD) increases SAA levels in a stimulus-dependent manner. C57BL/6 mice were submitted to PSD for 72 uninterrupted hours, followed by a 24 h paradoxical sleep rebound (PSR) period. (A) SAA concentration in serum. Real-time PCR was performed to assess mRNA expression of (B) Saa1.1/2.1 and (C) Saa3 in adipose tissue. Data are means ± SEM from six mice per group, with statistical analyses performed by one-way ANOVA followed by Newman-Keuls post hoc test (** p < 0.01, *** p < 0.001, vs. control).
Nutrients 09 00311 g002
Figure 3. Total sleep deprivation increases plasma SAA in human. Thirty healthy male volunteers aged between 19 to 29 years were randomly assigned to one of three experimental groups after providing a written informed consent (10 in a non-sleep-deprived group (Control), 10 in a total sleep-deprived group (Total SD), and 10 in an REM-sleep-deprived group (REM SD)). Exclusion criteria included the following: sleep disorders, obesity and obstructive sleep apnea (OSA). Plasma SAA concentration in (A) REM SD and (B) Total SD. Data are means ± SEM (* p < 0.05, ** p < 0.01).
Nutrients 09 00311 g003