Abstract
Cosmopolitan Gram-negative cyanobacteria may affect human and animal health by contaminating terrestrial, marine and freshwater environments with toxins, such as lipopolysaccharide (LPS). The cyanobacterial genus Scytonema (S) produces several toxins, but to our knowledge the bioactivity of genus Scytonema LPS has not been investigated. We recently reported that cyanobacterium Oscillatoria sp. LPS elicited classical and alternative activation of rat microglia in vitro. Thus, we hypothesized that treatment of brain microglia in vitro with either cyanobacteria S. javanicum or S. ocellatum LPS might stimulate classical and alternative activation with concomitant release of superoxide anion (O2−), matrix metalloproteinase-9 (MMP-9), cytokines and chemokines. Microglia were isolated from neonatal rats and treated in vitro with either S. javanicum LPS, S. ocellatum LPS, or E. coli LPS (positive control), in a concentration-dependent manner, for 18 h at 35.9 °C. We observed that treatment of microglia with either E. coli LPS, S. javanicum or S. ocellatum LPS generated statistically significant and concentration-dependent O2−, MMP-9 and pro-inflammatory cytokines IL-6 and TNF-α, pro-inflammatory chemokines MIP-2/CXCL-2, CINC-1/CXCL-1 and MIP-1α/CCL3, and the anti-inflammatory cytokine IL-10. Thus, our results provide experimental support for our working hypothesis because both S. javanicum and S. ocellatum LPS elicited classical and alternative activation of microglia and concomitant release of O2−, MMP-9, cytokines and chemokines in a concentration-dependent manner in vitro. To our knowledge this is the first report on the toxicity of cyanobacteria S. javanicum and S. ocellatum LPS to microglia, an immune cell type involved in neuroinflammation and neurotoxicity in the central nervous system.
Keywords:
microglia; cyanobacterium; Scytonema; lipopolysaccharide; cytokine; chemokine; superoxide; MMP-9; rat Key Contribution:
Our investigation, is the first to report on the immunotoxicity of cyanobacteria S. javanicum and S. ocellatum LPS to brain microglia, thus extending the toxicology of the cyanobacterial genus Scytonema to the central nervous system (CNS).
1. Introduction
Cyanobacteria are photoautotrophic Gram-negative bacteria that are found in a wide range of terrestrial, marine and freshwater environments [1]. Overgrowth of cyanobacteria can result in blooms which may include cyclic hepatotoxic peptides, neurotoxic alkaloids and LPS [2], which can affect human health [3,4] through various routes, including drinking, skin and respiratory exposure, or via the circulatory system [5,6].
The cyanobacterial genus Scytonema has been reported to produce several types of toxins: tolytoxin, a member of the polyketide-derived macrolides scytophycins, that displayed cytotoxic and antifungal activity [7,8,9]; scytovirin, a novel anti-HIV protein [10]; an antimicrobial sesterpene, scytoscalarol [11], the cyclic peptides scytonemides A and B, with 20S proteasome inhibitory activity [12], and more recently, the alkaloid saxitoxins, fast-acting neurotoxins that block sodium channels [13,14]. To our knowledge, the bioactivity of cyanobacteria S. javanicum and S. ocellatum LPS has not been investigated.
One body system that may be affected by cyanobacterial LPS is the central nervous system (CNS), which has long been considered an immunologically privileged site [15], although the peripheral immune system may communicate with microglia, the macrophages of the brain immune system, via neural and humoral routes [16]. Microglia are dedicated macrophages of the CNS which originate in the yolk-sac, then migrate from the blood system to the brain during early development, and play an important role in brain homeostasis [17].
Two microglia activation states, termed classical and alternative, appear to enable microglia to react to stimuli and restore tissue homeostasis [18]. Classically activated or M1 microglia, that may be induced by LPS [19], are characterized by production of pro-inflammatory chemokines and cytokines, such as tumor necrosis factor (TNF-α), interleukin-6 (IL-6), interleukin-1β (IL-1β), and interferon-γ [20], and are involved in neuroinflammation [21]. Alternatively activated, or M2 microglia, down-regulate the inflammatory response and generate anti-inflammatory cytokines such as IL-4, IL-10, IL-13, and transforming growth factor-β [21].
The structure of LPS, an outer membrane component of Gram-negative bacteria [22], consists of an O-antigen, a core, and lipid A [23]. Lipid A is composed of units of D-glucosamine dimers and fatty acid chains, anchors LPS to the membrane, and is responsible for the toxicity of LPS [23]. Lipid A differences between Gram-negative proteobacteria and cyanobacteria [24,25] appear to affect its functionality [26,27], and have been proposed to result in diminished toxicity [25,28].
The purpose of this study was to test the hypothesis that in vitro treatment of primary neonatal rat microglia with S. javanicum or S. ocellatum LPS might trigger classical (or M1-type) and/or alternative (or M2-type) microglia activation and the concomitant release of the pro-inflammatory mediators O2−, thromboxane B2 (TXB2) and MMP-9, as well as cytokines TNF-α and IL-6, chemokines MIP-1α/CCL3, MIP-2/CXCL-2 and CINC-1/CXCL-1, and the anti-inflammatory cytokine IL-10. Our results support our working hypothesis because both S. javanicum and S. ocellatum LPS activated both classical (or M1-type) and alternative (or M2-type) phenotypes of rat microglia in vitro, in a concentration-dependent manner. Thus, our investigation, the first to report on the immunotoxicity of cyanobacteria S. javanicum and S. ocellatum LPS to brain microglia, extends current knowledge of the toxicology of the cyanobacterial genus S. cytonema.
2. Results
2.1. Effect of S. javanicum and S. ocellatum LPS on Neonatal Rat Brain Microglia O2− Generation
Reactive oxygen species generated by microglia can cause neuronal injury via oxidative stress and have been implicated in neurodegenerative diseases [19,21,29]. Previous work from our laboratory has reported that rat microglia treated in vitro with either E. coli LPS [19], cyanobacteria Microcystis aeruginosa or Oscillatoria sp. LPS release O2− in vitro [3,4]. As shown in Figure 1, PMA-stimulated O2− release was observed when neonatal rat microglia were treated with either E. coli, S. javanicum or S. ocellatum LPS for 18 h. Maximal O2− release was observed at 1 × 10 4 ng/mL S. javanicum LPS and 1 × 10⁵ ng/mL S. ocellatum LPS. In contrast, E. coli LPS, the positive control, showed maximal O2− release at 1 ng/mL as previously reported [3]. Thus, S. javanicum and S. ocellatum LPS appeared to be 10,000- and 100,000-fold, respectively, less potent than E. coli LPS in stimulating statistically significant O2− production from neonatal rat microglia in vitro.
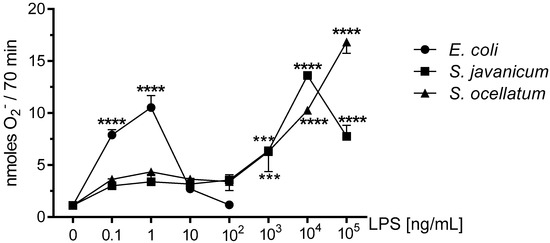
Figure 1.
The effect of E. coli, S. javanicum and S. ocellatum LPS on neonatal rat microglia O2− release. Neonatal rat microglia (1.8–2.0 × 10⁵ cells/well) were treated with E. coli LPS (0.1–100 ng/mL), S. javanicum or S. ocellatum LPS (0.1–105 ng/mL) for 18-h in vitro and then stimulated with PMA (1 μM) for 70 min. O2− was determined as described in the Materials and Methods section. Data expressed as nanomoles O2− is the mean ± SEM from three independent experiments (n), each experiment with triplicate determinations. *** p < 0.001, **** p < 0.0001 LPS versus untreated control (0).
2.2. Effect of S. javanicum and S. ocellatum LPS on Neonatal Rat Brain Microglia LDH Generation
To determine whether the decrease in O2− production shown in Figure 1 resulted from concentration-dependent toxicity from E. coli or Scytonema LPS to microglia during the 18 h incubation, LDH release was determined in culture supernatants [19]. LDH release has been used extensively as a marker for cellular toxicity, as is described in the Materials and Methods [3,4].
As shown in Figure 2, LDH release was low for all concentrations of both S. javanicum and S. ocellatum LPS we investigated. In S. javanicum and S. ocellatum-LPS treated microglia, a non-statistically significant release of LDH was observed at 100,000 ng/mL LPS, reaching 12.1 ± 12.1% and 14.9 ± 10.5% of control, respectively. In contrast, in E. coli LPS-stimulated microglia, a statistically significant LDH release of 35.3 ± 17.7% of control was observed at 100 ng/mL, as previously reported [3]. Thus, the LDH data suggest that both S. javanicum and S. ocellatum LPS elicited classical and alternative activation of microglia and concomitant release of O2−, MMP-9 and cytokines and chemokines in a concentration-dependent manner while not affecting the microglia cell membrane in vitro at the concentrations tested in these experiments.
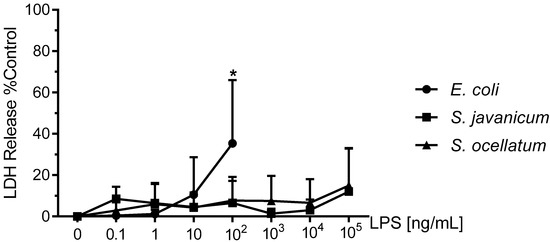
Figure 2.
The effect of E. coli, S. javanicum and S. ocellatum LPS on neonatal rat microglia LDH release. Neonatal rat microglia (1.8–2.0 × 10⁵ cells/well) were treated with E. coli LPS (0.1–100 ng/mL), S. javanicum or S. ocellatum LPS (0.1–105 ng/mL) for 18-h in vitro. LDH release was determined as described in the Materials and Methods section. Data expressed as % of 0.1% Triton X-100-treated microglia LDH release, is the mean ± SEM from three independent experiments (n), each experiment with triplicate determinations. * p < 0.05 LPS versus untreated control (0).
2.3. Effect of S. javanicum and S. ocellatum LPS on Neonatal Rat Brain Microglia Proinflammatory TXB2 Generation
Eicosanoids, such as TXB2, have been implicated in neurodegenerative disease by contributing to neuroinflammation [30]. We have reported that cyanobacteria Microcystis aeruginosa and Oscillatoria sp. LPS stimulated rat microglia to release TXB2 in vitro [3,4,19]. As shown in Supplementary Table S1, both S. javanicum, and S. ocellatum LPS-treated microglia showed a non-statistically significant TXB2 release as compared to untreated microglia.
2.4. Effect of S. javanicum and S. ocellatum LPS on Neonatal Rat Brain Microglia Pro-Inflammatory MMP-9 Generation
MMP-9 and other matrix metalloproteinases produced during neuroinflammation may affect the blood brain barrier causing disruption and resulting neuropathology [31]. Our laboratory has previously reported that rat microglia release MMP-9 upon stimulation with cyanobacteria Microcystis aeruginosa and/or Oscillatoria sp. LPS [4,19]. MMP-9 release in supernatants was measured via ELISA. As shown in Figure 3, E. coli LPS-treated microglia released statistically significant levels of MMP-9 from 1–100 ng/mL LPS. S. javanicum LPS-treated microglia also released statistically significant levels of MMP-9 but at 10,000–100,000 ng/mL LPS. In contrast, S. ocellatum LPS did not induce statistically significant release of MMP-9 from treated microglia. Thus, S. javanicum LPS appeared to be 10,000-fold, less potent than E. coli LPS in stimulating statistically significant MMP-9 production from neonatal rat microglia in vitro.
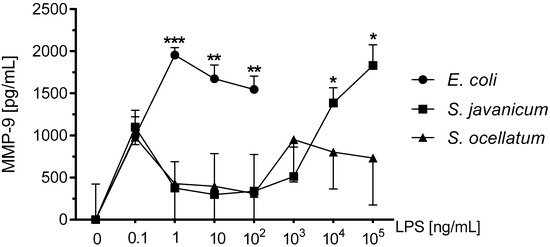
Figure 3.
The effect of E. coli, S. javanicum and S. ocellatum LPS on neonatal rat microglia MMP-9 release. Neonatal rat microglia (1.8–2.0 × 10⁵ cells/well) were treated with E. coli LPS (0.1–100 ng/mL), S. javanicum or S. ocellatum LPS (0.1–105 ng/mL) for 18-h in vitro. MMP-9 release was determined as described in the Materials and Methods section. Basal release (0 ng/mL LPS) of 3070.5 pg/mL MMP-9 was substracted from all data. Data expressed as pg/mL is the mean ± SEM from three independent experiments (n), each experiment with triplicate determinations. * p < 0.05, ** p < 0.01, *** p < 0.001 LPS versus untreated control (0).
2.5. Effect of S. javanicum and S. ocellatum LPS on Neonatal Rat Brain Microglia Proinflammatory Cytokine Release: TNF-α and IL-6
TNF-α is a pro-inflammatory cytokine that appears to play a role in neurodegenerative diseases [21]. Release of TNF-α from LPS-stimulated microglia has been demonstrated in primary rat microglia [32,33]. As shown in Figure 4, panel A, microglia stimulated with E. coli LPS for 18 h in vitro showed a statistically significant peak TNF-α release at 10 ng/mL LPS (699.4 ± 262.1 pg/mL). Similarly, S. javanicum LPS-stimulated microglia released statistically significant TNF-α at 1 × 10⁵ ng/mL (549.2 ± 144.9 pg/mL; p < 0.0001), while in contrast S. ocellatum LPS-stimulated TNF-α release was non-statistically significant (240.8 ± 13.3 pg/mL).
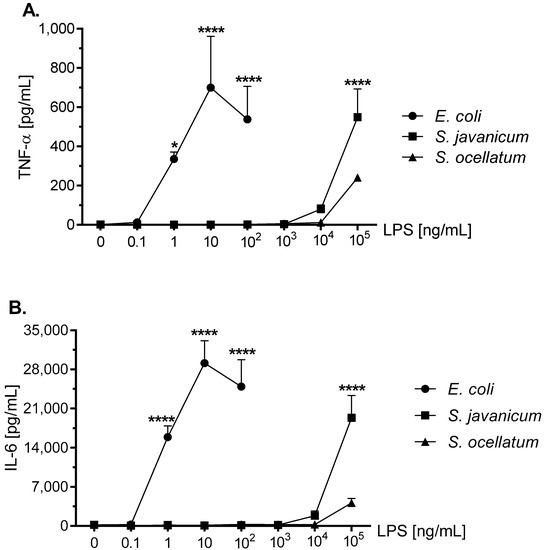
Figure 4.
The effect of E. coli, S. javanicum and S. ocellatum LPS on neonatal rat microglia TNF-α (panel A) and IL-6 (panel B) release. Neonatal rat microglia (1.8–2.0 × 10⁵ cells/well) were treated with E. coli LPS (0.1–100 ng/mL), S. javanicum or S. ocellatum LPS (0.1–105 ng/mL) for 18-h in vitro. TNF-α and IL-6 release were determined as described in the Materials and Methods section. Data expressed as pg/mL are the mean ± SEM from three independent experiments (n), each experiment with triplicate determinations. * p < 0.05, **** p < 0.0001 LPS versus untreated control (0).
IL-6 is a pro-inflammatory cytokine involved in cellular survival, stress responses, and may also contribute to neuroinflammation [34]. LPS-stimulated rat microglia may release IL-6 [32,33,35]. As shown in Figure 4, panel B, the concentration-dependent release of IL-6 was similar to TNF-α (Figure 4, panel A) in LPS-treated rat microglia, although differed in the total magnitude (pg/mL) generated. Thus E. coli LPS-stimulated microglia released peak IL-6 at 10 ng/mL LPS (29,117.7 ± 3998.3 pg/mL IL-6; p < 0.0001) while in contrast, S. javanicum LPS-treated microglia IL-6 generation peaked at 1×10⁵ ng/mL LPS (19,340 ± 3973.0 pg/mL IL-6; p < 0.0001). Furthermore, and similar to TNF-α release, S. ocellatum LPS-triggered IL-6 generation at 1 × 10⁵ ng/mL LPS, was non-statistically significant (4118.9 ± 797.2 pg/mL). Thus, like O2− and MMP-9 release, cyanobacteria S. javanicum and S. ocellatum LPS appeared to be approximately 10,000 fold less potent than E. coli LPS in stimulating rat microglia to release classical activation cytokines TNF-α and IL-6 in vitro.
2.6. Effect of S. javanicum and S. ocellatum LPS on Neonatal Rat Brain Microglia Proinflammatory Chemokine Release: MIP-1α/CCL3, CINC-1/CXCL-1, and MIP-2/CXCL-2
MIP-1α/CCL3, a neuroinflammation biomarker, has been shown to recruit granulocytes to damaged brain regions [36]. MIP-1α/CCL3 has been reported to be generated by LPS-stimulated mouse [37], human [38], and rat microglia [39]. As shown in Figure 5, panel A, after an 18 h in vitro incubation with either E. coli, S. javanicum or S. ocellatum LPS, rat microglia generated MIP-1α/CCL3. Thus at 1 and 10 ng/mL E. coli LPS-treated rat microglia released 10,235 ± 6.5 pg/mL MIP-1α/CCL3, p < 0.0001. In contrast, 100,000 ng/mL S. javanicum and S. ocellatum LPS-treated microglia generated 9806.8 ± 422.3 and 8357.2 ± 1871.8 pg/mL MIP-1α/CCL3, p < 0.0001, respectively.
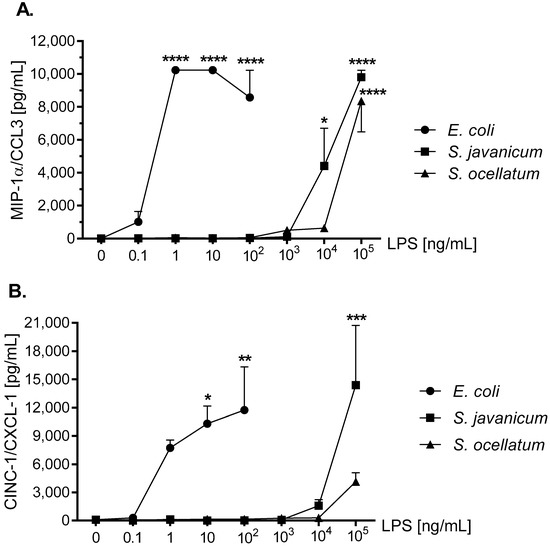
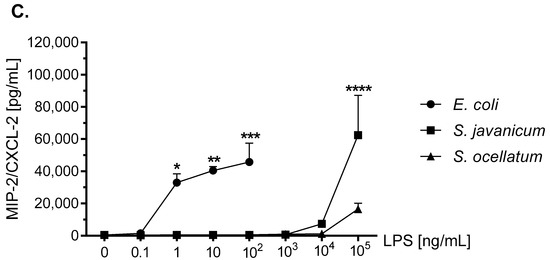
Figure 5.
The effect of E. coli, S. javanicum and S. ocellatum LPS on neonatal rat microglia MIP-1α/CCL3 (panel A), CINC-1/CXCL-1 (panel B), and MIP-2/CXCL-2 (panel C) release. Neonatal rat microglia (1.8–2.0 × 10⁵ cells/well) were treated with E. coli LPS (0.1–100 ng/mL), S. javanicum or S. ocellatum LPS (0.1–105 ng/mL) for 18-h in vitro. MIP-1α/CCL3, CINC-1/CXCL-1, and MIP-2/CXCL-2 release was determined as described in the Materials and Methods section. Data expressed as pg/mL is the mean ± SEM from two or three independent experiments (n), each experiment with triplicate determinations. * p < 0.05, ** p < 0.01, *** p < 0.001, **** p < 0.0001 LPS versus untreated control (0).
CINC-1/CXCL-1 is involved in the chemotaxis and activation of neutrophils [40]. CINC-1/CXCL-1 release from LPS-stimulated microglia has been observed in rat [41,42] and mouse [37,43]. As shown in Figure 5, panel B, 100 ng/mL E. coli LPS-treated rat microglia showed maximal CINC-1/CXCL-1 release of 11,742.1 ± 4593.4 pg/mL, p < 0.01. Furthermore, 1 × 10⁵ ng/mL S. javanicum LPS though less potent, turned out to be more efficacious with a maximal release of 14,387.9 ± 6343 pg/mL CINC-1/CXCL-1, p < 0.001. Surprisingly, 1 × 10⁵ ng/mL S. ocellatum LPS-treated microglia showed a non-statistically significant CINC-1/CXCL-1 release of 4132.6 ± 947.8 pg/mL.
MIP-2/CXCL-2 is another neutrophil chemoattractant and activator [44]. LPS-stimulated mouse [45,46] and rat microglia release MIP-2/CXCL-2 [35,42]. As seen in Figure 5, panel C, 100 ng/mL E. coli LPS induced peak release of 45,710.2 ± 11,774.2 pg/mL MIP-2/CXCL-2, p < 0.001, while 1 × 10⁵ ng/mL S. javanicum LPS-treated microglia showed statistically significant release of 62,423.9 ± 24,688.2 pg/mL MIP-2/CXCL-2, p < 0.0001. In contrast, and similar to what was observed with CINC-1/CXCL-1 generation, at 1 × 10⁵ ng/mL S. ocellatum LPS-treated microglia generated non-statistically significant MIP-2/CXCL-2 (16,550.6 ± 3550.9 pg/mL).
Thus, similar to cytokines TNF-α and IL-6, cyanobacteria S. javanicum and S. ocellatum LPS appeared to be approximately 10,000 fold less potent than E. coli LPS in stimulating rat microglia to release both the pro-inflammatory CXCL chemokine MIP-2/CXCL2, and the pro-inflamatory CCL chemokines CINC-1/CXCL-1 and MIP-2/CXCL-2 in vitro.
2.7. Effect of S. javanicum and S. ocellatum LPS on Neonatal Rat Brain Microglia Anti-Inflammatory Cytokine Release: IL-10
The anti-inflammatory cytokine IL-10 has immunosuppressive functions [47] and has been reported to be released by LPS-treated mouse [47], rat [48], and human microglia [49]. As shown in Figure 6, treatment of microglia with E. coli LPS resulted in a maximal release of 198.7 ± 14.4 pg/mL IL-10 at 1 ng/mL LPS (p < 0.001). Furthermore, both S. javanicum and S. ocellatum-LPS treated microglia showed statistically significant release of IL-10 at 1 × 10⁵ ng/mL: 183.2 ± 22.2 (p < 0.0001) and 103.6 ± 7.3 (p < 0.001) pg/mL, respectively.
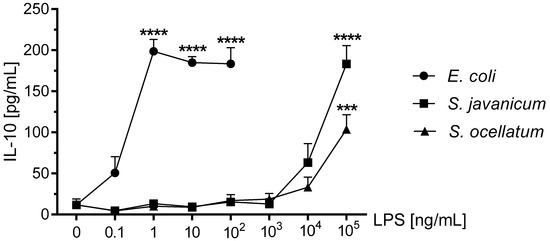
Figure 6.
The effect of E. coli, S. javanicum and S. ocellatum LPS on neonatal rat microglia IL-10 release. Neonatal rat microglia (1.8–2.0 × 10⁵ cells/well) were treated with E. coli LPS (0.1–100 ng/mL), S. javanicum or S. ocellatum LPS (0.1–105 ng/mL) for 18-h in vitro. IL-10 release was determined as described in the Materials and Methods section. Data expressed as pg/mL is the mean ± SEM from three independent experiments (n), each experiment with triplicate determinations. *** p < 0.001, **** p < 0.0001 LPS versus untreated control (0).
3. Discussion
Microglia activated by stimuli such as infections [50] and neurodegenerative diseases [51] display either the pro-inflammatory M1 or the anti-inflammatory M2 phenotypes that participate in the initiation and resolution of inflammation [43]. One activator of microglia is LPS which activates microglia via its lipid A moiety resulting in the concomitant generation of inflammatory mediators including matrix metalloproteases, arachidonic acid metabolites, cytokines, chemokines, and free radicals both in vivo and in vitro [19].
Our working hypothesis was that cyanobacteria S. javanicum and S. ocellatum LPS would induce an M1 or classical activation phenotype in primary neonatal rat microglia in vitro and O2− release. In fact, both S. javanicum and S. ocellatum LPS stimulated microglia released statistically significant O2− in a concentration-dependent manner similar to E. coli LPS, which was used as a positive control. Our present observations are consistent with published observations on O2− release by cyanobacteria Microcystis aeruginosa and Oscillatoria sp. LPS-treated primary rat microglia in vitro [3,4]. While cyanobacterial LPS from either M. aeruginosa, Oscillatoria sp., or S. javanicum showed similar O2− release, S. ocellatum LPS caused microglia to generate slightly higher concentrations of O2−. Furthermore, peak O2− release was observed at 1000 ng/mL M. aeruginosa and Oscillatoria sp. LPS [3,4], while in the current study, maximal O2- release required 10,000 ng/mL S. javanicum LPS and 100,000 ng/mL S. ocellatum LPS. The nature of the observed range of potencies among these cyanobacterial LPS and O2− release in vitro remains to be investigated in future studies.
In addition to O2−, S. javanicum and S. ocellatum LPS-treated microglia generated pro-inflammatory cytokines and chemokines in a concentration-dependent manner: MIP-2/CXCL-2 > IL-6 > CINC-1/CXCL-1 > MIP-1α/CCL3 > TNF-α. Although S. javanicum LPS was less potent than E. coli LPS in inducing the M1 phenotype, and less efficacious in stimulating release of four cytokines and chemokines, the release of CINC-1/CXCL-1 was enhanced compared to E. coli LPS. In contrast, S. ocellatum LPS, with the sole exception of MIP-1α/CCL3, was both less potent and less efficacious in activating an M1 microglia phenotype with concomitant release of MIP-2/CXCL-2, IL-6, CINC-1/CXCL-1, and TNF-α.
Two recent studies characterizing microglial activation by cyanobacteria M. aeruginosa and Oscillatoria sp. LPS [3,4] allow for an interesting comparison of cyanobacterial LPS efficacy and potency in the concomitant generation of pro-inflammatory cytokines and chemokines. Of the four cyanobacterial LPS our laboratory has studied so far, M. aeruginosa appears to be the most efficacious in stimulating secretion of MIP-2/CXCL-2, IL-6, MIP-1α/CCL3, and TNF-α, while S. ocellatum LPS was the least efficacious. As compared to Oscillatoria sp. LPS [3], S. javanicum LPS appeared to be more efficacious in stimulating secretion of MIP-2/CXCL-2, IL-6, and CINC-1/CXCL-1 from rat microglia, but resulted in similar concentrations of MIP-1α/CCL3 and TNF-α. Thus, our study provides experimental support for our working hypothesis, namely that cyanobacteria S. javanicum and S. ocellatum LPS (0.1–100,000 ng/mL) activated an M1 or classical activation phenotype in primary rat microglia, with no significant toxicity to microglia in vitro.
The second component of our working hypothesis was to investigate whether S. javanicum and S. ocellatum LPS-treated rat microglia activated a M2 or alternative activation phenotype with concomitant release of the anti-inflammatory mediator IL-10. The M2 microglia phenotype and anti-inflammatory mediators have been associated with tissue repair processes [52]. Both S. javanicum and S. ocellatum LPS-treated rat microglia demonstrated statistically significant concentration-dependent release of the anti-inflammatory cytokine IL-10. Although both S. javanicum and S. ocellatum LPS were less potent than E. coli LPS in stimulating release of IL-10, S. javanicum LPS had similar efficacy as E. coli LPS. Thus, our present results complement our recently published study on the effects of cyanobacterium Oscillatoria sp. LPS on alternative activation of rat microglia and concomitant IL-10 release [3]. In terms of potency, both Scytonema species LPS were 10-fold less potent as they did not stimulate maximal IL-10 release until 100,000 ng/mL LPS, whereas Oscillatoria sp. LPS resulted in peak IL-10 release at 10,000 ng/mL LPS [3]. We currently hypothesize that the observed differences in potency and efficacy amongst the cyanobacterial LPS could be due to differing lipid A structures [25]. The structures of most cyanobacterial LPS is currently unknown, so determination of LPS structure appears necessary for further characterization of their in vitro and in vivo effects on microglial activation states [25,26].
Taken together, our data lend support to our working hypothesis by demonstrating that in vitro treatment of primary neonatal rat microglia with cyanobacteria S. javanicum and S. ocellatum LPS will result in both classical or M1 and alternative or M2 activation in a concentration-dependent manner. As our current study was conducted in vitro, and because it has been reported that E. coli and Salmonella tiphyimurium LPS activate microglia upon systemic administration [53,54,55], future studies are required to determine whether systemic cyanobacterial S. javanicum and S. ocellatum LPS will activate microglia in the CNS, as well as concomitant pro-inflammatory and anti-inflammatory mediator release.
4. Conclusions
In conclusion, the present investigation on the toxicology of both S. javanicum and S. ocellatum LPS to microglia in vitro extends our previous studies with cyanobacteria Microcystis aeruginosa and Oscillatoria sp. LPS, and contributes to our understanding of the potential toxicity of cyanobacterial LPS in general, and the genus Scytonema in particular, to the brain immune system.
5. Materials and Methods
5.1. Chemicals
Escherichia coli LPS (Ec) (026:B6) was purchased from Difco Laboratories (Detroit, MI, USA). Cyanobacteria S. javanicum (167 EU/ng) and S. ocellatum (77 EU/ng) LPS were prepared by hot phenol/water extraction [56] by Dr. Philip Williams, University of Hawaii at Manoa (Honolulu, HI, USA) from UHM’s strains GB-9-9 and HX-22-2, respectively; endotoxins were assessed using the Genscript ToxinSensor Chromogenic LAL Endotoxin Assay (Piscataway, NJ, USA) that detects the amount of lipid A present. The inherent variability of the LAL assay is 50–200% and can be effected by variations in the structure of lipid A, the degree of aggregation of the LPS sample, and inherent variability in the LAL reagent (lysate of the horseshoe crab) [57,58]; Dulbecco’s modified Eagle medium (DMEM) with high glucose (4.5 mg/L), Hanks’ balanced salt solution (HBSS), penicillin (P), streptomycin (S), and trypsin (0.25%)-EDTA (1 mM) were from GIBCO Laboratories (Life Technologies Inc., Grand Island, NY, USA); heat-inactivated fetal bovine serum certified (FBS) was from Hyclone (Logan, UT, USA). Ferricytochrome c type III (from horse heart) (FCC), superoxide dismutase (from bovine liver) (SOD), phorbol 12-myristate 13-acetate (PMA) and dimethyl sulfoxide (DMSO) were from Sigma Chemical Co. (St. Louis, MO, USA). PMA was maintained at −20 °C as a 10 mM stock solution in DMSO.
5.2. LPS Contamination
Glassware and metal spatulas were baked for 4 h at 210 °C to inactivate LPS [59]. Sterile and LPS-free 225-cm2 vented cell culture flasks were from BD Biosciences (San Jose, CA, USA); 24-well flat-bottom culture clusters were from Costar® (Corning Inc., Corning, NY, USA); disposable serological pipettes were from Greiner Bio-One (Monroe, NC, USA). Sterile and pyrogen-free Eppendorf Biopur pipette tips were from Brinkmann Instruments, Inc. (Westbury, NY, USA).
5.3. Isolation of Primary Rat Neonatal Microglia
Adherence to the National Institutes of Health guidelines on the use of experimental animals and protocols approved by Midwestern University’s Research and Animal Care Committee were followed in all experiments (Midwestern University Protocol File # 941.1 titled “ Neuroinflammation, microglia and marine natural products”was approved on 5 January 2015). The cerebral cortices of 1–2 day-old Sprague-Dawley rats (Charles Rivers, Hartford, CT, USA), were surgically removed, placed in cold DMEM containing 120 U/mL P and 12 μg/mL S, the meninges removed, and brain tissue minced and dissociated with trypsin-EDTA at 35.9 °C for 3–5 min. The mixed glial cell suspension was plated in 225-cm2 vented cell culture flasks with DMEM medium supplemented with 10% FBS containing 120 U/mL P and 12 μg/mL S and grown in a humidified 5% CO2 incubator at 35.9 °C for 12–14 days. Upon confluence of the astrocyte layer (day 14) and every week thereafter, microglia were detached using an orbital shaker (150 rpm, 0.5 h, 35.9 °C, 5% CO2), centrifuged (400× g, 25 min, 4 °C), and cell number and viability assessed by trypan blue dye exclusion. Rat neonatal microglia (2 × 10⁵ cells/well) averaging greater than 95% viability were plated in non-pyrogenic polystyrene 24-well flat-bottom culture clusters with DMEM supplemented with 10% FBS containing 120 U/mL P and 12 μg/mL S, and then transferred to a humidified incubator at 35.9 °C and 5% CO2, 24 h prior to the experiments. The purity of the isolated rat brain neonatal microglia was routinely determined using a mouse monoclonal anti-rat CD11b antibody (Cat # MCA275R, AbD SeroTec, Raleigh, NC, USA), and was greater than 98%.
5.4. Activation of Microglia with LPS (Experimental Protocol)
To determine the effect of S. javanicum and S. ocellatum LPS on neonatal rat microglia classical and alternative activation and concomitant mediator release (O2−, thromboxane B2, cytokines, and chemokines), 1.8–2.0 × 10⁵ neonatal microglia in DMEM + 10% FBS + 0.1% P + S were plated into each well of a 24-well flat-bottom culture cluster, and then stimulated with either 0.1–100,000 ng/mL cyanobacterium S. javanicum LPS, S. ocellatum LPS, or E. coli LPS (0.1–100 ng/mL) used as a positive control. Time-of-stimulation with S. javanicum, S. ocellatum LPS or E. coli LPS was 4 PM USA Central-Standard-Time (Coordinated Universal Time + 5 h). After the 18 h incubation, conditioned medium (1 mL) from each tissue culture well was split into two aliquots. One aliquot (0.1 mL) was used to measure lactate dehydrogenase (LDH) levels and the remaining aliquot (0.9 mL) was frozen (−84 °C) until determination of TXB2, chemokines, and cytokines as described below. Once the conditioned media had been removed, either S. javanicum, S. ocellatum, or E. coli LPS–treated microglia cells were washed with warm (37 °C) HBSS, and O2− was determined as described below.
5.5. Assay for Microglia O2− Generation
O2− generation was determined by the SOD-inhibitable reduction of FCC [19]. Briefly, PMA (1 µM)-triggered O2− release from either S. javanicum, S. ocellatum or E. coli LPS-activated microglia was measured in the presence of FCC (50 μM) and HBSS, with or without SOD (700 Units), which inhibited >95% of FCC reduction during a 70 min incubation. All experimental treatments were run in duplicate and in a final volume of 1 mL. Changes in FCC absorbance were measured at 550 nm using a DU-800 spectrophotometer (Beckman Coulter, Inc., Indianapolis, Indiana, USA). Differences in the amount of reduced FCC, in the presence and absence of SOD, were used to determine microglia O2− generation using the molecular extinction coefficient of 21.0 × 10³ M−1 cm−1 and data expressed in nmol.
5.6. Lactate Dehydrogenase Assay
To assess cell viability following preincubation of microglia with either S. javanicum, S. ocellatum or E. coli LPS as described in our experimental protocol, the conditioned medium was harvested and LDH release was determined spectrophotometrically [19,60]. Microglia LDH release was expressed as a percent of total LDH released into the conditioned media. Total LDH release resulted from 0.1% Triton X-100-lysed microglia (intracellular LDH) plus LDH present in the extracellular media, because the fetal bovine serum contained LDH (data not shown). Unless LDH release from LPS-treated microglia was significantly greater than that observed from the vehicle-treated group, shown as 0 or control in the corresponding figures, the 18 h LPS treatment was considered to have had no effect on microglia viability.
5.7. Assay for Microglia TXB2 Generation
After preincubation of neonatal rat microglia with either E. coli, S. javanicum, or S. ocellatum LPS for 18 h, TXB2 production was determined by immunoassay (Cayman Chemical, Ann Arbor, MI, USA) according to the manufacturer’s protocol. Results were expressed as pg/mL and the minimum detectable concentration was 7.8 pg/mL TXB2.
5.8. Assay for Microglia MMP-9 Generation
After 18 h treatment of neonatal rat microglia with E. coli, S. javanicum, or S. ocellatum LPS, MMP-9 generation was determined by ELISA (Cat# DY8174-05, R&D Systems, Minneapolis, MN, USA) according to manufacturer’s protocol. Results were expressed as pg/mL and the minimum detectable concentration was 78.10 pg/mL MMP-9.
5.9. Milliplex MagPix Multiplex Array
Supernatants from untreated, E. Coli LPS, S. javanicum LPS, and S. ocellatum LPS-treated microglia were added to a 96 well Milliplex kit plate (Cat# RECYTMAG-65K, Millipore, Billerica, MA, USA) to assay the following cytokines and chemokines: TNF-α, IL-6, CINC-1/CXCL-1, MIP-1α/CCL3, MIP-2/CXCL-2, and IL-10. The Milliplex plate was read by the Luminex MagPix technology. Data was analyzed using xPONENT software (Luminex, Austin, TX, USA). Results were expressed as pg/mL. Minimum detectable concentrations for cytokines and chemokines were: IL-6, 30.7 pg/mL; IL-10, 2.7 pg/mL; TNF-α, 1.9 pg/mL; CINC-1/CXCL1, 19.7 pg/mL; MIP-2/CXCL2, 11.3 pg/mL; and MIP-1α/CCL3, 0.8 pg/mL.
5.10. Statistical Analysis of the Data
Data was expressed as means ± SEM of triplicate determinations of 3 similar experiments. Data was analyzed with Prism software package version 7 from GraphPad (San Diego, CA, USA). Appropriate multiway analysis of variance was performed on all sets of data. Where significant interactions were encountered, simple effects were tested with a one-way analysis of variance followed by a Dunnett multiple comparisons test. Differences were considered statistically significant at p < 0.05 [3].
Supplementary Materials
The following is available online: http://www.mdpi.com/2072-6651/10/4/130/s1. Supplementary Table S1: Effect of S. javanicum and S. ocellatum LPS on Neonatal Rat Brain Microglia proinflammatory TXB2 Generation.
Acknowledgments
We gratefully acknowledge the support by Midwestern University’s animal facility staff, and Casey Philbin for assistance with cyanobacteria S. javanicum and S. ocellatum culturing and LPS isolation.
Author Contributions
L.C.K. and A.M.S.M. conceived and designed the experiments; L.C.K., E.C. and M.L.H. performed the experiments; L.C.K., E.C. and M.L.H. analyzed the data; P.G.W. contributed reagents/materials/analysis tools; L.C.K. and A.M.S.M. wrote the manuscript.
Conflicts of Interest
The authors declare no conflict of interest.
Funding
This research was supported in part by the Office of Research and Sponsored Programs at Midwestern University, the Biomedical Sciences Program, College of Health Sciences, Midwestern University, and National Institute for Aging (R01AG039468; PW).
References
- Boopathi, T.; Ki, J.S. Impact of environmental factors on the regulation of cyanotoxin production. Toxins 2014, 6, 1951–1978. [Google Scholar] [CrossRef] [PubMed]
- Wiegand, C.; Pflugmacher, S. Ecotoxicological effects of selected cyanobacterial secondary metabolites: A short review. Toxicol. Appl. Pharmacol. 2005, 203, 201–218. [Google Scholar] [CrossRef] [PubMed]
- Mayer, A.M.; Murphy, J.; MacAdam, D.; Osterbauer, C.; Baseer, I.; Hall, M.L.; Feher, D.; Williams, P. Classical and alternative activation of cyanobacterium Oscillatoria sp. Lipopolysaccharide-treated rat microglia in vitro. Toxicol. Sci. 2016, 149, 484–495. [Google Scholar] [CrossRef] [PubMed]
- Mayer, A.M.; Clifford, J.A.; Aldulescu, M.; Frenkel, J.A.; Holland, M.A.; Hall, M.L.; Glaser, K.B.; Berry, J. Cyanobacterial Microcystis aeruginosa lipopolysaccharide elicits release of superoxide anion, thromboxane B2, cytokines, chemokines, and matrix metalloproteinase-9 by rat microglia. Toxicol. Sci. 2011, 121, 63–72. [Google Scholar] [CrossRef] [PubMed]
- Ohkouchi, Y.; Tajima, S.; Nomura, M.; Itoh, S. Inflammatory responses and potencies of various lipopolysaccharides from bacteria and cyanobacteria in aquatic environments and water supply systems. Toxicon 2015, 97, 23–31. [Google Scholar] [CrossRef] [PubMed]
- Stewart, I.; Schluter, P.J.; Shaw, G.R. Cyanobacterial lipopolysaccharides and human health—A review. Environ. Health 2006, 5, 7. [Google Scholar] [CrossRef] [PubMed]
- Carmeli, S.; Moore, R.E.; Patterson, G.M. Tolytoxin and new scytophycins from three species of scytonema. J. Nat. Prod. 1990, 53, 1533–1542. [Google Scholar] [CrossRef] [PubMed]
- Patterson, G.M.; Bolis, C.M. Scytophycin production by axenic cultures of the cyanobacterium Scytonema ocellatum. Nat. Toxins 1994, 2, 280–285. [Google Scholar] [CrossRef] [PubMed]
- Smith, C.D.; Carmeli, S.; Moore, R.E.; Patterson, G.M. Scytophycins, novel microfilament-depolymerizing agents which circumvent p-glycoprotein-mediated multidrug resistance. Cancer Res. 1993, 53, 1343–1347. [Google Scholar] [PubMed]
- Bokesch, H.R.; O’Keefe, B.R.; McKee, T.C.; Pannell, L.K.; Patterson, G.M.; Gardella, R.S.; Sowder, R.C., 2nd; Turpin, J.; Watson, K.; Buckheit, R.W., Jr.; et al. A potent novel anti-hiv protein from the cultured cyanobacterium Scytonema varium. Biochemistry 2003, 42, 2578–2584. [Google Scholar] [CrossRef] [PubMed]
- Mo, S.; Krunic, A.; Pegan, S.D.; Franzblau, S.G.; Orjala, J. An antimicrobial guanidine-bearing sesterterpene from the cultured cyanobacterium Scytonema sp. J. Nat. Prod. 2009, 72, 2043–2045. [Google Scholar] [CrossRef] [PubMed]
- Krunic, A.; Vallat, A.; Mo, S.; Lantvit, D.D.; Swanson, S.M.; Orjala, J. Scytonemides a and b, cyclic peptides with 20 s proteasome inhibitory activity from the cultured cyanobacterium Scytonema hofmanii. J. Nat. Prod. 2010, 73, 1927–1932. [Google Scholar] [CrossRef] [PubMed]
- Harland, F.; Wood, S.A.; Broady, P.; Williamson, W.; Gaw, S. Changes in saxitoxin-production through growth phases in the metaphytic cyanobacterium Scytonema cf. crispum. Toxicon 2015, 103, 74–79. [Google Scholar] [CrossRef] [PubMed]
- Smith, F.M.; Wood, S.A.; van Ginkel, R.; Broady, P.A.; Gaw, S. First report of saxitoxin production by a species of the freshwater benthic cyanobacterium, Scytonema agardh. Toxicon 2011, 57, 566–573. [Google Scholar] [CrossRef] [PubMed]
- Perry, V.H.; Teeling, J. Microglia and macrophages of the central nervous system: The contribution of microglia priming and systemic inflammation to chronic neurodegeneration. Semin. Immunopathol. 2013, 35, 601–612. [Google Scholar] [CrossRef] [PubMed]
- Teeling, J.L.; Perry, V.H. Systemic infection and inflammation in acute cns injury and chronic neurodegeneration: Underlying mechanisms. Neuroscience 2009, 158, 1062–1073. [Google Scholar] [CrossRef] [PubMed]
- Kettenmann, H.; Hanisch, U.K.; Noda, M.; Verkhratsky, A. Physiology of microglia. Physiol. Rev. 2011, 91, 461–553. [Google Scholar] [CrossRef] [PubMed]
- Colton, C.A. Heterogeneity of microglial activation in the innate immune response in the brain. J. Neuroimmune Pharmacol. 2009, 4, 399–418. [Google Scholar] [CrossRef] [PubMed]
- Mayer, A.M.; Oh, S.; Ramsey, K.H.; Jacobson, P.B.; Glaser, K.B.; Romanic, A.M. Escherichia coli lipopolysaccharide potentiation and inhibition of rat neonatal microglia superoxide anion generation: Correlation with prior lactic dehydrogenase, nitric oxide, tumor necrosis factor-α, thromboxane B2, and metalloprotease release. Shock 1999, 11, 180–186. [Google Scholar] [CrossRef] [PubMed]
- Cherry, J.D.; Olschowka, J.A.; O’Banion, M.K. Neuroinflammation and M2 microglia: The good, the bad, and the inflamed. J. Neuroinflamm. 2014, 11, 98. [Google Scholar] [CrossRef] [PubMed]
- Colton, C.; Wilcock, D.M. Assessing activation states in microglia. CNS Neurol. Disord. Drug Targets 2010, 9, 174–191. [Google Scholar] [CrossRef] [PubMed]
- Caroff, M.; Karibian, D. Structure of bacterial lipopolysaccharides. Carbohydr. Res. 2003, 338, 2431–2447. [Google Scholar] [CrossRef] [PubMed]
- Rietschel, E.T.; Brade, H.; Holst, O.; Brade, L.; Muller-Loennies, S.; Mamat, U.; Zahringer, U.; Beckmann, F.; Seydel, U.; Brandenburg, K.; et al. Bacterial endotoxin: Chemical constitution, biological recognition, host response, and immunological detoxification. Curr. Top. Microbiol. Immunol. 1996, 216, 39–81. [Google Scholar] [PubMed]
- Anwar, M.A.; Choi, S. Gram-negative marine bacteria: Structural features of lipopolysaccharides and their relevance for economically important diseases. Mar. Drugs 2014, 12, 2485–2514. [Google Scholar] [CrossRef] [PubMed]
- Durai, P.; Batool, M.; Choi, S. Structure and effects of cyanobacterial lipopolysaccharides. Mar. Drugs 2015, 13, 4217–4230. [Google Scholar] [CrossRef] [PubMed]
- Molinaro, A.; Holst, O.; Di Lorenzo, F.; Callaghan, M.; Nurisso, A.; D’Errico, G.; Zamyatina, A.; Peri, F.; Berisio, R.; Jerala, R.; et al. Chemistry of lipid A: At the heart of innate immunity. Chemistry 2015, 21, 500–519. [Google Scholar] [CrossRef] [PubMed]
- Wang, M.H.; Flad, H.D.; Feist, W.; Brade, H.; Kusumoto, S.; Rietschel, E.T.; Ulmer, A.J. Inhibition of endotoxin-induced interleukin-6 production by synthetic lipid a partial structures in human peripheral blood mononuclear cells. Infect. Immun. 1991, 59, 4655–4664. [Google Scholar] [PubMed]
- Blahova, L.; Adamovsky, O.; Kubala, L.; Svihalkova Sindlerova, L.; Zounkova, R.; Blaha, L. The isolation and characterization of lipopolysaccharides from Microcystis aeruginosa, a prominent toxic water bloom forming cyanobacteria. Toxicon 2013, 76, 187–196. [Google Scholar] [CrossRef] [PubMed]
- Block, M.L.; Zecca, L.; Hong, J.S. Microglia-mediated neurotoxicity: Uncovering the molecular mechanisms. Nat. Rev. Neurosci. 2007, 8, 57–69. [Google Scholar] [CrossRef] [PubMed]
- Choi, S.H.; Aid, S.; Bosetti, F. The distinct roles of cyclooxygenase-1 and -2 in neuroinflammation: Implications for translational research. Trends Pharmacol. Sci. 2009, 30, 174–181. [Google Scholar] [CrossRef] [PubMed]
- Könnecke, H.; Bechmann, I. The role of microglia and matrix metalloproteinases involvement in neuroinflammation and gliomas. Clin. Dev. Immunol. 2013, 2013, 914104. [Google Scholar] [CrossRef] [PubMed]
- Nakamura, Y.; Si, Q.S.; Kataoka, K. Lipopolysaccharide-induced microglial activation in culture: Temporal profiles of morphological change and release of cytokines and nitric oxide. Neurosci. Res. 1999, 35, 95–100. [Google Scholar] [CrossRef]
- Suuronen, T.; Huuskonen, J.; Pihlaja, R.; Kyrylenko, S.; Salminen, A. Regulation of microglial inflammatory response by histone deacetylase inhibitors. J. Neurochem. 2003, 87, 407–416. [Google Scholar] [CrossRef] [PubMed]
- Smith, J.A.; Das, A.; Ray, S.K.; Banik, N.L. Role of pro-inflammatory cytokines released from microglia in neurodegenerative diseases. Brain Res. Bull. 2012, 87, 10–20. [Google Scholar] [CrossRef] [PubMed]
- Mayer, A.M.; Hall, M.L.; Holland, M.; De Castro, C.; Molinaro, A.; Aldulescu, M.; Frenkel, J.; Ottenhoff, L.; Rowley, D.; Powell, J. Vibrio vulnificus MO6-24/O lipopolysaccharide stimulates superoxide anion, thromboxane B2, matrix metalloproteinase-9, cytokine and chemokine release by rat brain microglia in vitro. Mar. Drugs 2014, 12, 1732–1756. [Google Scholar] [CrossRef] [PubMed]
- Johnson, E.A.; Dao, T.L.; Guignet, M.A.; Geddes, C.E.; Koemeter-Cox, A.I.; Kan, R.K. Increased expression of the chemokines cxcl1 and mip-1alpha by resident brain cells precedes neutrophil infiltration in the brain following prolonged soman-induced status epilepticus in rats. J. Neuroinflamm. 2011, 8, 41. [Google Scholar] [CrossRef] [PubMed]
- Häusler, K.G.; Prinz, M.; Nolte, C.; Weber, J.R.; Schumann, R.R.; Kettenmann, H.; Hanisch, U.-K. Interferon-γ differentially modulates the release of cytokines and chemokines in lipopolysaccharide- and pneumococcal cell wall-stimulated mouse microglia and macrophages. Eur. J. Neurosci. 2002, 16, 2113–2122. [Google Scholar] [CrossRef] [PubMed]
- Peterson, P.K.; Hu, S.; Salak-Johnson, J.; Molitor, T.W.; Chao, C.C. Differential production of and migratory response to beta chemokines by human microglia and astrocytes. J. Infect. Dis. 1997, 175, 478–481. [Google Scholar] [CrossRef] [PubMed]
- Sun, D.; Hu, X.; Liu, X.; Whitaker, J.N.; Walker, W.S. Expression of chemokine genes in rat glial cells: The effect of myelin basic protein-reactive encephalitogenic t cells. J. Neurosci. Res. 1997, 48, 192–200. [Google Scholar] [CrossRef]
- Seino, Y.; Ikeda, U.; Minezaki, K.K.; Funayama, H.; Kasahara, T.; Konishi, K.; Shimada, K. Expression of cytokine-induced neutrophil chemoattractant in rat cardiac myocytes. J. Mol. Cell. Cardiol. 1995, 27, 2043–2051. [Google Scholar] [CrossRef]
- Campbell, L.R.; Pang, Y.; Ojeda, N.B.; Zheng, B.; Rhodes, P.G.; Alexander, B.T. Intracerebral lipopolysaccharide induces neuroinflammatory change and augmented brain injury in growth-restricted neonatal rats. Pediatr. Res. 2012, 71, 645–652. [Google Scholar] [CrossRef] [PubMed]
- Lafrance, V.; Inoue, W.; Kan, B.; Luheshi, G.N. Leptin modulates cell morphology and cytokine release in microglia. Brain Behav. Immun. 2010, 24, 358–365. [Google Scholar] [CrossRef] [PubMed]
- Ransohoff, R.M.; Perry, V.H. Microglial physiology: Unique stimuli, specialized responses. Annu. Rev. Immunol. 2009, 27, 119–145. [Google Scholar] [CrossRef] [PubMed]
- Diab, A.; Abdalla, H.; Li, H.L.; Shi, F.D.; Zhu, J.; Hojberg, B.; Lindquist, L.; Wretlind, B.; Bakhiet, M.; Link, H. Neutralization of macrophage inflammatory protein 2 (MIP-2) and MIP-1alpha attenuates neutrophil recruitment in the central nervous system during experimental bacterial meningitis. Infect. Immun. 1999, 67, 2590–2601. [Google Scholar] [PubMed]
- Esen, N.; Kielian, T. Effects of low dose GM-CSF on microglial inflammatory profiles to diverse pathogen-associated molecular patterns (PAMPs). J. Neuroinflamm. 2007, 4, 10. [Google Scholar] [CrossRef] [PubMed]
- Redlich, S.; Ribes, S.; Schutze, S.; Eiffert, H.; Nau, R. Toll-like receptor stimulation increases phagocytosis of Cryptococcus neoformans by microglial cells. J. Neuroinflamm. 2013, 10, 71. [Google Scholar] [CrossRef] [PubMed]
- Aloisi, F.; De Simone, R.; Columba-Cabezas, S.; Levi, G. Opposite effects of interferon-γ and prostaglandin E2 on tumor necrosis factor and interleukin-10 production in microglia: A regulatory loop controlling microglia pro- and anti-inflammatory activities. J. Neurosci. Res. 1999, 56, 571–580. [Google Scholar] [CrossRef]
- Park, K.W.; Lee, H.G.; Jin, B.K.; Lee, Y.B. Interleukin-10 endogenously expressed in microglia prevents lipopolysaccharide-induced neurodegeneration in the rat cerebral cortex in vivo. Exp. Mol. Med. 2007, 39, 812–819. [Google Scholar] [CrossRef] [PubMed]
- Williams, K.; Dooley, N.; Ulvestad, E.; Becher, B.; Antel, J.P. Il-10 production by adult human derived microglial cells. Neurochem. Int. 1996, 29, 55–64. [Google Scholar] [CrossRef]
- Rock, R.B.; Gekker, G.; Hu, S.; Sheng, W.S.; Cheeran, M.; Lokensgard, J.R.; Peterson, P.K. Role of microglia in central nervous system infections. Clin. Microbiol. Rev. 2004, 17, 942–964. [Google Scholar] [CrossRef] [PubMed]
- Franco, R.; Fernandez-Suarez, D. Alternatively activated microglia and macrophages in the central nervous system. Prog. Neurobiol. 2015, 131, 65–86. [Google Scholar] [CrossRef] [PubMed]
- Xia, C.Y.; Zhang, S.; Gao, Y.; Wang, Z.Z.; Chen, N.H. Selective modulation of microglia polarization to m2 phenotype for stroke treatment. Int. Immunopharmacol. 2015, 25, 377–382. [Google Scholar] [CrossRef] [PubMed]
- Banks, W.A.; Gray, A.M.; Erickson, M.A.; Salameh, T.S.; Damodarasamy, M.; Sheibani, N.; Meabon, J.S.; Wing, E.E.; Morofuji, Y.; Cook, D.G.; et al. Lipopolysaccharide-induced blood-brain barrier disruption: Roles of cyclooxygenase, oxidative stress, neuroinflammation, and elements of the neurovascular unit. J. Neuroinflamm. 2015, 12, 223. [Google Scholar] [CrossRef] [PubMed]
- Hoogland, I.C.; Houbolt, C.; van Westerloo, D.J.; van Gool, W.A.; van de Beek, D. Systemic inflammation and microglial activation: Systematic review of animal experiments. J. Neuroinflamm. 2015, 12, 114. [Google Scholar] [CrossRef] [PubMed]
- Qin, L.; Wu, X.; Block, M.L.; Liu, Y.; Breese, G.R.; Hong, J.S.; Knapp, D.J.; Crews, F.T. Systemic lps causes chronic neuroinflammation and progressive neurodegeneration. Glia 2007, 55, 453–462. [Google Scholar] [CrossRef] [PubMed]
- Rezania, S.; Amirmozaffari, N.; Tabarraei, B.; Jeddi-Tehrani, M.; Zarei, O.; Alizadeh, R.; Masjedian, F.; Zarnani, A.H. Extraction, purification and characterization of lipopolysaccharide from Escherichia coli and Salmonella typhi. Avicenna J. Med. Biotechnol. 2011, 3, 3–9. [Google Scholar] [PubMed]
- Ding, J.L.; Ho, B. Endotoxin detection—From limulus amebocye lysate to recombinant factor C. Subcell. Biochem. 2010, 53, 187–208. [Google Scholar] [PubMed]
- WebCite. Variability and Test Error with the LAL Assay. Available online: http://www.americanpharmaceuticalreview.com/Featured-Articles/167404-Variability-and-Test-Error-with-the-LAL-Assay (accessed on 23 February 2018).
- Sharma, S.K. Endotoxin detection and elimination in biotechnology. Biotechnol. Appl. Biochem. 1986, 8, 5–22. [Google Scholar] [PubMed]
- Morgenstern, S.; Flor, R.; Kessler, G.; Klein, B. The automated determination of nad-coupled enzymes. II. Serum lactate dehydrogenase. Clin. Chem. 1966, 12, 274–281. [Google Scholar] [PubMed]
© 2018 by the authors. Licensee MDPI, Basel, Switzerland. This article is an open access article distributed under the terms and conditions of the Creative Commons Attribution (CC BY) license (http://creativecommons.org/licenses/by/4.0/).