1. Introduction
Maize (
Zea mays L.), the third most important crop cultivated on Earth after wheat and rice, is a popular source of nourishment for inhabitants of various regions of the world as well as one of the most popular raw materials used in animal fodder [
1]. However, maize is very often infested with
Fusarium verticilloides and
Fusarium proliferatum fungi, which produce toxic secondary metabolites—a group of substances collectively called fumonisins. These toxins are very often found in maize-based food products [
2,
3]. Fumonisin B
1 (FB
1), fumonisin B
2 (FB
2) and fumonisin B
3 (FB
3) are the most frequent ones, among which FB
1 dominates. Consumption of corn grain contaminated with fumonisins may induce leukoencephalomalacia in horses, pulmonary oedema in swine, liver injury, nephrotoxicity, liver cancer in rats, and arteriosclerosis in primates other than humans. Epidemiologic studies in some South Africa populations have shown a high correlation between the fumonisin level in food and the oesophagus cancer incidence rate [
4,
5,
6]. For this reason, the International Agency for Research on Cancer (IARC) has classified FB
1 in toxicity class 2B as probably carcinogenic for people [
7], while the FAO/WHO JECFA Committee and the European Commission Scientific Committee for Food have set a tolerable daily intake level of FB
1, FB
2, FB
3 or their combination at 2 µg per kg body weight. The EU has defined the maximum permissible levels for the sum of FB
1+FB
2 in maize and maize-products as 200–4000 µg·kg
−1 depending on the foodstuff. Similar US regulations set 2000–4000 µg·kg
−1 levels for the sum of FB
1 + FB
2 + FB
3 depending on the foodstuff [
6].
FB
1 is a diester of propane-1,2,3-tricarboxylic acid (TCA) and 2-amino-12,16-dimethyl-3,5,10,14,15-pentahydroxy-icosane, in which the C-14 and C-15 hydroxyl groups form esters with the TCA group at the chain end. FB
2 and FB
3 are analogues of FB
1. The amino groups and TCA groups of fumonisins facilitate interactions with other compounds, resulting in various bound forms of fumonisin [
8,
9,
10].
Fumonisins are generally considered to be thermally stable. Nevertheless, their stability may depend on conditions that are more or less favourable for chemical reactions. The paths along which they are transformed in various technological processes applied in food processing were studied by Bullerman et al. [
11], Castells et al. [
12], De Girolama et al. [
13], and Humpf and Voss [
14]. Still, transformation mechanisms have not been completely clarified. Some authors have suggested that fumonisins may react with some components of the food matrix during technological processes [
14]. Others are of the opinion that hidden fumonisins may be formed already in raw (unprocessed) maize due to supra-molecular interactions with biopolymers [
9,
10]. In their recently published paper, Lazzaro et al. [
15] suggested that non-covalent interactions with food macro-components are based on some physical interactions between mycotoxins and food components. Since hidden fumonisins are not detectable by means of standard analytical procedures [
16], but might be released inside the human gastrointestinal tract, they may cause underestimation of the real food safety hazard and therefore are a concern from a toxicological point of view [
8]. The presence of hidden fumonisins in raw maize and their ability to form covalent bonds with other compounds during technological processes make the task of understanding the reaction mechanisms significantly more difficult. New reports that raw maize may contain fumonisin derivatives formed by the esterification of fatty acids in reactions most likely assisted by some fungi enzymes as well as some
N-acyl derivatives formed in similar conditions [
17,
18] have only compounded that difficulty.
For that reason, in this work, it was decided to determine both the concentration of free fumonisins (using the standard analytical procedure) and the total concentration of all fumonisins, including those released from hidden forms during alkaline hydrolysis reaction. Hydrolysed forms of fumonisins produced during the reaction may be assayed using a liquid chromatograph coupled with a mass spectrometer. To the best of our knowledge, this is the first attempt to study the stability of free and hidden fumonisins in buffers with various pH values applied when preparing dough from maize-based flour and during dough baking at various temperatures.
2. Results and Discussion
The concentrations of the FB
1/FB
2/FB
3 sum of free fumonisins and the FB
1/FB
2/FB
3 sum of total fumonisins determined in maize flour and maize dough prepared in three different buffers (pH = 3.5, 5.5, and 7.5) at T = 25 °C and baked at eight temperatures (100, 130, 160, 180, 200, 220, 230, and 250 °C) are shown in
Table 1. The penultimate column shows the concentrations of hidden/bound fumonisins, calculated as differences between total and free fumonisins. To facilitate the comparison of results concerning flour and dough, concentrations in the dough were normalized to the amount of flour used to prepare a given dough.
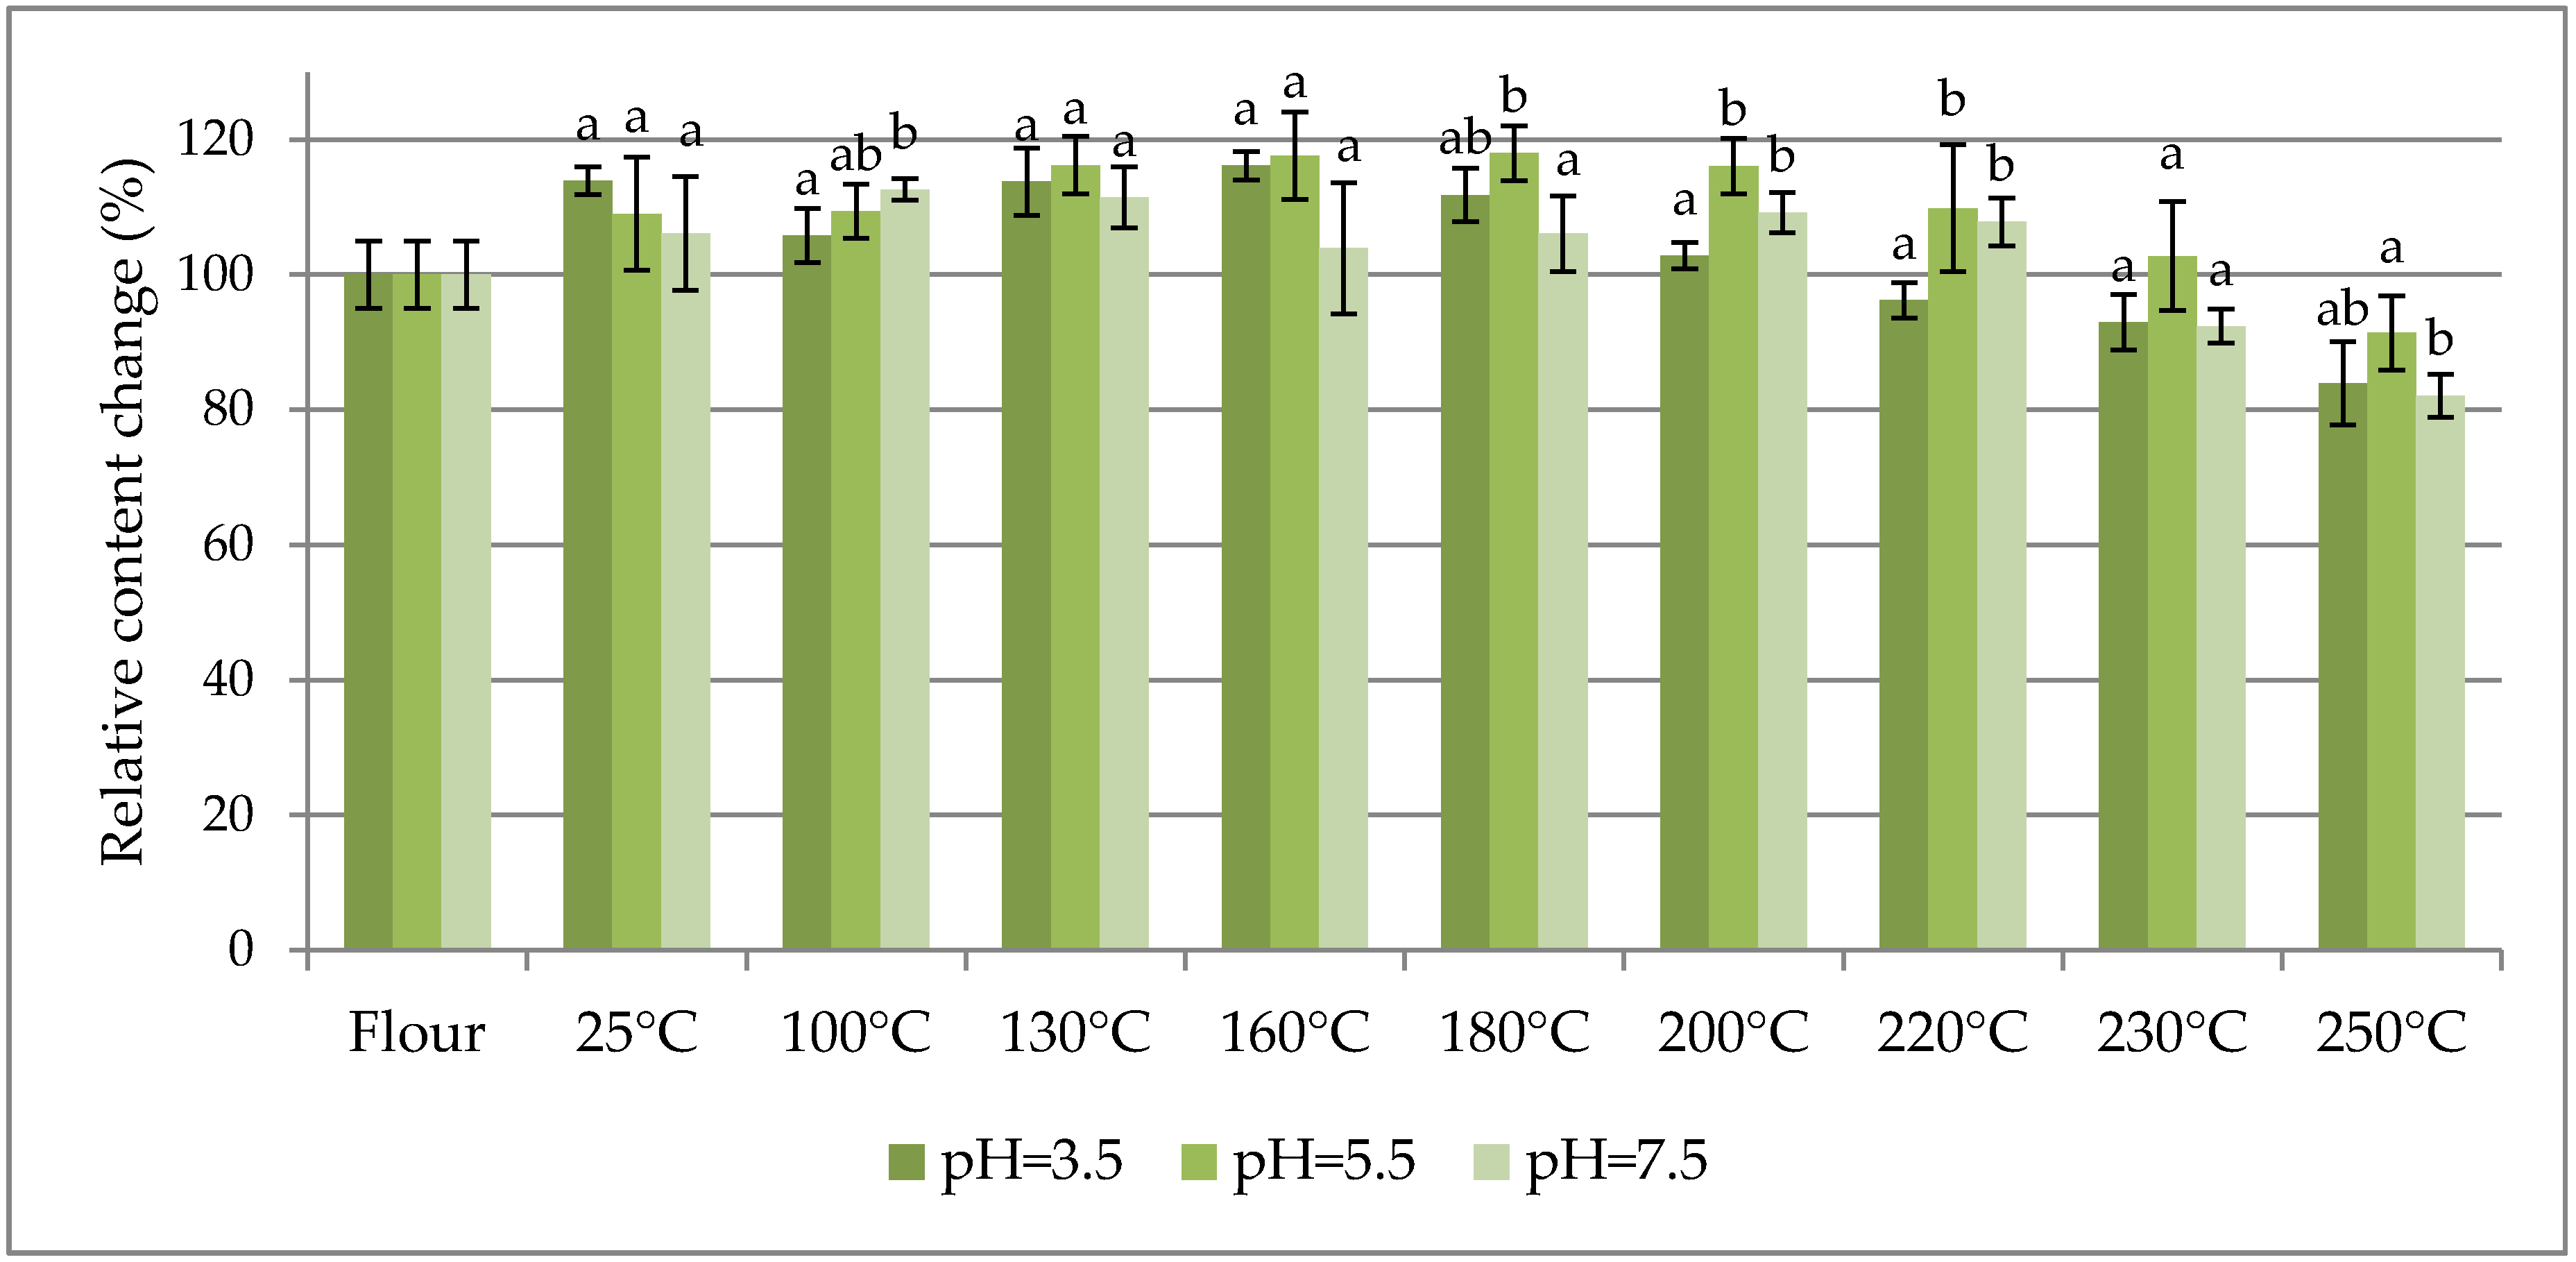
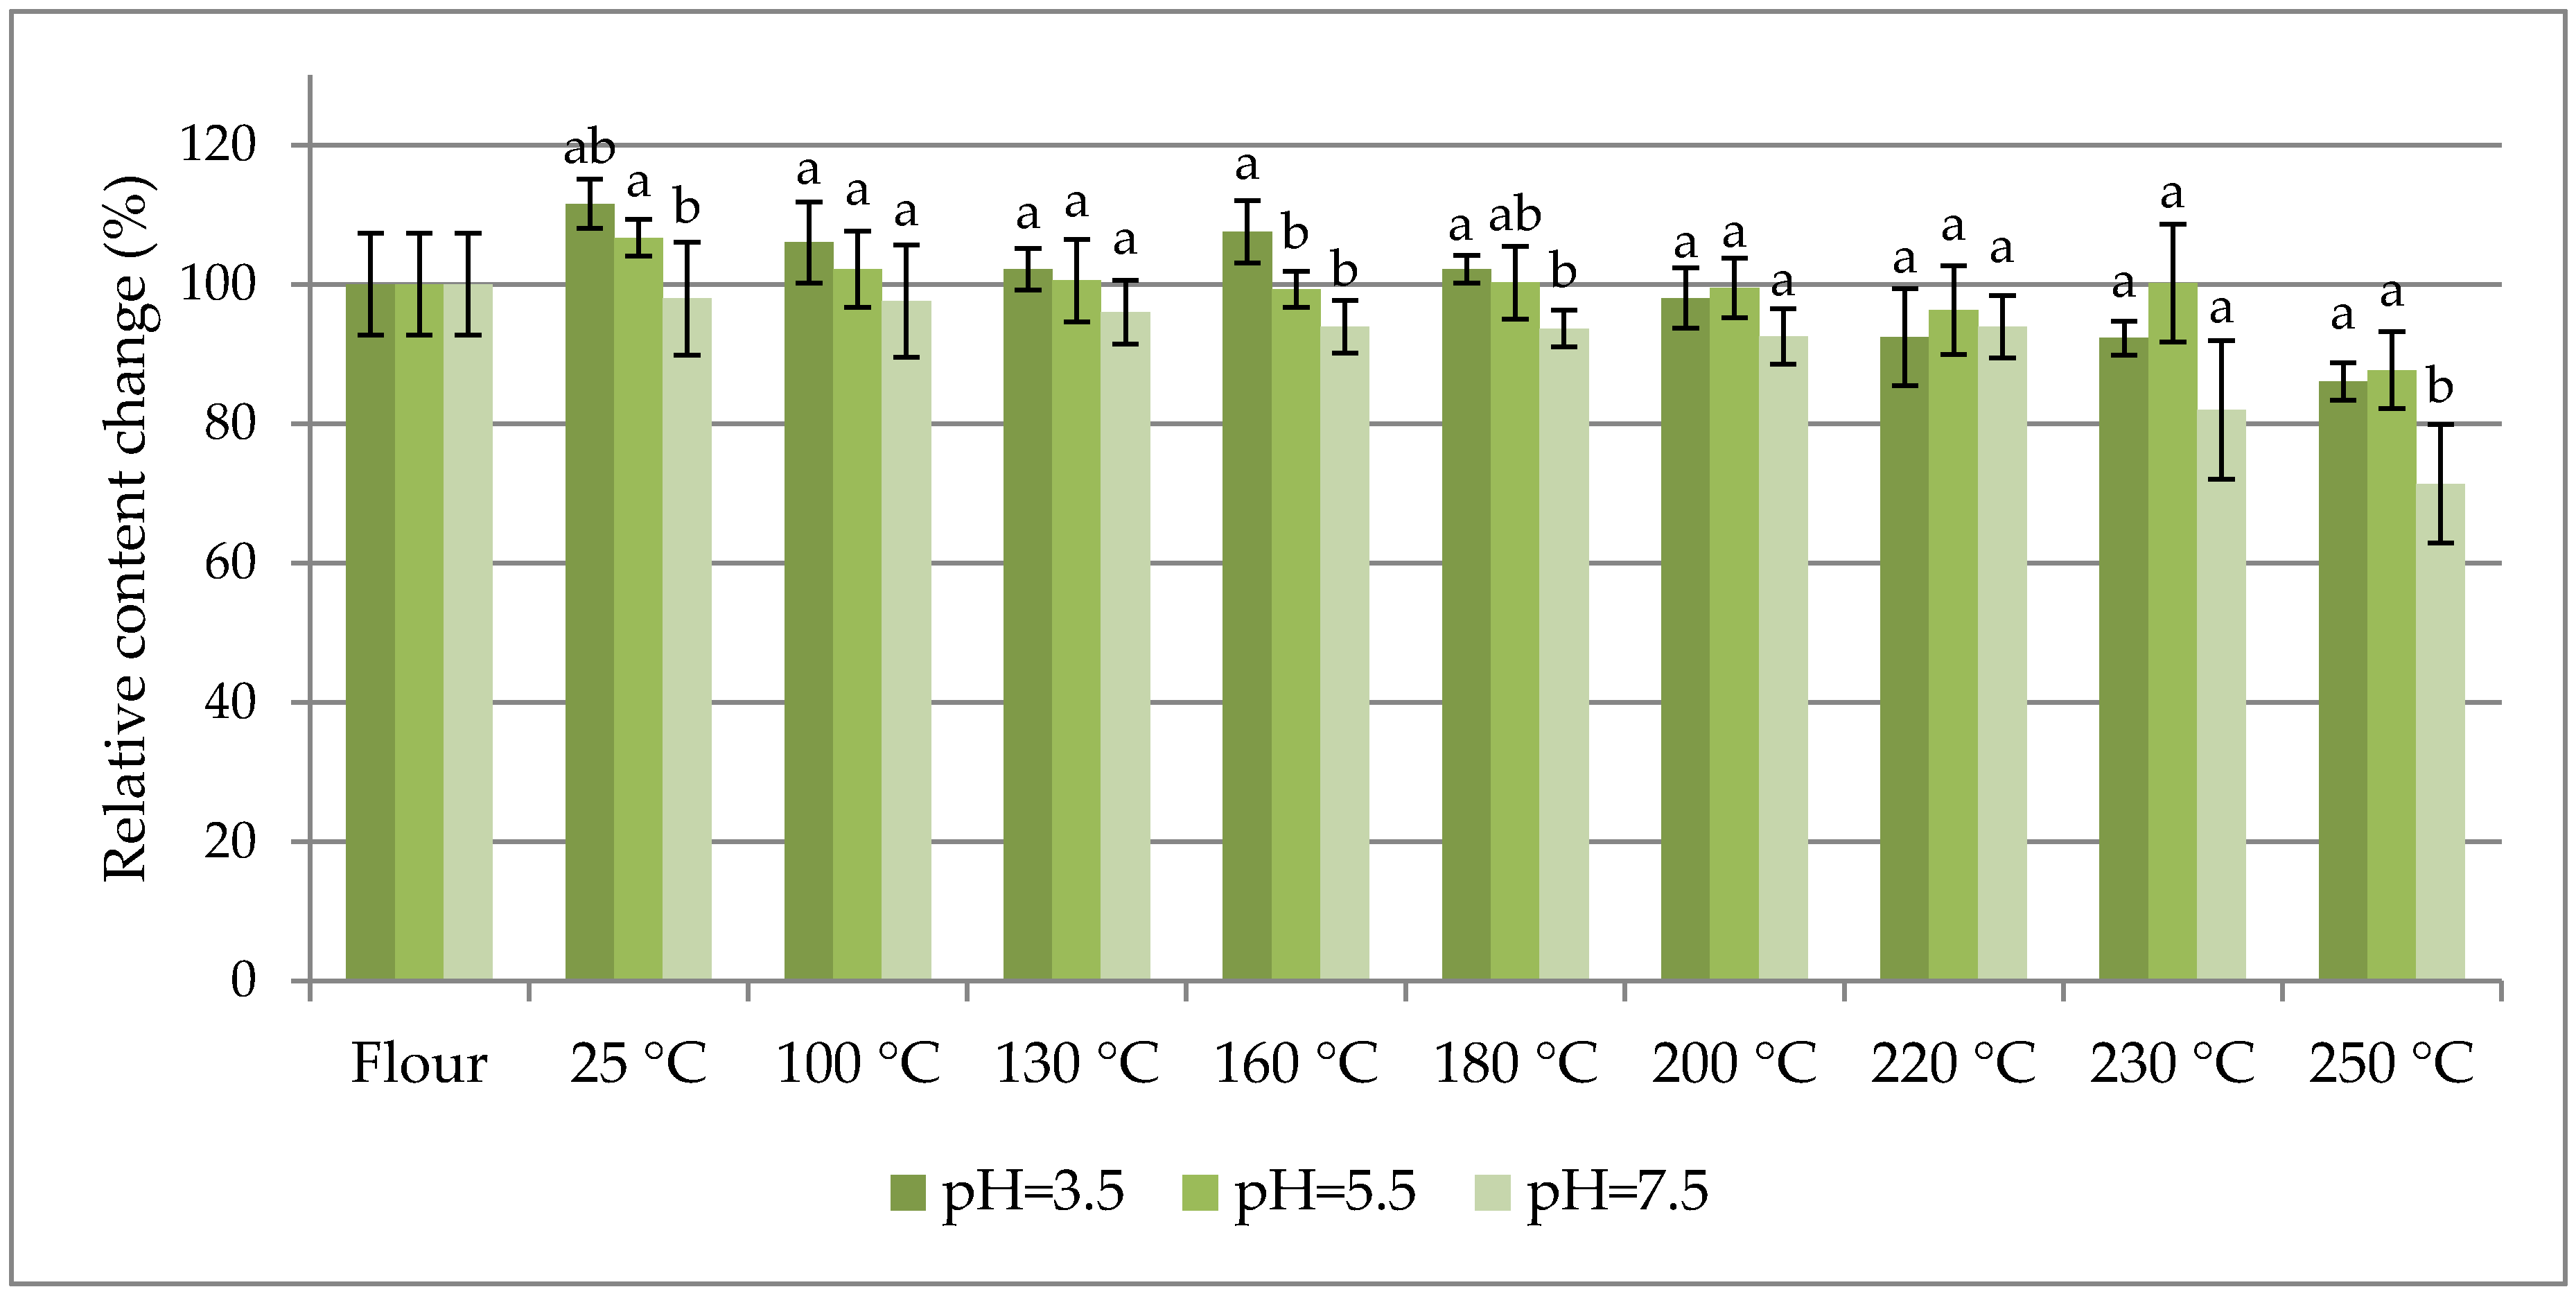
The percentage change in content of selected fumonisins normalized to their concentration in flour (as 100%) are charted vs. the dough baking temperature in
Figure 1,
Figure 2 and
Figure 3 to facilitate the study of fumonisin temperature stability.
Figure 1 shows the sums of free fumonisins (three curves for the investigated pH values),
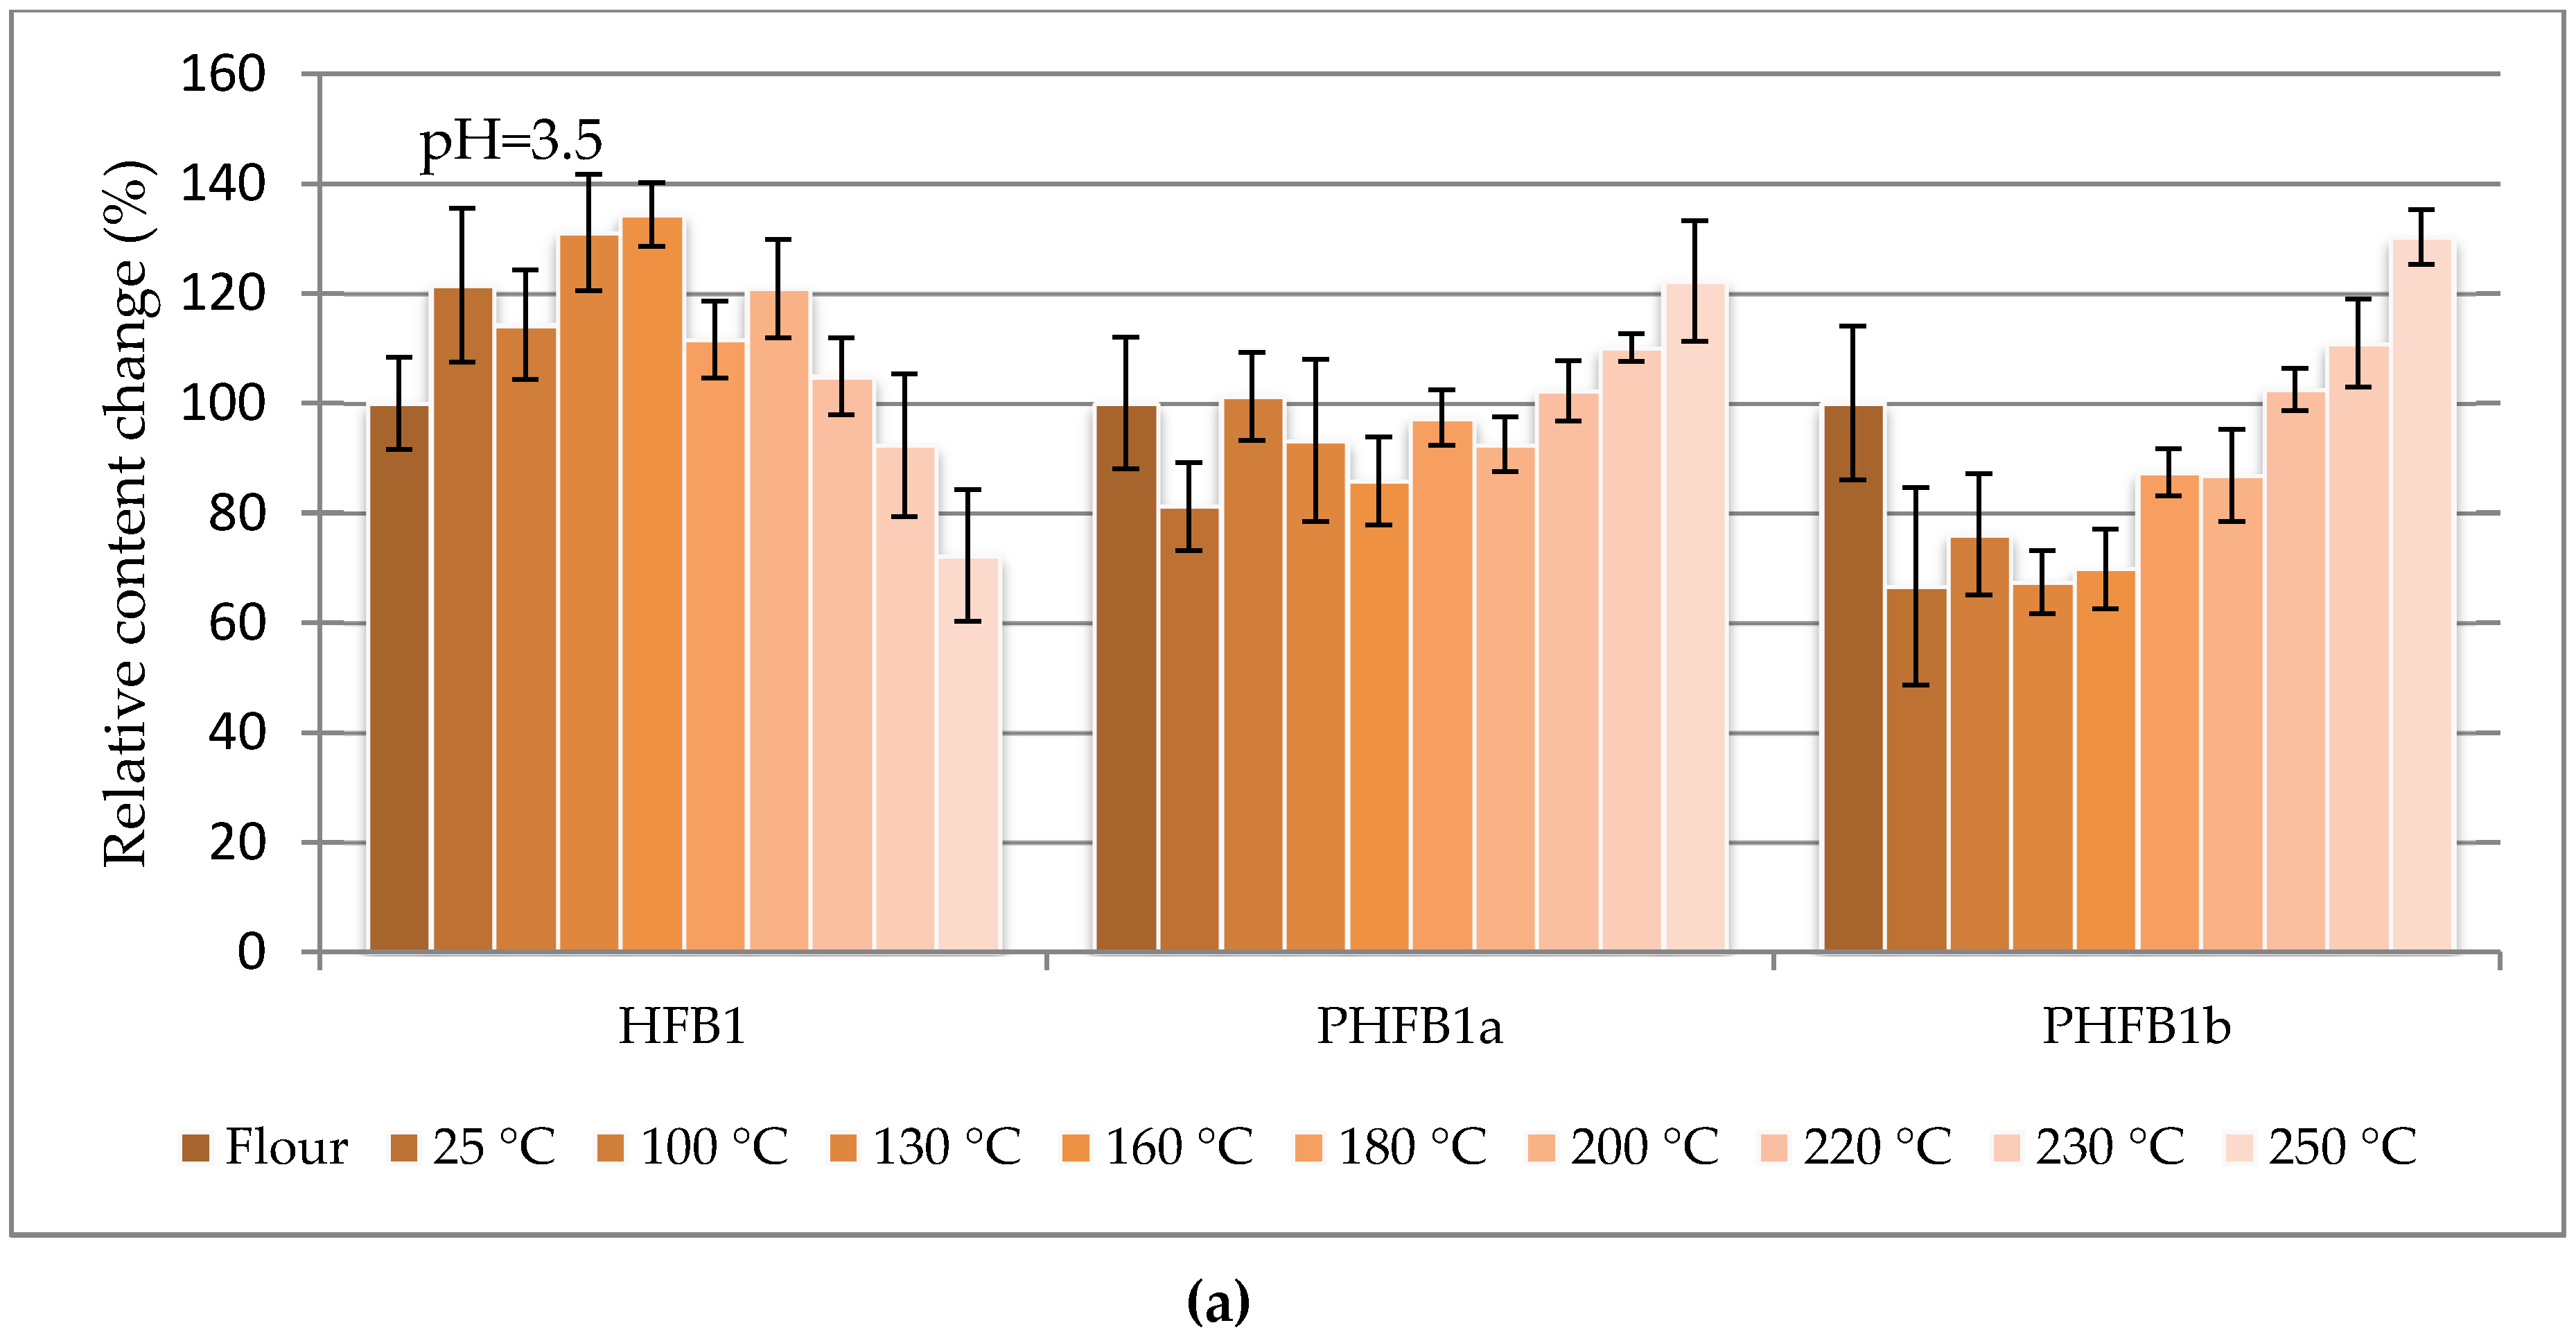
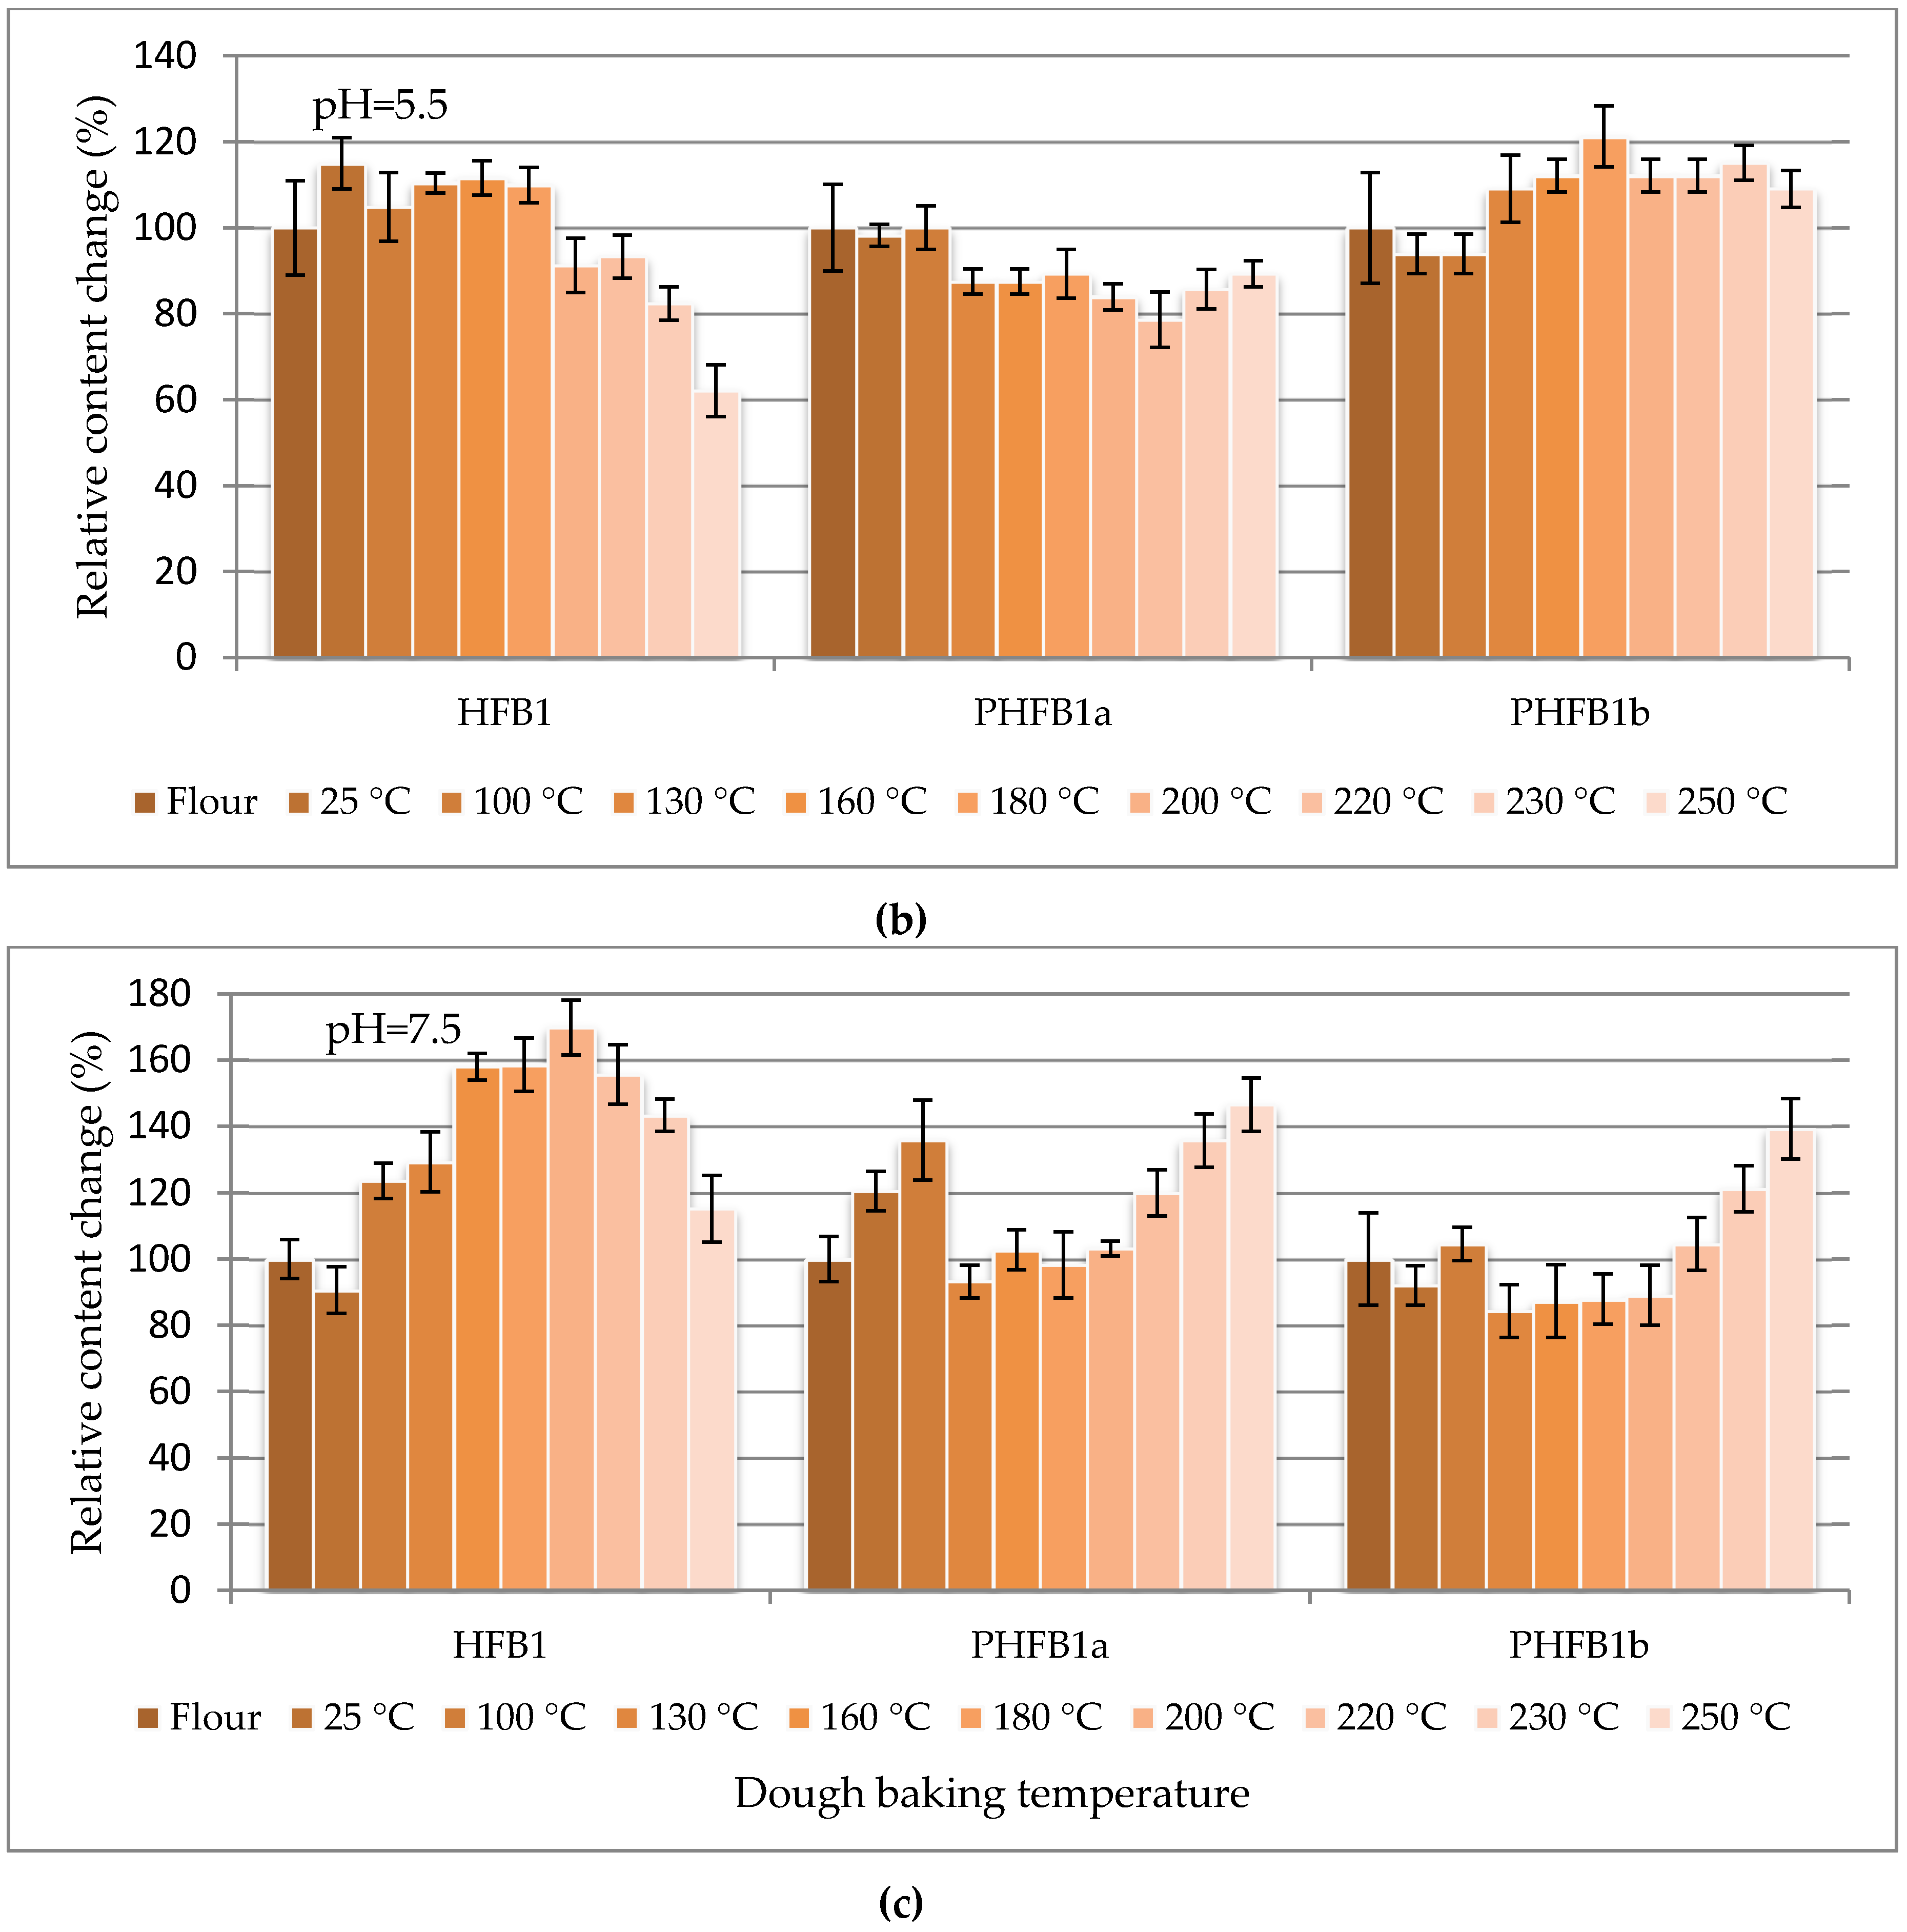
Figure 2 shows the sums of the total fumonisins (three curves for the investigated pH values), and
Figure 3 shows three curves for hydrolysed B
1 fumonisin (HFB
1), partially hydrolysed B
1 fumonisin (isomers a and b: PHFB
1a and PHFB
1b, respectively) charted separately for pH = 3.5 (top), pH = 7.5 (middle) and pH = 5.5 (bottom). The ordinate of the first (flour) data point in each chart is 100% by definition. All other points represent the data for dough starting from room temperature (RT) data charted at 25 °C. The positions of points along the abscissa axis do not represent the baking temperatures.
As seen in
Table 1, the maximum contribution of hidden/bound fumonisins to the total fumonisins did not exceed 20% within the entire range of the investigated dough baking temperatures. In other words, at least 80% of the fumonisins in the analysed maize were in the free form. As can be seen in
Table 1, the concentration of free fumonisins at 25 °C is higher in buffers containing contaminated flour (4542 ± 287; 4346 ± 363; 4230 ± 356 µg·kg
−1, for pH 3.5, 5.5 and 7.5 buffers, respectively) as compared with the concentration of free fumonisins determined directly in the flour (3937 ± 205 µg·kg
−1). Nevertheless, single-variable ANOVA revealed that the total fumonisin concentration was statistically higher than the free fumonisin concentration in dough prepared in pH = 3.5 and pH = 5.5 buffers, while it was not higher in the dough prepared in the pH = 7.5 buffer. Thereby, the hidden-to-free fumonisin concentration ratios turned out to be the lowest for that model (0.03–0.10), while in other cases the averages were within the 0.08–0.25 range. Concentrations of free hydrolysed/partly hydrolysed HFB
1 compounds were calculated from the area of the peak for a given analyte normalized to the area of the
13C-FB
1 peak. As seen in
Figure 1,
Figure 2 and
Figure 3, the thermal stabilities of all the investigated fumonisins in dough prepared in buffers at all of the investigated pH values (except for several HFB
1, PHFB
1a, and PHFB
1b points for dough prepared in the pH = 7.5 buffer) were better than ±40% within the entire range of the investigated dough baking temperatures. In dough prepared in pH = 7.5 buffer, the highest percentage change in content of HFB
1 (reached at a 200 °C baking temperature) was merely 170%. Notwithstanding the above, a slight degradation trend was observed for temperatures higher than approximately 220 °C.
The high thermal stability of free fumonisins has been reported by many authors [
14,
19,
20,
21,
22]. However, practically no data on the thermal stability of hidden, bound, or conjugated forms are available in the literature. A majority of studies conducted several years ago were focussed on the concentration of free fumonisins during food processing. It is widely accepted that the fumonisin concentration noticeably drops during thermal processing involving temperatures above 150 °C [
23,
24,
25,
26]. Bullerman and Bianchini [
19] reported degradation of over 90% of the initial amount of fumonisins after heating at 175 °C for 60 min regardless of pH.
Some authors have demonstrated that the thermal stabilities of fumonisins might well depend on the amount of water in the medium containing the fumonisins, as fumonisins seem to be much more susceptible to destruction in dry environments rather than in wet ones [
20]. Jackson et al. reported a drop of 16%–28% of the initial FB
1 concentration of 5 mg/kg after baking corn muffins at 175–200 °C for 20 min [
21]. The concentration dropped more at the surfaces of the muffins than within their ground tissue. Castelo et al. [
22] reported no reduction of the initial FB
1 concentration of 5 mg/kg after baking corn muffins at 204 °C for 20 min but observed a drop of 48% after baking the muffins at 232 °C. No decrease was observed in another experiment with corn fried at 140–170 °C for 6 min. A decrease of 67% was recorded when frying tortilla chips at 190 °C for 15 min. Avantaggiato et al. [
27] reported a 52%–57% loss of FBs in corn muffins baked at 210 °C for 25 min; each muffin in their experiment was spiked with 15 µg of
14C-FB
1 (synthesized by fungi from 1,2-
14C-sodium acetate) and the FB
1 standard. The study was repeated using maize flour spiked with 1.56 µg of
14C-FB
1 per muffin; the average observed thermal loss amounted to 51%.
Thermal stabilities of fumonisin standards in aqueous buffers were studied by Jackson et al. [
20,
21], who reported that FB
1 and FB
2 were least stable at pH = 4 in comparison to those at pH = 10 and pH = 7. However, in our experiment with maize dough, the results were quite different, as fumonisins were more stable at pH = 5.5 than at pH = 3.5 and pH = 7.5.
There are many suggestions in the literature on how to interpret apparently conflicting observations. Some authors have suggested that heated fumonisins may form covalent bonds with other compounds. Shier et al. [
28] spiked maize flour samples with radioisotope-labelled FB
1, with 37% of the entire added radioactivity found in the baked products. Out of the remaining part, 46% of the compound was recovered from the protein fraction extracted with a dodecyl sulphate solution. Seefelder et al. [
29] in a model experiment showed that heated FB
1 molecules in maize, formed covalent bonds with polysaccharides and proteins by means of their propano-1,2,3-tricarboxyl acid side chains.
More recent papers reported difficulties encountered by analysts trying to determine free fumonisins in maize and/or maize-based food products applying standard analytical methods. Dall’Asta et al. [
9] attempted to determine causes of those difficulties. To that end, fumonisins in five different maize samples were assayed in five independent labs applying various analytical methods (each validated) and different extraction as well as extract purification procedures. The same calibration standards were used in each of the five labs. Despite all the precautions, the results varied. In that situation, the authors believed that the mechanism responsible for the observed disparities involved some supra-molecular interactions of fumonisins with food macroconstituents (proteins and carbohydrates). Such masking behaviour is a kind of physical entrapment found in grain and unprocessed food not subjected to heat treatment [
9,
16,
30]. Heat treatment may induce some compound chemical reactions; thus, it is impractical to separately consider individual fumonisin-masking mechanisms. It may well be that during maize dough baking fumonisins may be liberated from their hidden forms by interacting with food biopolymers either non-covalently or covalently. Both interactions may depend on the pH of the environment.
The single-variable ANOVA applied to our data revealed that concentrations of total fumonisins and free fumonisins in dough prepared in the pH = 7.5 buffer did not differ statistically (i.e., the concentration of hidden/bound fumonisins was very low). This may result from the weak stability of hidden fumonisins under such conditions and/or from conditions unfavourable for the formation of covalent bonds. Results published by Jaksić et al. [
31], Pietri and Bertuzzi [
32] and Bertuzzi et al. [
33] suggest a reasonable hypothesis as to why the concentration of free fumonisins is higher in pH 7.5 buffer. The phosphate buffer used to prepare dough influenced extraction of free fumonisins from the analysed samples, as indicated by the observed free-to-total fumonisin concentration ratios, which practically in all cases were lower than 0.25, the value found directly in flour. The effect was best visible for samples heated in the pH 7.5 buffer. Pietri and Bertuzzi 2012 [
32] compared conventional extraction techniques based on mixtures of water (or a phosphate buffer) with organic solvents (methanol, acetonitrile, a mixture of both) with techniques based on phosphate buffers alone. It was shown that the highest extraction efficiency was obtained with phosphate buffers at pH 7.5 [
32]. A relatively higher efficiency of free fumonisin extraction from dough may be observed in pH 7.5 buffers. Even if concentrations found for individual buffer pHs (3.5, 5.5, 7.5) were comparable (for respective baking temperatures), no significant differences between concentrations of free and total fumonisins were observed for the pH 7.5 buffer only. The latter observation seems to confirm suggestions made by other researchers, an opinion shared by the authors of this study, that fumonisins are more efficiently extracted in pH environments of 7.5. Based on the pKa values for TCA (3.49, 4.58 and 5.83) and the pKa value for the amino group (which should exceed 9), one can speculate that fumonisins might be “hermaphrodites” within the pH 6.0–9.0 range due to the transfer of a proton from their carboxylate group towards their amino group. It follows that fumonisin functional groups should be more soluble in water within that pH range [
32]. Additionally, in alkaline environments, fumonisins may be hydrolysed to forms without one or both TCA groups. It may well be that the intensity of fumonisin hydrolysis increases with the pH of the environment (see the HFB
1 relative concentrations in
Figure 3 bottom compared to the top and middle). Results obtained in this study show that fumonisins degrade preferentially in pH 7.5 buffers (as compared to other models) due to an increased concentration of hydrolysed/partly hydrolysed fumonisins. As can be seen in
Figure 3, only the percentage change in content of free HFB
1 decreased at temperatures above 200 °C, which may be interpreted as initiation of HFB
1 degradation reactions above that temperature. A decrease of free HFB
1 concentration with a simultaneous increase of partly hydrolysed forms may indicate that the fumonisin thermal degradation path is in the first stage based on the degradation of fumonisins to partly hydrolysed forms, then to entirely hydrolysed forms. Degradation of free hydrolysed forms is the final stage.
To produce tortillas, maize is cooked in lime water (the nixtamalization process). Hamner and Tinker [
34] showed that both HFBs and PHFBs may be released during that process. Additionally, De Girolamo et al. [
1] reported an increase of the HFB/PHFB concentration during the process with a simultaneous drop in the free fumonisin concentration by as much as 80%.
Our results concerning the levels of free fumonisins in maize are generally in line with the literature data, in contrast to the results concerning fumonisin thermal stability. Possible causes for the disparity include the dough preparation method, dough baking time and possible dough additives (simple sugars that may facilitate non-enzymatic Maillard’s reaction consisting of the binding of the fumonisin amino group with sugar carbonyl groups). Products of the reaction, such as
N-(carboxyl-methyl)-FB
1 or
N-(deoxy-
d-fructos-1-yl)-FB
1 were also identified in heated food [
35]. Newly-discovered analogues 1-(deoxy-fructos-1-yl)-FB
2 and 1-(deoxy-fructos-1-yl)-FB
3 also belong to that group [
36]. Their
N-alkyl bonds are not susceptible to either chemical or enzymatic hydrolysis; therefore, the total concentration of fumonisins may apparently decrease during food processing.
3. Conclusions
Stability of fumonisins was evaluated when baking maize flour dough prepared in three phosphate buffers: pH 3.5 (model 1), 5.5 (model 2), and pH 7.5 (model 3). The dough was baked for 25 min at various temperatures within the 25–250 °C range. Generally, fumonisins in maize dough baked at temperatures up to 250 °C were stable. Their concentration did not change by more than ±40% within the entire temperature range, except for a few HFB1/PHFB1a/PHFB1b points for dough prepared in the pH = 7.5 buffer. A slight degradation trend was observed above 220 °C. The largest change to 170% was noted for HFB1 in dough prepared in the pH = 7.5 buffer, and that maximum was reached at 200 °C, then HFB1 concentration decreased. That may suggest the following fumonisin degradation mechanism: first TCA groups are removed from the molecule, then the HFB1 molecule disintegrates.
Among the three investigated buffer pH values in which the dough was prepared (3.5, 5.5, and 7.5), the thermal stability was highest at pH = 5.5. At that latter pH, within the entire range of the investigated baking temperatures, the concentration of the free forms stayed within the +18/−9% range, the total concentration stayed within the +8/−11% range, and the HFB1 concentration stayed within the +1/−23% range.
The maximum contribution of hidden/bound fumonisins to the total fumonisins did not exceed 20% within the entire range of the investigated dough baking temperatures. In other words, at least 80% of the fumonisins in the analysed maize were found in the free form. Nevertheless, single-variable ANOVA revealed that the total fumonisin concentration was statistically higher than the free fumonisin concentration in dough prepared in pH = 3.5 and pH = 5.5 buffers, while it was not in dough prepared in the pH = 7.5 buffer. The reason is a low average value of the hidden and bound to free fumonisin ratios in those samples (0.03–0.10), when compared to a larger ratio for other models (0.08–0.25). Probably, it reflects a larger solubility of fumonisins in the pH 7.5 buffer, and consequently a larger extraction of the analytes from the samples. That is in agreement with data available in the literature.
It seems that thermal processing up to 250 °C practically does not degrade fumonisins in maize. Rather, the structure of fumonisin molecules may change into partially hydrolysed forms, which may influence living organisms similarly to free forms.
4. Experimental Section
4.1. Reagents and Other Chemicals
High-purity mycotoxin standards supplied by Romer Labs (Tulln, Austria) included the following: 50 µg·mL−1 FB1; 50 µg·mL−1 FB2; 50 µg·mL−1 FB3; 25 µg·mL−1 13C-labelled FB1 (13C-FB1); 10 µg·mL−1 13C-FB2; and 10 µg·mL−1 13C-FB3. All supplied standards were dissolved in a 1:1 acetonitrile:water mixture.
HPLC-grade methanol, acetonitrile and dichloromethane were purchased from Rathburn Chemicals Ltd. (Walkerburn, UK). Analytical-grade acetic acid, formic acid and potassium hydroxide were obtained from POCh (Gliwice, Poland). The Chromasolv LC-MS-grade water was purchased from Fluka (Buchs, Switzerland). Samples were filtered through 0.2-µm mesh, 4-mm-diameter nylon syringe filters purchased from Phenomenex (Torrance, CA, USA).
4.2. Buffers
Phosphate buffers with pH values of 3.5, 5.5, and 7.5 were used. The two former buffers were prepared based on a 0.1 M solution of disodium phosphate, while the latter was prepared based on a 0.1 M solution of sodium phosphate. Ortho-phosphoric acid (2%) was added until the required pH was obtained (in the presence of an electrode in the two former cases). The pH was controlled with the help of a CPC-505 pH meter manufactured by Elmetron (Zabrze, Poland).
4.3. LC-MS Instrument
An Acquity H-Class high-performance liquid chromatograph coupled to an LCQ Premiere XE high resolution time-of-flight mass spectrometer (Waters, Milford, MA, USA) was used as the analytical instrument. Analytes were separated on a UPLC C18 Cortecs chromatographic column (2.1 × 100 mm, 1.6 µm; Waters, Milford, MA, USA) with a pre-column at its front. The mobile phase was composed of methanol and water. Both phases contained 0.2% formic acid, while phase B additionally contained 2 mM ammonium formate. The flow rate was 0.4 mL/min. The following gradient was used: 1%–50% A from 0 to 8 min; 50%–95% A from 8 to 11 min; constant 95% A from 11 to 22 min; 95%–1% A from 22 to 22.6 min; and constant 1% A from 22.6 to 27 min. Samples of 2.5 μL were injected onto the column. The mass spectrometer was operated in the positive electrospray ionization mode (ESI). The ion source and desolvation temperatures were 150 °C and 350 °C, respectively. The nebulizing gas (nitrogen) flow rate was 750 L/min and the cone gas flow rate was 20 L/min. The capillary voltage was 3000 V. The V mode of the ion optics was used. The mass spectrometer was calibrated using a standard solution of leu-enkefalin. The following precursor (M + H)+ ions (m/z) were registered for individual analytes: FB1, 722.4; 13C-FB1, 756.5; FB2 and FB3, 706.4; 13C-FB2 and 13C-FB3, 740.5; HFB1, 406.4; PHFB1a and b, 564.4; PHFB2a and b and PHFB3a and b, 548.4; 13C-HFB1, 428.5; HFB2 and HFB3, 390.4; and 13C-HFB2 and 13C-HFB3, 512.5.
4.4. Other Used Apparatuses
In the experiments, the following apparatuses were used: a Hydrolab two-stage reverse osmosis water purification system with ion exchange resin (Wiślina, Poland); an IKA-RV-10 rotary vacuum evaporator (Staufen, Germany); a WŻ-1S impact mill (ZBPP, Bydgoszcz, Poland); a Diax 900 homogenizer (Heidolph, Schwabach, Germany); an MLU-202 grist mill (Bühler GmbH, Uzwil, Switzerland); and an MR-2L grain/flour mixer (Chopin Technologies, Villeneuve-la-Garenne, France).
4.5. The Studied Material
Maize naturally polluted with fumonisins was studied. The grain supplied by the Silesian Grain Company was milled in a grist mill. The milled cereal was screened on 1000-µm mesh screens. Five hundred grams of flour and 350 mL of a respective buffer were mixed into dough. The kneaded dough was formed into small pieces using Petri dishes (60 mm diameter, 12 mm high). Separate samples were prepared for each studied pH value (3.5, 5.5, and 7.5) and at each baking temperature (100, 130, 160, 180, 200, 230 and 250 °C). The dough was baked in a convection/drill oven for 25 min after the required temperature was reached. The loss of mass was recorded after baking. Next, the batch was disintegrated using an impact mill. The obtained powder was stored in a freezer at a temperature below –20 °C. The material for the control samples was baked under identical conditions but it was made from flour not polluted with fumonisins.
4.6. Sample Preparation
The detailed sample preparation procedure was previously described by Bryła et al. [
37].
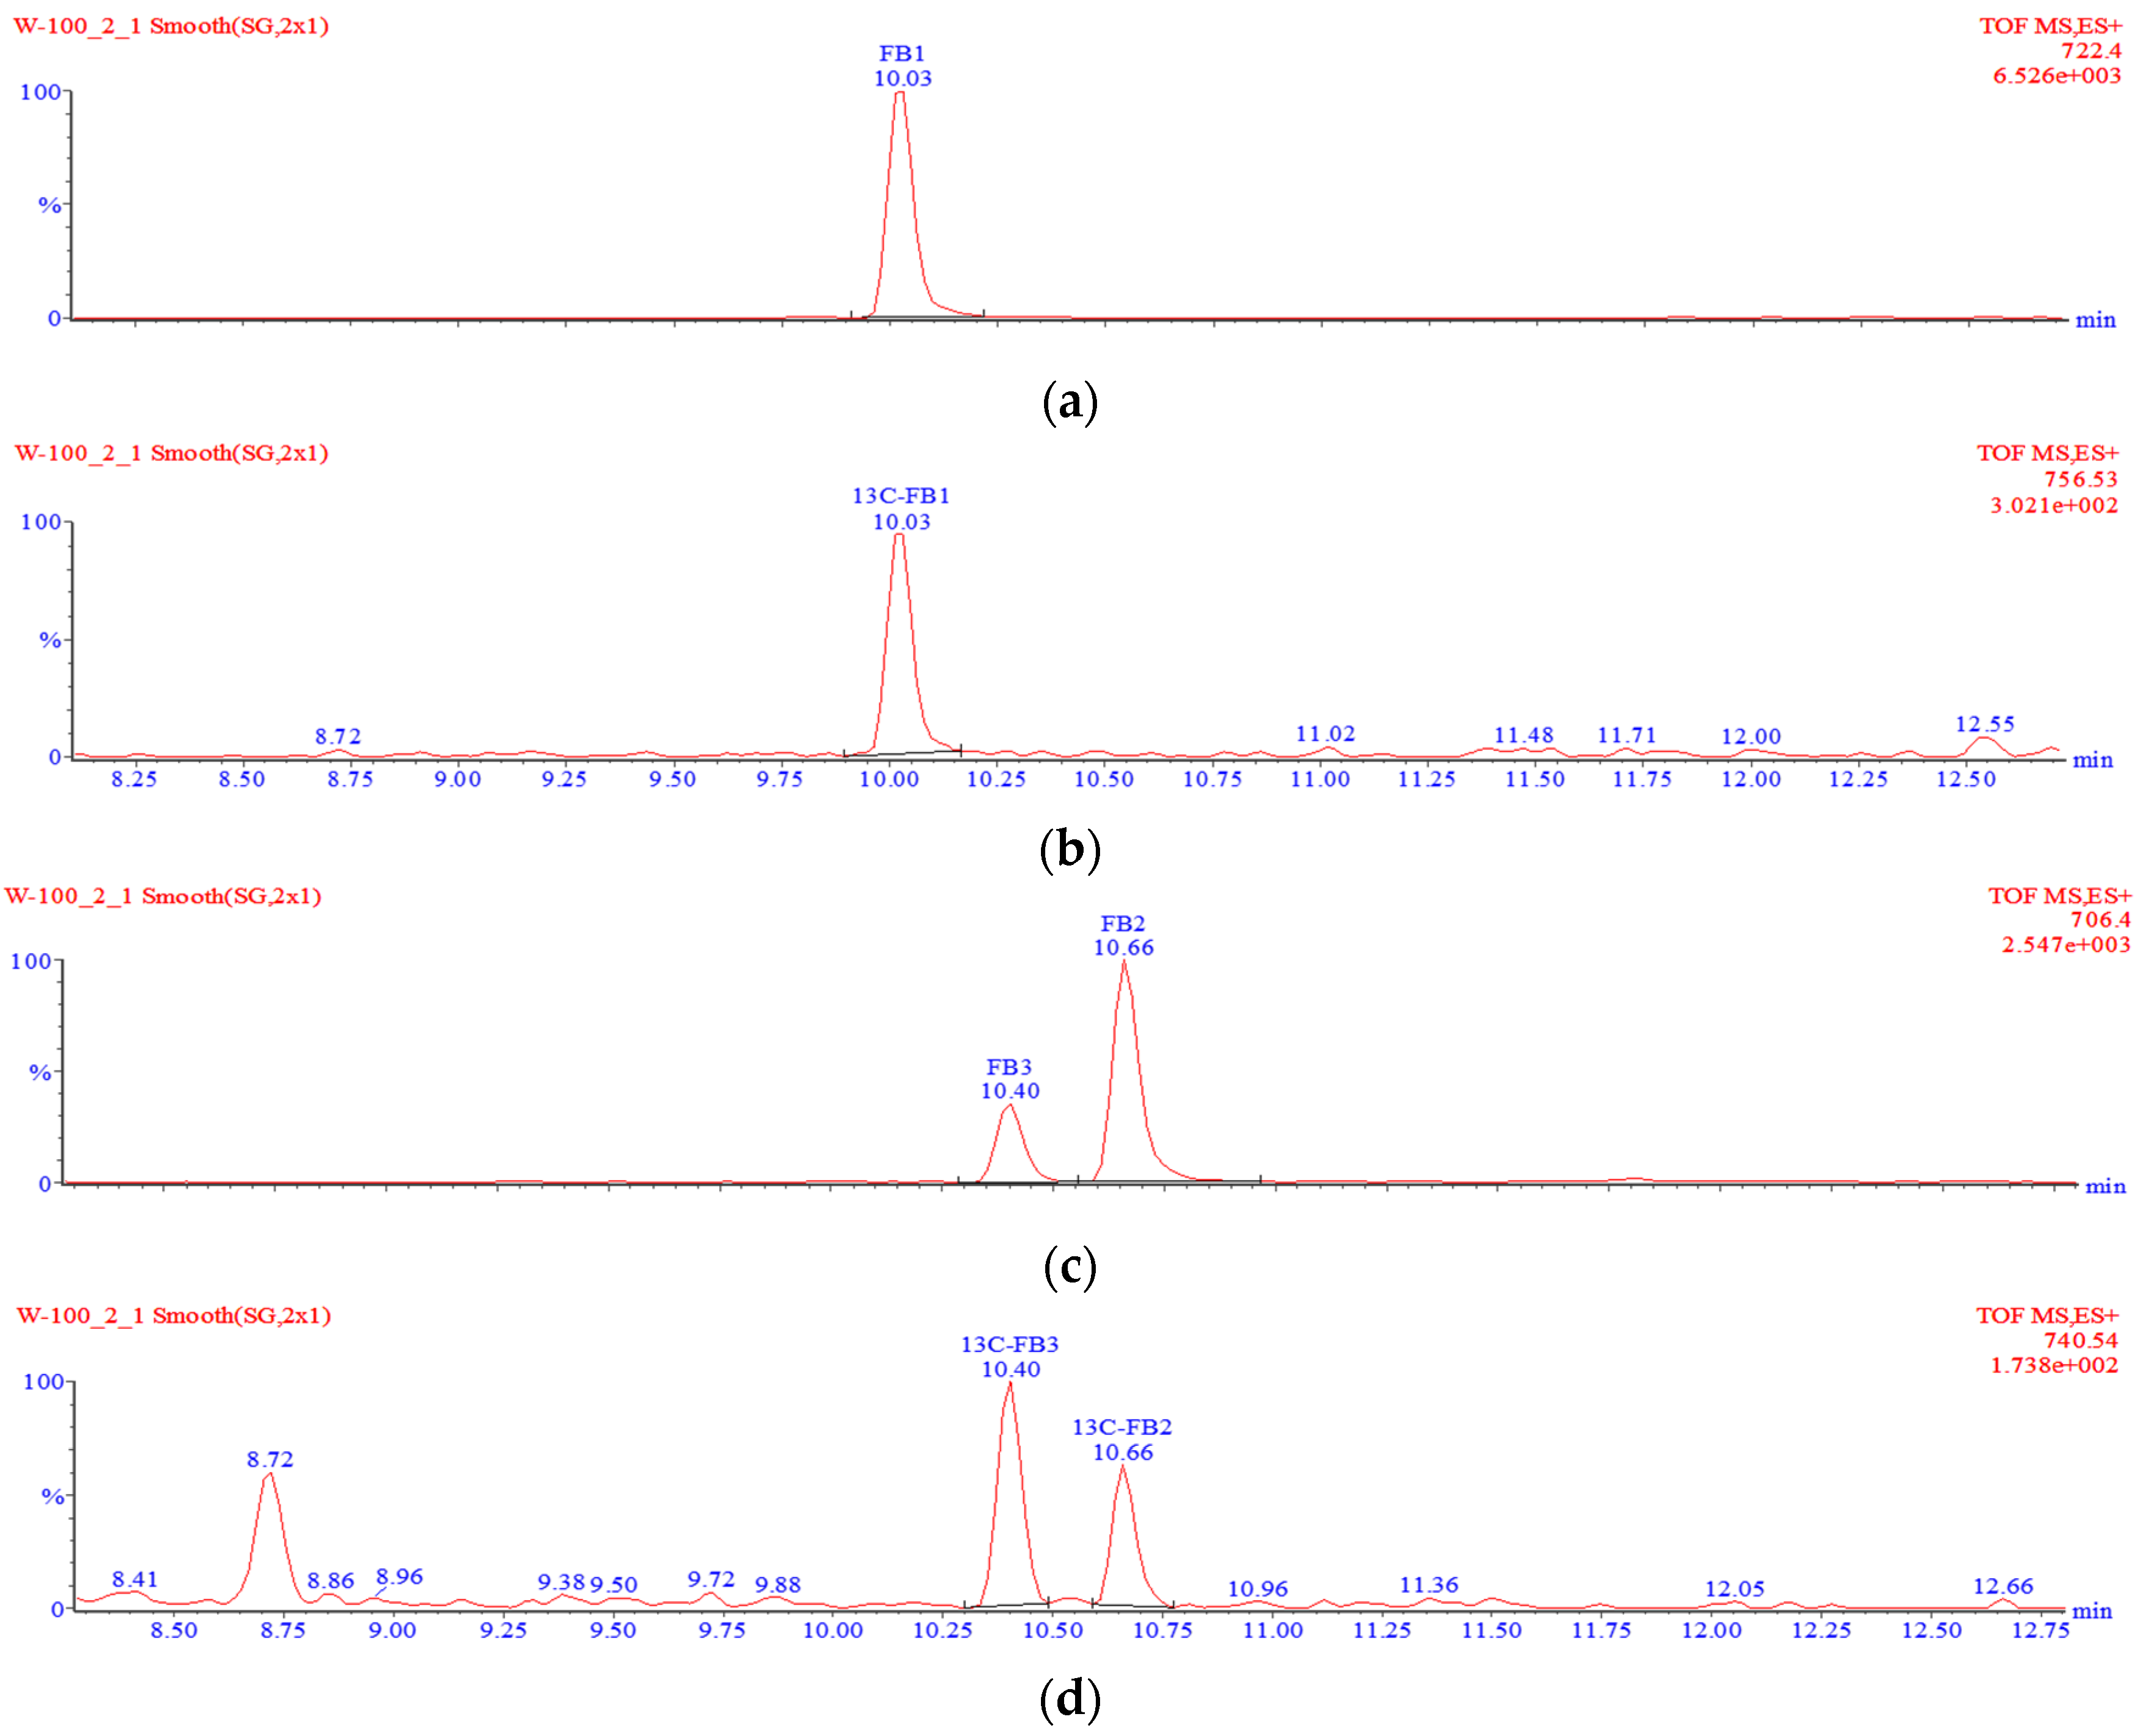
4.6.1. Free FBs
A 1.25-g well-ground sample was transferred into a 50-mL beaker, spiked with 10 µL of the
13C-FB
1/
13C-FB
2/
13C-FB
3 internal standard solution, and homogenized with 10 mL of methanol:acetonitrile:water solution (25:25:50
V/
V/
V) for 3 min to extract the analytes. The extract was transferred into a 15 mL PP centrifuge tube and centrifuged at 10,730×
g. Two millilitres of the supernatant were transferred into a round bottom flask and evaporated to dryness using a rotary evaporator. The dry residue was re-dissolved in 1 mL of a 30:70 methanol:water mixture and sonicated in an ultrasound bath. The solution was filtered through a 0.2-µm nylon syringe filter and transferred into some glass vials, followed by analysis with the liquid chromatography–time-of-flight mass spectrometry–high resolution mass spectrometry (LC-TOF-MS) system. A typical chromatogram showing the separation of free fumonisins is shown in
Figure 4.
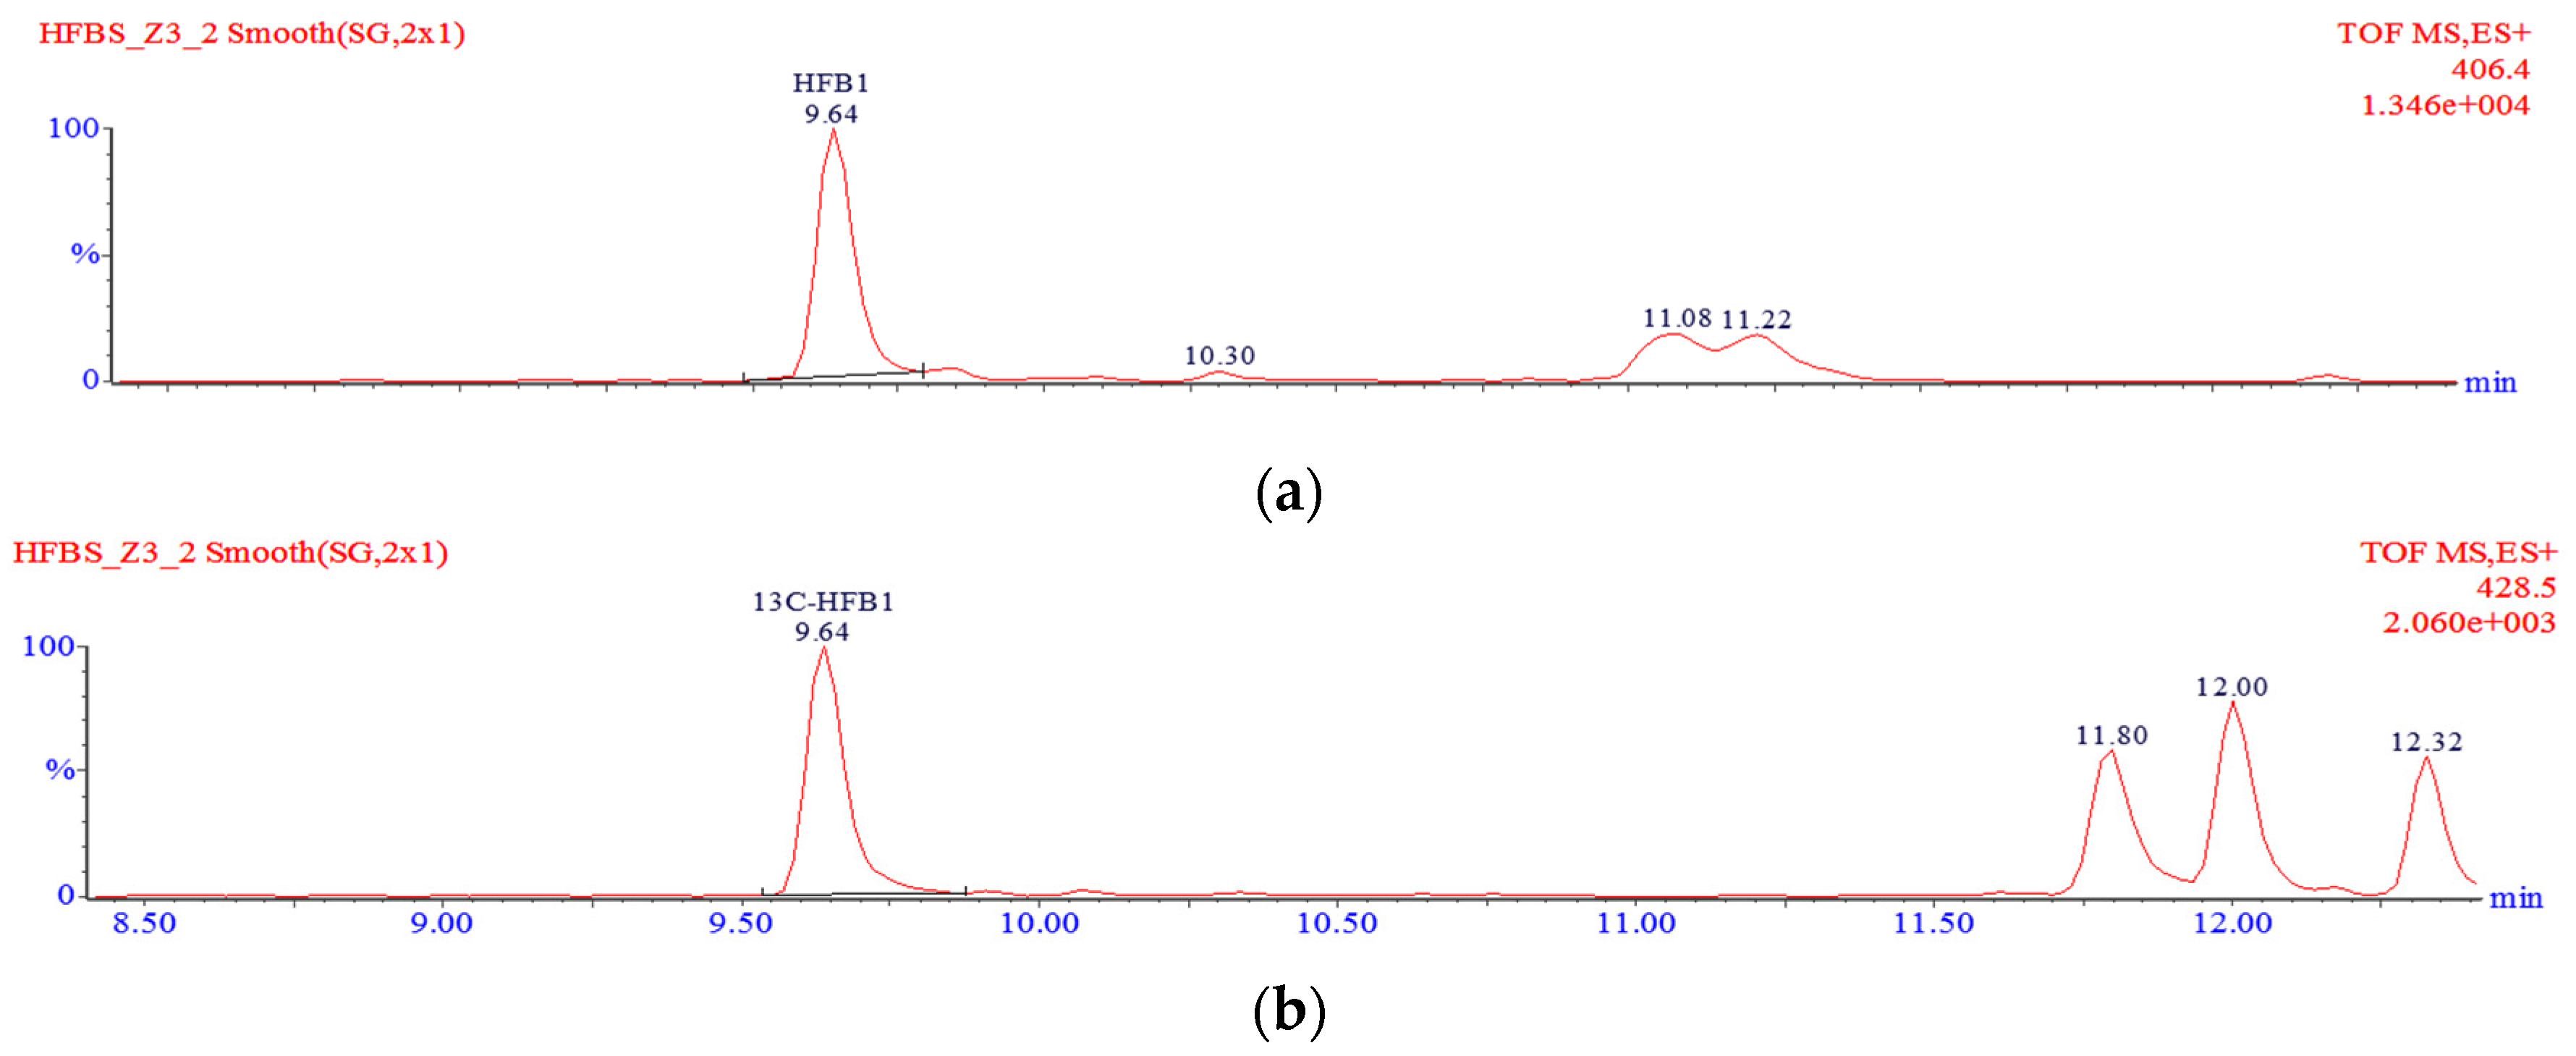
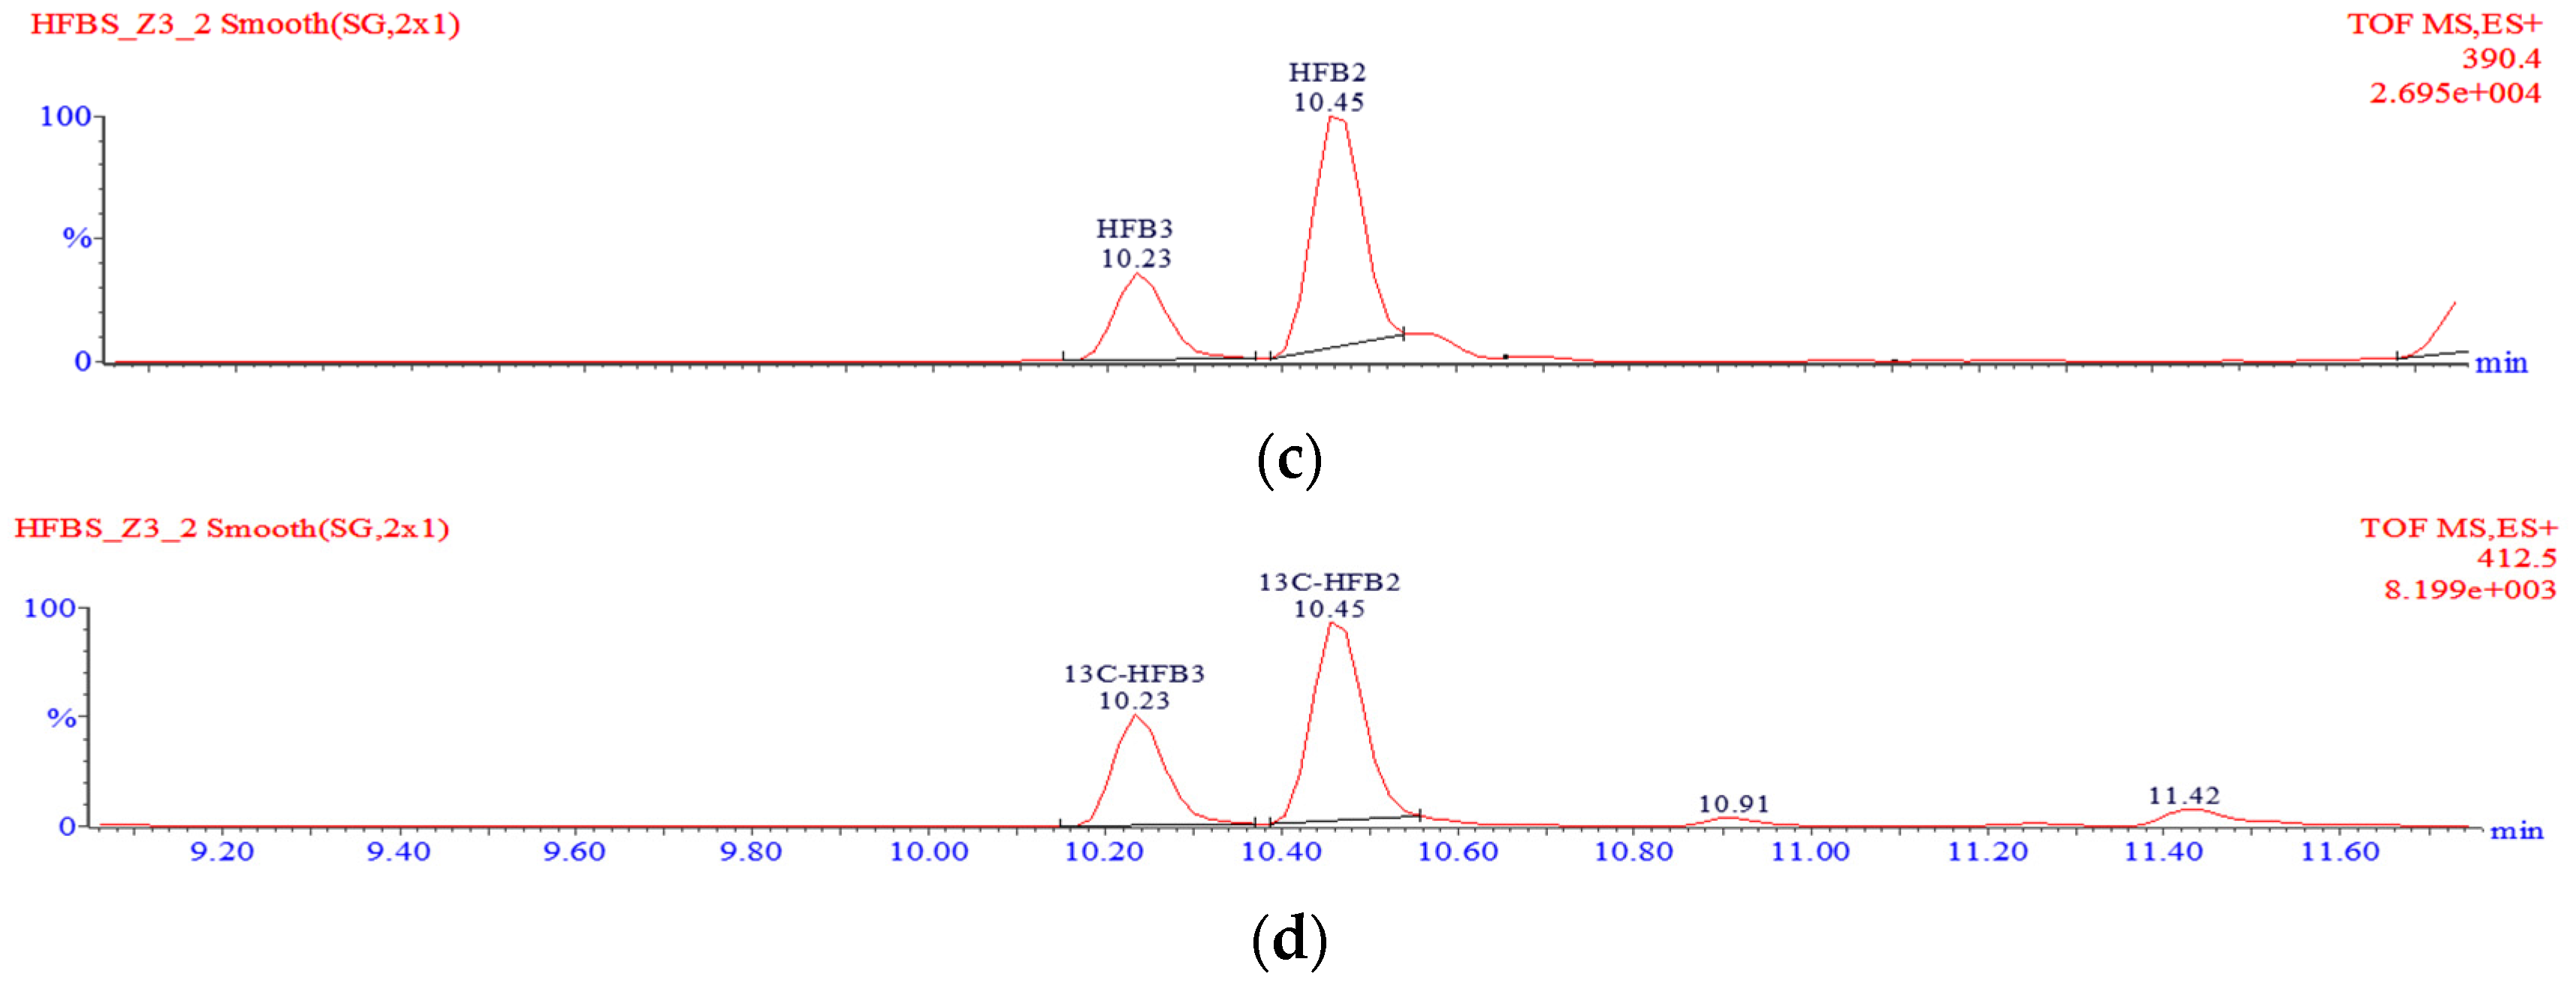
4.6.2. Hydrolysed FBs
A well-ground sample (0.5 g) was transferred into a PP centrifuge tube and spiked with 10 µL of the
13C-FB
1/
13C-FB
2/
13C-FB
3 internal standard solution. Ten millilitres of a 2 M KOH solution were added, and the tube contents were hydrolysed at room temperature for 24 h. The solution was shaken with 12.5 mL of dichloromethane and centrifuged at 10,730×
g. Five millilitres of the organic extract were transferred into a round bottom flask and evaporated to dryness using a rotary evaporator operated at 40 °C. Dry residues were dissolved in 1 mL of a methanol-water mixture (30:70
v/
v), filtered through a 0.2-µm nylon syringe filter, transferred into some glass vials and analysed using the LC-TOF-MS system. A typical chromatogram showing the separation of hydrolysed fumonisins is shown in
Figure 5.
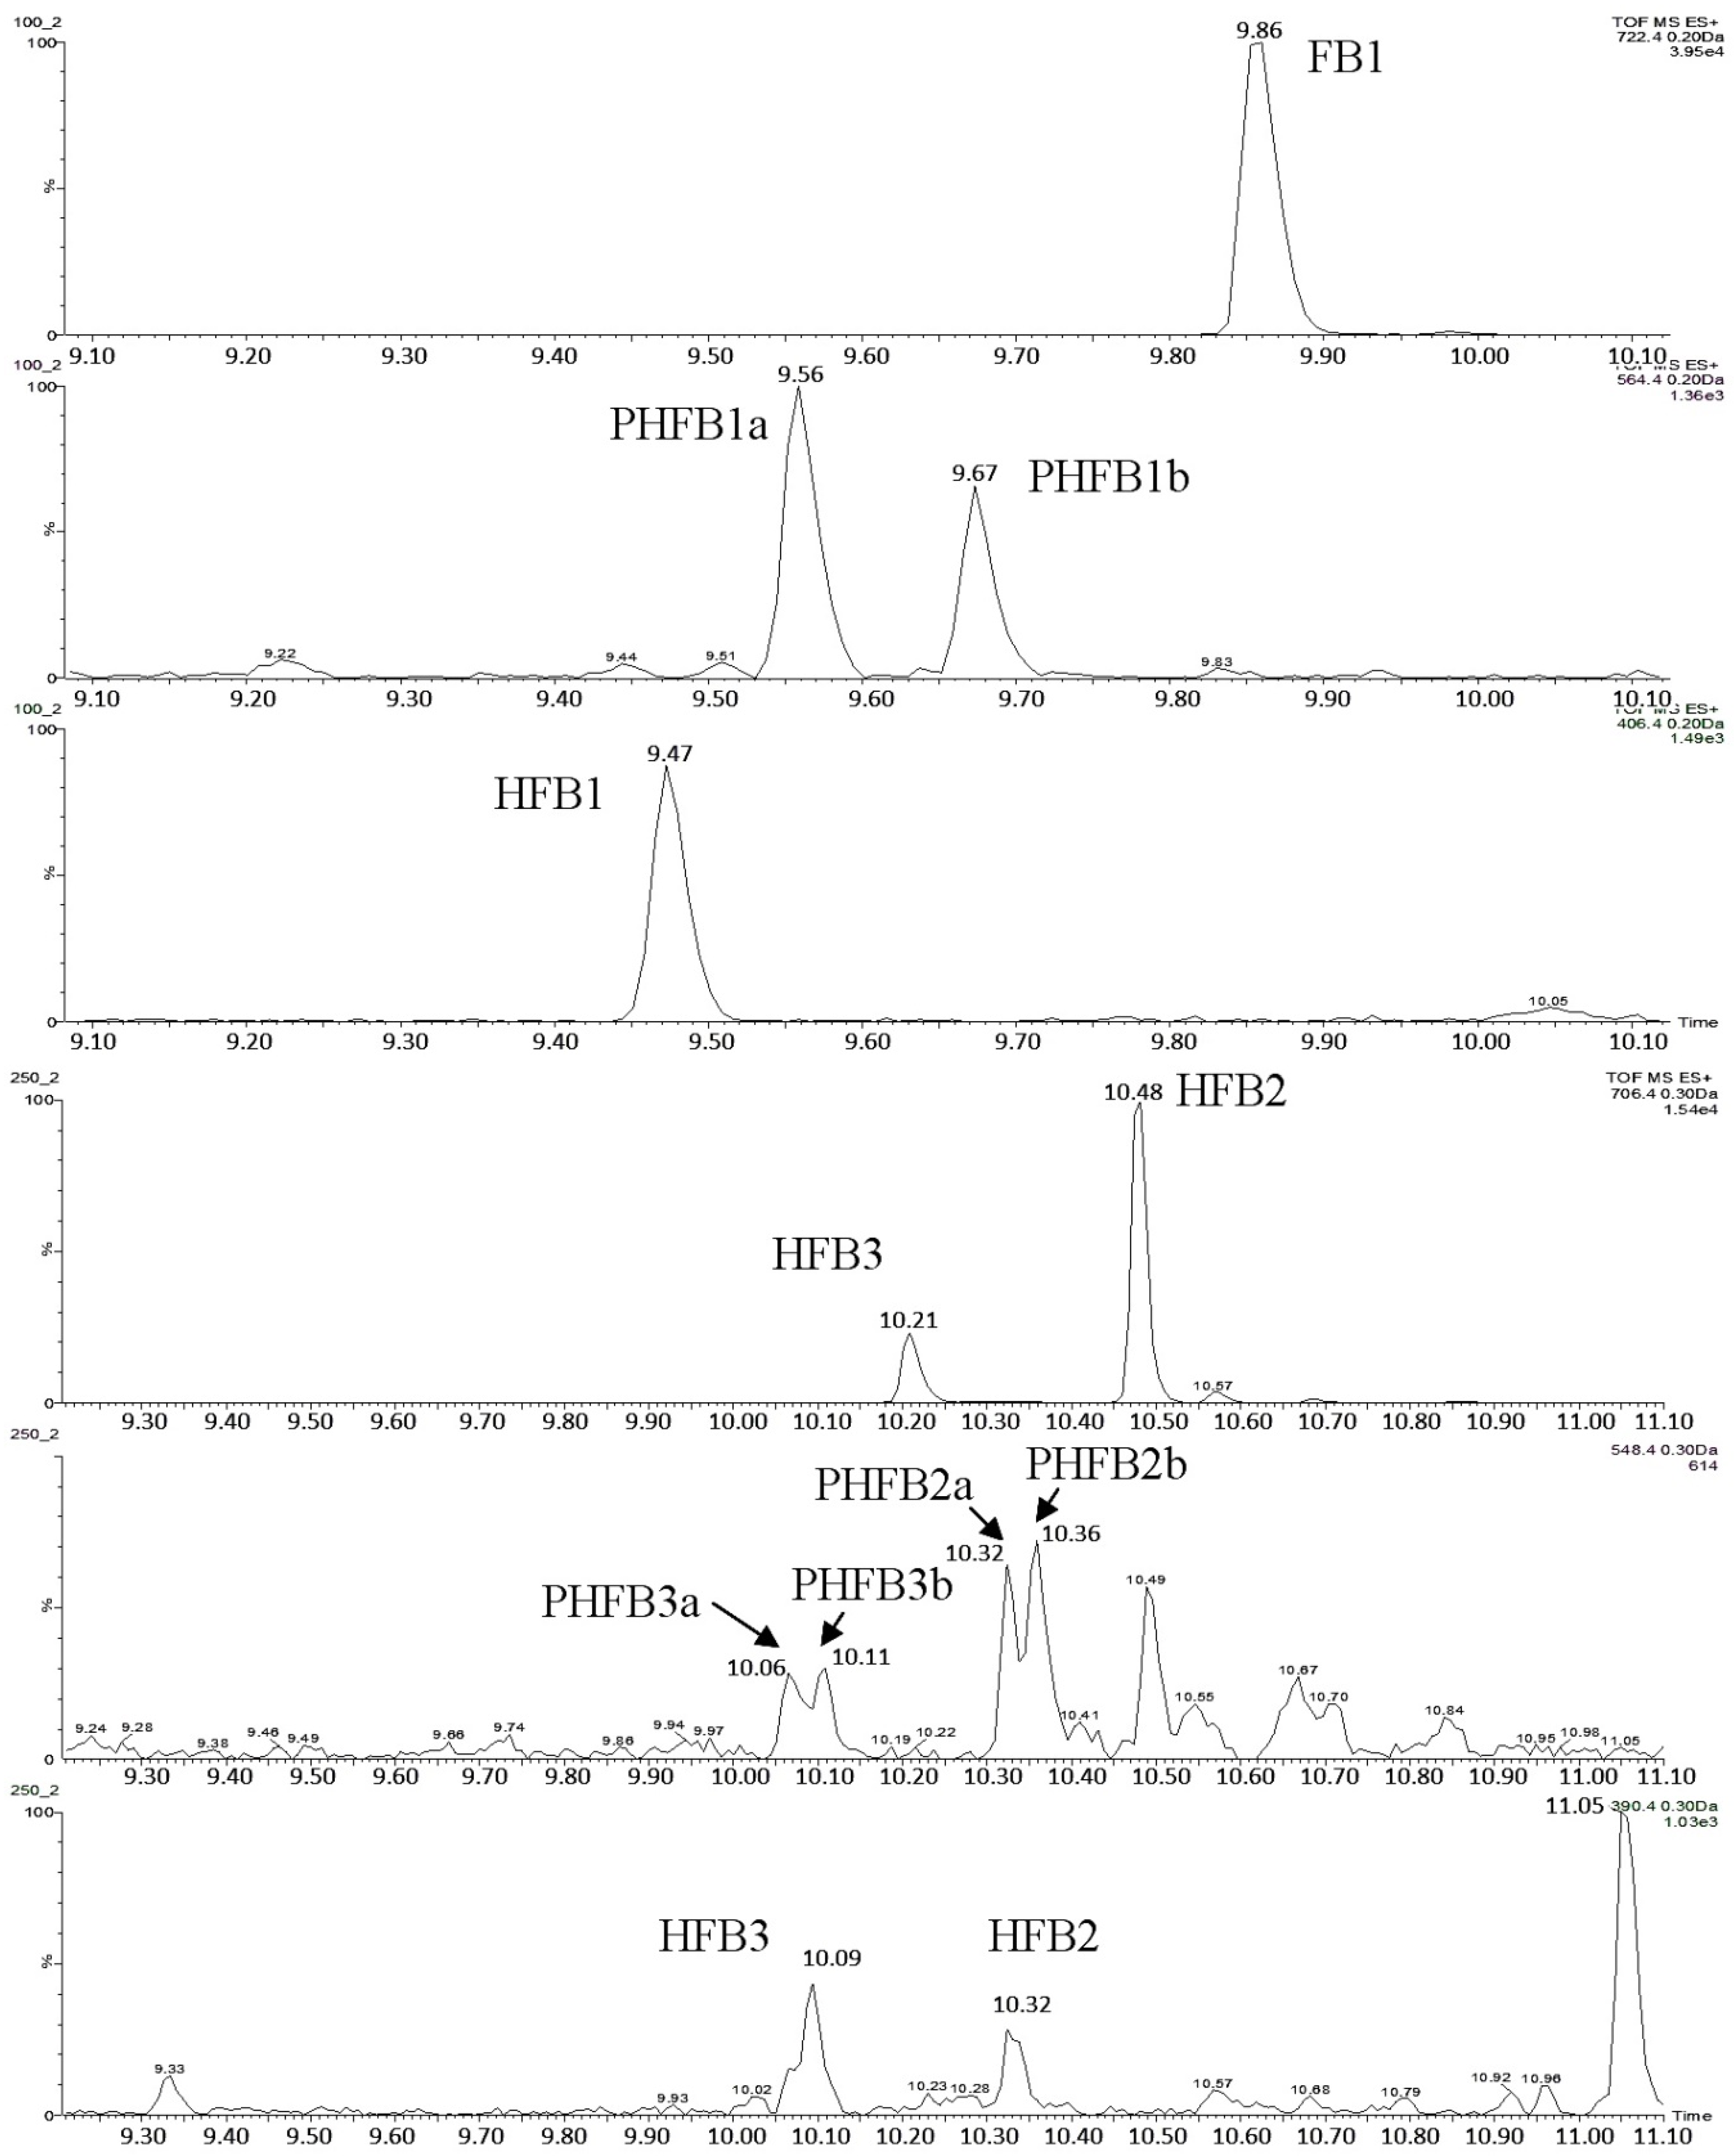
If one of the two TCA groups in hydrolysed fumonisin is missing, the molecule is referred to as “partially hydrolysed fumonisin”. Depending on the location of the remaining TCA group, the molecules in question may produce two separate peaks in chromatograms (
Figure 6). Such partially hydrolysed fumonisins are hereafter referred to as PHFB
1a or PHFB
1b, PHFB
2a or PHFB
2b, and PHFB
3a or PHFB
3b, respectively.
4.7. Calculations and Presentation of the Results
All concentrations were determined against calibration curves taken by measurements of internal 13C-labelled standards. The determined HFB1, HFB2 and HFB3 concentrations were re-calculated into the concentration of free fumonisins taking into account the following HFB/FB molecular mass ratios: 0.56 for FB1 and 0.55 for FB2 as well as FB3. The concentration of hidden/bound FBs was determined as the difference between the total FBs and free FBs.
4.8. Data Analysis
Statistical data were evaluated using the Statgraphics 4.1 Plus software package (StatPoint Technologies, Inc., Warrenton, VA, USA). One-way ANOVA (analysis of variance) was used to assess the significance of the differences between the determined fumonisin concentrations at the statistical significance level of α = 0.05. All results belonging to a statistically homologous group are marked in figures with the same letter.
4.9. Calibration Standards
Standard solutions of FB1/FB2/FB3 fumonisins were dissolved in an extract from a non-polluted sample (to take care of any matrix effects that otherwise might bias the results of the analyses of polluted samples). Calibration curves were made from measurements of a mixture of FB1/FB2/FB3 standard solutions each at a concentration of 5 µg·mL−1. Different volumes (2.5, 5, 10, 40, 80, 160, and 240 µL) of the mixture were transferred into 25-mL round bottom flasks containing extract without the solvent, which was removed earlier in a vacuum evaporator. 13C-labelled internal standards were also added to the flask in volumes corresponding to the volumes used in analyses of unknown samples, i.e., 2 µL each. The solvent was removed from the internal standard solutions in a vacuum evaporator, and the dry mass was dissolved in 1 mL of a methanol–water (30:70) mixture. The final concentrations of the analytes were 50, 100, 200, 400, 800, 1600, and 2400 µg·kg−1, respectively.
Standard solutions of HFB1, HFB2, and HFB3 hydrolysed fumonisins were prepared from 5 µg·mL−1 fumonisin standards. Eight 0.5-g portions of a non-polluted sample were transferred into eight glass test tubes and mixed with 10 µL of each of the internal standard solutions (of the same concentration as that used in the analyses of unknown samples). Then, 4, 25, 75, 150, 300, 450, 600, and 900 µL samples of the FB1/FB2/FB3 standard solution were added to individual tubes. Ten millilitres of a 2 M KOH solution was added to each tube, and the tube contents were hydrolysed at RT for 24 h. Subsequent steps were identical as in the procedure to prepare unknown samples. Samples fortified in order to determine the method recovery rate, unknown samples, and calibration standards were prepared simultaneously to keep the hydrolysis conditions (temperature and time) as identical as possible. The final concentrations of analytes (hydrolysis taken into account) were 22, 140, 420, 840, 1680, 2520, 3360, and 5040 µg·kg−1, respectively, for HFB1 and 22, 138, 413, 825, 1650, 2475, 3300, and 4950 µg·kg−1, respectively, for HFB2 and/or HFB3.
4.10. Validation Experiments
Performance of the applied analytical method was evaluated in validation experiments, in which samples of ground maize grain originally free of fumonisins (i.e., samples in which the concentration of fumonisins was below the limit of detection) were fortified with known amounts of individual analytes and then analysed to determine the limit of quantification (LOQ), linear range, recovery (R), and repeatability/precision (characterized by the relative standard deviation, RSD). The following three fortification levels were used: 200, 400, and 600 µg·kg
−1 for FB
1, FB
2, and FB
3; 420, 840, and 1680 µg·kg
−1 for HFB
1; and 413, 765, and 1650 µg·kg
−1 for HFB
2 and HFB
3. Each sample was analysed in triplicate. Characteristic parameters of the applied analytical method are shown in
Table 2.


