Polarizability-Dependent Sorting of Microparticles Using Continuous-Flow Dielectrophoretic Chromatography with a Frequency Modulation Method

 , , , and
Abstract
:
1. Introduction
2. Method
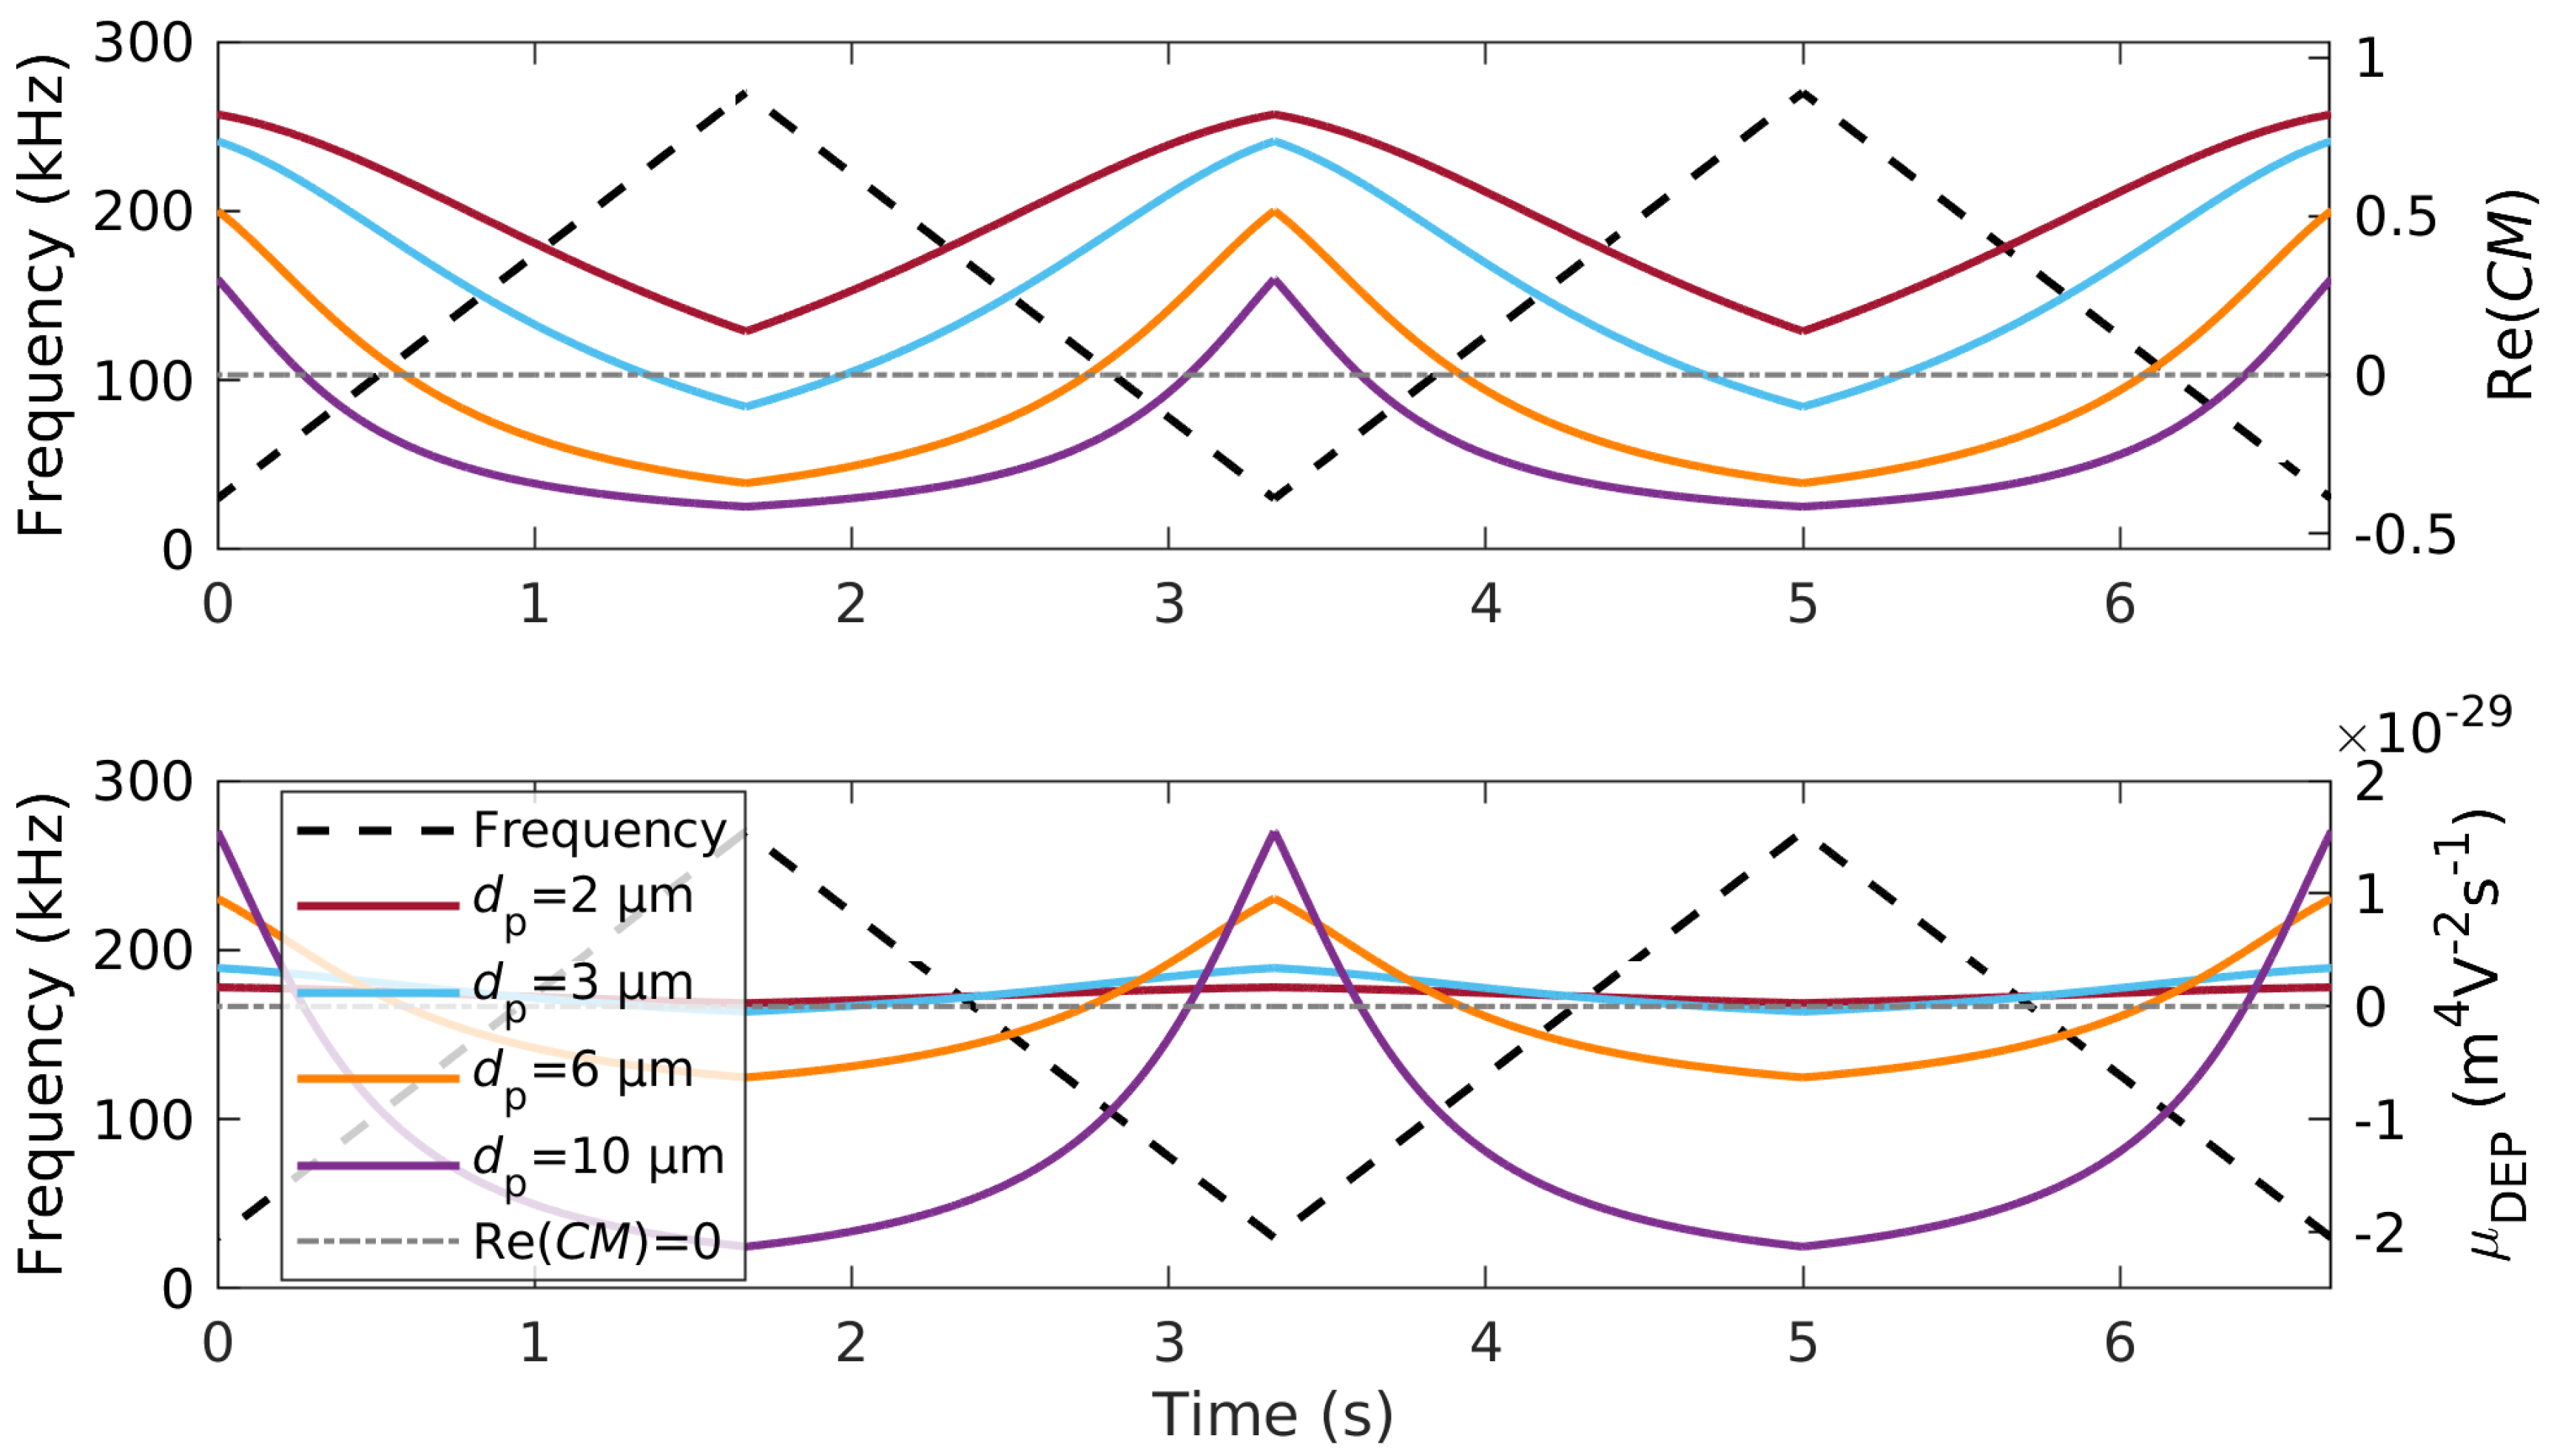
2.1. Theory
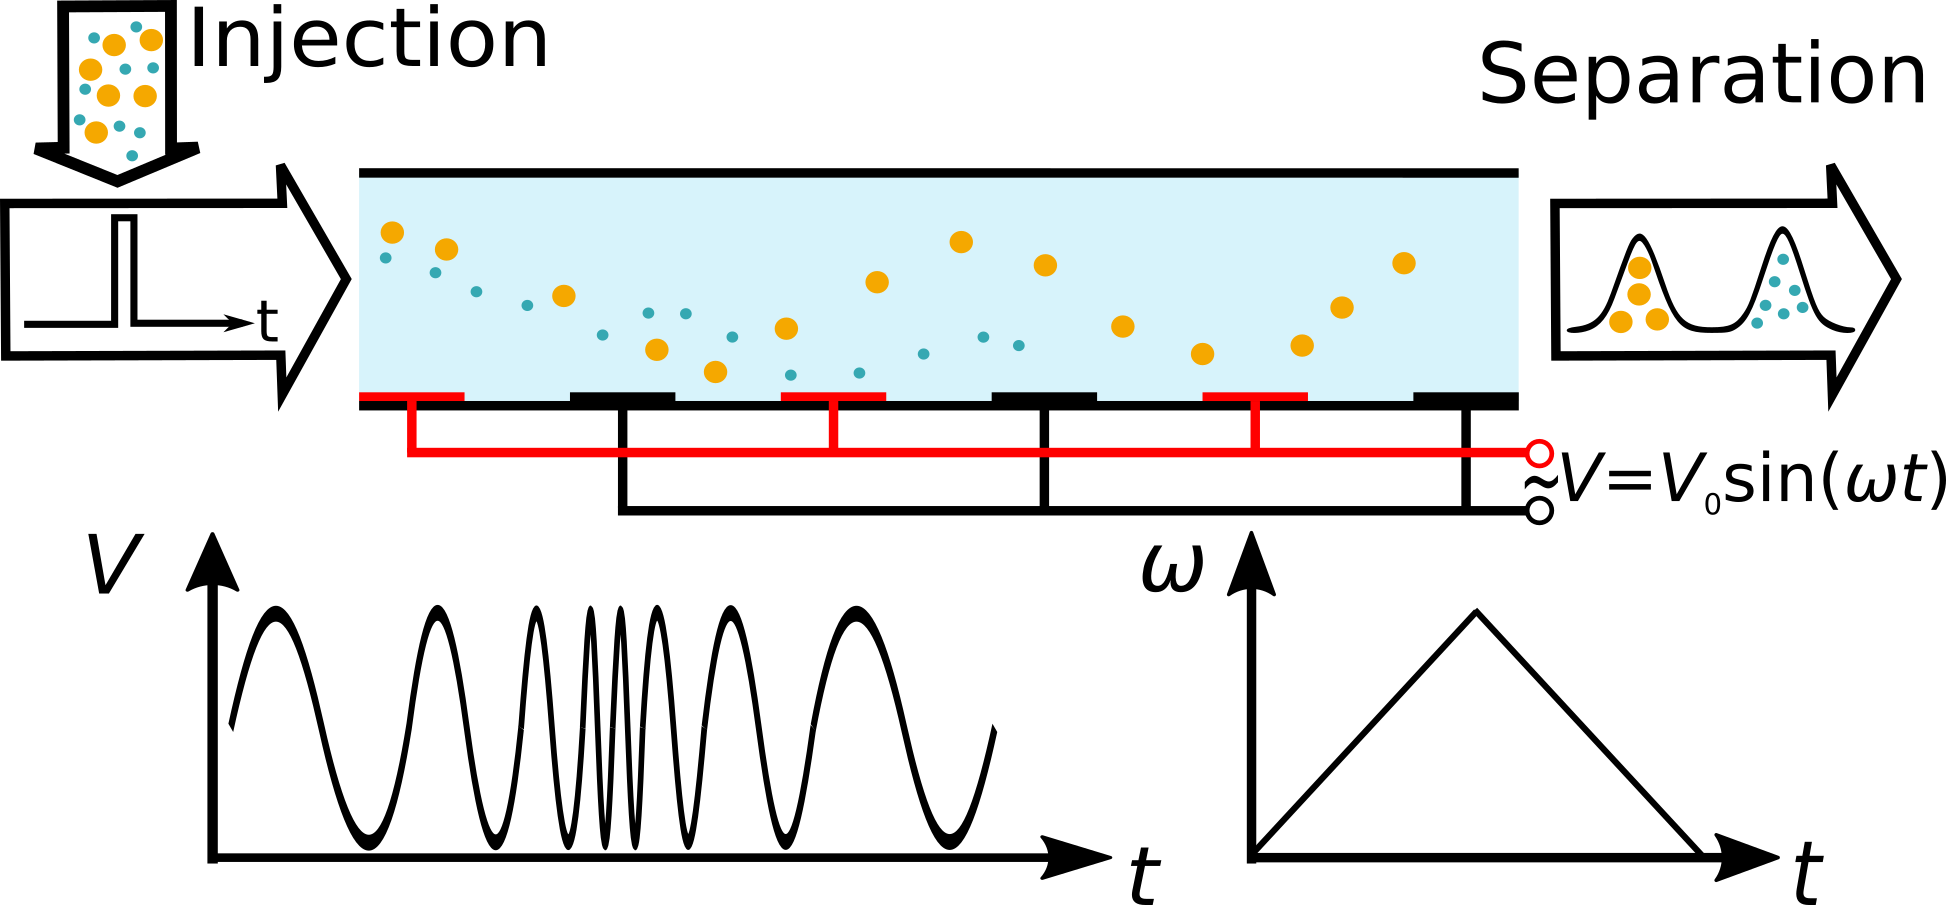
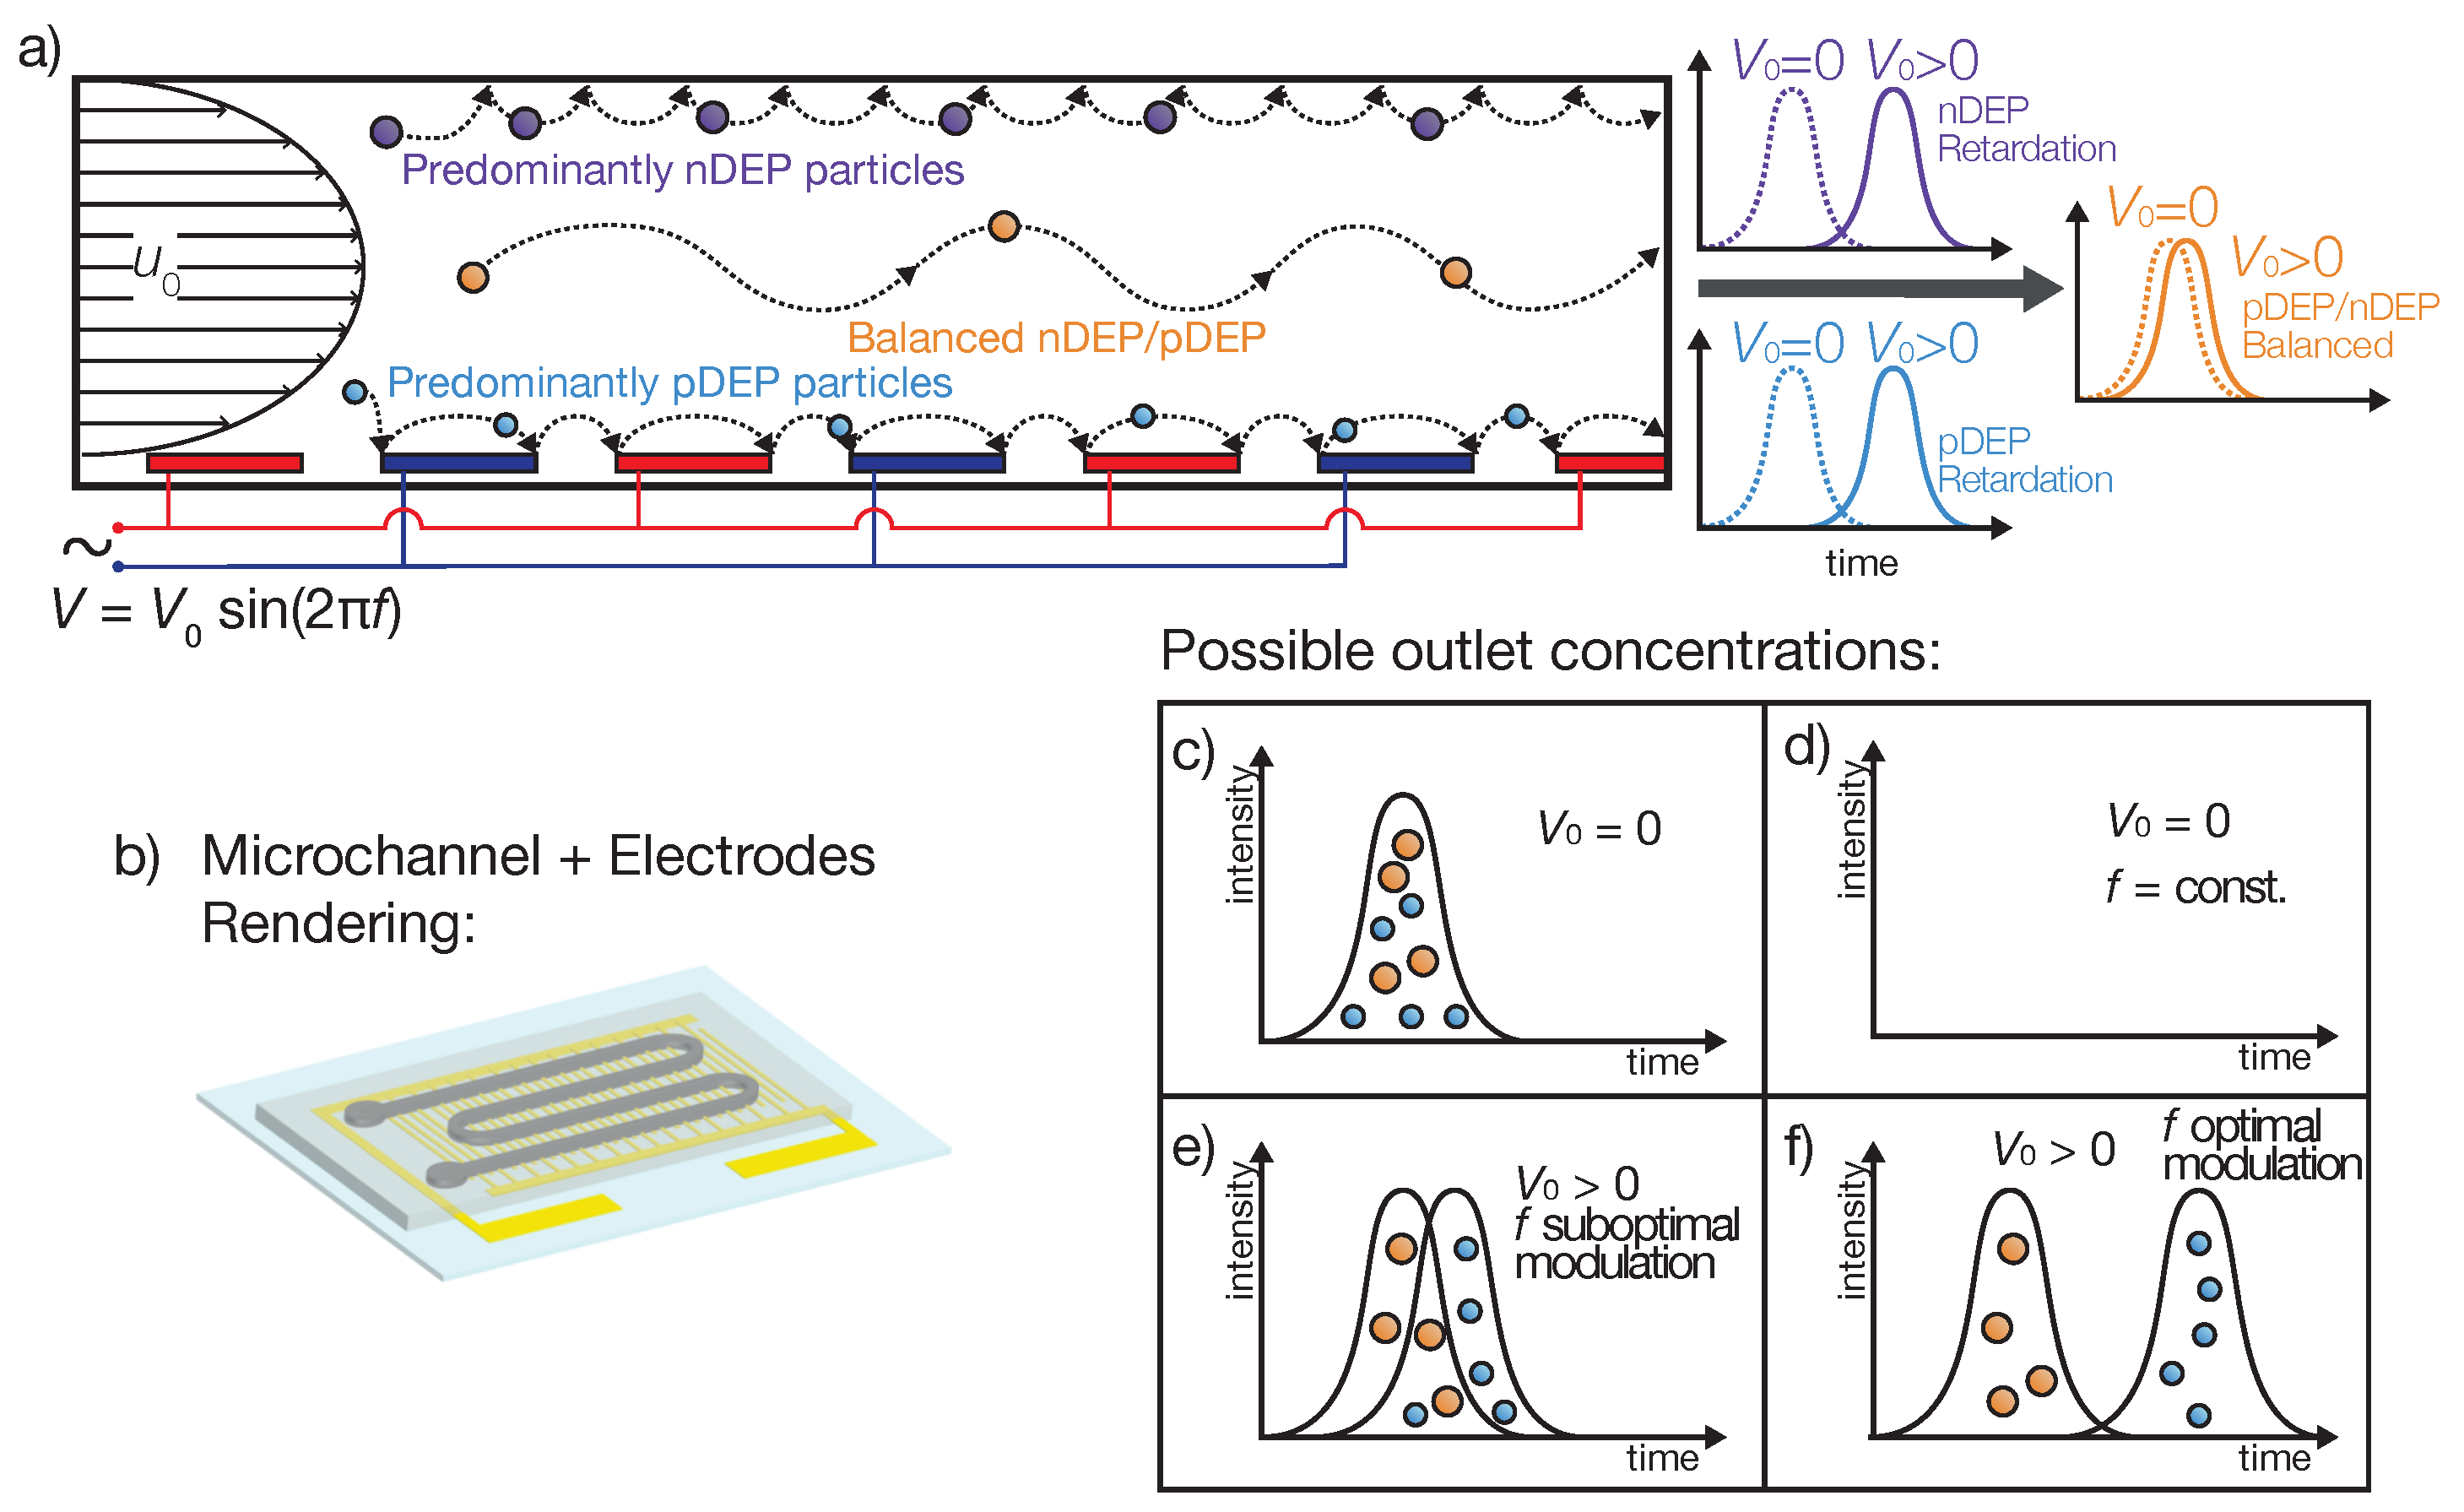
2.2. Device Operation
2.3. Device Fabrication
2.4. Experimental Setup
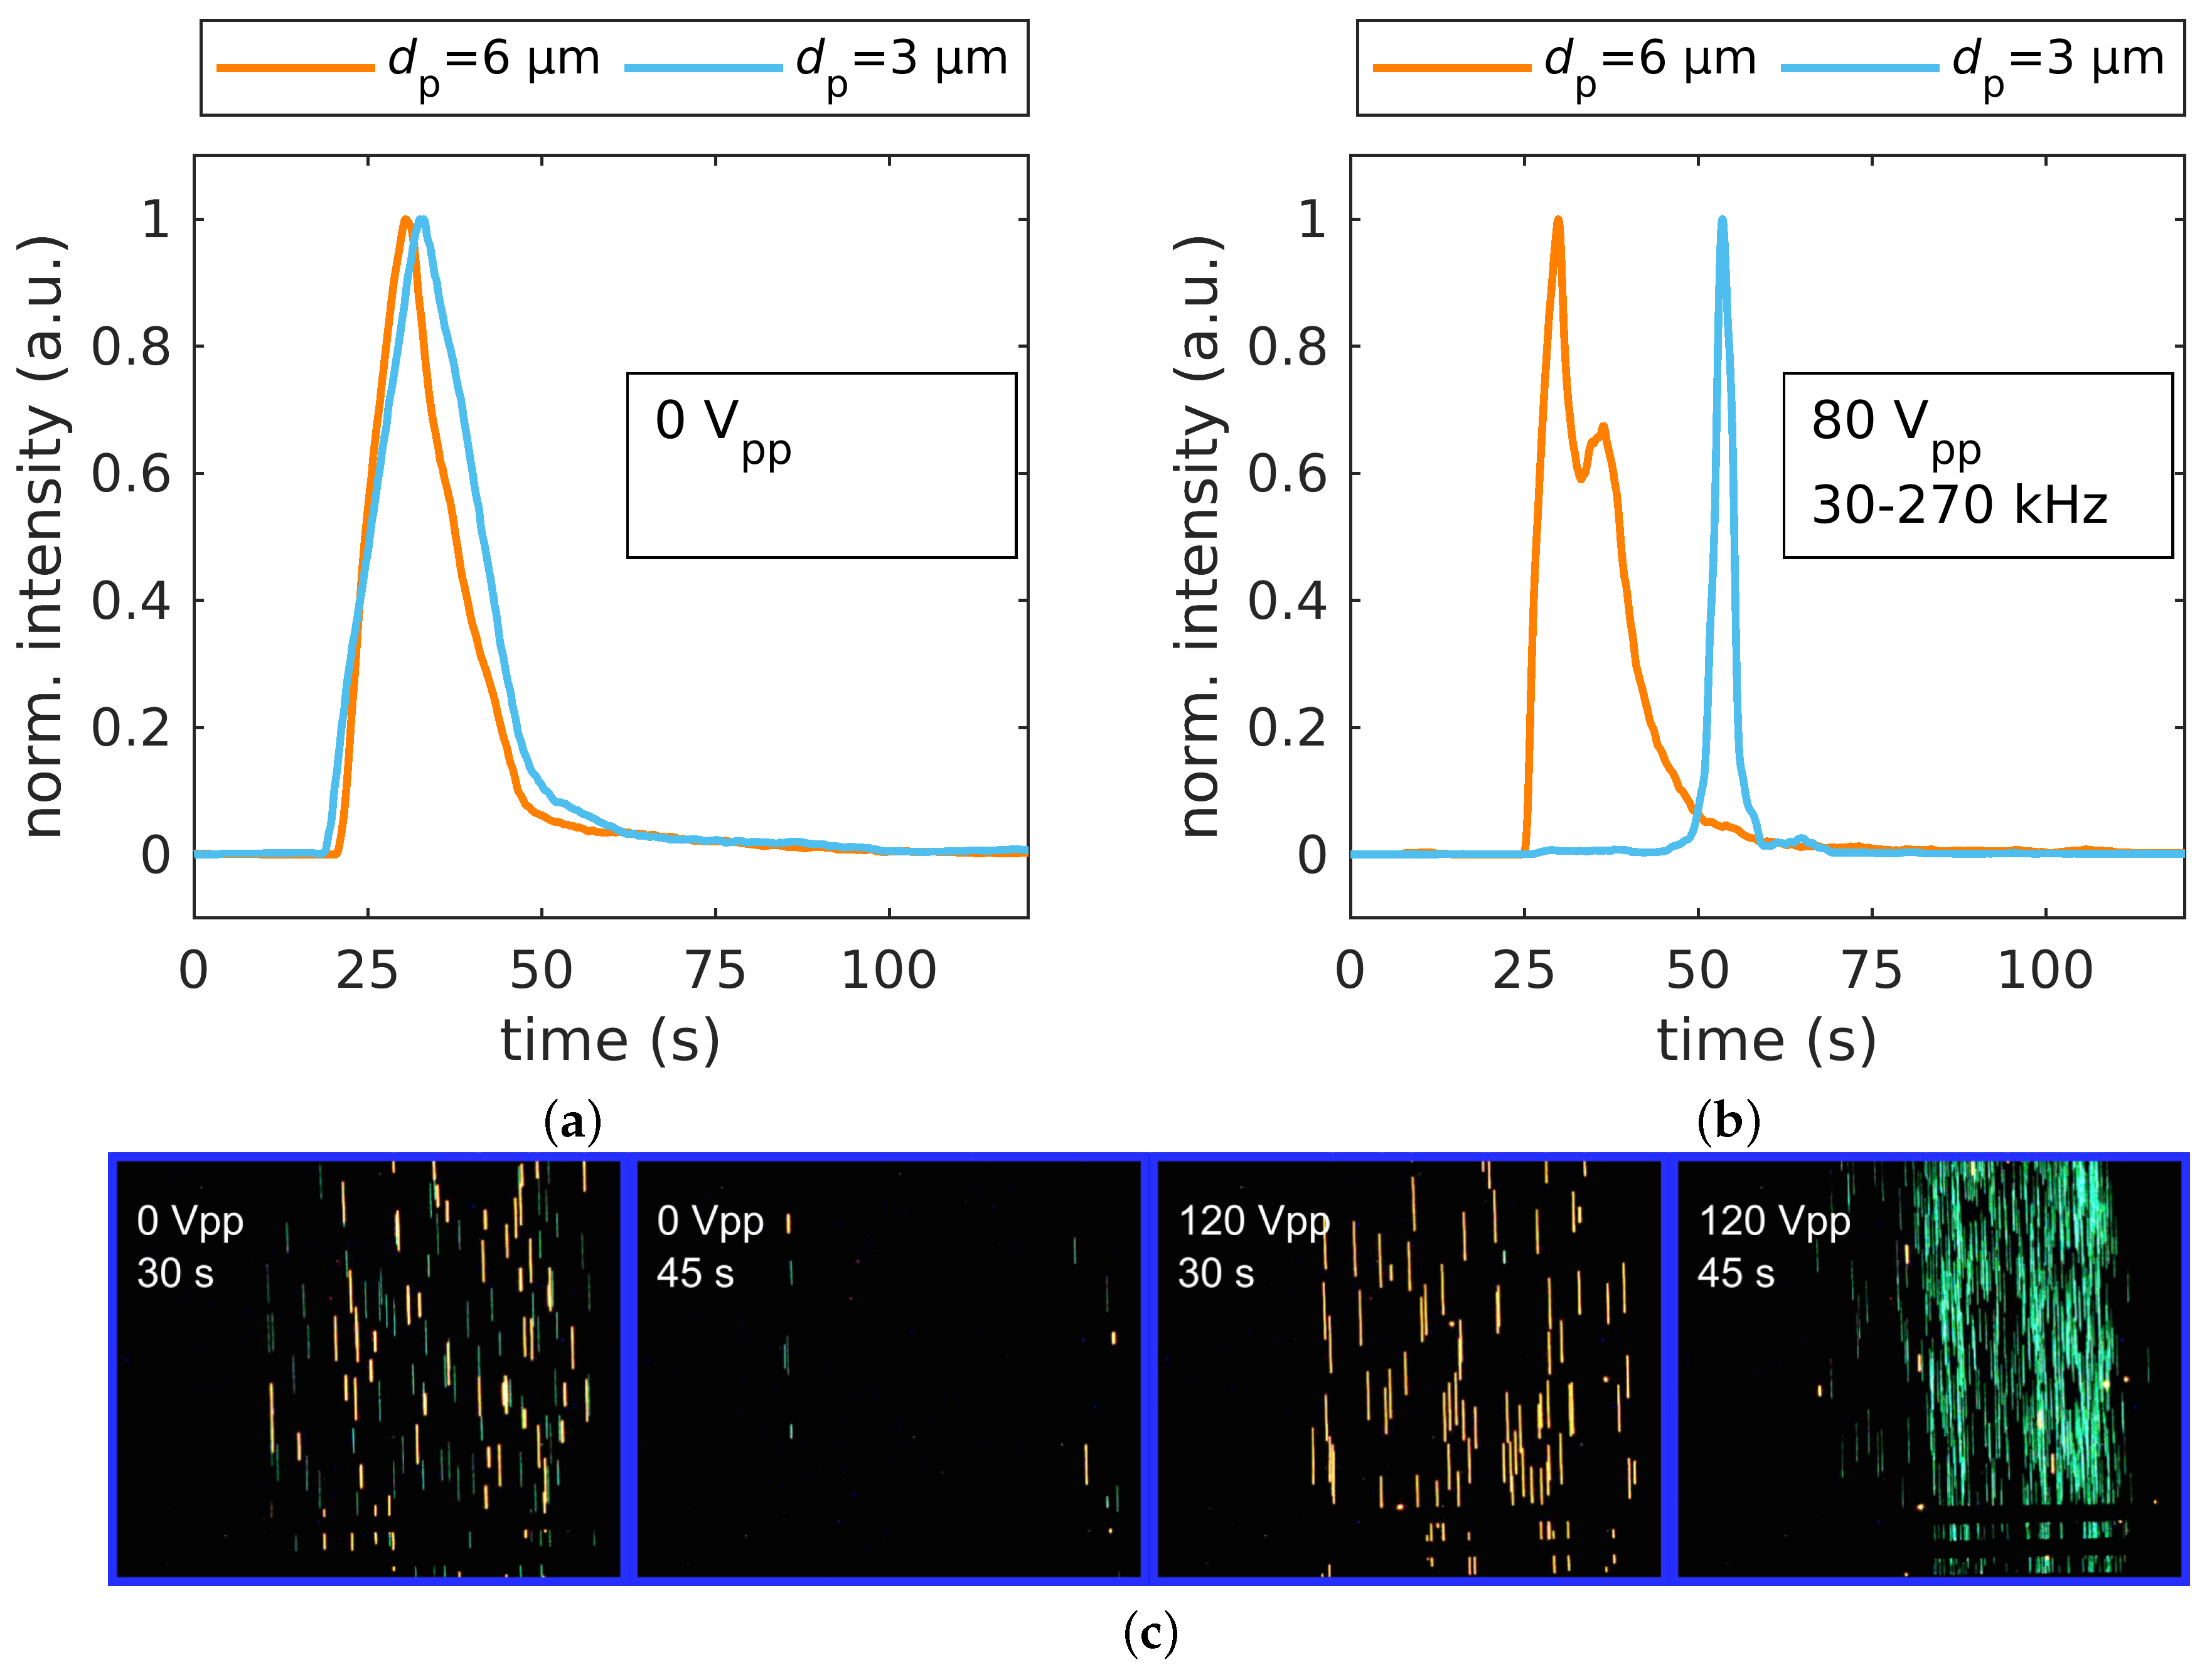
3. Results and Discussion
4. Conclusions
Supplementary Materials
Author Contributions
Funding
Acknowledgments
Conflicts of Interest
Abbreviations
| AC | alternating current |
| CM | Clausius–Mossotti factor |
| DEP | dielectrophoresis |
| DPC | dielectrophoretic particle chromatography |
| FWHM | full width at half maximum |
| nDEP | negative dielectrophoresis |
| pDEP | positive dielectrophoresis |
| PDMS | polydimethylsiloxane |
| PS | polystyrene |
References
- Vahey, M.D.; Voldman, J. An equilibrium method for continuous-flow cell sorting using dielectrophoresis. Anal. Chem. 2008, 80, 3135–3143. [Google Scholar] [CrossRef] [PubMed]
- Moon, H.S.; Kwon, K.; Kim, S.I.; Han, H.; Sohn, J.; Lee, S.; Jung, H.I. Continuous separation of breast cancer cells from blood samples using multi-orifice flow fractionation (MOFF) and dielectrophoresis (DEP). Lab Chip 2011, 11, 1118. [Google Scholar] [CrossRef] [PubMed]
- Henslee, E.A.; Sano, M.B.; Rojas, A.D.; Schmelz, E.M.; Davalos, R.V. Selective concentration of human cancer cells using contactless dielectrophoresis. Electrophoresis 2011, 32, 2523–2529. [Google Scholar] [CrossRef] [PubMed]
- Wang, X.B.; Yang, J.; Huang, Y.; Vykoukal, J.; Becker, F.F.; Gascoyne, P.R.C. Cell separation by dielectrophoretic field-flow-fractionation. Anal. Chem. 2000, 72, 832–839. [Google Scholar] [CrossRef] [PubMed] [Green Version]
- Washizu, M.; Suzuki, S.; Kurosawa, O.; Nishizaka, T.; Shinohara, T. Molecular dielectrophoresis of bio-polymers. In Proceedings of the Conference Record of the 1992 IEEE Industry Applications Society Annual Meeting, Houston, TX, USA; pp. 1446–1452. [CrossRef]
- Spengler, T.; Ploog, M.; Schröter, M. Integrated planning of acquisition, disassembly and bulk recycling: A case study on electronic scrap recovery. OR Spectr. 2003, 25, 413–442. [Google Scholar] [CrossRef]
- Du, F.; Baune, M.; Kück, A.; Thöming, J. Dielectrophoretic gold particle separation. Sep. Sci. Technol. 2008, 43, 3842–3855. [Google Scholar] [CrossRef]
- Williams, S.K.R.; Runyon, J.R.; Ashames, A.A. Field-flow fractionation: Addressing the nano challenge. Anal. Chem. 2011, 83, 634–642. [Google Scholar] [CrossRef]
- Hanauer, M.; Pierrat, S.; Zins, I.; Lotz, A.; Sönnichsen, C. Separation of nanoparticles by gel electrophoresis according to size and shape. Nano Lett. 2007, 7, 2881–2885. [Google Scholar] [CrossRef]
- Wei, G.T. Shape separation of nanometer gold particles by size-exclusion chromatography. Anal. Chem. 1999, 71, 2085–2091. [Google Scholar] [CrossRef]
- Wills, B.A.; Finch, J.A. Dewatering. In Wills’ Mineral Processing Technology; Elsevier: Amsterdam, The Netherlands, 2016; Chapter 15; pp. 417–438. [Google Scholar] [CrossRef]
- Wills, B.A.; Finch, J.A. Classification. In Wills’ Mineral Processing Technology; Number 1993; Elsevier: Amsterdam, The Netherlands, 2016; Chapter 9; pp. 199–221. [Google Scholar] [CrossRef]
- Contado, C. Field flow fractionation techniques to explore the “nano-world”. Anal. Bioanal. Chem. 2017, 409, 2501–2518. [Google Scholar] [CrossRef]
- Pesch, G.R.; Lorenz, M.; Sachdev, S.; Salameh, S.; Du, F.; Baune, M.; Boukany, P.E.; Thöming, J. Bridging the scales in high-throughput dielectrophoretic (bio-)particle separation in porous media. Sci. Rep. 2018, 8, 10480. [Google Scholar] [CrossRef] [PubMed]
- Suehiro, J.; Zhou, G.; Imamura, M.; Hara, M. Dielectrophoretic filter for separation and recovery of biological cells in water. IEEE Trans. Ind. Appl. 2003, 39, 1514–1521. [Google Scholar] [CrossRef]
- Modarres, P.; Tabrizian, M. Frequency hopping dielectrophoresis as a new approach for microscale particle and cell enrichment. Sens. Actuators B Chem. 2019, 286, 493–500. [Google Scholar] [CrossRef]
- Wang, Y.; Du, F.; Pesch, G.R.; Köser, J.; Baune, M.; Thöming, J. Microparticle trajectories in a high-throughput channel for contact-free fractionation by dielectrophoresis. Chem. Eng. Sci. 2016, 153, 34–44. [Google Scholar] [CrossRef]
- Park, S.; Zhang, Y.; Wang, T.H.; Yang, S. Continuous dielectrophoretic bacterial separation and concentration from physiological media of high conductivity. Lab Chip 2011, 11, 2893. [Google Scholar] [CrossRef] [PubMed]
- Pesch, G.R.; Du, F.; Schwientek, U.; Gehrmeyer, C.; Maurer, A.; Thöming, J.; Baune, M. Recovery of submicron particles using high-throughput dielectrophoretically switchable filtration. Sep. Purif. Technol. 2014, 132, 728–735. [Google Scholar] [CrossRef]
- Weirauch, L.; Lorenz, M.; Hill, N.; Lapizco-Encinas, B.H.; Baune, M.; Pesch, G.R.; Thöming, J. Material-selective separation of mixed microparticles via insulator-based dielectrophoresis. Biomicrofluidics 2019, 13, 064112. [Google Scholar] [CrossRef]
- Sano, H.; Kabata, H.; Kurosawa, O.; Washizu, M. Dielectrophoretic chromatography with cross-flow injection. In Proceedings of the Technical Digest. MEMS 2002 IEEE International Conference. Fifteenth IEEE International Conference on Micro Electro Mechanical Systems (Cat. No.02CH37266), Las Vegas, NV, USA, 24 January 2002; pp. 2–5. [Google Scholar] [CrossRef]
- Kikkeri, K.; Ngu, B.; Agah, M.; Engineering, C.; Tech, V. Submicron Dielectrophoretic Chromatography. In Proceedings of the 2018 IEEE Micro Electro Mechanical Systems (MEMS), Belfast, UK, 21–25 January 2018; pp. 1177–1180. [Google Scholar]
- Umezawa, Y.; Kobayashi, O.; Kanai, S.; Hakoda, M. Development of Particle Packed Bed Type Chromatography Using Dielectrophoresis. Key Eng. Mater. 2013, 534, 88–92. [Google Scholar] [CrossRef]
- Hakoda, M.; Otaki, T. Analytical Characteristic of Chromatography Device Using Dielectrophoresis Phenomenon. Key Eng. Mater. 2012, 497, 87–92. [Google Scholar] [CrossRef]
- Gascoyne, P.R.; Noshari, J.; Anderson, T.J.; Becker, F.F. Isolation of rare cells from cell mixtures by dielectrophoresis. Electrophoresis 2009, 30, 1388–1398. [Google Scholar] [CrossRef] [Green Version]
- Gupta, V.; Jafferji, I.; Garza, M.; Melnikova, V.O.; Hasegawa, D.K.; Pethig, R.; Davis, D.W. ApoStream™, a new dielectrophoretic device for antibody independent isolation and recovery of viable cancer cells from blood. Biomicrofluidics 2012, 6, 024133. [Google Scholar] [CrossRef] [Green Version]
- Shim, S.; Stemke-Hale, K.; Tsimberidou, A.M.; Noshari, J.; Anderson, T.E.; Gascoyne, P.R. Antibody-independent isolation of circulating tumor cells by continuous-flow dielectrophoresis. Biomicrofluidics 2013, 7, 011807. [Google Scholar] [CrossRef] [Green Version]
- Aldaeus, F.; Lin, Y.; Amberg, G.; Roeraade, J. Multi-step dielectrophoresis for separation of particles. J. Chromatogr. A 2006, 1131, 261–266. [Google Scholar] [CrossRef]
- Green, N.G.; Hughes, M.P.; Monaghan, W.; Morgan, H. Large area multilayered electrode arrays for dielectrophoretic fractionation. Microelectron. Eng. 1997, 35, 421–424. [Google Scholar] [CrossRef]
- Cheng, I.F.; Froude, V.E.; Zhu, Y.; Chang, H.C.; Chang, H.C. A continuous high-throughput bioparticle sorter based on 3D traveling-wave dielectrophoresis. Lab Chip 2009, 9, 3193–3201. [Google Scholar] [CrossRef]
- Sun, T.; Morgan, H.; Green, N.G. Analytical solutions of ac electrokinetics in interdigitated electrode arrays: Electric field, dielectrophoretic and traveling-wave dielectrophoretic forces. Phys. Rev. E Stat. Nonlinear Soft Matter Phys. 2007, 76, 046610. [Google Scholar] [CrossRef] [Green Version]
- García-Sánchez, P.; Ramos, A.; González, A.; Green, N.G.; Morgan, H. Flow reversal in traveling-wave electrokinetics: An analysis of forces due to ionic concentration gradients. Langmuir 2009, 25, 4988–4997. [Google Scholar] [CrossRef] [Green Version]
- Hughes, M.P. Fifty years of dielectrophoretic cell separation technology. Biomicrofluidics 2016, 10, 032801. [Google Scholar] [CrossRef] [Green Version]
- Pethig, R. Dielectrophoresis: Status of the theory, technology, and applications. Biomicrofluidics 2010, 4, 022811. [Google Scholar] [CrossRef] [Green Version]
- Ermolina, I.; Morgan, H. The electrokinetic properties of latex particles: Comparison of electrophoresis and dielectrophoresis. J. Colloid Interface Sci. 2005, 285, 419–428. [Google Scholar] [CrossRef] [Green Version]
- Arnold, W.M.; Schwan, H.P.; Zimmermann, U. Surface conductance and other properties of latex particles measured by electrorotation. J. Phys. Chem. 1987, 91, 5093–5098. [Google Scholar] [CrossRef]
- Satyanarayana, S.; Karnik, R.N.; Majumdar, A. Stamp-and-stick room-temperature bonding technique for microdevices. J. Microelectromech. Syst. 2005, 14, 392–399. [Google Scholar] [CrossRef]
- Gajasinghe, R.W.; Senveli, S.U.; Rawal, S.; Williams, A.; Zheng, A.; Datar, R.H.; Cote, R.J.; Tigli, O. Experimental study of PDMS bonding to various substrates for monolithic microfluidic applications. J. Micromech. Microeng. 2014, 24, 075010. [Google Scholar] [CrossRef]
- Koschwanez, J.H.; Carlson, R.H.; Meldrum, D.R. Thin PDMS films using long spin times or tert-butyl alcohol as a solvent. PLoS ONE 2009, 4, e4572. [Google Scholar] [CrossRef]
- Wang, X.B.; Vykoukal, J.; Becker, F.F.; Gascoyne, P.R. Separation of polystyrene microbeads using dielectrophoretic/gravitational field-flow-fractionation. Biophys. J. 1998, 74, 2689–2701. [Google Scholar] [CrossRef] [Green Version]
- Castellanos, A.; Ramos, A.; González, A.; Green, N.G.; Morgan, H. Electrohydrodynamics and dielectrophoresis in microsystems: Scaling laws. J. Phys. D Appl. Phys. 2003, 36, 2584–2597. [Google Scholar] [CrossRef]


© 2019 by the authors. Licensee MDPI, Basel, Switzerland. This article is an open access article distributed under the terms and conditions of the Creative Commons Attribution (CC BY) license (http://creativecommons.org/licenses/by/4.0/).
Share and Cite
Giesler, J.; Pesch, G.R.; Weirauch, L.; Schmidt, M.-P.; Thöming, J.; Baune, M. Polarizability-Dependent Sorting of Microparticles Using Continuous-Flow Dielectrophoretic Chromatography with a Frequency Modulation Method. Micromachines 2020, 11, 38. https://doi.org/10.3390/mi11010038
Giesler J, Pesch GR, Weirauch L, Schmidt M-P, Thöming J, Baune M. Polarizability-Dependent Sorting of Microparticles Using Continuous-Flow Dielectrophoretic Chromatography with a Frequency Modulation Method. Micromachines. 2020; 11(1):38. https://doi.org/10.3390/mi11010038
Chicago/Turabian StyleGiesler, Jasper, Georg R. Pesch, Laura Weirauch, Marc-Peter Schmidt, Jorg Thöming, and Michael Baune. 2020. "Polarizability-Dependent Sorting of Microparticles Using Continuous-Flow Dielectrophoretic Chromatography with a Frequency Modulation Method" Micromachines 11, no. 1: 38. https://doi.org/10.3390/mi11010038