

Improved Optimization Algorithm in LSTM to Predict Crop Yield


1
Department of Computer Science and Engineering, Koneru Lakshmaiah Education Foundation, Vaddeswaram 522502, Andhra Pradesh, India
2
Medical informatics Centre, School of Medicinal and Health Science Products, University of Camerino, 62032 Macerata, Italy
*
Author to whom correspondence should be addressed.
Computers 2023, 12(1), 10; https://doi.org/10.3390/computers12010010
Submission received: 2 December 2022
/
Revised: 30 December 2022
/
Accepted: 31 December 2022
/
Published: 3 January 2023
(This article belongs to the Special Issue Artificial Intelligence Models, Tools and Applications with A Social and Semantic Impact)
Abstract
:Agriculture is the main occupation across the world with a dependency on rainfall. Weather changes play a crucial role in crop yield and were used to predict the yield rate by considering precipitation, wind, temperature, and solar radiation. Accurate early crop yield prediction helps market pricing, planning labor, transport, and harvest organization. The main aim of this study is to predict crop yield accurately. The incorporation of deep learning models along with crop statistics can predict yield rates accurately. We proposed an improved optimizer function (IOF) to get an accurate prediction and implemented the proposed IOF with the long short-term memory (LSTM) model. Manual data was collected between 1901 and 2000 from local agricultural departments for training, and from 2001 to 2020 from government websites of Andhra Pradesh (India) for testing purposes. The proposed model is compared with eight standard methods of learning, and outcomes revealed that the training error is small with the proposed IOF as it handles the underfitting and overfitting issues. The performance metrics used to compare the loss after implementing the proposed IOF were r, RMSE, and MAE, and the achieved results are r of 0.48, RMSE of 2.19, and MAE of 25.4. The evaluation was performed between the predicted crop yield and the actual yield and was measured in RMSE (kg/ha). The results show that the proposed IOF in LSTM has the advantage of crop yield prediction with accurate prediction. The reduction of RMSE for the proposed model indicates that the proposed IOFLSTM can outperform the CNN, RNN, and LSTM in crop yield prediction.
1. Introduction
Agricultural yield mainly depends on rainfall, which is a vital factor in the growth and production of food crops. Reports highlighted that there is a direct relationship between crop growth and rain patterns. The actual rainfall recorded for the year 2020 by the southwest monsoon is 704.8 mm, and by the northeast monsoon is 370.3 mm [1]. In India, the land usage for agriculture is about 200.2 million hectares, which means a big source of livelihood [2]. The prediction of crop yield plays a vital role in the management of controlling the crop parameters and guarantees the maximum yield.
Prediction of yield is one of the most significant and well-known themes in accuracy farming as it characterizes yield planning and assessment, coordinating harvest supply with the request, and crop management [3]. Smart farming makes it possible to conduct agriculture more effectively and efficiently through high-precision algorithms. In particular, Machine Learning (ML) drives the mechanism of machines which are able to learn without the involvement of manpower [4]. ML emerges jointly with high-performance computing and big data knowledge, creating novel opportunities to understand, unravel, and quantify data-intensive procedures in agricultural operations. State-of-the-art models have gone a long way past basic predictions dependent on past data and consolidate computer vision advances to give information in an urgent and far-reaching multidimensional examination of crops, climate, and financial conditions to take advantage of the yield for the population.
Deep learning is a subpart of ML knowledge that works on artificial neural networks (ANN) with representation learning. As deep learning was successfully implemented in various domains such as computer vision, medicine, chatbots, etc. [5,6], it recently entered agriculture and was majorly used for crop classification [7], predicting and estimating crop yield [8]. In particular, ANN models are largely utilized to predict crop yields by considering various factors such as water content, solar radiation, CO2 fixation, and transpiration [9,10,11]. It is reported that the Recurrent Neural Network (RNN) can predict crop yield with high accuracy [12]. Similarly, combining convolutional neural networks (CNN) and long short-term memory (LSTM) models can estimate the yield for country-level soybean crops based on remote sensing data [13].
Yang et al. [14] implemented the region-based CNNs to the forest of the strawberry yield and detected and counted the number of flowers, mature strawberries, and immature strawberries. Helena et al used the 3D CNN and RNN models, which are largely incorporated to predict crop yield, and concluded that the proposed 3DCNN model outperforms some machine learning algorithms [15,16]. In addition, the LSTM model forecasts corn yield by considering weather data and soil data parameters to achieve better performance in yield prediction [17,18]. However, all these models do not guarantee the low process time and the reduction of loss that are largely attributed to the prediction of crop yields.
This research forecasts future crop fields by considering the weather parameters and rainfall time series. This study aimed to propose a new and improved optimization function (IOF) to train the LSTM model to reduce the training and testing loss. The proposed IOFLSTM model can enhance most of the advanced LSTM models on the public crop yield and available production datasets. In addition, the performance evaluation of the developed optimizer IOF was performed by comparing the proposed IOF with the standard training of the seven gradient descent optimizers, which can be elaborated on in further sections. The scarcity of research on reducing overfitting issues among crop yield datasets has motivated us to develop the IOFLSTM model by handling the bias variance.
The novel contributions of this study are:
- Propose a new optimized IOF function to train the LSTM model to reduce the training and testing loss;
- LSTM uses the new optimization function to calculate the model error;
- The proposed IOFLSTM model was superior to most of the state-of-the-art LSTM models on the public crop yield and available production datasets;
- Evaluate the performance of the proposed optimizer IOF by comparing the proposed IOF with the standard Stohastic Gradient Descent (SGD), Momentum, AdaGrad, Root Mean Square prop, and Adam by training using the Root Mean Square (RMSE), Mean Square Error (MSE) functions. The results show that the proposed IOF prevents the model from overfitting by handling the bias-variance.
2. Materials and Methods
2.1. Dataset Description
We collected the rainfall data from 1901 to 2020 and the crop yield data of paddy, maize, ragi, sugarcane, and cotton from the Indian government website [19]. Additionally, the metrological data from the Indian metrological department website was incorporated [20]. From 1901 to 2000 as the training data manually collected the total crop yield yearly production from the local agricultural departments and from 2001 to 2020 as the testing data from the Andhra Pradesh government websites and the Indian government agricultural websites [21]. The crop yield dataset consists of 25,515 rows and the number of features in the dataset is 26. Table 1 tabulates the features used in this research. The maximum temperature varies from 30.1 °C to 45.4 °C, the minimum temperature varies from 19 °C to 32.5 °C, the wind speed varies from 12 km/h to 21 km/h, and the relative humidity varies from 52 to 79, and the solar radiation varies from 8.1 to 10.9. The rainfall varies from 0.2 mm to 7 mm.
Figure 1 shows the major crops that were cultivated in India and their yields in the year 2000. Rice is one of the major crops cultivated in India. State-based statistics were collected from the agricultural departments and from the Indian government agricultural websites [21]. The yielded data were reported in units of kg per hectare.
2.2. Predictive Modeling
Based on the differences in rainfall, we used predictive modeling to forecast the Kharif crop yield for the year 2021. The feature selection was performed on the attributes by combining the rainfall data with the crop yield data. As the Kharif crop mainly depends on the information on rainfall, this study only used data from June to September as the training data to do model training. Therefore, weather data is helping to provide input to train the model and crop yield data as predicted outcomes.
2.3. Padding and Optimization
The imported data may consist of unfilled data. To complement the incomplete measures, the ”−1” padding technique was used. Optimizers minimize the error by updating the weight parameters and reducing the training time. An optimizer is an algorithm or a function that changes the attributes of the deep learning models such as learning rate and weights to reduce the error [22]. Gradient descent is a first-order optimization algorithm, and it is dependent on the first-order derivate of the error function of the deep learning model. Optimizers find a way to alter the weights to minimize the error.
2.4. Existing Models with LSTM Model
The other deep learning models used to compare with the proposed model are CNN, RNN, and GRU.
2.4.1. Convolution Neural Network (CNN)
CNN comprises three layers; namely, convolution, pooling, and fully connected ones, and this model automatically detects distinctly. The term convolution represents the mathematical function of convolution, i.e., a linear operation where two functions are multiplied to get the third function. The pooling layer reduces computational costs by reducing the size of the convolved feature map. The fully connected layer predicts the class based on extracted features and the convolution process output.
2.4.2. Recurrent Neural Network (RNN)
RNN saves the output of a specific layer and feeds it back to the input of another to predict the result of the layer. It can memorize the previous inputs due to its internal memory. RNN has a vanishing gradient and exploding gradient issues.
2.4.3. Gated Recurrent Unit (GRU)
GRU uses gates to control the flow of information. It maintains two gates called reset and update where the reset gate contains the information to remember, and the update gate determines future data based on past information.
2.4.4. Long Short-Term Memory (LSTM)
LSTM is a special kind of RNN and can learn long-time dependencies [23]. The standard LSTM consists of three gates, and these gates are responsible for regulating the information and passing that information to the next unit. The forget value either forgets everything or does not forget the information based on the values of the forget gate (i.e., the forget gate forgets everything if the value is zero, and nothing if the value is one). The input gate controls the new information to add the next cell state, and it works in two parts. The first part of the input gate is the sigmoid layer, which controls the output value stored in the cell state. The input gate’s second part is the Tanh layer, and it creates a vector of new feature values stored in the cell state. The output gates output the updated cell state information. Through the gates’ structure, the statistics execute selectively and are handed through to update and hold the historical statistics and update the cell state. LSTM considers the previous historical values, analyzes the present unknown patterns by adjusting itself according to the complete patterns, and makes future forecasts ahead. The functionality of LSTM is presented in Figure 2.
An LSTM cell, ht−1, is the previous memory output, and ct is the current memory output. LSTM cell is explained as:
- It calculates the current memory (cgt), the weight matrix (wtCg), and the bias is the (bscg).
cgt = Tahn(wtCg × [hdcg−1,xCg] + bscg)
- The input gate manages the update of the current memory input data to the value of the memory cell, the weight matrix (wtig), and the bias (bsig) and the sigmoid function. The input gate is calculated as:
igt = σ(wtig × [hdig−1,xig] + bsig)
- The forget gate controls the update of the previous memory data to the value of the memory cell, the weight matrix (wtf), and the bias (bsfg) and is the sigmoid function. The forget gate is calculated as:
fgt = wtfwtfg × [hdfgpedicle] + bsfg)
- lct−1 is the last LSTM cell value, and the current memory cell can be calculated as:
cut = fit × lct−1 + cgt
2.5. Proposed Approach
This research proposes an enhanced optimized function, i.e., an Improved Optimization Function (IOF), to reduce the error in crop yield prediction. The flowchart presentation of the present study is presented in Figure 2.
In this study, time series forecasting helps to forecast future crop yield. LSTM considers the previous historical values, analyzes unfamiliar patterns by regulating itself according to the complete patterns, and makes further predictions. This study proposes an enhanced optimization function, i.e., an Improved Optimization Function (IOF), to analyze the prediction. The flow followed in this study is shown in Figure 3. Xn and On are the input and the output patterns, and the observed output is the actual values.
In the proposed modeling, the IOF function works after error calculation, and only the backpropagation will start that can update the weights of the matrices and the cell states of the LSTM cell. The IOF function reduces the error and converges fast depending upon the backpropagation used. The algorithmic representation of IOF is given below.
An improved optimization function algorithm is given in Algorithm 1. The algorithm repeats until θt is not convergent. In step 3, gt is the current gradient and m is the decaying mean over the previous updates. Step 3 allows the model to move faster along dimensions where the update is consistently smaller and smaller along turbulent dimensions where the update is significantly oscillating. β1mt−1 and β2vt−1 in step 4 and 5 do not depend on the current gradient but gives higher quality by updating the parameters with the momentum step before computing the gradient. In steps 6 and 7, the denominator 1 − , 1 − corrects the bias, which helps to continue changing direction even when the learning rate has annealed significantly toward the end of the training.
| Algorithm 1: IOF |
| α: step Size |
| η: Learning rate |
| β1, β2 ∈ [0,1]: Exponential Decay rate to the moment estimation |
| 1. while θt is not joined, repeat |
| 2. t < −t + 1 |
| 3. gt ← ▽θft(θt−1) |
| 4. mt ← log(β1mt−1+(1 – β1)gt) |
| 5. vt ← log(β2vt−1+(1 – β2)) |
| 6. mt ← mt/(1 – ) |
| 7. mt ← vt/(1 –) |
| 8. θt ← θt−1 – αmt/(+ ε) |
| end |
| return θt |
The updated algorithm of IOFLSTM is presented in Algorithm 2. In step 1, the LSTM model is trained using the crop yield data. In step 3(a), consider I the input, i.e., fed to the embedding layer to produce the output f(x). While coupling LSTM and IOF, the output f(x) from the LSTM model and the ground truth y calculate the IOF for each instance. In step 3(b), the IOF algorithm is implemented. The error is then passed through a nonlinear function to create the weight used to adjust the loss. The forward propagation of the LSTM cells is where the preprocessed input has taken and passed through the hidden states, and then the output has been achieved. Then, the error between the predicted and the actual values are calculated. The output value converges between zero and one. Then, the predicted values are computed with the specified number of epochs until the RMSE value converges. After completing the training procedure, it is tested on the test data, and the accuracy is calculated in step 6. The obtained time ahead values of the IOFLSTM are validated using the statistical evaluation parameters to analyze the forecast.
The hyperparameters applied during the training process were 11 hidden layers and 50 neurons in each layer. The proposed model was trained and tested with the same hyperparameters of epoch size 1000, learning rate 1 × 10⁻², batch size 64, and dense layers 4 with weight decay constants of 0.0001. We used the maxout activation function for all neurons in the model.
| Algorithm 2: Updated IOFLSTM |
| Dataset S = { }, 1 |
| Input: rainfall historical data, crop yield historical data |
| Output: reduced loss value and reduced processing time of the f(x) data |
| 1. Initialisation: , , , , , b |
| 2. |
| 3. |
| 4. |
| 5. |
| 6. Update weights and biases. |
2.6. Performance Metrics
In regression models, the mathematical equations help to understand the relationship between two variables. Generally, these models are largely useful in the estimation and prediction of outputs. The models consider the different aspects of inputs (independent variables) and predict output values (dependent variables). The difference between the estimated model outputs versus actual values is called residuals, and these residuals play a vital role in judging model efficiency. The collection of residual quantity is opposite to model performance. From a statistical point of view, different parameters help to inspect the residuals in judging the model’s accuracy. These performance metrics are: mean absolute percentage error (MAPE), mean absolute error (MAE), root mean square error (RMSE), and Adjusted R squared.
Mean Absolute Percentage Error (MAPE): It is the sum of the individual absolute errors divided by everyone, and the average of those individual absolute errors. It determines how far the proposed model prediction deviates from its corresponding output and is defined as:
where is the actual value and is the predicted value and m is the total number of observations
Mean Absolute Error (MAE): It is the absolute arithmetical mean of the absolute difference between the actual values and the predicted values. It represents the average of the importance of the errors and is defined as:
where is the actual value and is the predicted value and m is the total number of observations.
Root Mean Square Error (RMSE): It is the standard deviation of the predicted errors. It determines how well the information is concentrated on the best fit line and is defined as:
where is the actual value and is the predicted value and m is the total number of observations
R Square (R2): This calculates the variance of the proposed model over the total variance. The higher the score, the smaller the difference between the observed and the predicted values, which are defined as:
where is the actual value and is the predicted value, is the mean value of .
Optimizers play a very vital role in efficiently and effectively training a model and producing accurate results. The optimal parameter values minimize the loss, which affects the overall training time. The proposed optimization algorithm navigates the possible set of weights to make good predictions that reduce the loss and improve the accuracy of the model. If the model loss is near zero then the model prediction is perfect, i.e., the lower the loss the better the proposed model. So, the main goal of this paper is to minimize the loss concerning the training model parameter through different optimization parameters. These experiments implemented the IOFLSTM using the Keras in Python on the Intel Core i5 3.4 GHz processor.
3. Results
This section presents the comparison of different performance metrics between different deep learning algorithms.
3.1. Prediction of the Temperature, Monsoon Rainfall, and Crop Yield
The purpose of this study is to predict rainfall, temperature, and crop yields for monsoon crops. During the monsoon season, high rainfall and high temperatures may contribute to high crop yields. Based on the trends in rainfall and temperature, we predicted crop yields. The proposed model was trained from 1901 to 1999 and tested on monsoon rainfall and temperatures from 2000 to 2020. Finally, the model was tested on rainfall and temperatures for the year 2021. Figure 4 shows the predicted temperature and rainfall for 2021. Figure 5 summarizes the crop yield prediction results of the IOFLSTM model in various districts of Andhra Pradesh. The crop yield of a million tons per hectare per year is directly proportional to the annual rainfall in Andhra Pradesh. Figure 6 shows the prediction of crop production for the year 2021.
3.2. Performance Comparison
Comparing the proposed IOF with the default optimizer Adam using different deep learning models were presented in Table 2. The performance comparison of major crops in AP with different deep learning models (LSTM, RNN, ANN, and CNN) and our proposed IOFLSTM using the statistical parameters are presented in Table 2. In an LSTM model, the RMSE values range from 0.021 to 3.03, the ‘r’ values range from 0.29 to 0.45, and the MAE values range from 0.69 to 3.54 during the model training. Experimental outcomes provide evidence that the IOFLSTM outperforms others and produced accurate prediction numbers. The loss with IOF is less than the default optimizer ADAM. Table 3 tabulates the comparison of different optimizers using the LSTM model. A comparison of the proposed model with the RNN, LSTM, ANN, and CNN models is tabulated in Table 4.
The comparisons between district (region) wise performance metrics for the proposed IOFLSTM with similar state-of-the-art frameworks such as LSTM and GRU are presented in Table 5. The performance of the IOFLSTM is better for all the metrics and gives accurate predictions compared to the standard LSTM and GRU.
The time series comparison of the proposed model with the different state-of-the-art techniques for crop yield prediction are presented in Figure 7. From these figures, it is clear that the IOFLSTM model was the closest to the observed rainfall data (in blue). The outperformance of IOFLSTM methods in the prediction of crop yield is acquired.
Comparison of the proposed models with the different statistical measures is presented in Table 6. The performance comparison of major crops in AP with different measures (Multivariate Logistic Regression (MLR), Support Vector Regression (SVR), Analysis of varainace (ANOVA), Partial Leasr Squares Regression (PLSR)) and our proposed IOFLSTM using the statistical parameters are presented in Table 6. In an MLR model, the RMSE values range from 0.071 to 2.321, ‘r’ values range from 0.989 to 0.994, and MAE values range from 0.054 to 2.321 during the model training. The PLSR exhibits the worst performance, with RMSE values ranging from 0.089 to 3.321, ‘r’ values ranging from 0.964 to 0.977, MAE values ranging from 0.074 to 2.684, and, MASE values ranging from 0.836 to 1.245 during the model training. Experimental outcomes provide evidence that the IOFLSTM outperforms others and produced accurate prediction numbers.
To validate the performance of the proposed optimizer, the dataset is decomposed into training and testing portions. The training dataset helps to carry out the model training and the model test is performed by testing the dataset. The accuracy and loss of both training and testing datasets for different optimizing algorithms can be visualized in Figure 8. The model outcomes of crop yield prediction implemented by IOFLSTM (in brown) produced the best accuracy with the minimum loss. The outperformance of IOFLSTM methods in the prediction of crop yield is acquired.
4. Discussion
The present study proposed an improved optimizer on LSTM to predict the crop yield that depends on the monsoon rainfall in Andhra Pradesh. Using the essential features, predicted the Kharif crops in Andhra Pradesh like paddy, sugar cane, red gram, and maize. This study used rainfall parameters only to predict crop yield. We exhibited the IOFLSTM algorithm for country-level crop yield prediction based on the historical rainfall data collected from the Andhra Pradesh government websites.
Some studies implemented both CNN and RNN to forecast crop yield by considering the climate [24]. This was achieved by implementing the Gaussian process component into CNN and LSTM and the Caffe-based deep learning regression model to forecast crop yield at the country level [25,26]. Other data-centric deep learning modeling techniques such as the CNN model implementation from RGB data can effectively forecast crop yield [27,28]. The novelty of the proposed algorithm by coupling LSTM with IOF optimization has produced a tremendous performance compared with other existing optimizers. For instance, the authors of [29] have implemented the simple LSTM model to predict the tomato crop and ficus Benjamina stem growth by considering the environmental parameters. With the implementation of CNN, RNN models forecast the crop yield at the country level by considering the spatial parameters and the phenological characteristics [30].
Our study is in line with the study by Japneet Kaur et al. [31] that used the state-level dataset of the Indian major crop paddy, wheat, sugarcane, and cotton from 2004 to 2013. We considered various climatic conditions from the seven states and analyzed the impact of climate change on food security and Indian agriculture. In deep learning, optimization is a process that iteratively reduces error and improves accuracy. Overfitting is a significant issue in deep neural networks, and there are various optimization techniques to improve the performance. So, including optimization modeling reduces the loss and processing time by fitting the function appropriately on the training data and avoiding overfitting. This research proposed an improved optimization function to predict crop yield so that it reduces forecasting errors by tuning the hyperparameters in the deep learning models [32] and finding the optimal values for the hyperparameters [33].
Furthermore, to extend the proposed model, we would like to train our model not only with a greater number of training data but also to increase the diversity concerning the types of crops, thereby enabling our research to perform better forecasts among all seasons. This will make our model more generic, enabling the automated task to work at its best in different farming regions. Future work will be on fuzzy-based deep learning on crop yield [34] and will improve the classifier as proposed in [35]. This scope of future work will focus on the advancement of tools that can be used in the field where there are major challenges, which in turn leads us to anticipate the necessity for better segmentation algorithms. In addition, a detailed evaluation of the features extracted from different pre-trained models of the deep learning platforms is needed, as well as gauging the excellence of these features. Additionally, the model architecture will be further advanced toward upgrading the performance of the prediction model.
5. Conclusions
The proposed work can be beneficial to evade difficulties and get the best yield from the rainfall and climatic parameters. The performance metrics with IOFLSTM achieved r of 0.48, RMSE of 2.19, and MAE of 25.4, with the best performance in the crop yield forecast. We compared the proposed optimizer IOF with eight standard methods of learning. The comparison reveals that the training error is small in IOF and handles the underfitting and overfitting issues. IOF gradually decreases the error to the minimum values and updates the parameters, and IOF effectively performs best for higher learning rates on a high dimensional dataset and converges to the global minimum. IOF works efficiently for the high dimensional dataset and converges for the specified number of epochs with high learning rates with the slightest error. We compared the proposed optimizer IOF with the standard optimizers, proving that it is suitable for predicting crop yield, and it avoids overfitting by efficiently managing the bias-variance tradeoffs.
Author Contributions
Conceptualization, U.B. and G.B.; methodology, U.B.; software, N.C.; validation, U.B. and G.B.; formal analysis, U.B.; investigation, U.B.; resources, G.B.; data curation, U.B.; writing—original draft preparation, U.B.; writing—review and editing, U.B. and G.B.; visualization, U.B. All authors have read and agreed to the published version of the manuscript.
Funding
This research received no external funding.
Data Availability Statement
Not applicable.
Conflicts of Interest
The authors declare no conflict of interest.
References
- Wang, E.; Martre, P.; Zhao, Z.; Ewert, F.; Maiorano, A.; Rötter, R.P.; Kimball, B.; Ottman, M.; Wall, G.; White, J.; et al. The uncertainty of crop yield projections is reduced by improved temperature response functions. Nat. Plants 2017, 3, 17102. [Google Scholar] [CrossRef] [PubMed] [Green Version]
- Annual Report 2020–21, Department of Agriculture, Cooperation and Farmers Welfare, Ministry of Agriculture and Farmers Welfare, Government of India. Available online: www.agricoop.nic.in (accessed on 23 May 2021).
- Sharifi, A. Yield prediction with machine learning algorithms and satellite images. J. Sci. Food Agric. 2020, 101, 891–896. [Google Scholar] [CrossRef] [PubMed]
- Obsie, E.Y.; Qu, H.; Drummond, F. Wild blueberry yield prediction using a combination of computer simulation and machine learning algorithms. Comput. Electron. Agric. 2020, 178, 105778. [Google Scholar] [CrossRef]
- Wu, R.; Yan, S.; Shan, Y.; Dang, Q.; Sun, G. Deep image: Scaling up image recognition. arXiv 2015, arXiv:1501.02876. [Google Scholar]
- Miotto, R.; Li, L.; Dudley, J.T. Deep learning to predict patient future diseases from the electronic health records. In European Conference on Information Retrieval; Springer: Cham, Switzerland, 2016; pp. 768–774. [Google Scholar]
- Cai, Y.; Guan, K.; Peng, J.; Wang, S.; Seifert, C.; Wardlow, B.; Li, Z. A high-performance and in-season classification system of field-level crop types using time-series Landsat data and a machine learning approach. Remote Sens. Environ. 2018, 210, 35–47. [Google Scholar] [CrossRef]
- Khaki, S.; Wang, L. Crop Yield Prediction Using Deep Neural Networks. Front. Plant Sci. 2019, 10, 621. [Google Scholar] [CrossRef] [PubMed] [Green Version]
- Ehret, D.L.; Hill, B.D.; Helmer, T.; Edwards, D.R. Neural network modeling of greenhouse tomato yield, growth and water use from automated crop monitoring data. Comput. Electron. Agric. 2011, 79, 82–89. [Google Scholar] [CrossRef]
- Gholipoor, M.; Nadali, F. Fruit yield prediction of pepper using artificial neural network. Sci. Hortic. 2019, 250, 249–253. [Google Scholar] [CrossRef]
- Salazar, R.; López, I.; Rojano, A.; Schmidt, U.; Dannehl, D. Tomato yield prediction in a semi-closed greenhouse. In Proceedings of the XXIX International Horticultural Congress on Horticulture: Sustaining Lives, Livelihoods and Landscapes (IHC2014), Brisbane, Australia, 17 August 2014; pp. 263–270, 1107. [Google Scholar]
- Elavarasan, D.; Vincent, P.M.D. Crop Yield Prediction Using Deep Reinforcement Learning Model for Sustainable Agrarian Applications. IEEE Access 2020, 8, 86886–86901. [Google Scholar] [CrossRef]
- Sun, J.; Di, L.; Sun, Z.; Shen, Y.; Lai, Z. County-Level Soybean Yield Prediction Using Deep CNN-LSTM Model. Sensors 2019, 19, 4363. [Google Scholar] [CrossRef] [PubMed] [Green Version]
- Chen, Y.; Lee, W.S.; Gan, H.; Peres, N.; Fraisse, C.; Zhang, Y.; He, Y. Strawberry Yield Prediction Based on a Deep Neural Network Using High-Resolution Aerial Orthoimages. Remote Sens. 2019, 11, 1584. [Google Scholar] [CrossRef]
- Russello, H.; Wenling, S. Convolutional Neural Networks for Crop Yield Prediction Using Satellite Images; IBM Center for Advanced Studies: Armonk, NY, USA, 2018. [Google Scholar]
- Kulkarni, S.; Mandal, S.N.; Sharma, G.S.; Mundada, M.R.; Meeradevi. Predictive Analysis to Improve Crop Yield using a Neural Network Model. In Proceedings of the 2018 International Conference on Advances in Computing, Communications and Informatics (ICACCI), Bangalore, India, 19–22 September 2018; pp. 74–79. [Google Scholar]
- Jiang, Z.; Liu, C.; Hendricks, N.P.; Ganapathysubramanian, B.; Hayes, D.J.; Sarkar, S. Predicting county level corn yields using deep long short term memory models. arXiv 2018, arXiv:1805.12044. [Google Scholar]
- Haider, S.A.; Naqvi, S.R.; Akram, T.; Umar, G.A.; Shahzad, A.; Sial, M.R.; Khaliq, S.; Kamran, M. LSTM Neural Network Based Forecasting Model for Wheat Production in Pakistan. Agronomy 2019, 9, 72. [Google Scholar] [CrossRef] [Green Version]
- Indian Metrological Department. Available online: https://www.imd.gov.in (accessed on 7 May 2021).
- Central Pollution Control Board. Available online: https://www.cpcb.gov.in (accessed on 7 May 2021).
- India Crop Production—State Wise. Available online: https://data.world/thatzprem/agriculture-india (accessed on 10 May 2021).
- Zhang, Z. Improved Adam Optimizer for Deep Neural Networks. In Proceedings of the 2018 IEEE/ACM 26th International Symposium on Quality of Service (IWQoS), Banff, AB, Canada, 4–6 June 2018; pp. 1–2. [Google Scholar] [CrossRef]
- Hochreiter, S.; Schmidhuber, J. Long short-term memory. Neural Comput. 1997, 9, 1735–1780. [Google Scholar] [CrossRef] [PubMed]
- Ma, J.W.; Nguyen, C.H.; Lee, K.; Heo, J. Regional-scale rice-yield estimation using stacked auto-encoder with climatic and MODIS data: A case study of South Korea. Int. J. Remote Sens. 2019, 40, 51–71. [Google Scholar] [CrossRef]
- You, J.; Li, X.; Low, M.; Lobell, D.; Ermon, S. Deep gaussian process for crop yield prediction based on remote sensing data. In Proceedings of the Thirty-First AAAI Conference on Artificial Intelligence, San Francisco, CA, USA, 4–9 February 2017. [Google Scholar]
- Kuwata, K.; Shibasaki, R. Estimating crop yields with deep learning and remotely sensed data. In Proceedings of the 2015 IEEE International Geoscience and Remote Sensing Symposium (IGARSS), Milan, Italy, 26–31 July 2015; pp. 858–861. [Google Scholar]
- Nevavuori, P.; Narra, N.; Lipping, T. Crop yield prediction with deep convolutional neural networks. Comput. Electron. Agric. 2019, 163, 104859. [Google Scholar] [CrossRef]
- Yang, Q.; Shi, L.; Han, J.; Zha, Y.; Zhu, P. Deep convolutional neural networks for rice grain yield estimation at the ripening stage using UAV-based remotely sensed images. Field Crop. Res. 2019, 235, 142–153. [Google Scholar] [CrossRef]
- Alhnaity, B.; Pearson, S.; Leontidis, G.; Kollias, S. Using deep learning to predict plant growth and yield in greenhouse environments. In Proceedings of the International Symposium on Advanced Technologies and Management for Innovative Greenhouses: GreenSys2019, Angers, France, 16–20 June 2019; pp. 425–432, 1296. [Google Scholar]
- Shi, X.; Chen, Z.; Wang, H.; Yeung, D.Y.; Wong, W.K.; Woo, W.C. Convolutional LSTM network: A machine learning approach for precipitation nowcasting. In Proceedings of the Advances in Neural Information Processing Systems, Montreal, QC, Canada, 7–12 December 2015; p. 28. [Google Scholar]
- Kar, S.; Das, N. Climate Change, Agricultural Production, and Poverty in India. In Poverty Reduction Policies and Practices in Developing Asia. Economic Studies in Inequality, Social Exclusion and Well-Being; Heshmati, A., Maasoumi, E., Wan, G., Eds.; Springer: Singapore, 2015. [Google Scholar] [CrossRef] [Green Version]
- Yang, J.; Yang, G. Modified Convolutional Neural Network Based on Dropout and the Stochastic Gradient Descent Optimizer. Algorithms 2018, 11, 28. [Google Scholar] [CrossRef] [Green Version]
- Bello, I.; Zoph, B.; Vasudevan, V.; Le, Q.V. Neural optimizer search with reinforcement learning. In Proceedings of the International Conference on Machine Learning, PMLR, Sydney, Australia, 6–11 August 2017; pp. 459–468. [Google Scholar]
- Elavarasan, D.; Durai Raj Vincent, P.M. Fuzzy deep learning-based crop yield prediction model for sustainable agronomical frameworks. Neural Comput. Appl. 2021, 33, 13205–13224. [Google Scholar] [CrossRef]
- Elavarasan, D.; Vincent, P.M.D.R. A reinforced random forest model for enhanced crop yield prediction by integrating agrarian parameters. J. Ambient. Intell. Humaniz. Comput. 2021, 12, 10009–10022. [Google Scholar] [CrossRef]
Figure 1.
Crop yield data.
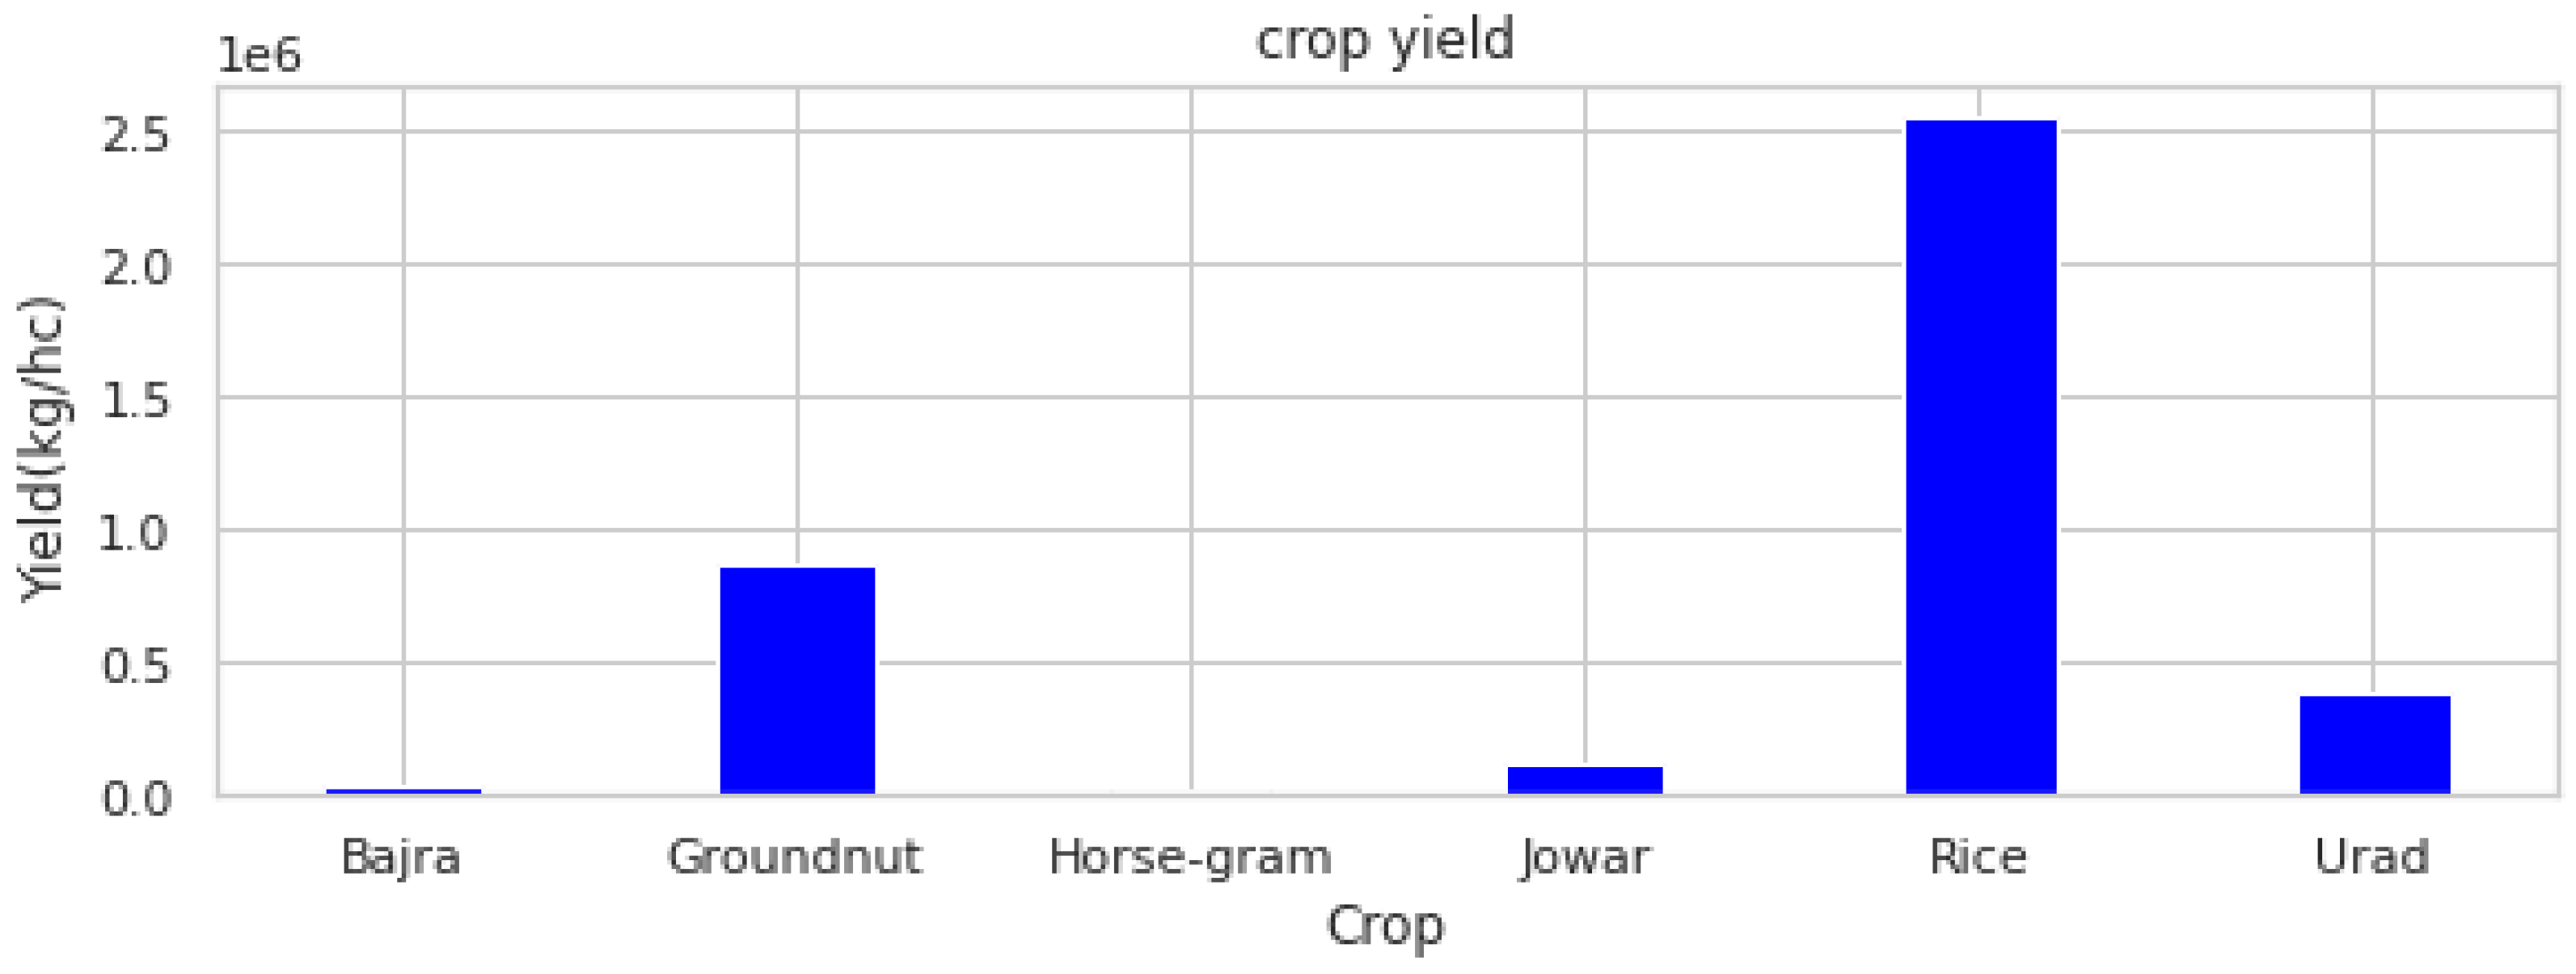
Figure 2.
The LSTM functionality representation.

Figure 3.
Flow chart for the IOF-LSTM.
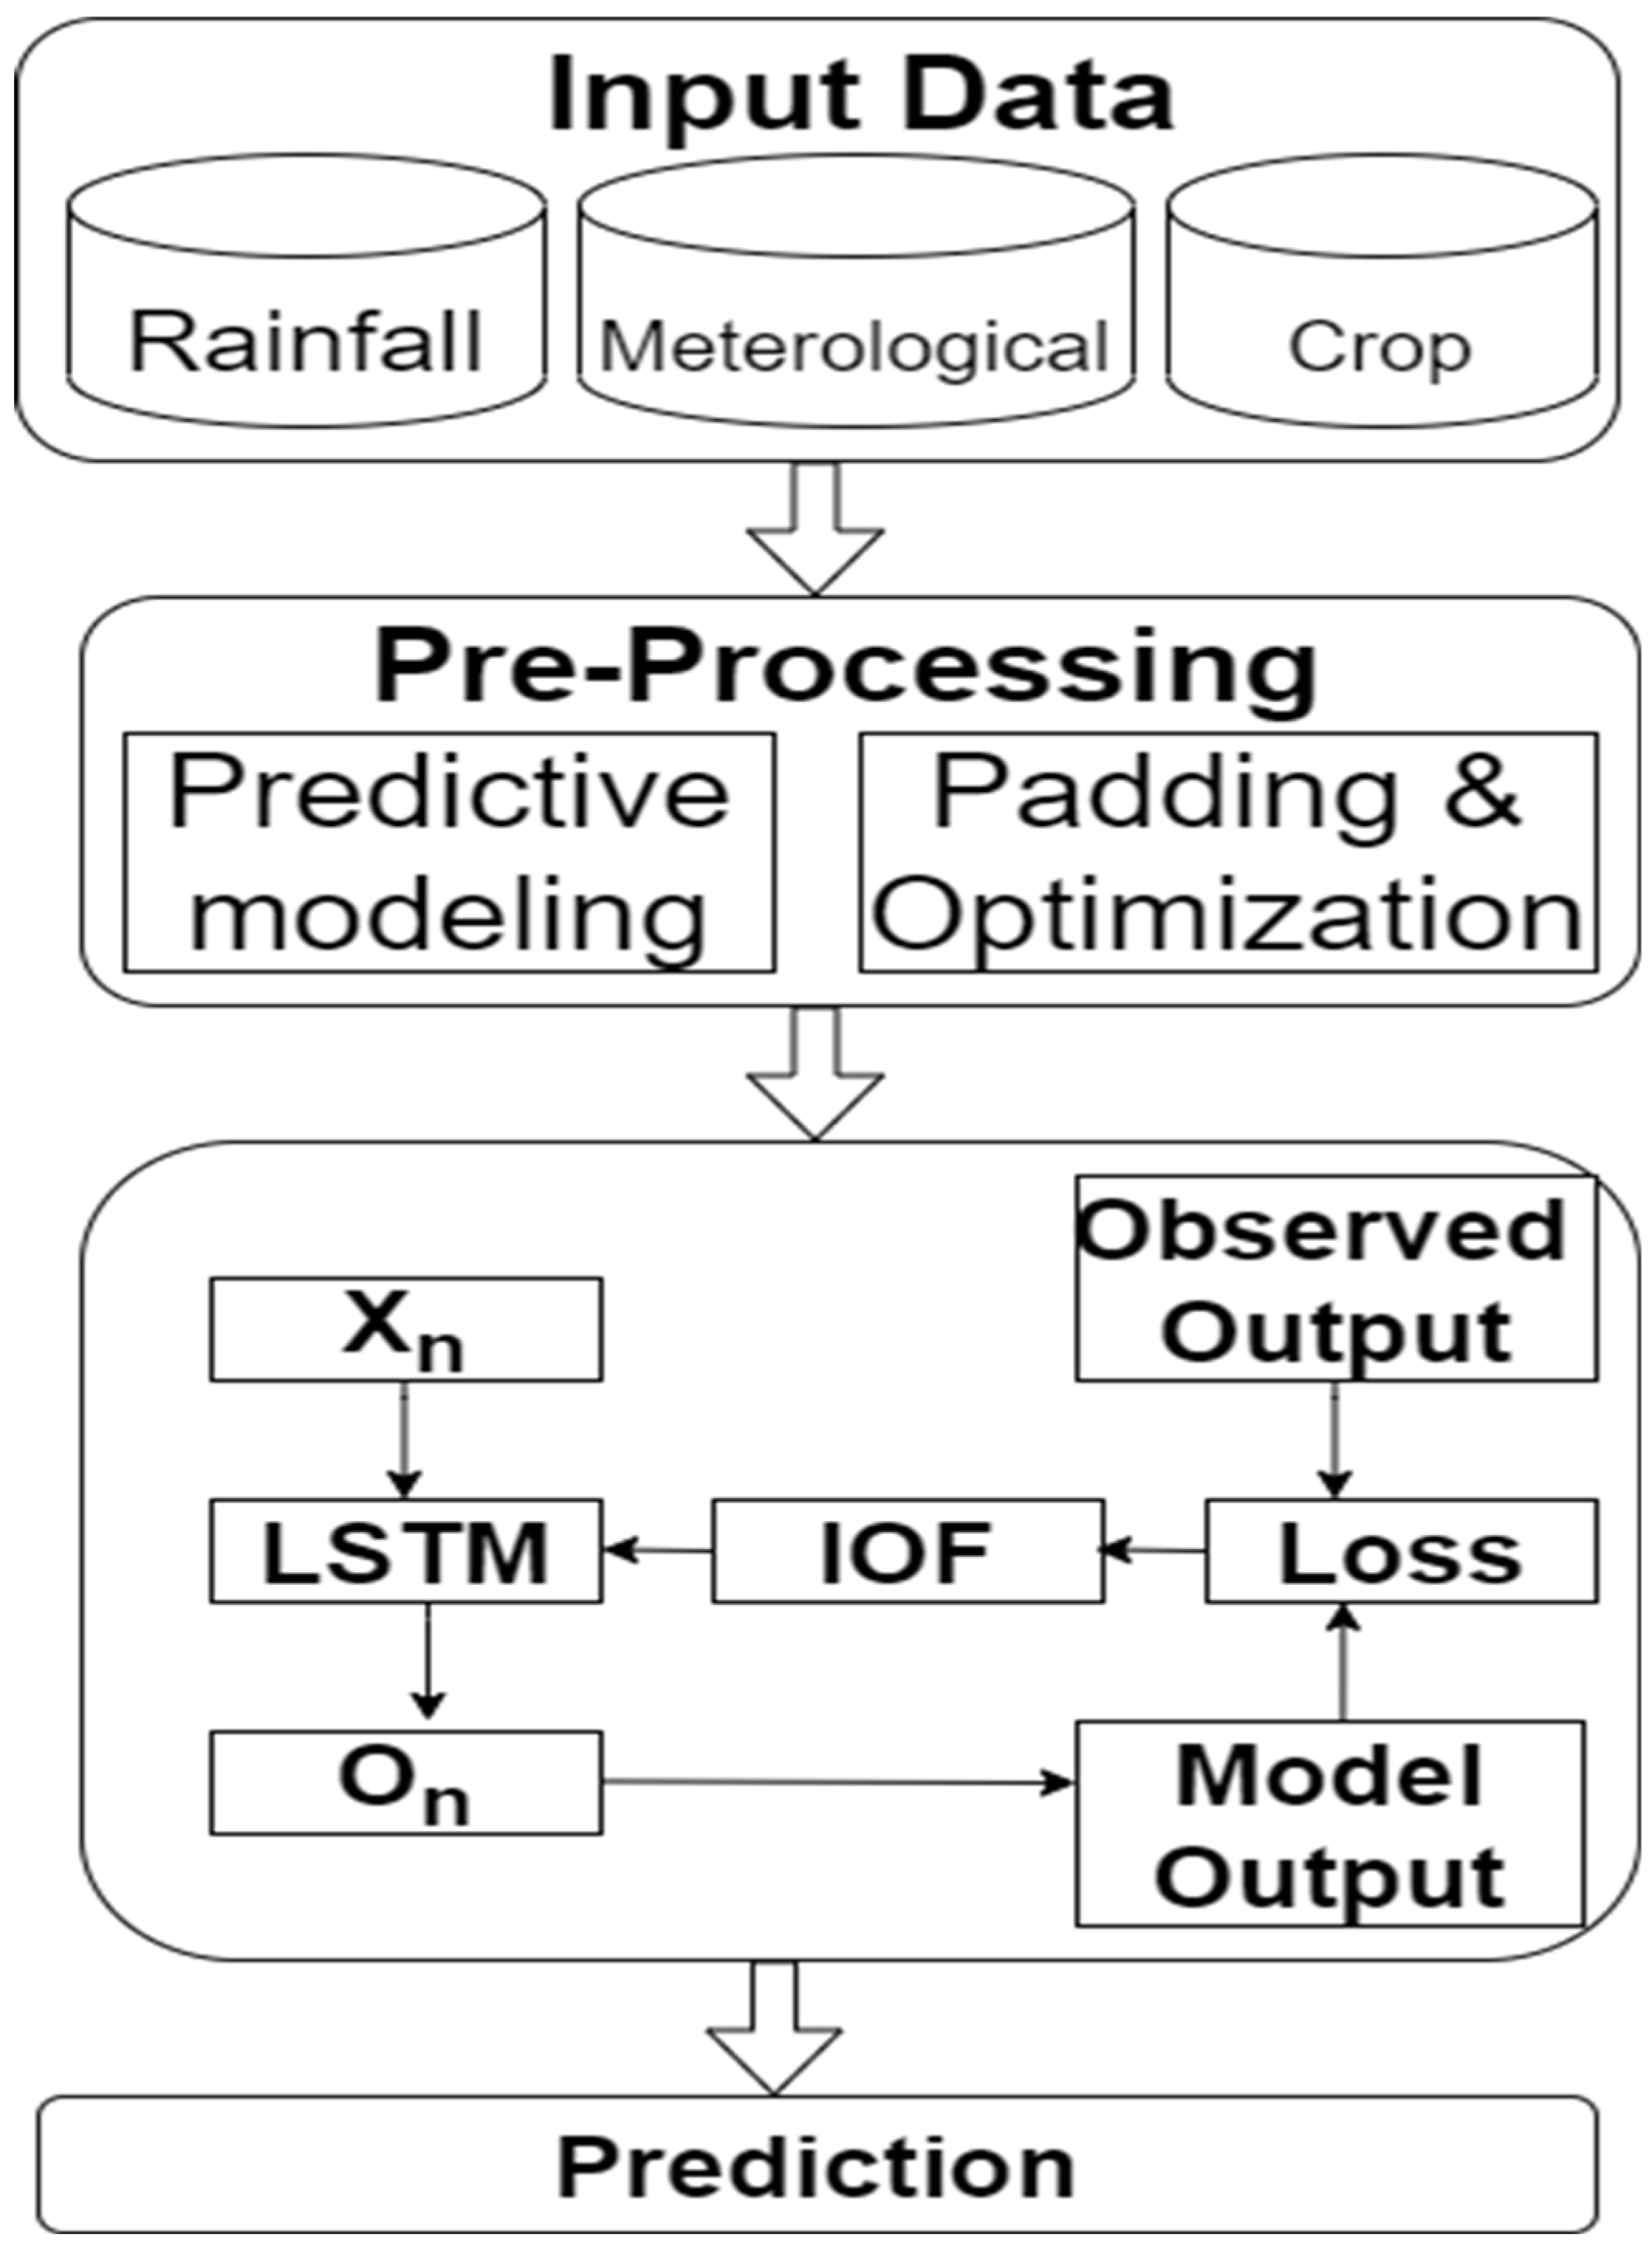
Figure 4.
Temperature and rainfall prediction for the year 2021. (a) Temperature and (b) Rainfall.

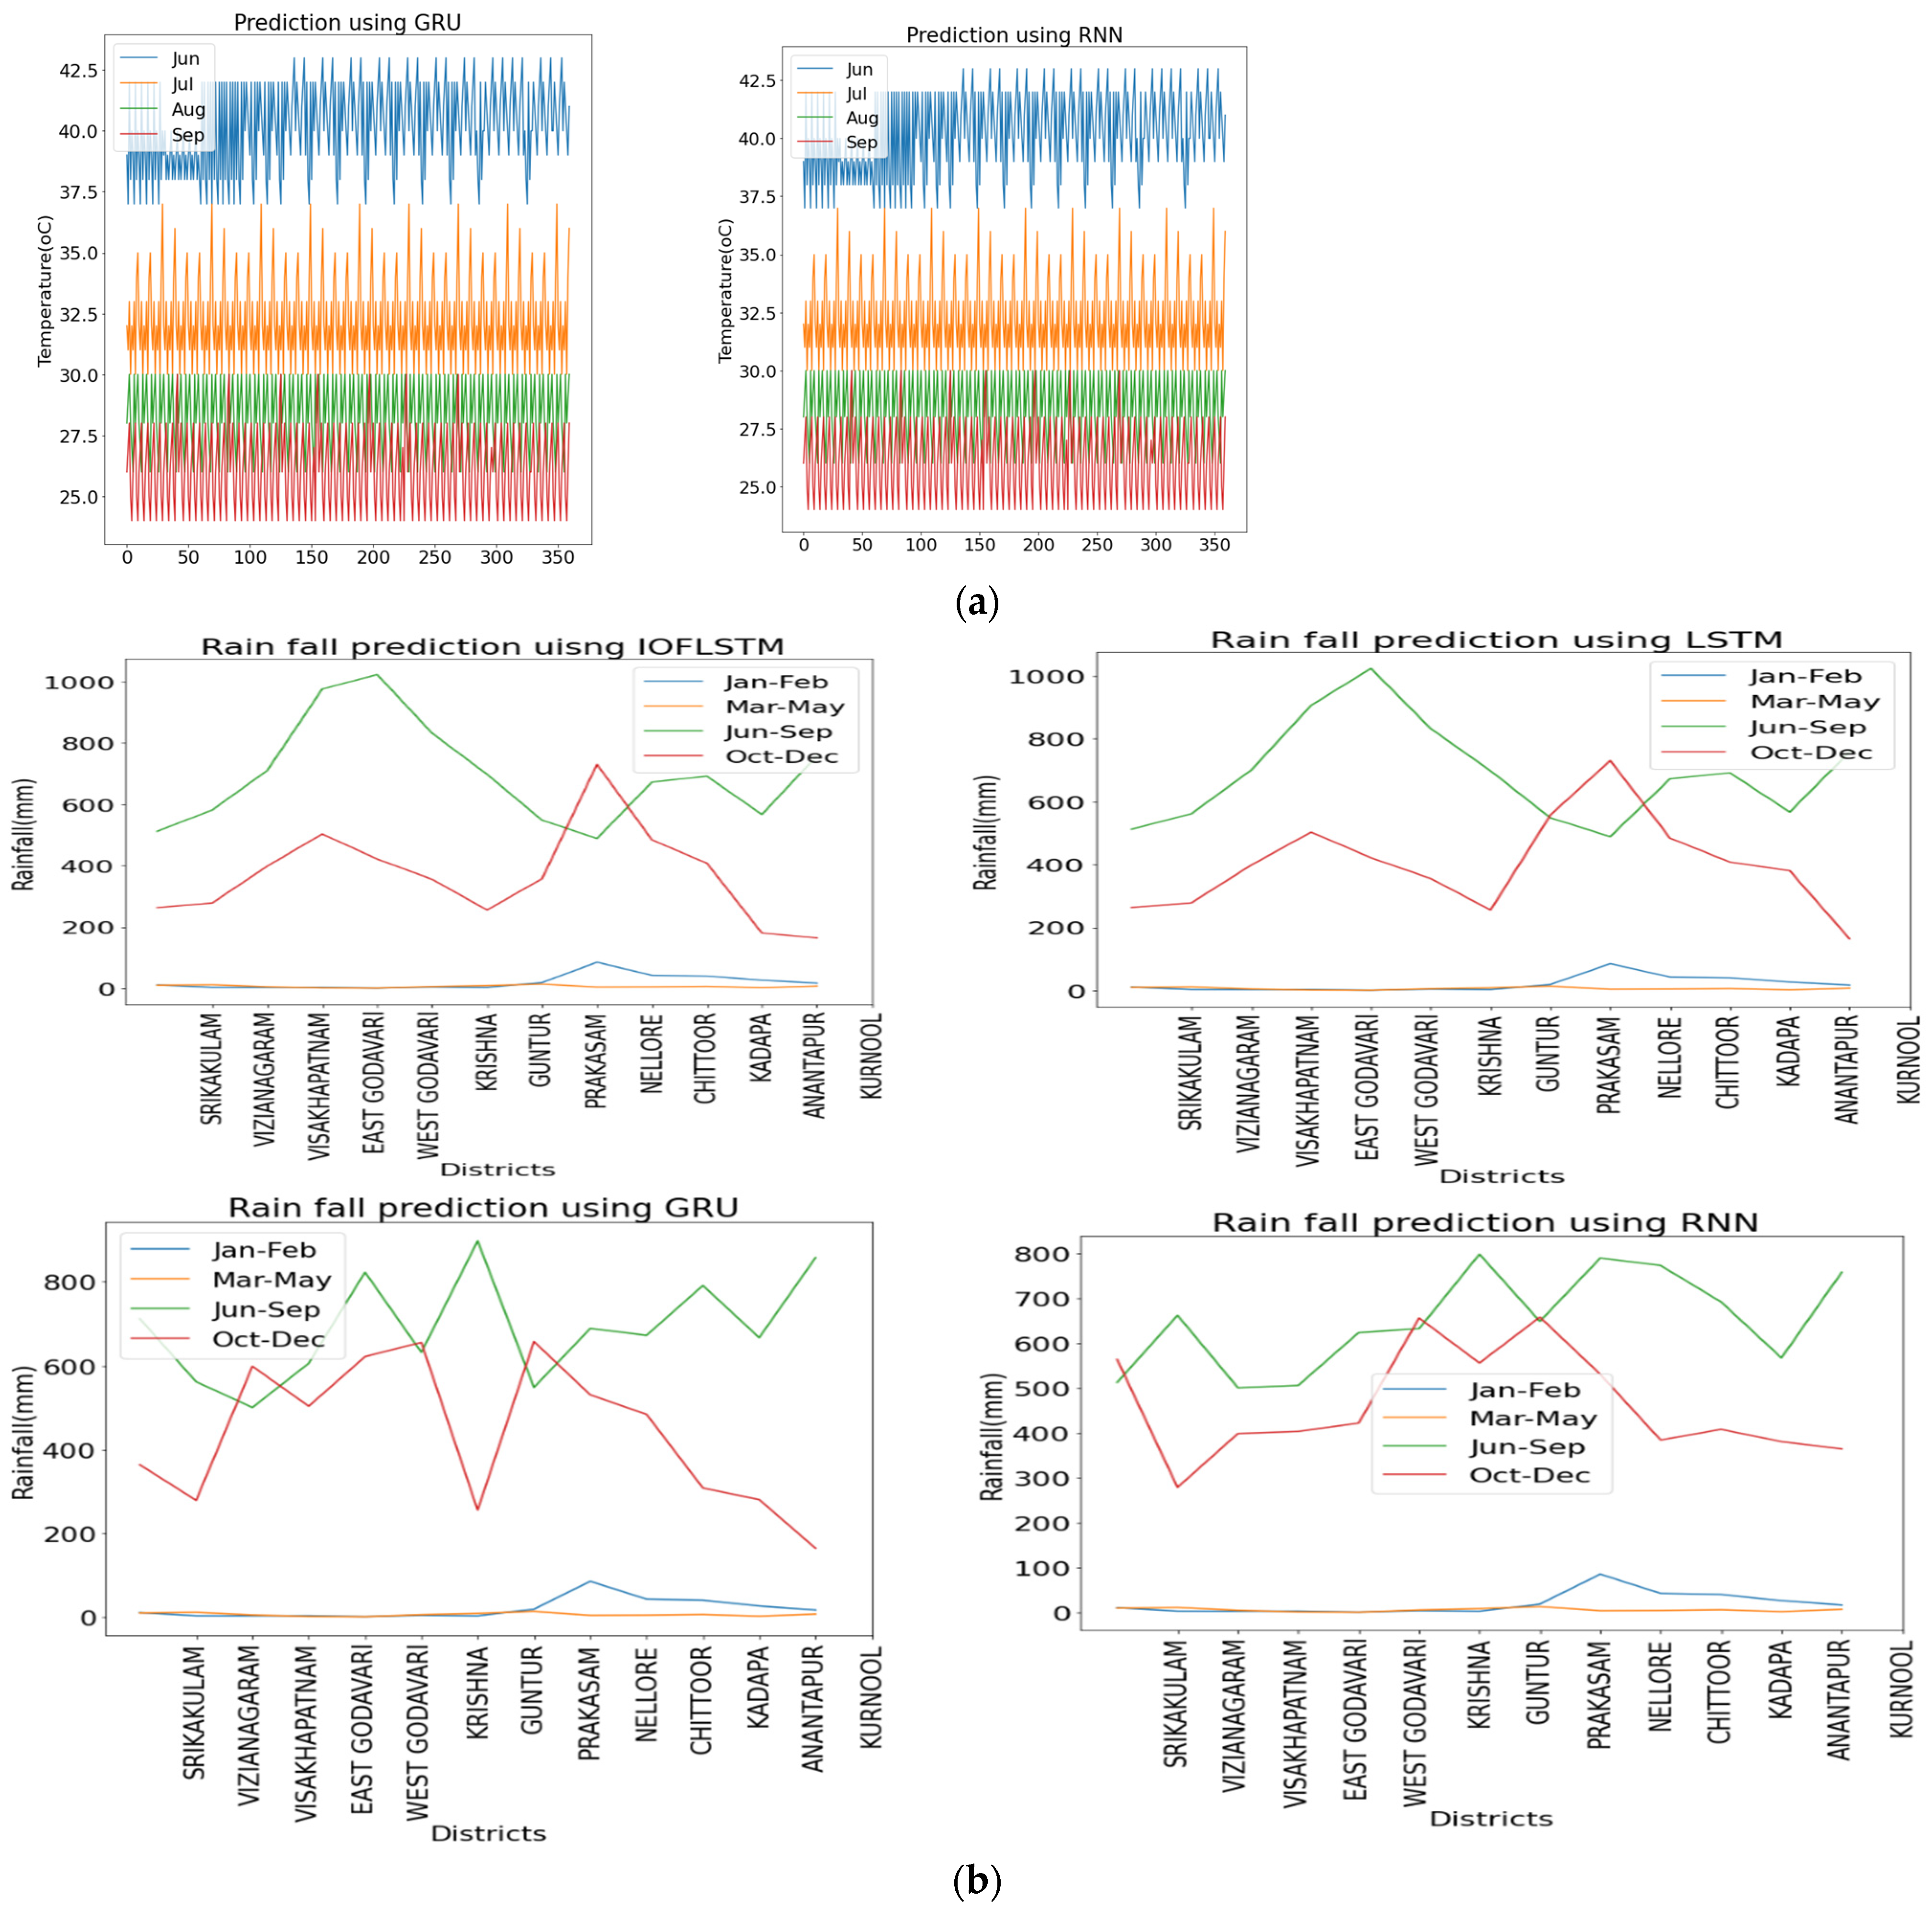
Figure 5.
Crop yield prediction (million tons per hectare) for major crops for districts in Andhra Pradesh from 2017 to 2020.
Figure 5.
Crop yield prediction (million tons per hectare) for major crops for districts in Andhra Pradesh from 2017 to 2020.

Figure 6.
Prediction of crop yield for the year 2021 in Andhra Pradesh.

Figure 7.
Comparison of the proposed state-of-the-art deep learning models for crop yield prediction (million tons per hectare) from 2015 to 2021.
Figure 7.
Comparison of the proposed state-of-the-art deep learning models for crop yield prediction (million tons per hectare) from 2015 to 2021.

Figure 8.
Comparison of the proposed with the state-of-the-art optimizers.


Table 1.
Dataset features used in this study.
| N | Feature | Unit of Measurement |
|---|---|---|
| 1 | Min. temperature | °C |
| 2 | Max. temperature | °C |
| 3 | Avg. temperature | °C |
| 4 | Total rainfall | mm |
| 5 | Humidity | % |
| 6 | Solar radiance | w/m2 |
| 7 | Southwest monsoon rainfall | mm |
| 8 | Northeast monsoon rainfall | mm |
| 9 | Production | kg/hectare |
| 10 | Pest standing crop | Paddy, wheat, jowar, bajra … |
| 11 | District pest affected | Krishna, Guntur, … |
| 12 | Pest affected area | Hectares |
| 13 | Area treated | Hectares |
| 14 | Seasonal crop yield | Tones in millions |
| 15 | Total pulses | % |
| 16 | Total food grains | % |
| 17 | Total oilseeds | % |
| 18 | Total cropped area | Area in lakh hectares |
| 19 | Target sown area | Area in lakh hectares |
| 20 | District | Krishna, Guntur, … |
| 21 | Seasonal sown area | Area in lakh hectares |
| 22 | Seasonal area under production | Area in lakh hectares |
| 23 | Total yield | Tones in millions |
| 24 | Cropping season | Kharif or rabi |
| 25 | Crop | Paddy, wheat, jowar, bajra … |
| 26 | Total crop yield | kg/hectare |
Table 2.
Comparison of various deep learning models for crop yield prediction (million tons per hectare) from 2010 to 2020.
Table 2.
Comparison of various deep learning models for crop yield prediction (million tons per hectare) from 2010 to 2020.
| Year | CNN+ Adam | LSTM+ Adam | CNNLSTM+ Adam | GRU+ Adam | IOFLSTM | Observed |
|---|---|---|---|---|---|---|
| 2010 | 215.13 | 215.34 | 217.17 | 216.18 | 218.06 | 218.11 |
| 2011 | 246.44 | 245.56 | 244.33 | 245.43 | 244.44 | 244.49 |
| 2012 | 259.22 | 255.67 | 258.75 | 258.25 | 259.20 | 259.29 |
| 2013 | 257.18 | 258.67 | 256.86 | 256.16 | 256.56 | 257.12 |
| 2014 | 162.41 | 163.44 | 164.95 | 166.45 | 164.05 | 165.05 |
| 2015 | 250.54 | 252.76 | 252.16 | 251.56 | 252.07 | 252.02 |
| 2016 | 253.64 | 255.78 | 253.75 | 253.65 | 251.22 | 251.54 |
| 2017 | 272.15 | 274.54 | 275.05 | 274.15 | 274.67 | 275.11 |
| 2018 | 281.58 | 283.87 | 286.04 | 286.54 | 284.51 | 285.01 |
| 2019 | 282.59 | 283.22 | 284.16 | 284.56 | 285.31 | 285.21 |
| 2020 | 291.29 | 292.32 | 295.03 | 294.23 | 295.17 | 295.67 |
Table 3.
Comparison of various optimizers for crop yield prediction (million tons per hectare) from 2010 to 2020.
Table 3.
Comparison of various optimizers for crop yield prediction (million tons per hectare) from 2010 to 2020.
| Year | LSTM+ SGD | LSTM+ AdaGrad | LSTM+ RMSP | LSTM+ Adam | LSTM+ Momentum | IOFLSTM | Observed |
|---|---|---|---|---|---|---|---|
| 2010 | 214.45 | 216.54 | 212.85 | 215.34 | 214.05 | 218.06 | 218.11 |
| 2011 | 244.85 | 247.84 | 247.42 | 245.56 | 246.91 | 244.44 | 244.49 |
| 2012 | 256.29 | 252.89 | 254.26 | 255.67 | 257.29 | 259.20 | 259.29 |
| 2013 | 257.20 | 254.25 | 256.18 | 258.67 | 259.92 | 256.56 | 257.12 |
| 2014 | 166.84 | 167.68 | 164.29 | 163.44 | 165.08 | 164.05 | 165.05 |
| 2015 | 250.30 | 259.29 | 254.90 | 252.76 | 253.20 | 252.07 | 252.02 |
| 2016 | 252.20 | 257.52 | 250.04 | 255.78 | 250.23 | 251.22 | 251.54 |
| 2017 | 273.29 | 272.19 | 272.82 | 274.54 | 273.91 | 274.67 | 275.11 |
| 2018 | 282.19 | 289.39 | 281.02 | 283.87 | 284.61 | 284.51 | 285.01 |
| 2019 | 282.84 | 280.27 | 283.19 | 283.22 | 282.09 | 285.31 | 285.21 |
| 2020 | 290.73 | 297.85 | 291.94 | 292.32 | 293.75 | 295.17 | 295.67 |
Table 4.
Comparison of performance statistics for major crops in Andhra Pradesh.
| Crop | Metrics | RNN | LSTM | GRU | CNN | IOFLSTM |
|---|---|---|---|---|---|---|
| Paddy | MAE | 0.917 | 0.878 | 0.893 | 1.005 | 0.802 |
| RMSE | 1.243 | 1.211 | 1.221 | 1.868 | 1.145 | |
| r | 0.983 | 0.972 | 0.984 | 0.964 | 0.992 | |
| Red gram | MAE | 1.320 | 1.297 | 1.319 | 1.457 | 0.951 |
| RMSE | 3.036 | 3.039 | 3.044 | 3.545 | 2.879 | |
| r | 0.983 | 0.983 | 0.983 | 0.977 | 0.993 | |
| Sugarcane | MAE | 1.531 | 1.522 | 1.526 | 1.549 | 0.912 |
| RMSE | 2.035 | 2.045 | 2.032 | 2.065 | 1.948 | |
| r | 0.981 | 0.981 | 0.981 | 0.981 | 0.995 | |
| Cereals | MAE | 1.669 | 1.737 | 1.662 | 1.678 | 0.954 |
| RMSE | 2.248 | 2.332 | 2.242 | 2.273 | 2.045 | |
| r | 0.987 | 0.986 | 0.987 | 0.986 | 0.995 | |
| Pulses | MAE | 0.053 | 0.052 | 0.053 | 0.054 | 0.051 |
| RMSE | 0.074 | 0.074 | 0.074 | 0.077 | 0.069 | |
| r | 0.978 | 0.978 | 0.978 | 0.976 | 0.995 | |
| Groundnut | MAE | 1.198 | 1.157 | 1.899 | 1.937 | 0.936 |
| RMSE | 2.530 | 2.480 | 2.532 | 2.570 | 2.315 | |
| r | 0.990 | 0.990 | 0.990 | 0.989 | 0.997 | |
| Chilli | MAE | 1.228 | 1.211 | 1.226 | 1.341 | 0.994 |
| RMSE | 1.604 | 1.584 | 1.604 | 2.255 | 1.513 | |
| r | 0.983 | 0.983 | 0.983 | 0.967 | 0.993 |
Table 5.
Performance statistics of 13 states of AP using IOFLSTM.
| District | LSTM | GRU | IOFLSTM | ||||||
|---|---|---|---|---|---|---|---|---|---|
| MAE | RMSE | r | MAE | RMSE | r | MAE | RMSE | r | |
| Anantapur | 1.96 | 5.23 | 0.90 | 1.89 | 6.78 | 0.92 | 1.82 | 3.11 | 0.93 |
| Chittoor | 1.82 | 4.24 | 0.91 | 1.76 | 3.25 | 0.90 | 1.53 | 1.08 | 0.95 |
| East Godavari | 1.24 | 2.24 | 0.99 | 1.89 | 2.78 | 0.99 | 1.03 | 2.43 | 0.98 |
| Guntur | 1.46 | 4.25 | 0.99 | 1.31 | 3.67 | 0.90 | 1.27 | 2.22 | 0.97 |
| Kadapa | 1.56 | 1.46 | 0.92 | 1.43 | 1.01 | 0.91 | 1.31 | 2.31 | 0.96 |
| Krishna | 1.37 | 2.42 | 0.91 | 1.32 | 2.31 | 0.92 | 1.13 | 1.26 | 0.95 |
| Kurnool | 1.56 | 4.25 | 0.94 | 1.49 | 3.93 | 0.93 | 1.35 | 2.63 | 0.94 |
| Nellore | 1.82 | 5.61 | 0.91 | 1.76 | 5.32 | 0.91 | 1.49 | 2.42 | 0.94 |
| Prakasam | 1.49 | 5.63 | 0.90 | 1.63 | 4.63 | 0.91 | 1.42 | 2.45 | 0.96 |
| Srikakulam | 1.40 | 5.92 | 0.91 | 1.31 | 5.72 | 0.90 | 1.05 | 2.15 | 0.98 |
| Visakhapatnam | 1.37 | 5.21 | 0.92 | 1.43 | 4.96 | 0.91 | 1.18 | 2.73 | 0.91 |
| Vijayanagaram | 1.93 | 8.35 | 0.94 | 1.21 | 7.92 | 0.93 | 1.34 | 3.32 | 0.99 |
| West Godavari | 1.37 | 6.25 | 0.92 | 1.95 | 5.84 | 0.795 | 1.16 | 4.28 | 0.99 |
Table 6.
Comparison of various statistical measures for crop yield prediction (million tons per hectare) from 2010 to 2020.
Table 6.
Comparison of various statistical measures for crop yield prediction (million tons per hectare) from 2010 to 2020.
| Crop | Metrics | MLR | ANOVA | SVR | PLSR | IOFLSTM |
|---|---|---|---|---|---|---|
| Paddy | MAE | 0.907 | 0.956 | 0.914 | 1.005 | 0.802 |
| RMSE | 1.149 | 1.225 | 1.151 | 1.869 | 1.145 | |
| r | 0.989 | 0.971 | 0.987 | 0.964 | 0.992 | |
| MASE | 0.682 | 0.977 | 0.755 | 1.245 | 0.215 | |
| Red gram | MAE | 2.223 | 2.257 | 2.367 | 2.684 | 0.951 |
| RMSE | 2.890 | 3.134 | 2.896 | 3.321 | 2.879 | |
| r | 0.990 | 0.981 | 0.983 | 0.973 | 0.993 | |
| MASE | 0.894 | 1.153 | 0.986 | 1.198 | 0.455 | |
| Sugarcane | MAE | 1.528 | 1.548 | 1.530 | 1.569 | 0.912 |
| RMSE | 1.951 | 2.138 | 1.959 | 2.283 | 1.948 | |
| r | 0.991 | 0.985 | 0.989 | 0.971 | 0.995 | |
| MASE | 0.377 | 0.797 | 0.576 | 0.927 | 0.235 | |
| Cereals | MAE | 1.659 | 1.678 | 1.662 | 1.689 | 0.954 |
| RMSE | 2.248 | 2.332 | 2.242 | 2.373 | 2.045 | |
| r | 0.992 | 0.981 | 0.989 | 0.970 | 0.995 | |
| MASE | 0.424 | 0.736 | 0.515 | 0.836 | 0.314 | |
| Pulses | MAE | 0.054 | 0.072 | 0.056 | 0.074 | 0.051 |
| RMSE | 0.071 | 0.083 | 0.074 | 0.089 | 0.069 | |
| r | 0.993 | 0.981 | 0.990 | 0.974 | 0.995 | |
| MASE | 0.368 | 0.637 | 0.396 | 0.945 | 0.205 | |
| Groundnut | MAE | 1.841 | 1.863 | 1.845 | 1.945 | 0.936 |
| RMSE | 2.321 | 2.526 | 2.327 | 2.627 | 2.315 | |
| r | 0.994 | 0.984 | 0.990 | 0.979 | 0.997 | |
| MASE | 0.473 | 0.737 | 0.516 | 0.978 | 0.344 | |
| Chilli | MAE | 1.208 | 1.236 | 1.210 | 1.348 | 0.994 |
| RMSE | 1.527 | 1.670 | 1.531 | 1.738 | 1.513 | |
| r | 0.990 | 0.983 | 0.988 | 0.977 | 0.993 | |
| MASE | 0.357 | 0.583 | 0.389 | 0.847 | 0.248 |
Disclaimer/Publisher’s Note: The statements, opinions and data contained in all publications are solely those of the individual author(s) and contributor(s) and not of MDPI and/or the editor(s). MDPI and/or the editor(s) disclaim responsibility for any injury to people or property resulting from any ideas, methods, instructions or products referred to in the content. |
© 2023 by the authors. Licensee MDPI, Basel, Switzerland. This article is an open access article distributed under the terms and conditions of the Creative Commons Attribution (CC BY) license (https://creativecommons.org/licenses/by/4.0/).
Share and Cite
MDPI and ACS Style
Bhimavarapu, U.; Battineni, G.; Chintalapudi, N. Improved Optimization Algorithm in LSTM to Predict Crop Yield. Computers 2023, 12, 10. https://doi.org/10.3390/computers12010010
AMA Style
Bhimavarapu U, Battineni G, Chintalapudi N. Improved Optimization Algorithm in LSTM to Predict Crop Yield. Computers. 2023; 12(1):10. https://doi.org/10.3390/computers12010010
Chicago/Turabian StyleBhimavarapu, Usharani, Gopi Battineni, and Nalini Chintalapudi. 2023. "Improved Optimization Algorithm in LSTM to Predict Crop Yield" Computers 12, no. 1: 10. https://doi.org/10.3390/computers12010010
Note that from the first issue of 2016, this journal uses article numbers instead of page numbers. See further details here.