
Enhancing Carsharing Experiences for Barcelona Citizens with Data Analytics and Intelligent Algorithms


1
Department of Computer Science, Universitat Oberta de Catalunya, 08018 Barcelona, Spain
2
Department of Telecommunication and System Engineering, Universitat Autònoma de Barcelona, 08202 Sabadell, Spain
3
Department of Management, Universitat Politècnica de Catalunya, 08028 Barcelona, Spain
4
Department of Applied Statistics and Operations Research, Universitat Politècnica de València, 03801 Alcoi, Spain
5
Department of Management, Euncet Business School, 08225 Terrassa, Spain
*
Author to whom correspondence should be addressed.
Computers 2023, 12(2), 33; https://doi.org/10.3390/computers12020033
Submission received: 29 December 2022
/
Revised: 30 January 2023
/
Accepted: 1 February 2023
/
Published: 5 February 2023
(This article belongs to the Special Issue Sensors and Smart Cities 2023)
Abstract
:Carsharing practices are spreading across many cities in the world. This paper analyzes real-life data obtained from a private carsharing company operating in the city of Barcelona, Spain. After describing the main trends in the data, machine learning and time-series analysis methods are employed to better understand citizens’ needs and behavior, as well as to make predictions about the evolution of their demand for this service. In addition, an original proposal is made regarding the location of the pick-up points. This proposal is based on a capacitated dispersion algorithm, and aims at balancing two relevant factors, including scattering of pick-up points (so that most users can benefit from the service) and efficiency (so that areas with higher demand are well covered). Our aim is to gain a deeper understanding of citizens’ needs and behavior in relation to carsharing services. The analysis includes three main components: descriptive, predictive, and prescriptive, resulting in customer segmentation and forecast of service demand, as well as original concepts for optimizing parking station location.
1. Introduction
One of the characteristics of shared mobility is that vehicles are not necessarily owned by individual citizens, but they are shared among them using technology to connect users and providers [1]. Several models may be found: peer-to-peer provision with a company as a broker providing a platform, rental of vehicles managed and owned by a provider, and on-demand private vehicles shared by passengers going in a similar direction. During the last decade, there has been growing popularity of short-term rental systems (based on hours, days or weeks) of vehicles (e.g., cars-Zipcar, Car2Go, and bikes-Motivate) [2]. Shared mobility has the potential to make urban transportation systems more efficient from a social, environmental, and economic perspective. For instance, rental of cars managed and owned by a provider results in fewer cars (which reduces pollution and alleviates the lack of spaces for car parking) and increased usage of electric cars, as well as users saving money and having access to more types of cars. In relation to carsharing, there is a wide range of relevant and challenging decision-making processes that may be modeled as combinatorial optimization problems. First, these include design-related processes, such as choosing the number of stations to build, their location, and their capacity; then, planning-related processes, e.g., fleet-composition and market allocation for each station; finally, operations-related processes, including relocation of cars between stations and pricing (such as loyalty and punctuality discounts). Nowadays, private carsharing companies face growing competition in the sector, as well as pressing concerns from users regarding environmental and social impacts.
In order to increase their effectiveness and efficiency, companies can improve their decision-making processes by relying on statistics, machine learning, optimization, and simulation methods and techniques. Indeed, software on capturing, preprocessing, storing, and analyzing data is becoming increasingly affordable, while rich insights may be obtained from data related to current clients (demographic data, information regarding contracted services, etc.), potential clients, strategies from the competition, and urban traffic state, among others.
There are several methodologies to address optimization problems. The most popular include approximate methods [3], i.e., heuristics and metaheuristics, which have proved to be both efficient and capable of generating high-quality solutions for large-scale and complex real-world problems. Hybrid approaches have gained popularity recently, e.g., matheuristics (which use mathematical models during the heuristic design) [4], simheuristics (which use simulation techniques during the heuristic design to address stochasticity) [5], and learnheuristics (which use machine learning techniques during the heuristic design to address dynamic conditions) [6]. A promising framework relying on approximate methods is the so-called ‘agile optimization’ algorithm. These algorithms enable the processing of real-time data gathered from IoT systems in order to optimize automatic decisions in the city transportation system.
Optimization algorithms have been applied to dynamic ride-sharing problems [7], dynamic team orienteering problems [8], and real-time facility location problems in Internet of Vehicle scenarios [9], among others.
In this context, our work makes the following contributions: (i) descriptive, predictive, and prescriptive analyses based on data provided by a carsharing company operating in the city of Barcelona, with the aim of gaining a better understanding of citizens’ needs and behavior; (ii) based on the descriptive and predictive analyses, customer segmentation and forecast of service demands evolution; and (iii) original concepts are proposed in the prescriptive analysis in order to optimize the location of the parking stations, these concepts being related to modeling the location problem as a capacitated dispersion problem, the transformation of the Euclidean distances in order to account for population density, and the generation of new demand estimates. Barcelona is a city on the coast of northeastern Spain, the fifth most populous urban area in the European Union. It is the third city in the ranking of smart cities in the world according to Moar and Bainbridge [10].
The rest of the document is described next. Section 2 reviews recent literature on the optimization of carsharing experiences in smart cities. Section 3 explains the methodology of this work. Section 4 introduces the case study based on data from a carsharing company operating in Barcelona and explores the data using different visualization techniques. Section 5 describes customer segmentation, while Section 6 presents predictive models for demand forecasting. Building on the previous results, Section 7 addresses the need for finding a ‘balanced’ set of pick-up points, covering districts with a high demand as well as a large urban area. Finally, Section 8 draws relevant conclusions and identifies lines of future research.
2. Literature Review
Carsharing constitutes one of the most significant sustainable transportation concepts, which has been shown to improve urban mobility by allowing each car to be used more efficiently. Over the past few years, various optimization models and approaches have been proposed. Based on the level of the decisions involved in the optimization problems, Wu and Xu [11] propose a classification of the literature into three categories: strategic (decisions related to locations, amounts, and capacities of stations), tactical (fleet size and deployment, as well as staff size and deployment), and operational (vehicle relocation and trip price). The authors reviewed more than 70 articles, most of them from 2017 to 2021, related to modeling-based optimization problems arising from carsharing service operations. They propose that future research focuses on: (i) new decision-making problems arising from autonomous carsharing services (mainly because of the options of remote parking and en-route pick-up and drop-off); (ii) hybrid fleet type; (iii) (subjective) user behavior; (iv) joint implementation of operator-based vehicle relocation and user-based vehicle relocation strategies to address the vehicle imbalance problem; and (v) the trip pricing problem. This review highlights a large variety of solution methods in the literature, ranging from commercial solvers and exact methods to heuristics and metaheuristics, as well as an increasing trend of using massive historical data. Another recent literature review on carsharing, with a wider scope, is presented in Nansubuga and Kowalkowski [12]. It analyzes 279 papers published between 1996 and 2020, focusing on four key themes: business models, drivers and barriers, customer behavior, and vehicle balancing. The authors emphasize that carsharing has the potential to resolve many pressing societal and environmental challenges (traffic congestion, air pollution, etc.) and conclude that “public decision makers can play a more active role in facilitating the shift to electrification and shared mobility”.
In another review, Shams Esfandabadi et al. [13] study 729 journal articles from the Web of Science database published from 1980 to 2021 in order to classify carsharing papers, conducting a systematic bibliometric analysis. Four main categories are revealed, including carsharing models focused on (1) sustainable urban transportation, (2) users’ behaviors, (3) infrastructure and fleet management, and (4) technological advances in mobility and vehicle services. The following gaps in the literature are discussed: (i) creating a long-term sustainability assessment framework; (ii) developing inclusive marketing and training plans, and design incentives; (iii) identifying and describing the role of carsharing related to the Sustainable Development Goals; (iv) proposing circular economy indicators and circularity measurement systems; and (v) studying and quantifying the effects of the COVID-19 pandemic for carsharing.
Hence, regarding strategic decision-making Huang et al. [14] propose a mixed-integer non-linear program model to choose the station capacity and fleet size of one-way electric carsharing systems. The aim is to maximize the total profit of the operator in a designated region. A golden section line search method and a shadow price algorithm are proposed as solving methodologies. The authors also consider relocation operations and present a rolling horizon method to deal with them. Realistic features, such as demand fluctuations and limited battery capacity, are taken into account. The proposed approach is tested in a large-scale case study in the Suzhou Industrial Park, China. Chen et al. [15] develop a data-driven mixed-integer linear programming model for planning a one-way carsharing system, taking into account the spatial distribution of demand and interacting decisions between stations. An adaptation of the Benders decomposition technique is proposed as a solving methodology and tested in a case study in Beijing, China, with electric cars. Sai et al. [16] develop a nonlinear integer programming model for electric carsharing stations location, aiming to meet the maximum user demand, and propose a genetic algorithm to solve it. A case study of Lanzhou, China, is used to validate and illustrate the approach.
In the field of tactical decision-making, Monteiro et al. [17] perform an agent-based simulation of a carsharing system in realistic scenarios from São Paulo, Brazil, and propose a mixed-integer linear programming model to optimize the fleet size of a carsharing service for one-way and round-trip modes. The goal is to maximize the number of clients served, as well as to minimize the number of vehicles required to be allocated at each carsharing station. Li et al. [18] perform a simulation-optimization study oriented to support decision making regarding station capacities, fleet size, and trip pricing of one-way electric carsharing systems. A simultaneous perturbation stochastic approximation algorithm is designed to address this challenging problem. A case study based on Chengdu, China, is described to illustrate the framework.
Focusing on operational decision-making, Wang et al. [19] address relocation operations of one-way electric carsharing systems without advanced reservation information. The authors propose an integer linear programming model and provide thresholds and a station ruin prevention method for relocation computation. Moreover, a simulation model is developed to test the performance of the approach. Santos and de Almeida Correia [20] investigate the importance of operator-based relocations in one-way carsharing systems by simulating and optimizing using a rolling horizon and testing approach in a real-time decision-tool framework in Lisbon, Portugal.
Wang et al. [21] propose a user-based relocation model for a one-way electric carsharing system based on micro-demand prediction and multi-objective optimization to maximize the profitability of carsharing operators and improving the user experience. Bruglieri et al. [22] propose a two-phase optimization method for a multiobjective vehicle relocation problem in electric carsharing systems. It relies on different randomized search heuristics that generate feasible routes and schedules for relocating EVs in the first phase, while non-dominated solutions are found through epsilon-constraint programming in the second phase. Wang et al. [23] implement relocation optimization in an electric carsharing system in order to maximize enterprise profit. Based on the multinomial logistic regression method and hidden Markov approach, the authors study consumer travel behavior and forecast user demand. Relying on real-world data of carsharing reservations from a midsized German city, Ströhle et al. [24] investigate the potential of spatial and temporal customer flexibility to create better supply–demand alignment. It is found that some customers are likely to provide flexibility in time or space for relatively small compensation.
In the context of using machine learning and intelligent algorithms in carsharing, several papers and research reports have been published recently. Among them, Hu et al. [25] investigate the behavior of clients in vehicle selection regarding urban carsharing using electric vehicles. Random forest and binary logistics regression are the methods investigated. In another work, Daraio et al. [26] study the prediction of car availability in a carsharing system. This paper discusses the performance of machine learning methods to forecast the number of available vehicles in a specific under-study area. Baumgarte et al. [27] analyze the trip distances in a carsharing system in a small city in Germany. Using artificial intelligence, the authors study the factors that have an impact on travel distances. In another work, Wang et al. [28] discuss the prediction of carsharing demand. In particular, a gradient-boosting decision tree is applied to predict the demand of the users. The results are compared with the outputs obtained by the autoregressive integrated moving average model. Since one of the ultimate goals of using carsharing is to respond to sustainability concerns, many researchers have focused on this term to propose novel approaches. For instance, Meng et al. [29] propose an on-demand refueling recommendation system to increase the efficiency of free-floating carsharing systems. Brahimi et al. [30] discuss the prediction of parking stations considering a carsharing model to develop new strategies to increase the number of cars in the street, as well as to decrease the population in the parking stations. Different machine learning methods are used for prediction.
Previous research has addressed location problems faced by carsharing companies utilizing a variety of techniques and applying them to various real-life case studies. However, the approach taken in our study differs from previous work in the following key respects: (i) we address the capacitated dispersion problem by means of an adapted biased-randomized algorithm that employs a transformed distance metric combining Euclidean distances with the density of demand; (ii) we calculate the associated demand for the new nodes in an original way considering if they are internal or external to the current company nodes. These represent a novel contribution to the field, as they address a key challenge faced by carsharing companies—offering efficient solutions to locate the pick-up points.
3. Methodology
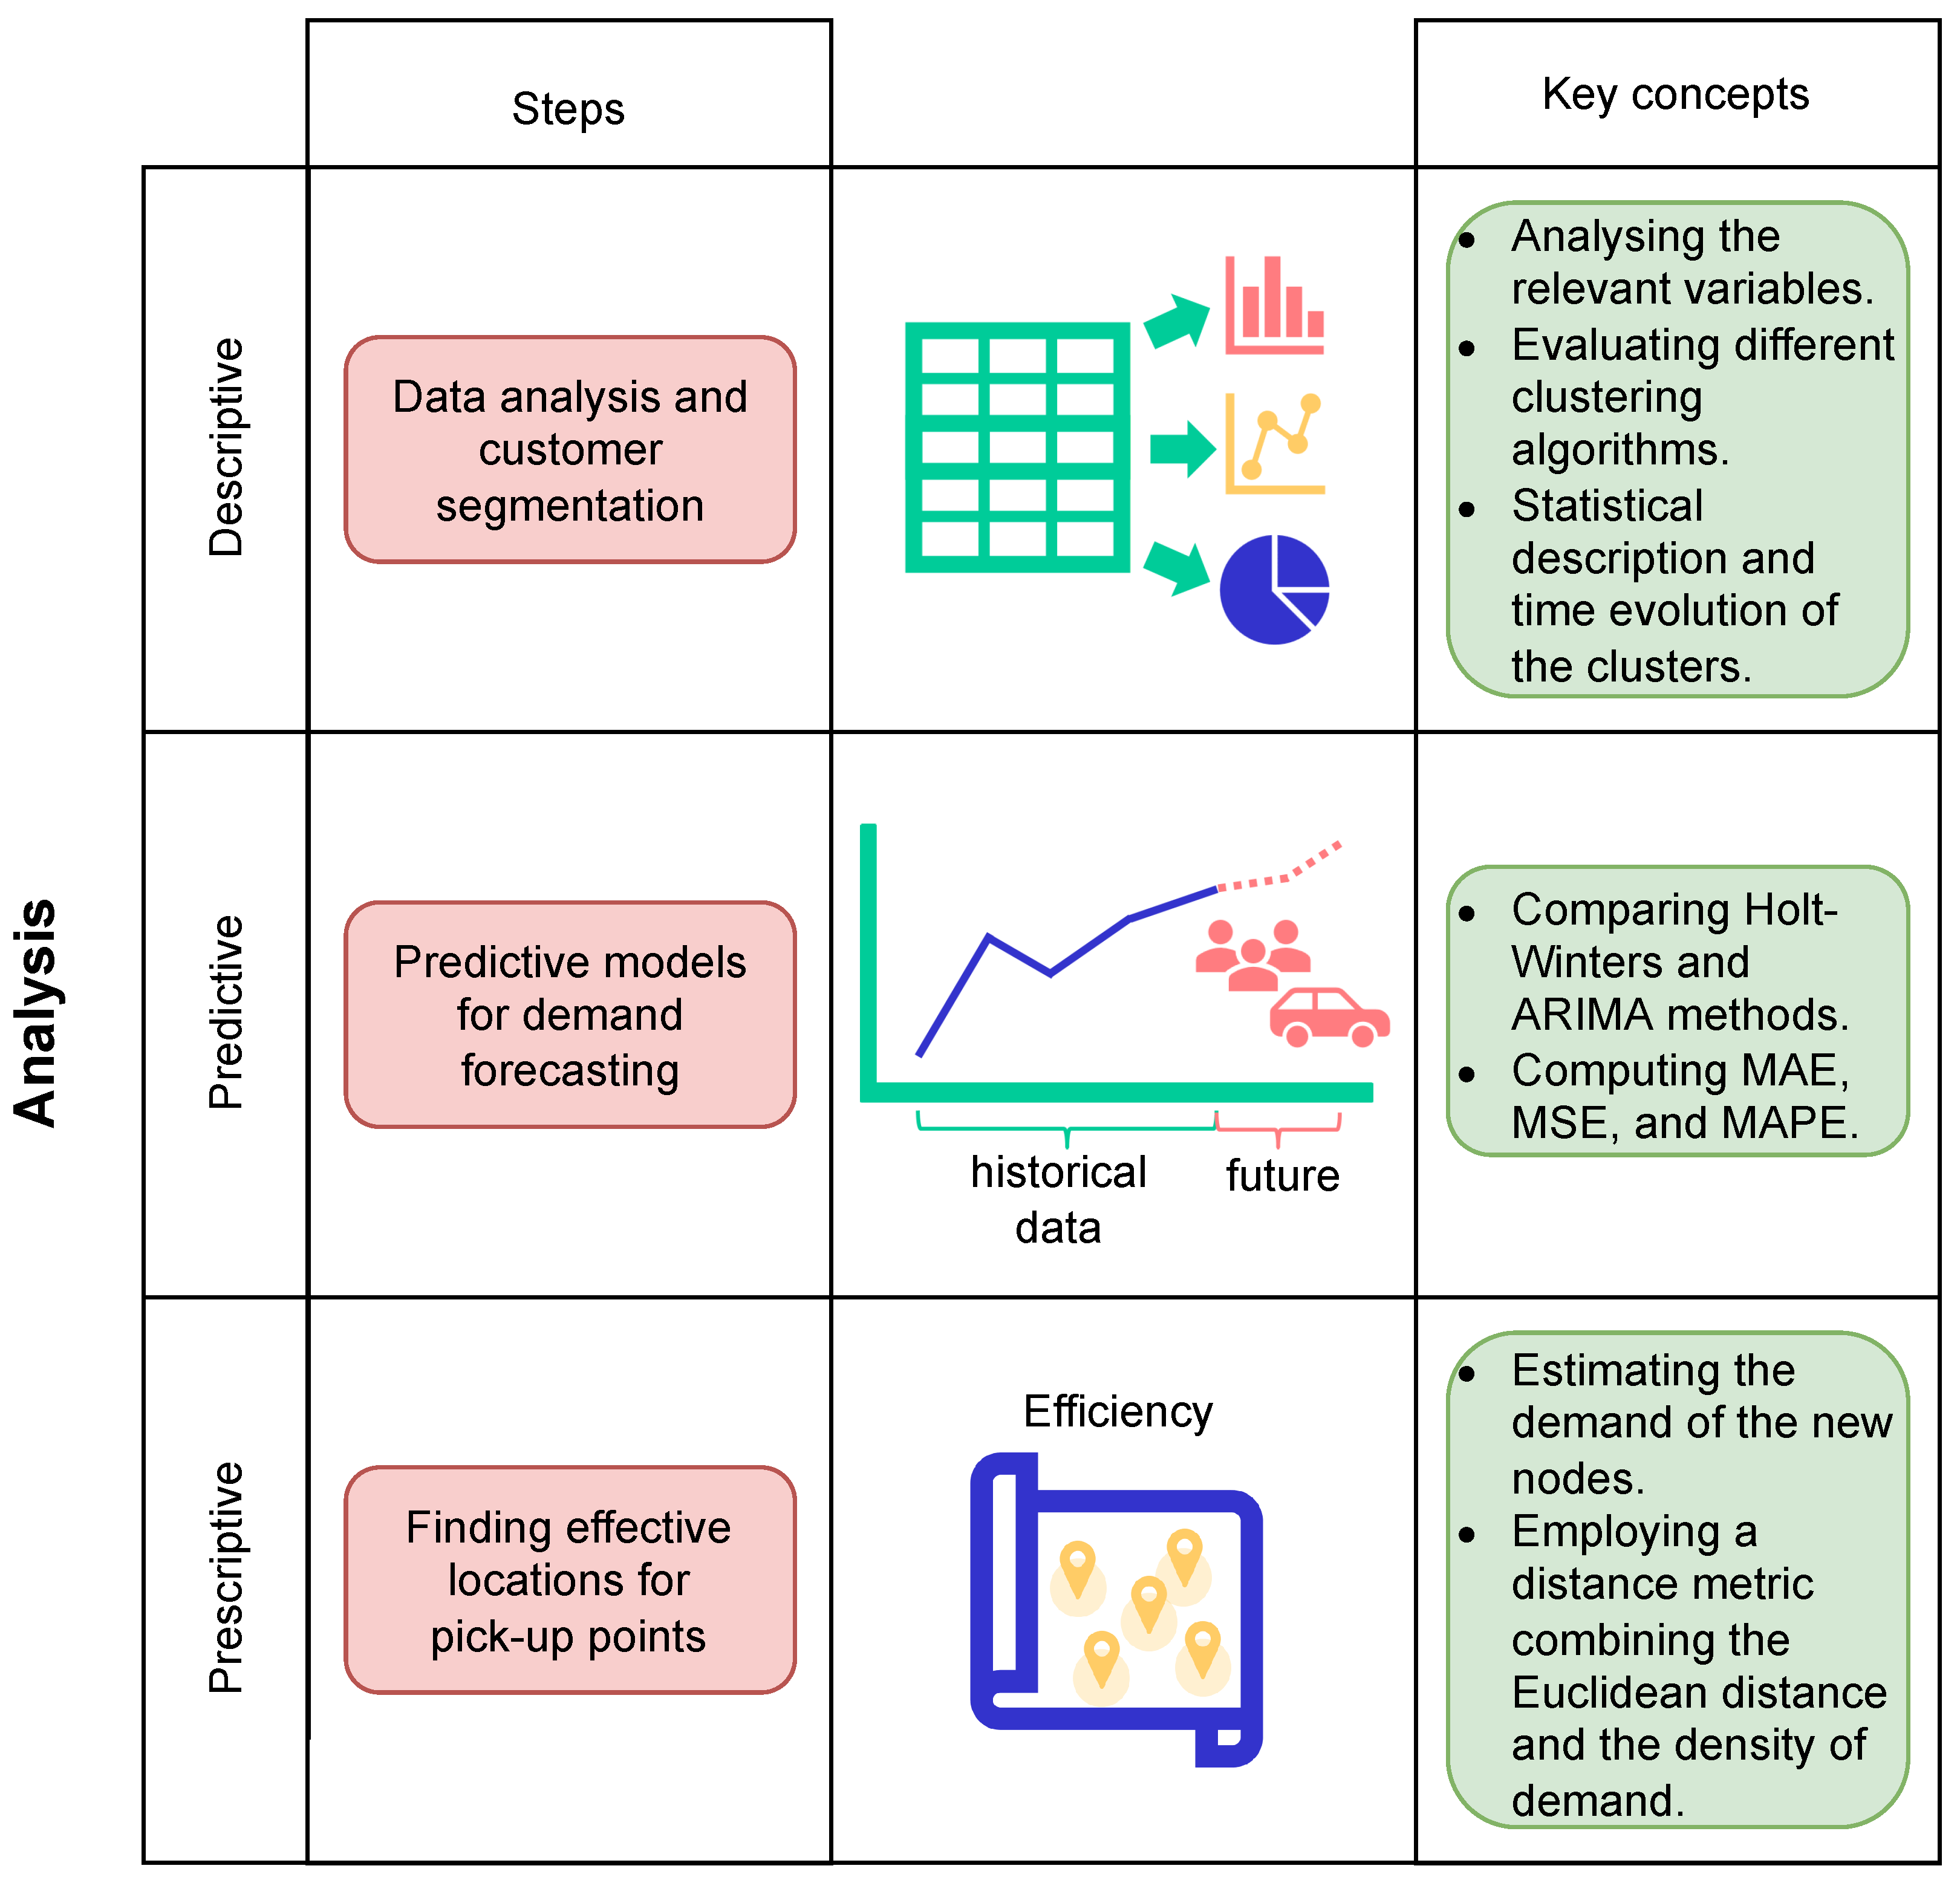
In this study, a mix of methods summarized in Figure 1, was implemented in order to analyze a real-case carsharing scenario in the city of Barcelona. In particular, an initial descriptive analysis is used to better understand the data. Afterward, customer segmentation is undertaken through the application of clustering algorithms, with the aim of identifying distinct groups of customers based on their age, traveling, and reservation patterns. Predictive modeling is also conducted using time-series-based methods, with the objective of forecasting the number of reservations. Finally, a capacitated dispersion problem is solved using a transformed distance metric that combines Euclidean distances with the density of demand in order to determine effective pick-up locations for the city of Barcelona. The collected data is analyzed in order to draw conclusions and make recommendations for future research.
The data analysis was carried out using Python [31]. The Numpy [32], Pandas [33], and Matplotlib [34] libraries were employed for analysis and visualizations, while the Scikit-learn library [35] was used for clustering. Auto-regressive integrated moving average (ARIMA) and Holt–Winters (HW) models were obtained using the statsmodels module [36]. The algorithm proposed to address the capacitated dispersion problem was also developed using Python.
4. A Case Study in the City of Barcelona
This study relies on two datasets containing information regarding services and users provided by a carsharing company operating in Barcelona. The original services dataset has 17,650 rows, which represent the number of reservations from April 2017 until March 2022. The company has the following information for each reservation: a specific code, member ID, parking locations at the origin and destination, reservation status, start and end date, and total distance of the trip. There are four types of reservation status: completed, canceled, scheduled, and in progress. Completed reservations are the ones that have a start date and final date. Canceled reservations are the reservations that have an estimated start date, but never started. Scheduled reservations are the ones that have an estimated start date, but there is not a start date. This means they have not started yet or perhaps will never start. In-progress reservations are the ones that have a start date, but they do not have an end date. This means that they are already in progress and are not finished yet. The next dataset describes the users of the company. The original dataset contains 3756 rows, each one describing a single user. Each user has a member ID, date of birth, address and postal code, as well as an activation date (the day the user activated their account). The dataset also has information about the user’s last connection and the number of completed reservations. Table 1 gathers the variables in the datasets provided by the company.
In the rest of this section, a preliminary data analysis is performed in order to better understand the datasets and study the relationships between variables. Most of the reservations are completed, but there are some canceled reservations each year. In 2022, around of them are in-progress reservations. Generally, the percentage of completed reservations has decreased over time. The evolution of the absolute number of reservations is illustrated in Figure 2. This number grows over time, but there is a sudden decrease corresponding to the time of COVID-19 and compulsory quarantine (a partial lockdown was imposed in Spain from March 2020 to June 2020).
Figure 3 shows the distribution of the travel kilometers for the completed reservations. An uptrend in travel distance is observed.
A new variable called ‘lifelong’ is defined as the difference between ‘last connection’ and ‘activation date’. Figure 4 shows the users’ classification based on this new variable. In particular, four classes are defined: less than 100 days, between 100 to 500 days, between 500 to 1000 days, and more than 1000 days. As shown in this pie plot, of the users have a lifelong of less than 100 days. Figure 5 shows the classification of the users based on the number of reservations. This Pareto chart illustrates that more than 1500 users have not reserved any services since their registration in the company. It also shows six other classes based on the number of services: 0, 1, 1 to 10, 10 to 50, 50 to 100, 100 to 200 and, finally, >200 reservations, which constitute a minority population.
5. Customer Segmentation
In highly competitive business environments, gaining understanding of customers can be a decisive factor. It allows businesses to align their strategy in order to increase customer retention and loyalty, gain new customers, obtain a higher profit, or customize products and services. Customer segmentation is the process by which the set of customers is divided into groups or segments based on common characteristics. In this section, we describe the customer segmentation process of the data. The starting point consists of a subset of the original users dataset: it includes users that are labeled as active. The variables selected to perform the segmentation are: age, number of reservations, and traveled distance. Histograms of these variables are shown in Figure 6.
Once confirmed that there is not a strong correlation between these variables, the next step consists in scaling the data, since the clustering algorithms rely strongly on calculating distances between variables, and, therefore, they must be around the same range. Afterwards, outliers are removed based on an upper boundary, computed by taking three standard deviations from the mean. No lower boundary will be calculated since the distribution of these two variables does not follow a Gaussian distribution, but instead a right-skewed log-normal distribution.
The initial segmentation is performed only for reservations made during the year 2022. The agglomerative clustering algorithm was analyzed, as well as state-of-the-art variations in the k-means algorithm, such as k-means++ and fuzzy-c-means [37]. The silhouette coefficient was calculated for the agglomerative method, while, for the k-means, k-means++, or fuzzy-c-means, the average silhouette coefficient was computed by running the algorithm 10 times. The elbow method suggested the use of five clusters for the agglomerative model, resulting in a silhouette coefficient of . The same number of clusters and an average silhouette coefficient of were obtained for the k-means method. When using the same number of clusters, the k-means++ method produced a silhouette coefficient of ; for the fuzzy-c-means method, the value was . Since a silhouette coefficient closer to 1 indicates a stronger relationship of points with their clusters, agglomerative clustering is the methodology chosen. Statistical results for the obtained clusters are gathered in Table 2. Column ‘Age’ shows the mean and standard deviation of the age. Column ‘Reservations’ shows the mean and standard deviation of the number of reservations. Column ‘Kms traveled’ shows the mean and standard deviation of the total amount of kilometers. ‘Most common preferred season’ has been added as additional information. The clusters, which are represented in Figure 7, can be described as follows:
- Cluster 0: customers around 45 years old that have traveled the longest among all customers and made the largest amount of reservations.
- Cluster 1: the eldest customers that have made on average two reservations of short distance.
- Cluster 2: customers around 40 years old who have made a small number of reservations and not many traveled kilometers in total.
- Cluster 3: the youngest customers that, on average, have repeated the service times and made quite a few kilometers in total.
- Cluster 4: customers around 50 years old who have used the service about four times in total and traveled many kilometers.
The next step is to analyze the distribution of users belonging to each of them over the years in order to identify those groups that are more stable. Figure 8 shows the evolution of the proportion of customers in each cluster over the total amount of customers for each year. On the one hand, clusters 1 and 4 are the most stable ones, grouping together around of the total customers each year. On the other hand, the proportion of people inside clusters 2 and 3 have increased over time, while cluster 0 has experienced a decrease in the proportion of customers, who are precisely the customers who performed more reservations per customer.
6. Predicting the Number of Reservations
This section describes predictive models for the number of reservations, which may offer valuable information for decision-makers. First, a time-series dataset is created consisting of the number of reservations for each month. As shown in Figure 2, the number of completed reservations has dropped during the lockdown in 2020. In the time-series dataset, no observation is an empty or zero value. Since the observations cover just five years, we smoothed them in order to find a seasonality pattern in the dataset. Our goal was to built a predictive model that can help the company to forecast demand behavior in future months. Two time-series methods were employed using Python libraries [38]: the Holt–Winters (HW) and the auto-regressive integrated moving average (ARIMA) methods. In order to compare the performance of the best models generated by both approaches, three measures were considered: the mean absolute error (MAE), the mean square error (MSE), and the mean absolute percentage error (MAPE). They are described by Equations (1)–(3), where denotes the original data value, denotes the predicted value, and n denotes the number of observations:
Regarding the HW model, Figure 9 shows the actual number of reservations (continuous blue line), the values predicted (fitted) by the model (dashed orange line), and the forecasted values for the next 6 months (continuous red line).
For the ARIMA model, Figure 10 illustrates the same three datasets (actual, fitted, and forecasted). In this case, an ARIMA model was employed to fit the actual data and generate the forecasts.
For the next 6 months, Table 3 shows the forecasted values generated by each methodology. Notice that there are some discrepancies between the values provided by the two models. Apparently, as also displayed in Figure 10, the ARIMA model does not properly identify the trend and oscillation behavior of the actual dataset and offers quite a ‘conservative’ (flat-line) forecast.
Table 4 displays the performance measures for the HW and ARIMA models. Since the HW model provides lower values for the three error measures, we must conclude that it is capable of providing more reliable predictions than the selected ARIMA model.
7. Selecting a Scattered yet Effective Location for Pick-Up Points
Focusing only on the city of Barcelona, and after cleaning the address data, nine different car pick-up points are identified. The demand (i.e., the number of reservations observed during the last 12 months) at each point is known. When the area of demand coverage for each node is estimated, it is noticeable that some of the company’s pick-up points are too close to each other, with overlapping areas of influence. Therefore, the company is considering a new strategy: making the service available to as many districts as possible (i.e., making the service available to a larger number of potential customers), while, at the same time, covering as much demand as possible (i.e., satisfying the current demand in the city).
For this purpose, first, new points were generated in the map as candidates for a new location, which are represented in Figure 11 as the blue points, while the red circles represent the company’s current car locations and their estimated area of influence (which is considered a circle centered at the vehicle’s location with a radius of 500 m). As observed in Figure 11, a significant proportion of the areas of influence exhibit overlap with one or more other areas.
These nodes will be classified into two groups: points that lay inside the polygon defined by the current locations (interior), and points that lay outside (exterior). Since these new nodes do not have an associated demand, it will be estimated in the following way (Figure 12): Let N be the set of all new nodes, I the set of all interior nodes, and X the set of all exterior nodes, so that . Let M be the set of current nodes provided by the company. For each node , let be the two closest nodes (in terms of Euclidean distance) to g. Then, the demand of g will be defined as , with being the demands of b and c, respectively. For each node , let us set as the two closest nodes to h. Then, the demand for h will be given as , with being the demands of e and f, respectively, and .
Once we have enriched the set of nodes with the estimated demand, we can calculate the total demand the company’s solution is able to cover by aggregating the blue points’ demands that lay inside the areas of influence. This value is 2972 reservations in a year.
Our next step is to model the challenge of improving the demand coverage across the city as a capacitated dispersion problem (CPD) [39]. While modeling our CPD, we will use a transformed distance metric combining Euclidean distances with density of demand. When considering dispersion problems, several models have been proposed in the literature. The most studied is known as the maximum diversity problem, in which the sum of the distances between the selected elements is maximized. An alternative is the so-called max-min diversity problem, where the minimum distance between the elements is maximized. The CDP is an NP-hard problem. Hence, the use of heuristics and metaheuristics is common when solving large-sized instances [40].
In this paper, we utilize an adapted version of the biased-randomized algorithm proposed by Gomez et al. [41], which is able to generate high-quality solutions for the problem in short computational times. The algorithm defined by the authors consists of a constructive heuristic that starts with all nodes initially removed. Then, the list of edges connecting each pair of candidate nodes is decreasingly sorted according to the transformed distance; the algorithm iteratively picks one of the top elements following a geometric probability distribution to include its nodes in the solution. Each time this happens, the objective function (maximizing the minimum distance between any pair of open nodes), is computed considering the Euclidean distance between the pair of nodes. Until the required demand is met, the algorithm will pick an unselected node from a candidate list of nodes following a biased-randomized fashion and calculate the distance with respect to all the nodes in the solution. Then it creates an edge connecting the unselected node with the one in the solution containing the minimum distance between them. This process enables the generation of different promising solutions at each iteration of the algorithm.
A solution proposed by this algorithm is shown in Figure 13, which is able to cover a total demand of 3240 reservations. Notice that the vehicle locations are distributed approximately equidistant on the map, without overlapping areas of influence. The red circle represents a location currently used by the company. Although the total covered demand is greater than the company’s original solution, it is not efficient yet, since it does not take into account the density of the demands in the city; that is, we should locate more cars in areas with higher demand density.
In order to consider the demand density in each area, we utilize an adapted version of the biased-randomized algorithm previously described, employing a transformed distance metric instead of the traditional Euclidean space. Thus, a given Euclidean distance might be considered a short distance in areas with low demand, while d might be considered a long distance in areas with high demand. Thus, the demands will be used to compute a transformed distance, so that two nodes with high accumulated demand are represented farther away than two other nodes with lower accumulated demand. Given two points, , with respective demands and , let us define the transformed distance between a and b as follows:
where is a parameter that will provide a higher weight to the Euclidean distance as it gets closer to 1 and vice versa.
The adapted algorithm with transformed distance and proposes the solution shown in Figure 14. This solution covers a total demand of 3357 reservations, combining current pick-up points and new ones in order to efficiently distribute the coverage areas in the city, with minimum overlapping, and maximizing the total covered demand. The placement of some vehicles at the edges of the map demonstrates that the proposed solution balances the trade-off between Euclidean distance and demand density, as described in Equation (4), by considering not only areas of high demand, but also those with lower demand. In this way, we obtain a balanced solution that facilitates access to the carsharing service in more districts in the city of Barcelona.
8. Conclusions
Carsharing systems are becoming increasingly present in a large number of cities around the world. During the last few decades, experts have discussed the drives, benefits, barriers, and challenges of these systems, as well as business models and roles of the public sector. Among related open research fields, a few relevant and challenging fields are: (i) the modeling of decision-making processes related to carsharing systems considering other transportation systems; (ii) the development of fast solving methodologies to profit from real-time data from IoT devices among other sources; (iii) the analysis and interpretation of real-life data to enhance the performance of carsharing systems; and (iv) the development of accurate and fast predictive models to gain insights into customers’ behavior and demand, so that better planning decisions can be made.
This paper presents a study of real-life data obtained from a private carsharing company operating in the city of Barcelona, aiming to gain a better understanding of citizens’ needs and behavior. This study includes clusterization of customers and forecasting of future demands. Moreover, an optimization algorithm is proposed in order to provide insights and support decision making. In particular, some original concepts are employed during the preparation of the input data before running a capacitated dispersion problem algorithm that aims at generating solutions offering both a scattered and effective location of the pick-up points. According to the results, the variables, age, number of reservations, and traveled distance allow the creation and description of five different clusters of users. The agglomerative clustering methodology provides better performance than other popular methodologies, such as k-means, k-means++, and fuzzy-c-means.
Regarding the prediction of the number of reservations, we obtain more reliable predictions with the Holt–Winters methods in comparison with auto-regressive integrated moving average methods. Finally, we illustrate how a carsharing company may implement the strategy of making the service available to as many districts as possible, while covering as much demand as possible. The proposed solving approach is capable of increasing the aggregated demand covered by approximately 13%. This study has potential research limitations. First, the datasets used lack basic variables related to the users (e.g., gender) and factors (e.g., price, reason to travel, or route) that could strongly affect the number of reservations. Second, we do not study external factors such as changes in the regulations or the emergence and growth of competing companies. Finally, the case study is focused on the city of Barcelona, which is relatively big and very densely populated. The forecasting and opportunities to expand for carsharing companies are likely to differ greatly in other contexts.
Several lines of research stem from this work. First, both the prediction models and the clustering could be extended by adding more explanatory variables regarding customer behavior and information (e.g., preferred type of vehicle or income) and more characteristics of the reservations (such as pleasure/work trip). Secondly, the version of the problem could be enriched by considering stochastic parameters and a multi-objective function. Finally, distributed and parallelization techniques could be implemented to develop a faster version of the algorithm that provides high-quality solutions for even bigger problem instances.
Author Contributions
Conceptualization, A.A.J.; methodology, L.C. and J.P.; investigation, E.M.H. and E.G.; data curation, E.G. and E.M.H.; writing—original draft preparation, E.M.H., E.G. and L.C.; writing—review and editing, A.A.J.; supervision, L.C., J.P. and A.A.J. All authors have read and agreed to the published version of the manuscript.
Funding
This work has been partially funded by the Spanish Ministry of Science (PID2019-111100RB-C21 /AEI/ 10.13039/501100011033), as well as by the Barcelona City Council and Fundació “la Caixa” under the framework of the Barcelona Science Plan 2020-2023 (grant 21S09355-001).
Institutional Review Board Statement
Not applicable.
Informed Consent Statement
Not applicable.
Data Availability Statement
Not applicable.
Conflicts of Interest
The authors declare no conflict of interest.
References
- Santos, G. Sustainability and shared mobility models. Sustainability 2018, 10, 3194. [Google Scholar] [CrossRef]
- Machado, C.A.S.; de Salles Hue, N.P.M.; Berssaneti, F.T.; Quintanilha, J.A. An overview of shared mobility. Sustainability 2018, 10, 4342. [Google Scholar] [CrossRef]
- Talbi, E.G. Metaheuristics: From Design to Implementation; John Wiley & Sons: Hoboken, NJ, USA, 2009. [Google Scholar]
- Maniezzo, V.; Stützle, T.; Voß, S. Matheuristics; Springer: Berlin/Heidelberg, Germany, 2021. [Google Scholar]
- Juan, A.A.; Faulin, J.; Grasman, S.E.; Rabe, M.; Figueira, G. A review of simheuristics: Extending metaheuristics to deal with stochastic combinatorial optimization problems. Oper. Res. Perspect. 2015, 2, 62–72. [Google Scholar] [CrossRef]
- Calvet, L.; de Armas, J.; Masip, D.; Juan, A.A. Learnheuristics: Hybridizing metaheuristics with machine learning for optimization with dynamic inputs. Open Math. 2017, 15, 261–280. [Google Scholar] [CrossRef]
- Peyman, M.; Copado, P.J.; Tordecilla, R.D.; Martins, L.d.C.; Xhafa, F.; Juan, A.A. Edge computing and IoT analytics for agile optimization in intelligent transportation systems. Energies 2021, 14, 6309. [Google Scholar] [CrossRef]
- Li, Y.; Peyman, M.; Panadero, J.; Juan, A.A.; Xhafa, F. IoT analytics and agile optimization for solving dynamic team orienteering problems with mandatory visits. Mathematics 2022, 10, 982. [Google Scholar] [CrossRef]
- Martins, L.d.C.; Tarchi, D.; Juan, A.A.; Fusco, A. Agile optimization for a real-time facility location problem in Internet of Vehicles networks. Networks 2022, 79, 501–514. [Google Scholar] [CrossRef]
- Moar, J.; Bainbridge, M. Smart Cities: Market Forecasts, Key Technologies & Environmental Impact 2022–2026. Juniper Research. 2022. Available online: https://www.juniperresearch.com/researchstore/key-vertical-markets/smart-cities-research-report (accessed on 17 November 2022).
- Wu, T.; Xu, M. Modeling and optimization for carsharing services: A literature review. Multimodal Transp. 2022, 1, 100028. [Google Scholar] [CrossRef]
- Nansubuga, B.; Kowalkowski, C. Carsharing: A systematic literature review and research agenda. J. Serv. Manag. 2021, 32, 55–91. [Google Scholar] [CrossRef]
- Shams Esfandabadi, Z.; Diana, M.; Zanetti, M.C. Carsharing services in sustainable urban transport: An inclusive science map of the field. J. Clean. Prod. 2022, 357, 131981. [Google Scholar] [CrossRef]
- Huang, K.; An, K.; de Almeida Correia, G.H. Planning station capacity and fleet size of one-way electric carsharing systems with continuous state of charge functions. Eur. J. Oper. Res. 2020, 287, 1075–1091. [Google Scholar] [CrossRef]
- Chen, Y.; Wang, L.; Tian, J. Station location optimization for the one-Way carsharing system: Modeling and a case study. J. Adv. Transp. 2022, 2022, 6142950. [Google Scholar] [CrossRef]
- Sai, Q.; Bi, J.; Chai, J. Optimal model for carsharing station location based on multi-factor constraints. Algorithms 2020, 13, 43. [Google Scholar] [CrossRef]
- Monteiro, C.M.; Machado, C.A.S.; de Oliveira Lage, M.; Berssaneti, F.T.; Davis, C.A., Jr.; Quintanilha, J.A. Optimization of carsharing fleet size to maximize the number of clients served. Comput. Environ. Urban Syst. 2021, 87, 101623. [Google Scholar] [CrossRef]
- Li, Y.; Chen, S.; Hu, L.; Liang, Z.; Jiang, Y.; Tang, Y. Simulation-optimization for station capacities, fleet size, and trip pricing of one-way electric carsharing systems. J. Clean. Prod. 2021, 321, 129035. [Google Scholar] [CrossRef]
- Wang, L.; Liu, Q.; Ma, W. Optimization of dynamic relocation operations for one-way electric carsharing systems. Transp. Res. Part C Emerg. Technol. 2019, 101, 55–69. [Google Scholar] [CrossRef]
- Santos, G.G.D.; de Almeida Correia, G.H. Finding the relevance of staff-based vehicle relocations in one-way carsharing systems through the use of a simulation-based optimization tool. J. Intell. Transp. Syst. 2019, 23, 583–604. [Google Scholar] [CrossRef]
- Wang, N.; Jia, S.; Liu, Q. A user-based relocation model for one-way electric carsharing system based on micro demand prediction and multi-objective optimization. J. Clean. Prod. 2021, 296, 126485. [Google Scholar] [CrossRef]
- Bruglieri, M.; Pezzella, F.; Pisacane, O. A two-phase optimization method for a multiobjective vehicle relocation problem in electric carsharing systems. J. Comb. Optim. 2018, 36, 162–193. [Google Scholar] [CrossRef]
- Wang, N.; Guo, J.; Liu, X.; Liang, Y. Electric vehicle car-sharing optimization relocation model combining user relocation and staff relocation. Transp. Lett. 2021, 13, 315–326. [Google Scholar] [CrossRef]
- Ströhle, P.; Flath, C.M.; Gärttner, J. Leveraging customer flexibility for car-sharing fleet optimization. Transp. Sci. 2019, 53, 42–61. [Google Scholar] [CrossRef]
- Hu, S.; Lin, H.; Xie, K.; Chen, X.; Shi, H. Modeling users’ vehicles selection behavior in the urban carsharing program. In Proceedings of the 2018 21st International Conference on Intelligent Transportation Systems (ITSC), Maui, HI, USA, 4–7 November 2018; pp. 1546–1551. [Google Scholar] [CrossRef]
- Daraio, E.; Cagliero, L.; Chiusano, S.; Garza, P.; Giordano, D. Predicting Car Availability in Free Floating Car Sharing Systems: Leveraging Machine Learning in Challenging Contexts. Electronics 2020, 9, 1322. [Google Scholar] [CrossRef]
- Baumgarte, F.; Keller, R.; Röhrich, F.; Valett, L.; Zinsbacher, D. Revealing influences on carsharing users’ trip distance in small urban areas. Transp. Res. Part D Transp. Environ. 2022, 105, 103252. [Google Scholar] [CrossRef]
- Wang, C.; Bi, J.; Sai, Q.; Yuan, Z. Analysis and Prediction of Carsharing Demand Based on Data Mining Methods. Algorithms 2021, 14, 179. [Google Scholar] [CrossRef]
- Meng, Z.; Li, E.Y.; Qiu, R. Environmental sustainability with free-floating carsharing services: An on-demand refueling recommendation system for Car2go in Seattle. Technol. Forecast. Soc. Chang. 2020, 152, 119893. [Google Scholar] [CrossRef]
- Brahimi, N.; Zhang, H.; Dai, L.; Zhang, J. Modeling on Car-Sharing Serial Prediction Based on Machine Learning and Deep Learning. Complexity 2022, 2022, 8843000. [Google Scholar] [CrossRef]
- Van Rossum, G.; Drake, F.L. Python 3 Reference Manual; CreateSpace: Scotts Valley, CA, USA, 2009. [Google Scholar]
- Oliphant, T.E. Guide to NumPy. 2006. Available online: https://archive.org/details/NumPyBook (accessed on 22 October 2022).
- McKinney, W. Data Structures for Statistical Computing in Python. In Proceedings of the 9th Python in Science Conference, Austin, TX, USA, 28 June–3 July 2010; van der Walt, S., Millman, J., Eds.; pp. 51–56. [Google Scholar]
- Hunter, J.D. Matplotlib: A 2D graphics environment. Comput. Sci. Eng. 2007, 9, 90–95. [Google Scholar] [CrossRef]
- Pedregosa, F.; Varoquaux, G.; Gramfort, A.; Michel, V.; Thirion, B.; Grisel, O.; Blondel, M.; Prettenhofer, P.; Weiss, R.; Dubourg, V.; et al. Scikit-learn: Machine Learning in Python. J. Mach. Learn. Res. 2011, 12, 2825–2830. [Google Scholar]
- Seabold, S.; Perktold, J. statsmodels: Econometric and statistical modeling with Python. In Proceedings of the 9th Python in Science Conference, Austin, TX, USA, 28 June–3 July 2010. [Google Scholar]
- Xu, D.; Tian, Y. A comprehensive survey of clustering algorithms. Ann. Data Sci. 2015, 2, 165–193. [Google Scholar] [CrossRef]
- Vishwas, B.; Patel, A. Hands-On Time Series Analysis with Python; Springer: Berlin/Heidelberg, Germany, 2020. [Google Scholar]
- Martí, R.; Martínez-Gavara, A.; Sánchez-Oro, J. The capacitated dispersion problem: An optimization model and a memetic algorithm. Memetic Comput. 2021, 13, 131–146. [Google Scholar] [CrossRef]
- Peiró, J.; Jiménez, I.; Laguardia, J.; Martí, R. Heuristics for the capacitated dispersion problem. Int. Trans. Oper. Res. 2021, 28, 119–141. [Google Scholar] [CrossRef]
- Gomez, J.F.; Panadero, J.; Tordecilla, R.D.; Castaneda, J.; Juan, A.A. A multi-start biased-randomized algorithm for the capacitated dispersion problem. Mathematics 2022, 10, 2405. [Google Scholar] [CrossRef]
Figure 1.
Schema of our methodology.

Figure 2.
Evolution of the number of reservations by status.

Figure 3.
Distribution of total travel kilometers of the completed reservations.

Figure 4.
User classification based on the number of days from the activation to the last connection.
Figure 4.
User classification based on the number of days from the activation to the last connection.

Figure 5.
User classification based on number of reservations.

Figure 6.
Histograms of the variables used for customer segmentation.

Figure 7.
Final clustering of customers considering the number of reservations, the total kilometers traveled, and the age.
Figure 7.
Final clustering of customers considering the number of reservations, the total kilometers traveled, and the age.

Figure 8.
Distribution of customers belonging to each cluster over years.

Figure 9.
Fitting the actual data using a Holt–Winters model.

Figure 10.
Fitting the actual data using an ARIMA model.

Figure 11.
Current pick-up locations in the city of Barcelona. Aggregated demand covered: 2972 reservations.
Figure 11.
Current pick-up locations in the city of Barcelona. Aggregated demand covered: 2972 reservations.

Figure 12.
Assigning demands to new nodes.

Figure 13.
Solution proposed by the algorithm using Euclidean distance. Aggregated demand covered: 3240 reservations.
Figure 13.
Solution proposed by the algorithm using Euclidean distance. Aggregated demand covered: 3240 reservations.

Figure 14.
Balanced solution proposed by the algorithm using the transformed distance. Aggregated demand covered: 3357 reservations.
Figure 14.
Balanced solution proposed by the algorithm using the transformed distance. Aggregated demand covered: 3357 reservations.


Table 1.
Variables in the datasets provided by the carsharing company.
| Reservations Dataset | Users Dataset |
|---|---|
| - Reservation code | - Member ID |
| - Member ID | - Date of birth |
| - Parking location at origin | - Address and postal code |
| - Parking location at destination | - Activation date |
| - Reservation status | - Last connection |
| - Start date | - Completed reservations |
| - End date | |
| - Travel distance |
Table 2.
Statistical summary of the clusters obtained.
| Cluster | No. Customers | Age | Reservations | Kms Traveled | Most Common Preferred Season | |||
|---|---|---|---|---|---|---|---|---|
| Mean | Std. Dev. | Mean | Std. Dev. | Mean | Std. Dev. | |||
| 0 | 113 | 45.3 | 8.57 | 31.22 | 19.06 | 2057.71 | 1627.01 | Fall |
| 1 | 235 | 60.31 | 6.4 | 1.93 | 2.24 | 138.85 | 170.1 | Summer |
| 2 | 398 | 39.66 | 4.02 | 2.6 | 2.66 | 165.05 | 201.33 | Fall |
| 3 | 258 | 28.07 | 3.42 | 3.5 | 4.28 | 244.76 | 304.62 | Summer |
| 4 | 267 | 49.99 | 3.07 | 3.84 | 4.49 | 304.49 | 401.98 | Fall |
Table 3.
Forecasted values using each methodology.
| Month | HW | ARIMA(1,1,3) |
|---|---|---|
| 1 | 459 | 439 |
| 2 | 536 | 439 |
| 3 | 509 | 426 |
| 4 | 510 | 439 |
| 5 | 483 | 426 |
| 6 | 496 | 439 |
Table 4.
Performance measures of the prediction models.
| Model | MAE | MSE | MAPE |
|---|---|---|---|
| HW | 27.08 | 1243 | 13% |
| ARIMA(1,1,3) | 34.00 | 2016 | 18% |
Disclaimer/Publisher’s Note: The statements, opinions and data contained in all publications are solely those of the individual author(s) and contributor(s) and not of MDPI and/or the editor(s). MDPI and/or the editor(s) disclaim responsibility for any injury to people or property resulting from any ideas, methods, instructions or products referred to in the content. |
© 2023 by the authors. Licensee MDPI, Basel, Switzerland. This article is an open access article distributed under the terms and conditions of the Creative Commons Attribution (CC BY) license (https://creativecommons.org/licenses/by/4.0/).
Share and Cite
MDPI and ACS Style
Herrera, E.M.; Calvet, L.; Ghorbani, E.; Panadero, J.; Juan, A.A. Enhancing Carsharing Experiences for Barcelona Citizens with Data Analytics and Intelligent Algorithms. Computers 2023, 12, 33. https://doi.org/10.3390/computers12020033
AMA Style
Herrera EM, Calvet L, Ghorbani E, Panadero J, Juan AA. Enhancing Carsharing Experiences for Barcelona Citizens with Data Analytics and Intelligent Algorithms. Computers. 2023; 12(2):33. https://doi.org/10.3390/computers12020033
Chicago/Turabian StyleHerrera, Erika M., Laura Calvet, Elnaz Ghorbani, Javier Panadero, and Angel A. Juan. 2023. "Enhancing Carsharing Experiences for Barcelona Citizens with Data Analytics and Intelligent Algorithms" Computers 12, no. 2: 33. https://doi.org/10.3390/computers12020033
Note that from the first issue of 2016, this journal uses article numbers instead of page numbers. See further details here.