On the Use of Voice Signals for Studying Sclerosis Disease
by
 ,
,
Patrizia Vizza
1,*, 
Giuseppe Tradigo
2,
Domenico Mirarchi
1,*,
Roberto Bruno Bossio
3 and
Pierangelo Veltri
1,*
1
Department of Medical and Surgical Sciences, Magna Graecia University, 88100 Catanzaro, Italy
2
Department of Computer Engineering, Modelling, Electronics and Systems (DIMES), University of Calabria, 87036 Rende, Italy
3
Neurological Operative Unit, Center of Multiple Sclerosis, Provincial Health Authority of Cosenza, 87100 Cosenza, Italy
*
Authors to whom correspondence should be addressed.
Computers 2017, 6(4), 30; https://doi.org/10.3390/computers6040030
Submission received: 16 October 2017
/
Revised: 13 November 2017
/
Accepted: 23 November 2017
/
Published: 28 November 2017
(This article belongs to the Special Issue Biomedical and Bioinformatics Challenges for Computer Science)
Abstract
:Multiple sclerosis (MS) is a chronic demyelinating autoimmune disease affecting the central nervous system. One of its manifestations concerns impaired speech, also known as dysarthria. In many cases, a proper speech evaluation can play an important role in the diagnosis of MS. The identification of abnormal voice patterns can provide valid support for a physician in the diagnosing and monitoring of this neurological disease. In this paper, we present a method for vocal signal analysis in patients affected by MS. The goal is to identify the dysarthria in MS patients to perform an early diagnosis of the disease and to monitor its progress. The proposed method provides the acquisition and analysis of vocal signals, aiming to perform feature extraction and to identify relevant patterns useful to impaired speech associated with MS. This method integrates two well-known methodologies, acoustic analysis and vowel metric methodology, to better define pathological compared to healthy voices. As a result, this method provides patterns that could be useful indicators for physicians in identifying patients affected by MS. Moreover, the proposed procedure could be a valid support in early diagnosis as well as in monitoring treatment success, thus improving a patient’s life quality.
1. Introduction
Neurodegenerative diseases concern the central nervous system and are characterized by chronic and selective neuron cell death. Neuronal deterioration may result in cognitive deficits, dementia, motor changes, and behavioral and psychological disorders. The neurodegenerative diseases are conditions primarily affecting neurons and causing the disruption of information flow within the brain and between the brain and rest of the body [1]. Multiple sclerosis (MS) is one of the most common neurodegenerative disorders. It is a chronic demyelinating disease that affects the central nervous system, interfering with nerve impulses within the brain, the spinal cord and the optic nerves [2]. Although the evolution in time of MS is different for each patient, four main types of MS can be identified: (i) clinically isolated syndrome (CIS); (ii) primary progressive MS (PPMS); (iii) relapsing–remitting MS (RRMS); and (iv) secondary progressive MS (SPMS) [3]—the last two being the most common. In the initial phase, 85% of the subjects affected by MS are diagnosed with RRMS. In these subjects, a specific behavior is observed: an increase in disability produced by clearly defined attacks or neurological symptoms, alternating with recovery phases, which worsen until total inactivity. The 30–50% of subjects affected by RRMS develop SPMS within 10 years. SPMS is characterized by a progressive worsening of the neurological function and a consequent increase in disability over time.
MS presents specific symptomatologies, among which is speech impairment, also known as dysarthria [4], a motor speech disorder of neurological origin resulting from neurological injury due to damages in the central or peripheral nervous system. Dysarthria is the condition of a faulty articulation of sounds or words. In dysarthria, language functions are normal and the patient speaks with proper syntax, but pronunciation is defective because of problems with muscular movements needed for speech production [5]. Dysarthria may be more or less severe until it reaches a complete deficit. Dysarthria is an unfavorable symptom present not only in MS but also in other neurological diseases, for example, in amyotrophic lateral sclerosis as well as in Parkinson’s disease [6,7]. Therefore, the evaluation of dysarthria represents a valid clinical support to otolaryngologists, neurologists and speech pathologists for early and differential diagnosis and for documenting disease progression. Generally, this evaluation is performed by using a noninvasive speech signal analysis [8].
Acoustic analysis has been reported in literature as a useful tool to evaluate and characterize pathological vocal signals [9,10,11] and to show statistically significant differences with respect to normal subjects [12,13]. In the last few years, traditional and new acoustic measures of dysarthric speech have been proposed as alternative methods to differentiate dysarthric from healthy speech [14,15]. The authors in [16] analyzed acoustic parameters as well as fundamental frequency (), jitter, shimmer and Harmonics-to-Noise-Ratio (HNR) measures to define a procedure for the automatic diagnosis of larynx pathologies. In [17], a set of vowel metrics are presented, as derived from spectral and temporal measurements of vowel tokens embedded in phrase production, used to distinguish healthy from dysarthric speech. Several signal processing algorithms have been implemented to perform vocal signal analysis with the aim of identifying pathological voices [18,19]. The contribution in [20] compares the results of voice self-assessment performed by patients with MS with the results of expert perceptual assessments made by vocal therapists. Vocal difficulties reported by patients in terms of the voice handicap index (VHI) have been confirmed and rated by specialists using the Grade, Roughness, Breathiness, Asthenia, Strain scale (GRBAS). In [21], a study was conducted to explore temporal, spectral and phonatory acoustic features of MS patients compared to control subjects. It was found that the dysarthric symptoms of MS patients largely mirror their different underlying neuromotor dysfunctions and that they exhibit temporal and articulatory deviation when compared to the control subjects. In [22], the authors investigated the presence of dysphonic symptoms in MS patients, highlighting a gender difference in terms of fundamental frequency deviation, noise, and jitter: women show fewer voice variations than men. Moreover, software tools have been produced to extract vocal features for signal analysis: the Multi-Dimensional Voice Program (MDVP) and PRAAT (it is a software for the scientific analysis of speech in phonetics) are the most common tools used for voice analysis in clinical practice [23,24]. A comparison between these tools has been proposed in [25] with regard to the evaluation of jitter measurements. To better define the results of acoustic analysis and to furnish additional information, the vowel metric is often used to integrate voice signal evaluation [22,26,27]. For example, the contribution proposed in [28] regards the definition of speech parameters, such as the vowel space area (VSA) and the formant centralization ratio (FCR). Additionally, sharing data and information for increasing knowledge can be performed in a distributed laboratory, as in [29,30,31].
Voice signal analysis and the vowel metric help to show significant differences between patients with MS and normal subjects [32,33], justifying the assumption that speech analysis may become a helpful tool for the diagnosis and monitoring of disease progression.
In this paper, the evaluation of vocal signals in patients with MS has been performed by using the methodologies of both acoustic analysis and the vowel metric. In particular, the PRAAT tool has been used to perform the acoustic analysis and an algorithm written in Matlab has been used to calculate the vowel metrics. Lastly, statistical analyses have been used to evaluate the results.
The paper is composed as follows: the next paragraph reports a brief description of the phonetic apparatus. Section 2 describes the methodologies used for processing the vocal signals, and Section 3 explains the results of the analyses. Section 4 concludes the paper.
Phonetic Apparatus
The phonetic apparatus is responsible for human voice production. This apparatus is extremely sophisticated and is composed of organs that may be mobile or fixed. The mobile organs are the lips, jaw, tongue, and vocal cords; the fixed organs are the teeth, alveoli, palate and soft palatine veil. Other organs such as the lungs, larynx, pharynx and nose are responsible for the flow of air [34]. An illustration of the phonetic apparatus is depicted in Figure 1 [35]. The main organs and their functions are the following:
- Lungs—these produce the airflow that enters into the bronchus and trachea.
- Larynx—this contains the vocal cords that vibrate to produce vowels. Vocal cords are folds of muscles located at the level of the glottis, which represents the space between the vocal cords. The vocal cords vibrate when they are closed to obstruct the airflow through the glottis.
- Oral cavity—this is composed by the tongue, palate, lips, and teeth. The tongue allows the articulation of consonants and vowels approaching the palate. The lips are involved in the production of several consonant sounds also affecting the sounds of vowels. The teeth are used to generate dental consonants.
- Nasal cavity—this is responsible for nasal sounds, particularly nasal consonants such as m and n. The nasal term means that the sound is produced by sending a stream of air through the nose but not through the mouth, as it is occluded by the lips or tongue.
Vocal cords are folds of muscles located at the level of glottis, which represents the space between the vocal cords. The vocal cords vibrate when they are closed to obstruct the airflow through the glottis. The cycle movement of the airflow creates a buzzing sound; its rate determines the fundamental frequency () contributing to the perception of the pitch. The source signal can change according to differences in the vocal folds’ vibration that produce an impact to the overall quality of the sound. Variations in the anatomy of each individual’s vocal apparatus, such as in the thickness of the vocal folds and differences in the shape of palate, as well as the dynamic use of the vocal tract, determine differences in pronunciation, accent and other vocal features. These differences allow a listener to discriminate, recognize and identify other individuals simply by listening to their voices [36].
2. Methods
Speech abnormalities can be studied by analyzing several parameters obtained from vocal signal processing with the aim to describe the voice in a quantitative way and to identify patterns [37]. Two types of methods have been used to extract the parameters needed to furnish a more detailed analysis for the evaluation and identification of possible correlations between vocal signals and MS disease. The two different methodologies are acoustic vocal analysis and the vowel metric. The former extracts the acoustic parameters, while the latter extracts parameters related to vowel articulation. Both types of parameters are explained in the following section.
The aim is to evaluate and integrate results from these two approaches to better identify and characterize vocal signals of patients with MS.
2.1. Acoustic Analysis
The acoustic analysis of a vocal signal is needed in order to extract a set of relevant information through the evaluation of specific acoustic parameters [38]. Currently, the most common parameters, generally used by physicians and referenced in literature, are the following [39]:
- Fundamental frequency ()—this represents the cycle of the wave.
- Jitter—this is a measure of frequency variability in the sound wave, expressed as a term (the term is used to distinguish the cycle of in the figure).
- Shimmer—this is a measure of amplitude variability in the sound wave.
- HNR—this estimates the level of additive noise in human voice signals associated to a leak of the glottal closure during phonation.
Jitter and shimmer are measurements of perturbation, and they are related to vocal stability. The fundamental frequency is an important feature of the human voice expressed in Hertz (Hz, cycles per second). It is responsible of the tonal and rhythmic properties of speech. It is defined as the number of times in which a sound wave produced by vocal cords is repeated during a specific time period [16]. The fundamental frequency represents the lowest tone of the harmonic series generated by the vocal fold vibration. The vocal tract modifies the signal, causing formant frequencies. Generally, in vocal signal analysis, the fundamental frequency and its five formants (, , , , and ) are considered. Average fundamental frequencies for normal voices are the following: (i) 265 Hz for children; (ii) 225 Hz for women; (iii) 128 Hz for men [40]. A decrease in these values often can be associated to pathological conditions.
Jitter is defined as the variation in the frequency of the sound wave cycle-to-cycle. It is mainly affected by the lack of control of cords’ vibration. Vocal jitter increases in voice disorders and is responsible for a hoarse, harsh or rough voice quality. Generally, a pathological voice is characterized by a higher percentage of jitter compared to a healthy voice: a variation between 0.5% and 1% represents a significant value in abnormal conditions. Typically, absolute and relative jitter values are considered [41]. Absolute jitter represents the absolute average difference between two consecutive periods; relative jitter is the absolute average difference between two consecutive periods divided by the average period.
Shimmer is defined as the amplitude variation of the sound wave. Its changes are associated to the mass lesions on the vocal cords. Vocal shimmer increases in voice disorders, and higher values of shimmer are usually perceived as hoarseness. In adults, shimmer values of less than 3% can be found in pathological voices. For shimmer, two types of parameters are commonly considered: relative, , and decibels, [41]. The former is the average absolute difference between the amplitudes of two consecutive periods divided by the average amplitude. The latter is defined as the average absolute difference between two consecutive periods multiplied by 20, expressed on the logarithmic scale.
In addition to these fundamental acoustic parameters, the HNR is a relevant measurement of the voice status that quantifies the amount of additive noise in the voice signal. The HNR reflects the pureness and efficiency of speech, because noise impairs the clarity of the voice, and it is perceived as hoarseness. This acoustic parameter is expressed in decibels () and it is defined as the ratio between the energy of periodic components (harmonics) and the energy of nonperiodic components (noise) in a voice segment [42]. The nonperiodic waves are random noise introduced into the vocal signal owing to an irregular or asymmetric closing of the vocal folds. If the harmonics energy is equal to the noise, a HNR value of 0 dB is calculated. High values of the HNR are indicative of healthy voices; for example, a HNR of 20 dB means that 99% of the energy of the signal is in the periodic part, and 1% is noise. On the contrary, low values of the HNR (generally less then 7 dB) can be associated to pathological voices.
2.2. Vowel Metric
The vowel metric is commonly used in clinical research to associate dysarthria conditions with pathological vocal signals [43]. In the presence of dysarthria, speech is often characterized by vowel centralization as a result of an undershooting of articulatory targets. To evaluate the vowel articulation and, consequently, the vowel centralization, the VSA index is calculated. A high VSA is proper of a healthy patient’s speech and hyperarticulated vowels [44]. A reduced VSA reflects the result of vowel centralization [45] related to pathological conditions. A vocal signal with dysarthria is generally characterized by a reduction in the VSA due to centralization of formant frequencies [17]. The VSA is very useful in voice analysis and monitoring because it allows more detailed investigations to be carried out.
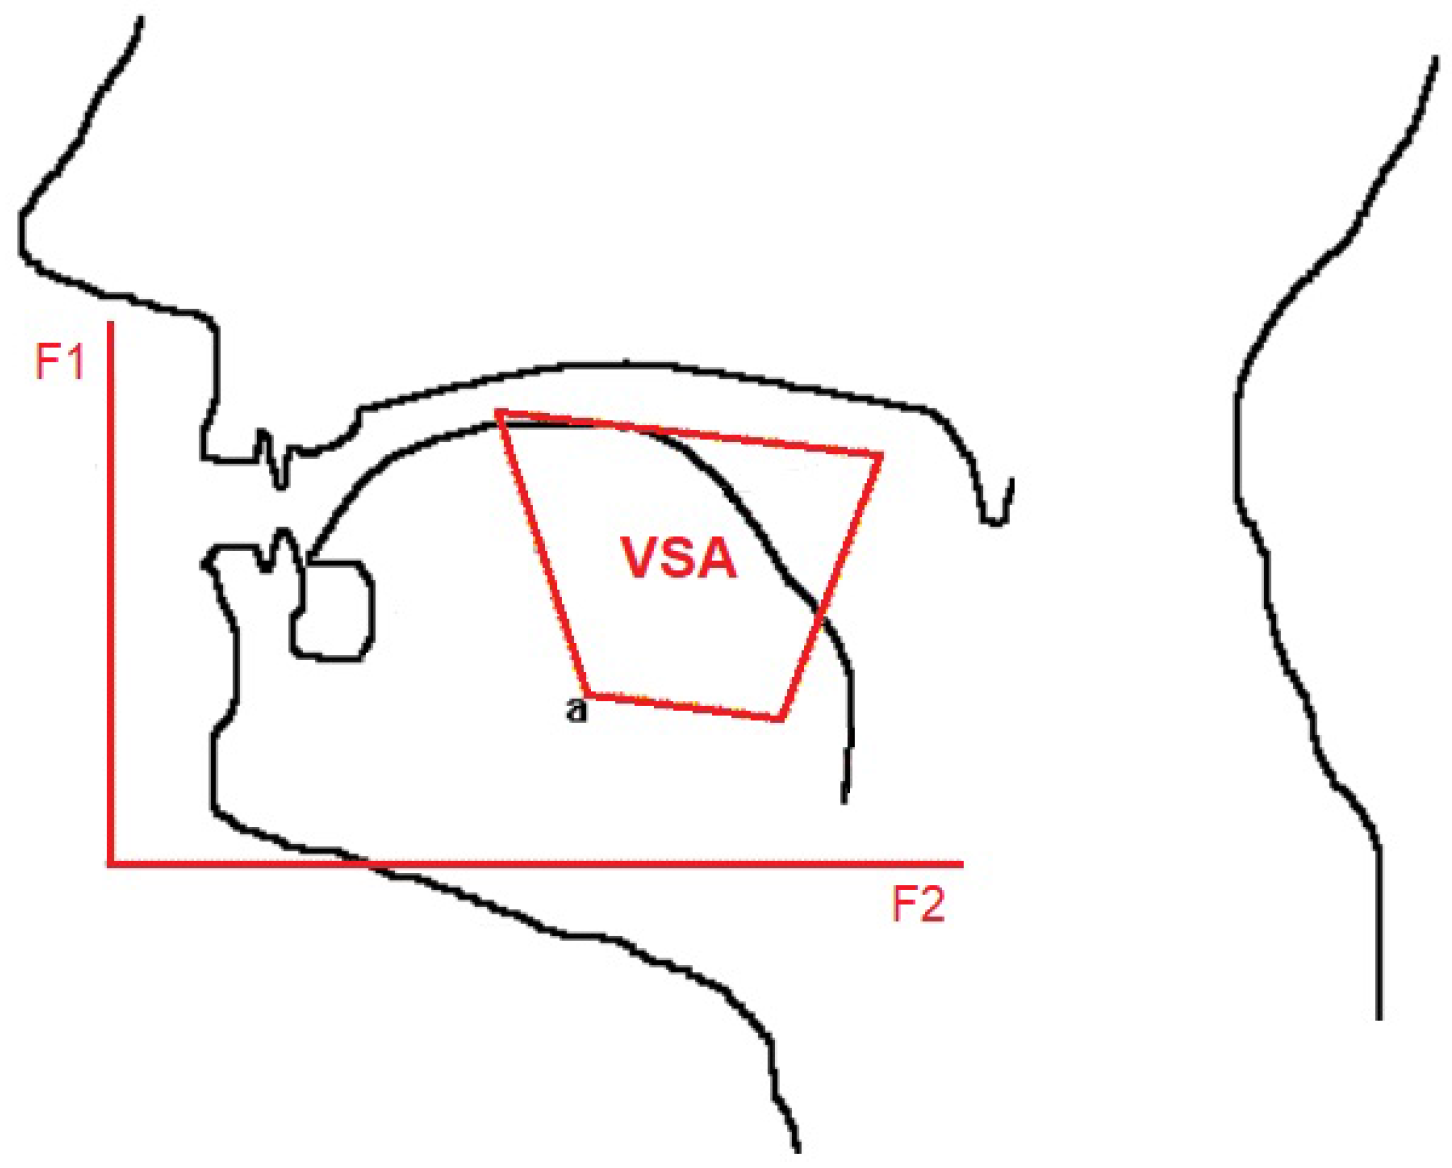
In terms of graphical representation, the vowel space method locates the speech signal related to vowel pronunciation in both acoustic and articulatory space, defined by the first two formants for vowels. This is a bi-dimensional space in the - plane, as shown in Figure 2: the first formant defines the horizontal axis; the second formant defines the vertical axis. is influenced by the tongue body height, and is influenced by the tongue body frontness/backness.
In this articulatory space, the VSA is constructed as the Euclidean distances between the coordinates of the first and the second formant for the corner vowels /i/, /u/, and /a/ or for the corner vowels /i/, /u/, /a/, and /e/. In the first case, a triangular VSA (tVSA) is defined; in the second case, a quadrilateral VSA (qVSA) is used; tVSA and qVSA formulas are reported in the following, in accordance with the literature [45]:
and represent the first and the second formant related to each vowel.
Another important parameter used in vowel metric is the FCR. This is evaluated to enhance the analysis sensibility, because it maximizes the sensitivity to vowel centralization and minimizes the sensitivity to interspeaker variability within measurements. This way, a better identification of dysarthria can be achieved by integrating the results with the tVSA and qVSA. The FCR can be calculated as
The centralization of formants and the reduction of the VSA in dysarthric subjects is widely reported in literature [45,46]. A significant correlation between the VSA and speech intelligibility has been studied. Furthermore, an association between the modification of speech intelligibility and neurodegenerative diseases has been proposed. Consequently, a relationship between the VSA and MS disease can be evaluated.
3. Results and Discussion
The aim of the proposed paper was to study and evaluate the vocal signals of patients affected by MS, in order to identify relevant patterns. Voice data from MS patients have been compared with data from healthy subjects (HS). For this study, 53 pathological patients affected by MS and between 25 and 74 years of age were enrolled at the Neurological Operative Unit, Center of Multiple Sclerosis, in Cosenza (Italy), divided as follows:
- 18 patients affected by SMSP (7 men and 11 women);
- 35 patients affected by SMRR (11 men and 24 women).
Similarly, a set of voices from HS between 24 and 68 years was also acquired. For both sets, a discrimination between men and women was made because of their different vocal characteristics in terms of frequency.
The proposed work can be summarized in three main steps: (i) signal acquisition; (ii) signal processing; and (iii) results evaluation. These steps are shown in Figure 3.
The acquisition protocol was arranged according to physician indications. Informed consent was signed by each enrolled patient before the acquisition procedure. This procedure consisted of a continuous and sustained pronunciation of four vowels /a/, /e/, /i/, and /u/ for 5 s. The acquisition was made inside a clinical laboratory with a controlled acoustic setup and with the subjects sitting comfortably. The vocal signal was recorded with an omnidirectional microphone, by using a sampling frequency of kHz and a resolution of 16 bits. All signals were recorded in wav format and analyzed with PRAAT.
The acquisition procedure was followed by the analysis of the vocal signal by using the methodologies of both acoustic analysis and the vowel metric. Vocal data of patients with MS and HS were processed to evaluate the behavior of their speech and to identify possible significant patterns.
The results of both methodologies are reported below. Moreover, a statistical analysis has been performed to find the most significant results, and two different statistical tests are used to compare the results.
3.1. Results by Acoustical Analysis
PRAAT was used to perform the acoustic analysis on vocal signals for both HS and patients affected by SPMS and by RRMS.
Table 1 reports the results of analysis for both the HS and pathological subjects. For each parameter, the maximum, minimum and mean values are reported for both men and women.
For the fundamental frequency, there was a reduction in for MS patients in accordance with the results reported in Section 2. In detail, an increase in the mean could be observed in men for SPMS, as well as a decrease in the mean in women for both SPMS and RRMS.
In terms of jitter, mean values of less than 0.5% were reported in HS, and mean values greater than 0.5% were reported in pathological patients, in accordance with the indications reported in Section 2. Higher values could be associated to a possible lack of control in cord vibrations for MS disease.
The results of the shimmer confirm those reported in Section 2. The mean values increased in both men and women with reported SPMS. Higher mean values were also observed in females with RRMS. This increase in the pathological subjects could be related to the mass lesions on vocal cords.
Lastly, the HNR values showed an increase in the mean values for pathological patients, and they confirm a reduction of speech efficiency and pureness.
Table 1 reports different behaviors of acoustical parameters for MS patients compared to HS. The results are in agreement with values reported in literature and could be a valid indicator in the diagnosis and monitoring of MS disease.
3.2. Results by Vowel Metric Analysis
The vowel metric works by using the / pairs from each analyzed vocal signal. To find this metric, an algorithm has been developed to (i) load and values extracted by PRAAT software; (ii) calculate tVSA, qVSA and FCR according to Equations (1)–(3) reported in Section 2; and (iii) map / pairs for each vowel in two plots (one for tVSA and one for qVSA) to compare the different behavior between HS and pathological subjects. Figure 4 reports an example of tVSA and qVSA plots generated for HS and pathological patients in blue and in red, respectively.
This figure shows different triangular and quadrilateral shapes among the two classes (healthy and pathological), and this behavior can be explained by analyzing the results reported in Table 2. Specifically, this table reports results concerning the vowel metric analysis for both SPMS and RRMS. Generally, a reduction of the vowel area for pathological subjects was observed. Moreover, there was a remarkable decrease in the area for patients with RRMS, despite that a tVSA increase could be noticed in SPMS patients. Lastly, a slight increase in the FCR values could be observed in patients with MS.
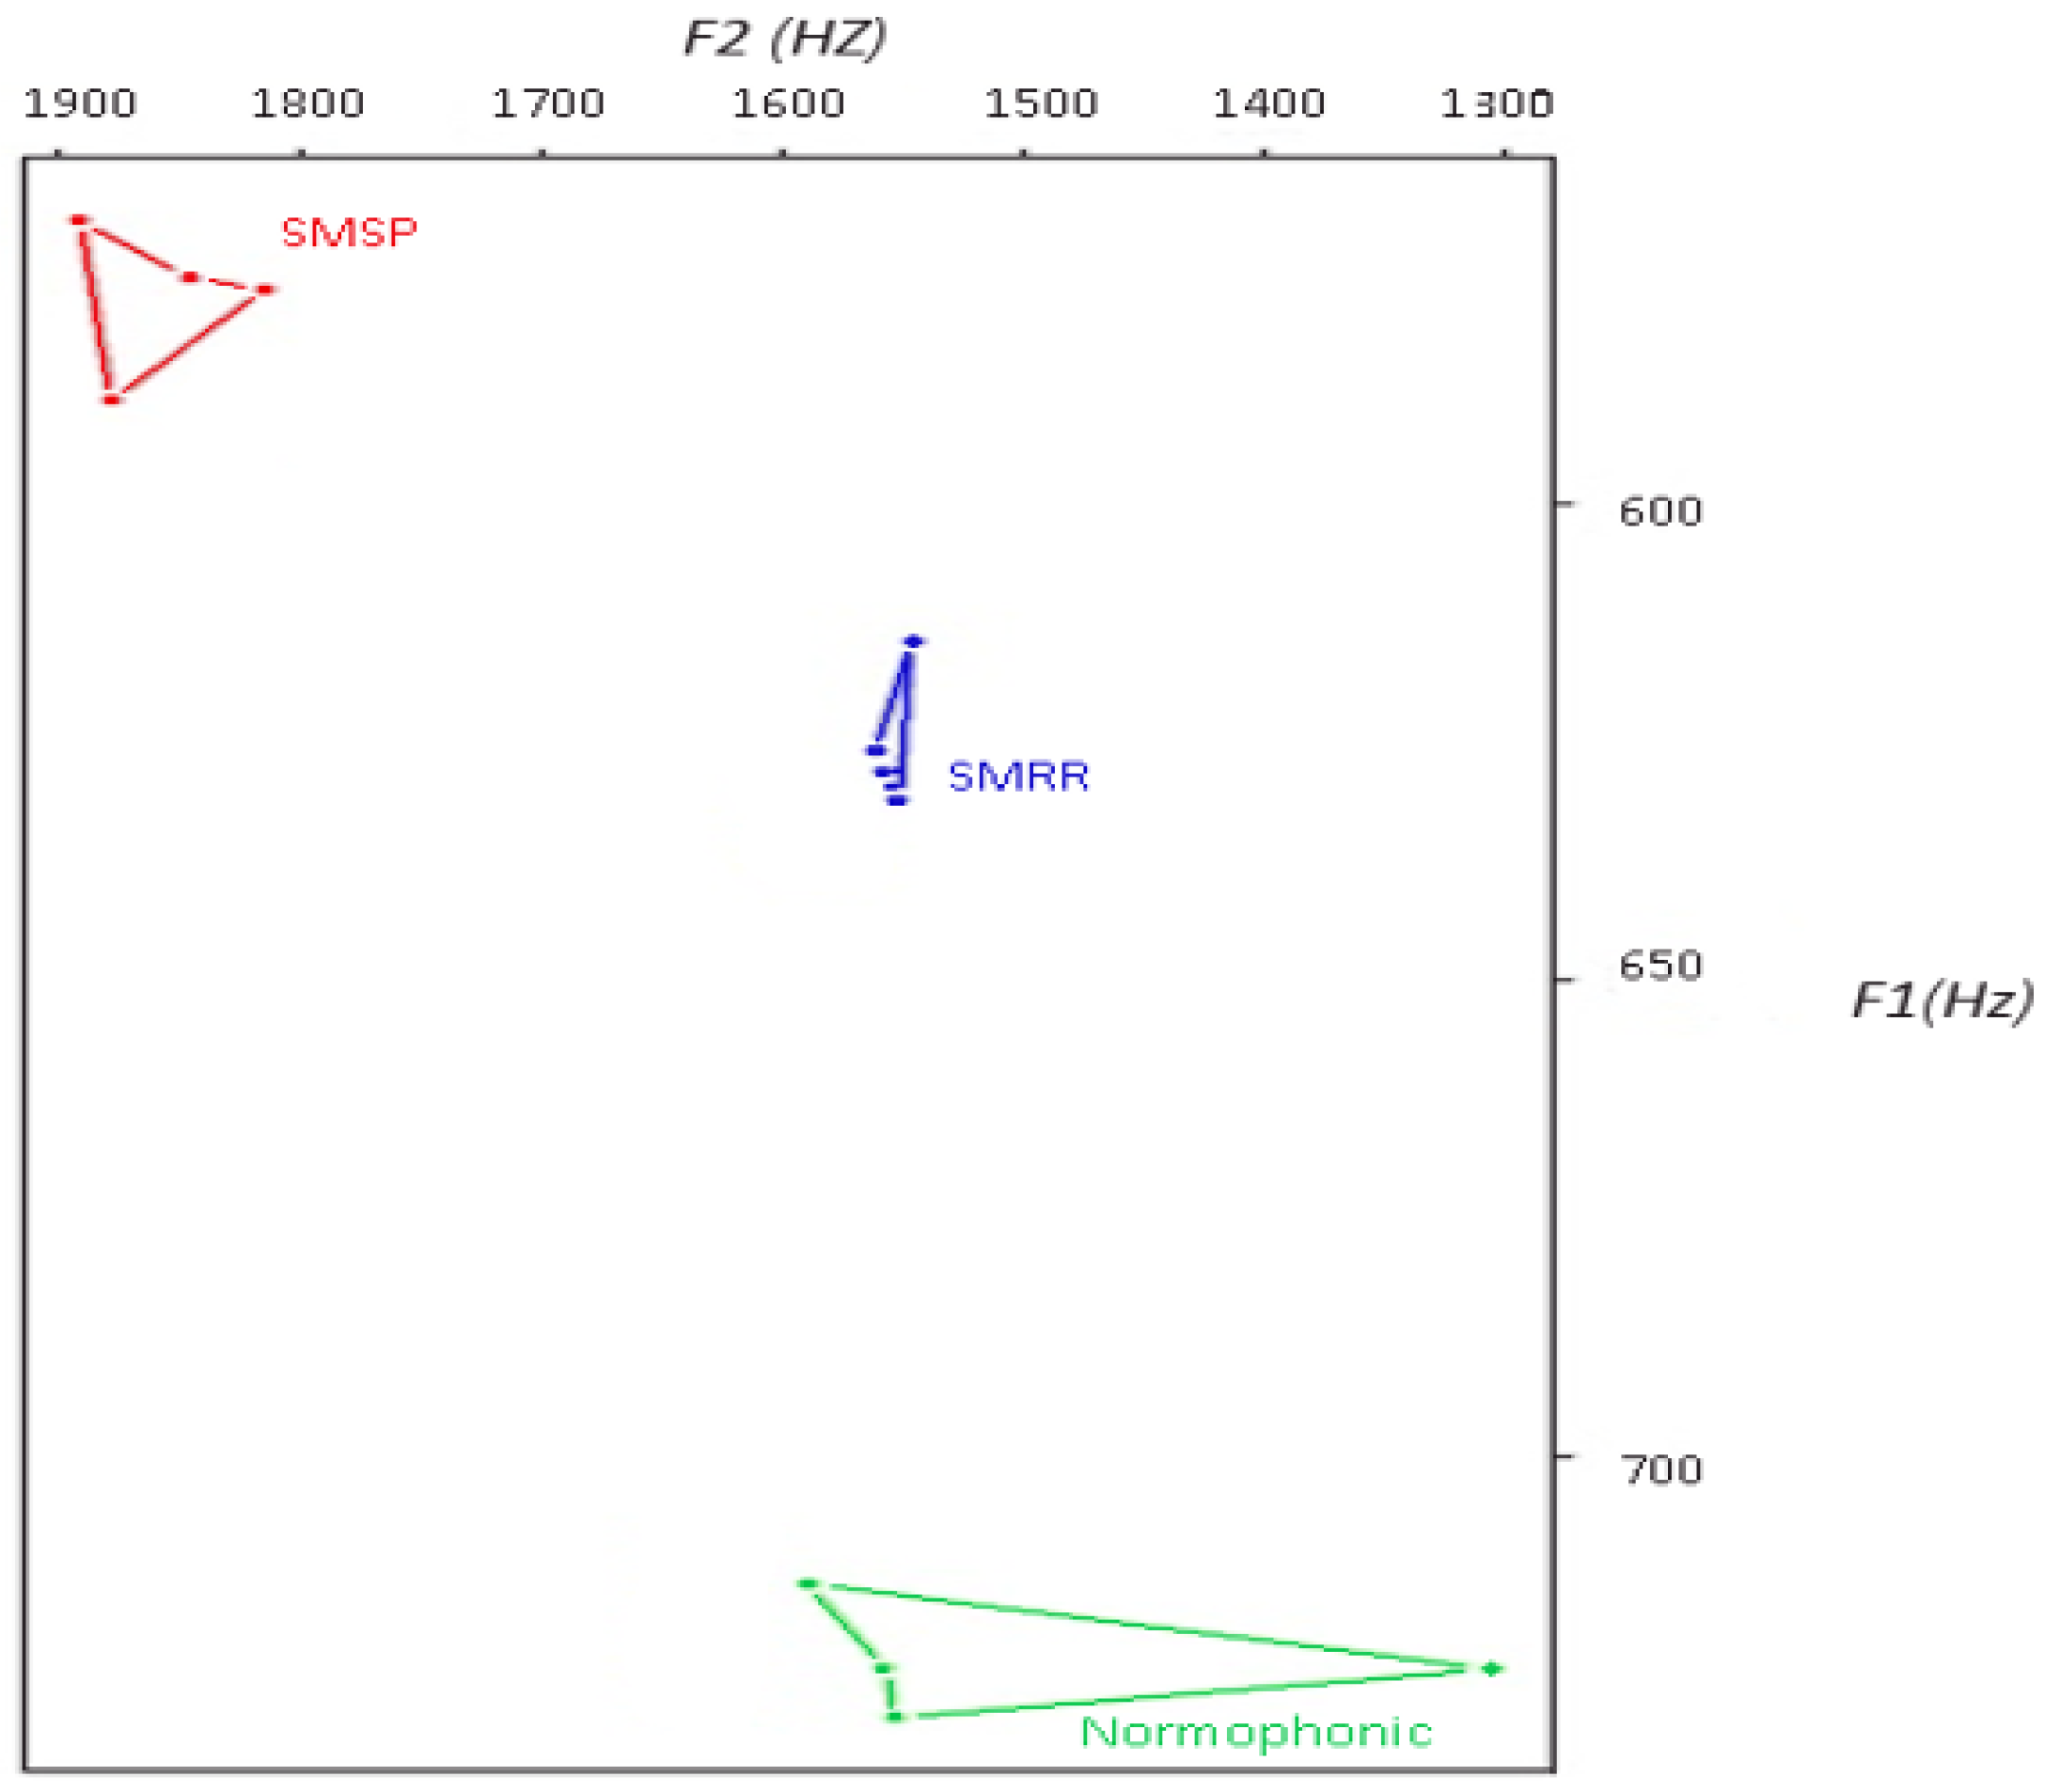
To confirm the difference in vowel areas between HS and pathological subjects, Figure 5 reports a graphical representation of the qVSA values. The qVSA is calculated as the area within the irregular quadrilateral formed by the first and second formants ( and ) of the corner vowels /a/, /u/, /e/, and /i/.
A reduction in the qVSA could be observed in both patients with SPMS and RRMS, but mainly for RRMS subjects. This reduction represents a centralization of formant frequencies appearing in dysarthria cases, as indicated in Section 2.
3.3. Statistical Results
A statistical analysis was performed to evaluate the obtained results. The online tool Simple Interactive Statistical Analysis (SISA) was used to perform the analysis. Two types of statistical tests are proposed to study, evaluate and compare the results.
The t-test has been used to evaluate whether the difference between the means of two samples was relevant. The t-test with a confidence interval of was used to compare the mean of HS and pathological subjects (those with MS). Table 3 reports the results of this test in terms of the mean, standard deviation (SD) and calculated p-value, evaluated for each acoustic parameter.
The main significance difference was for shimmer parameters. In this case, the p-value was less than , which confirms that the observed differences between healthy and pathological subjects’ means were statistically significant, with a confidence level of .
To compare and confirm these results of the t-test, a Wilcoxon test was proposed. The Wilcoxon test is a nonparametric test. It is used for comparing two nonindependent samples to test whether they come from the same distribution. A comparison between the t-test and the Wilcoxon test was proposed because the latter is a nonparametric test, equivalent to the Student’s t-test for paired data, but used when the data is not normally distributed. As for the t-test, the mean, SD and calculated p-value were extracted for each acoustic parameter, and the results are reported in Table 4.
The Wilcoxon test highlights a significant difference between the jitter for HS and pathological subjects.
4. Conclusions
The aim of this contribution is the analysis of the vocal signal to identify dysarthria problems in patients affected by MS. Two methodologies have been proposed to evaluate a possible correlation between acoustic and metric parameters with dysarthria. A voice signal analysis reports interesting results in terms of changes in the vocal signal and vowel articulation for patients with RRMS and SPMS compared to HS. In detail, a reduction of and an increment of the jitter, shimmer and HNR have been reported in MS patients compared to HS. Moreover, a VSA reduction could be identified in pathological disease patients, both in terms of tVSA and qVSA. The result of the study confirms the initial hypothesis that pathological subjects have a speech disorder. This disorder can be associated with the dysarthria in neurological diseases. Two statistical tests, the t-test and Wilcoxon test, have also been proposed to validate these results; significant differences could be found for the jitter and shimmer parameters in HS and pathological subjects. The presented results have been clinically validated, and they can be considered as a preliminary result to identify dysarthria-related parameters in MS patients. This identification could provide valid support in clinical applications for the early diagnosis and monitoring of MS disease.
Acknowledgments
We thank Simone Longo for his contribution in the vocal signal acquisition.
Author Contributions
Patrizia Vizza and Giuseppe Tradigo share the first authorship and are responsible of designing the research contribution. Domenico Mirarchi contributed to design and implement the proposal solution and he is also responsible of testing algorithms. Roberto Bruno Bossio is a physician and he is responsible of selecting and validating clinical and medical aspects. Pierangelo Veltri supervised and revised the paper. All aturhors wrote the paper.
Conflicts of Interest
The authors declare no conflict of interest.
References
- Scarpini, E. Neurodegenerative Diseases: Clinical Aspects, Molecular Genetics and Biomarkers; Springer Science and Business: Berlin, Germany, 2014. [Google Scholar]
- Bethoux, F.; Robert, J.F. Multiple Sclerosis and Related Disorders: Diagnosis, Medical Management, and Rehabilitation; Demos Medical Publishing: New York, NY, USA, 2013. [Google Scholar]
- Lublin, F.D.; Reingold, S.C.; Cohen, J.A.; Cutter, G.R.; Sorensen, P.S.; Thompson, A.J. Defining the clinical course of multiple sclerosis, the 2013 revisions. Neurology 2014, 83, 278–286. [Google Scholar] [CrossRef] [PubMed]
- Murdoch, B.E. Acquired Speech and Language Disorders; John Wiley and Sons: Hoboken, NJ, USA, 2013. [Google Scholar]
- Campbell, W.W. Pocket Guide and Toolkit to Dejong’s Neurologic Examination; Lippincott Williams and Wilkins: Philadelphia, PA, USA, 2007. [Google Scholar]
- Rahimifar, P.; Soltani, M.; Moradi, N. Rehabilitation Treatment In Dysarthria Caused By Stroke. Adv. Biosci. Clin. Med. 2017, 26, 1–6. [Google Scholar] [CrossRef]
- Mirarchi, D.; Vizza, P.; Tradigo, G.; Lombardo, N.; Arabia, G.; Veltri, P. Signal Analysis for Voice Evaluation in Parkinson’s Disease. In Proceedings of the IEEE International Conference on Healthcare Informatics, Park City, UT, USA, 23–26 August 2017. [Google Scholar]
- Baghai-Eavary, L.; Beet, S.W. Automatic Speech Signal Analysis for Clinical Diagnosis and Assessment of Speech Disorders; Springer: Berlin, Germany, 2012. [Google Scholar]
- Shaoa, J.; MacCallumb, J.K.; Zhangb, Y.; Sprecherb, A.; Jianga, J.J. Acoustic analysis of the tremulous voice: Assessing the utility of the correlation dimension and perturbation parameters. J. Commun. Disord. 2010, 43, 35–44. [Google Scholar] [CrossRef] [PubMed]
- Barsties, B.; Bodt, M.D. Assessment of voice quality: Current state-of-the-art. Auris Nasus Larynx 2015, 42, 183–188. [Google Scholar] [CrossRef] [PubMed]
- Tjaden, K.; Wilding, G.E. Effect of Rate Reduction and Increased Loudness on Acoustic Measures of Anticipatory Coarticulation in Multiple Sclerosis and Parkinson’s Disease. J. Speech Lang. Hear. Res. 2005, 48, 261–277. [Google Scholar] [CrossRef]
- Sussman, J.E.; Tjaden, K. Perceptual measures of speech from individuals with Parkinson’s disease and multiple sclerosis: Intelligibility and beyond. J. Speech Lang. Hear. Res. 2012, 55, 1208–1219. [Google Scholar] [CrossRef]
- Rusz, J.; Cmejla, R.; Ruzickova, H.; Ruzicka, E. Quantitative acoustic measurements for characterization of speech and voice disorders in early untreated Parkinson’s disease. J. Acoust. Soc. Am. 2011, 129, 350–367. [Google Scholar] [CrossRef] [PubMed]
- Tjaden, K.; Lam, J.; Wilding, G. Vowel acoustics in Parkinson’s disease and multiple sclerosis: Comparison of clear, loud, and slow speaking conditions. J. Speech Lang. Hear. Res. 2013, 56, 1485–1502. [Google Scholar] [CrossRef]
- Sapir, S.; Ramig, L.; Fox, C. Speech and swallowing disorders in Parkinson disease. Curr. Opin. Otolaryngol. Head Neck Surg. 2008, 16, 205–210. [Google Scholar] [CrossRef] [PubMed]
- Teixeira, J.P.; Oliveira, C.; Lopes, C. Vocal Acoustic Analysis–Jitter, Shimmer and HNR Parameters. In Proceedings of the CENTERIS 2013 Conference on ENTERprise Information Systems/HCIST 2013, International Conference on Health and Social Care Information Systems and Technologies, Lisboa, Portugal, 23–25 October 2013; pp. 1112–1122. [Google Scholar]
- Lansford, K.L.; Liss, J.M. Vowel acoustics in dysarthria: Speech disorder diagnosis and classification. J. Speech Lang. Hear. Res. 2014, 57, 57–67. [Google Scholar] [CrossRef]
- Palumbo, A.; Veltri, P.; Calabrese, B.; Vizza, P.; Cannataro, M.; Garozzo, A.; Lombardo, N.; Amato, F. Experiences of Using a DSP Based Device for Vocal Signal Analysis. In MAVEBA: Models and Analysis of Vocal Emissions for Biomedical Applications; Firenze University Press: Florence, Italy, 2011; pp. 187–189. [Google Scholar]
- Rani, K.U.; Holi, M.S. Analysis of Speech Characteristics of Neurological Diseases and Their Classification. In Proceedings of the Third IEEE International Conference on Computing Communication and Networking Technologies, Karur, India, 26–28 July 2012; pp. 1–6. [Google Scholar]
- Bauer, V.; Aleric, Z.; Jancic, E. Comparing Voice Self-Assessment with Auditory Perceptual Analysis in Patients with Multiple Sclerosis. Int. Arch. Otorhinolaryngol. 2015, 19, 100–105. [Google Scholar] [PubMed]
- Hartelius, L.; Nord, L.; Buder, E.H. Acoustic analysis of dysarthria associated with multiple sclerosis. Clin. Linguist. Phon. 1995, 9, 95–120. [Google Scholar] [CrossRef]
- Feijó, A.V.; Parente, M.A.; Behlau, M.; Haussen, S.; de Veccino, M.C.; Martignago, B.C. Acoustic Analysis of Voice in Multiple Sclerosis Patients. J. Voice 2004, 18, 341–347. [Google Scholar] [CrossRef] [PubMed]
- García, M.J.V.; Cobeta, I.; Martín, G.; Alonso-Navarro, H.; Jimenez-Jimenez, F.J. Acoustic Analysis of Voice in Huntington’s Disease Patients. J. Voice 2011, 25, 208–217. [Google Scholar] [CrossRef] [PubMed]
- Maryn, Y.; Weenink, D. Objective Dysphonia Measures in the Program Praat: Smoothed Cepstral Peak Prominence and Acoustic Voice Quality Index. J. Voice 2015, 29, 35–43. [Google Scholar] [CrossRef] [PubMed]
- Manfredi, C.; Giordano, A.; Schoentgen, J.; Fraj, S.; Bocchi, L.; Dejonckere, P.H. Perturbation measurements in highly irregular voice signals: Performances/validity of analysis software tools. Biomed. Signal Process. Control 2012, 7, 409–416. [Google Scholar] [CrossRef]
- Sandoval, S.; Berisha, V.; Utianski, R.L.; Liss, J.M.; Spanias, A. Automatic assessment of vowel space area. J. Acoust. Soc. Am. 2013, 134, 477–483. [Google Scholar] [CrossRef] [PubMed]
- Sapir, S.; Ramig, L.O.; Spielman, J.L.; Fox, C. Acoustic metrics of vowel articulation in Parkinson’s disease: Vowel space area (VSA) vs. vowel articulation index (VAI). In MAVEBA: Models and Analysis of Vocal Emissions for Biomedical Applications; Firenze University Press: Florence, Italy, 2011; pp. 173–175. [Google Scholar]
- Mekyska, J.; Rektorova, I.; Smekal, Z. Objective Automatic Assessment of Rehabilitative Speech Treatment in Parkinson’s Disease. In Proceedings of the 34th IEEE International Conference on Telecommunications and Signal Processing, Budapest, Hungary, 18–20 August 2011. [Google Scholar]
- Veltri, P.; Cannataro, M.; Tradigo, G. Sharing mass spectrometry data in a grid-based distributed proteomics laboratory. Inf. Process. Manag. 2007, 43, 577–591. [Google Scholar] [CrossRef]
- Vizza, P.; Curcio, A.; Tradigo, G.; Indolfi, C.; Veltri, P. A framework for the atrial fibrillation prediction in electrophysiological studies. Comput. Methods Progr. Biomed. 2015, 120, 65–76. [Google Scholar] [CrossRef] [PubMed]
- Cannataro, M.; Guzzi, P.H.; Veltri, P. IMPRECO: Distributed prediction of protein complexes. Future Gener. Comput. Syst. 2010, 26, 434–440. [Google Scholar] [CrossRef]
- Dogan, M.; Midi, I.; Yazici, M.A.; Kocak, I.; Günal, D.; Sehitoglu, M.A. Objective and subjective evaluation of voice quality in multiple sclerosis. J. Voice 2007, 21, 735–740. [Google Scholar] [CrossRef] [PubMed]
- Murry, T.; Rosen, C.A. Outcome measurements and quality of life in voice disorders. Otolaryngol. Clin. N. Am. 2000, 33, 905–916. [Google Scholar] [CrossRef]
- Hardcastle, W.J.; Laver, J.; Gibbon, F.E. The Handbook of Phonetic Sciences; John Wiley and Sons: Hoboken, NJ, USA, 2010. [Google Scholar]
- Neuroscience News. Study Shows How the Nanog Protein Promotes Growth of Head and Neck Cancer. 2013. Available online: http://neurosciencenews.com (accessed on 26 November 2017).
- Scott, S.; McGettigan, C. The Voice: From Identity to Interactions. In APA Handbook of Nonverbal Communication; American Psychological Association: Washington, DC, USA, 2015. [Google Scholar]
- Vizza, P.; Mirarchi, D.; Tradigo, G.; Redavide, M.; Bossio, R.; Veltri, P. Vocal signal analysis in patients affected by Multiple Sclerosis. Procedia Comput. Sci. 2017, 108, 1205–1214. [Google Scholar] [CrossRef]
- Zwetsch, I.; Fagundes, R.; Russomano, T.; Scolari, D. Digital signal processing in the differential diagnosis of beningn larynx diseases. Sci. Med. 2006, 16, 109–114. [Google Scholar]
- Harrington, J.; Cassidy, S. Techniques in Speech Acoustics; Springer: Berlin, Germany, 2012. [Google Scholar]
- Williamson, G. Human Communication: A Linguistic Introduction; Speechmark Publishing: Brackley, UK, 2001. [Google Scholar]
- Farrus, M.H.; Ejarque, P. Jitter and Shimmer Measurements for Speaker Recognition. In Interspeech, Proceedings of the 8th Annual Conference of the International Speech Communication Association, Antwerp, Belgium, 27–31 August 2007; International Speech Communication Association (ISCA): Stockholm, Sweden, 2007; pp. 778–781. [Google Scholar]
- Casper, J.K.; Leonard, R. Understanding Voice Problems: A Physiological Perspective for Diagnosis and Treatment; Lippincott Williams and Wilkins: Philadelphia, PA, USA, 2006. [Google Scholar]
- Vorperian, H.K.; Kent, R.D. Vowel acoustic space development in children: A synthesis of acoustic and anatomic data. J. Speech Lang. Hear. Res. 2007, 50, 1510–1545. [Google Scholar] [CrossRef]
- Kewley-Port, D.; Burkle, T.Z.; Lee, J.H. Contribution of consonant versus vowel information to sentence intelligibility for young normal-hearing and elderly hearing-impaired listeners. J. Acoust. Soc. Am. 2007, 122, 2365–2375. [Google Scholar] [CrossRef] [PubMed]
- Sapir, S.; Ramig, L.O.; Spielman, J.L.; Fox, C. Formant centralization ratio: A proposal for a new acoustic measure of dysarthric speech. J. Speech Lang. Hear. Res. 2010, 53, 114–125. [Google Scholar] [CrossRef]
- Liu, H.M.; Tsao, F.M.; Kuhl, P.K. The effect of reduced vowel working space on speech intelligibility in Mandarin-speaking young adults with cerebral palsy. J. Acoust. Soc. Am. 2005, 117, 3879–3889. [Google Scholar] [CrossRef] [PubMed]
Figure 1.
Representation of phonetic apparatus (from Neuroscience News, 2013).
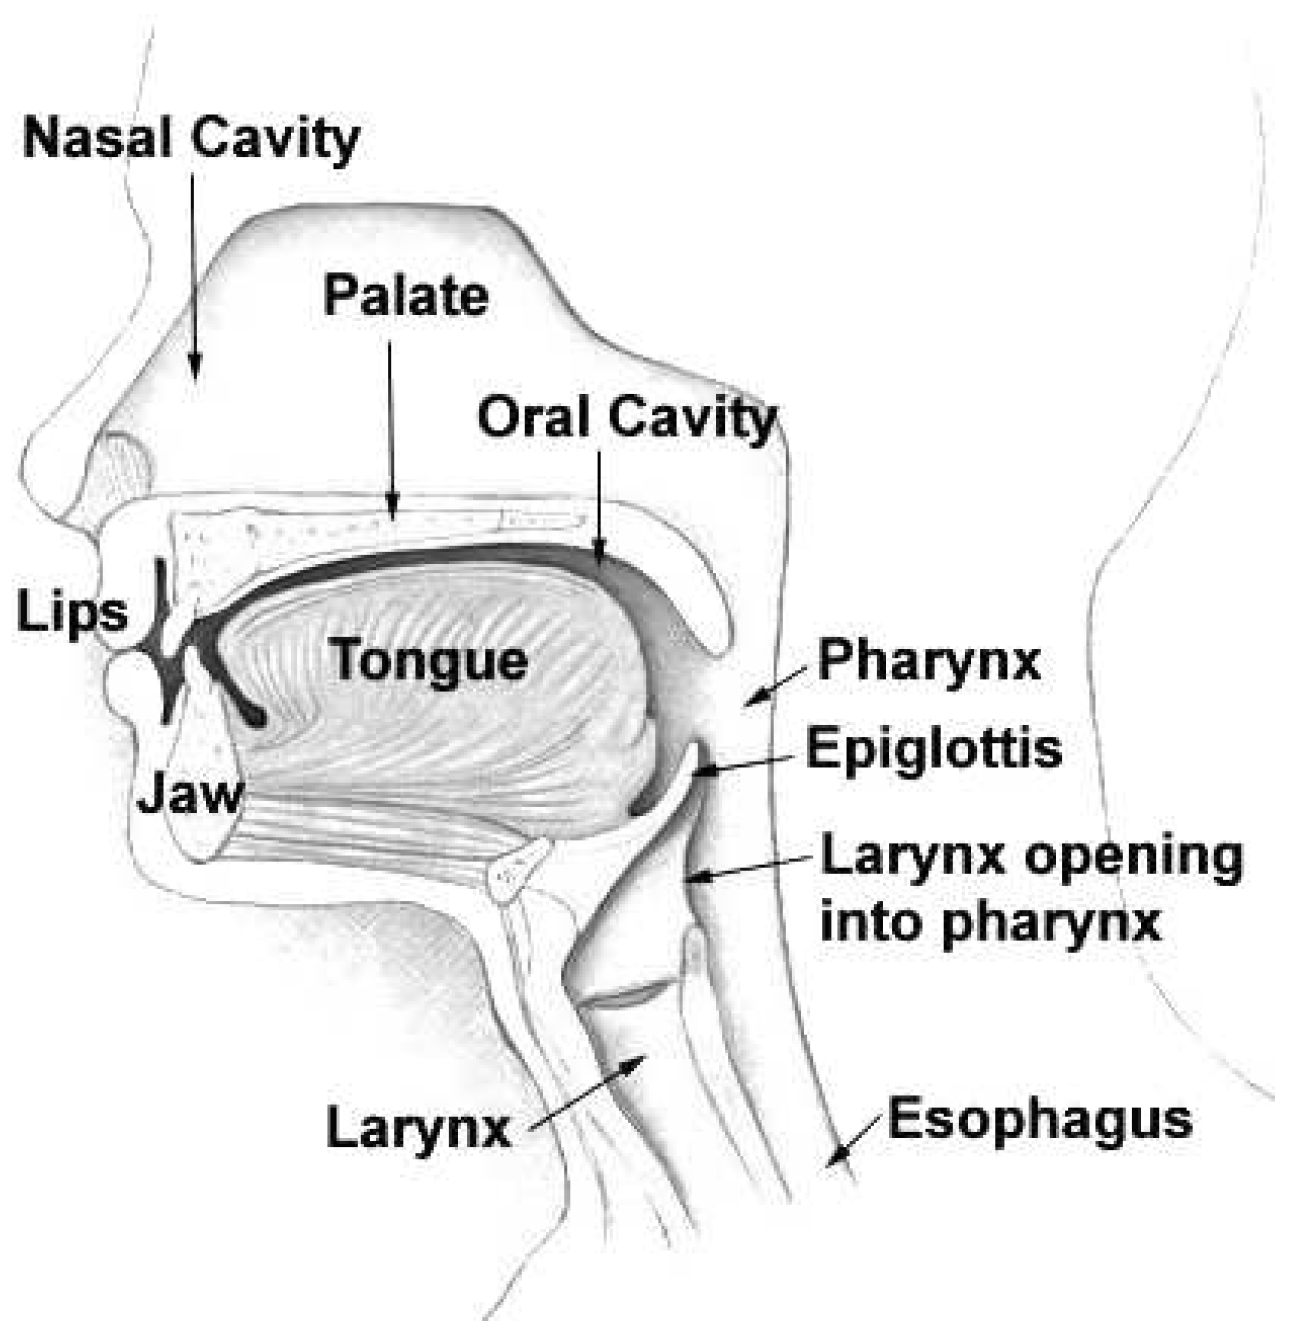
Figure 2.
Vowel space area.

Figure 3.
Workflow of voice signal analysis.
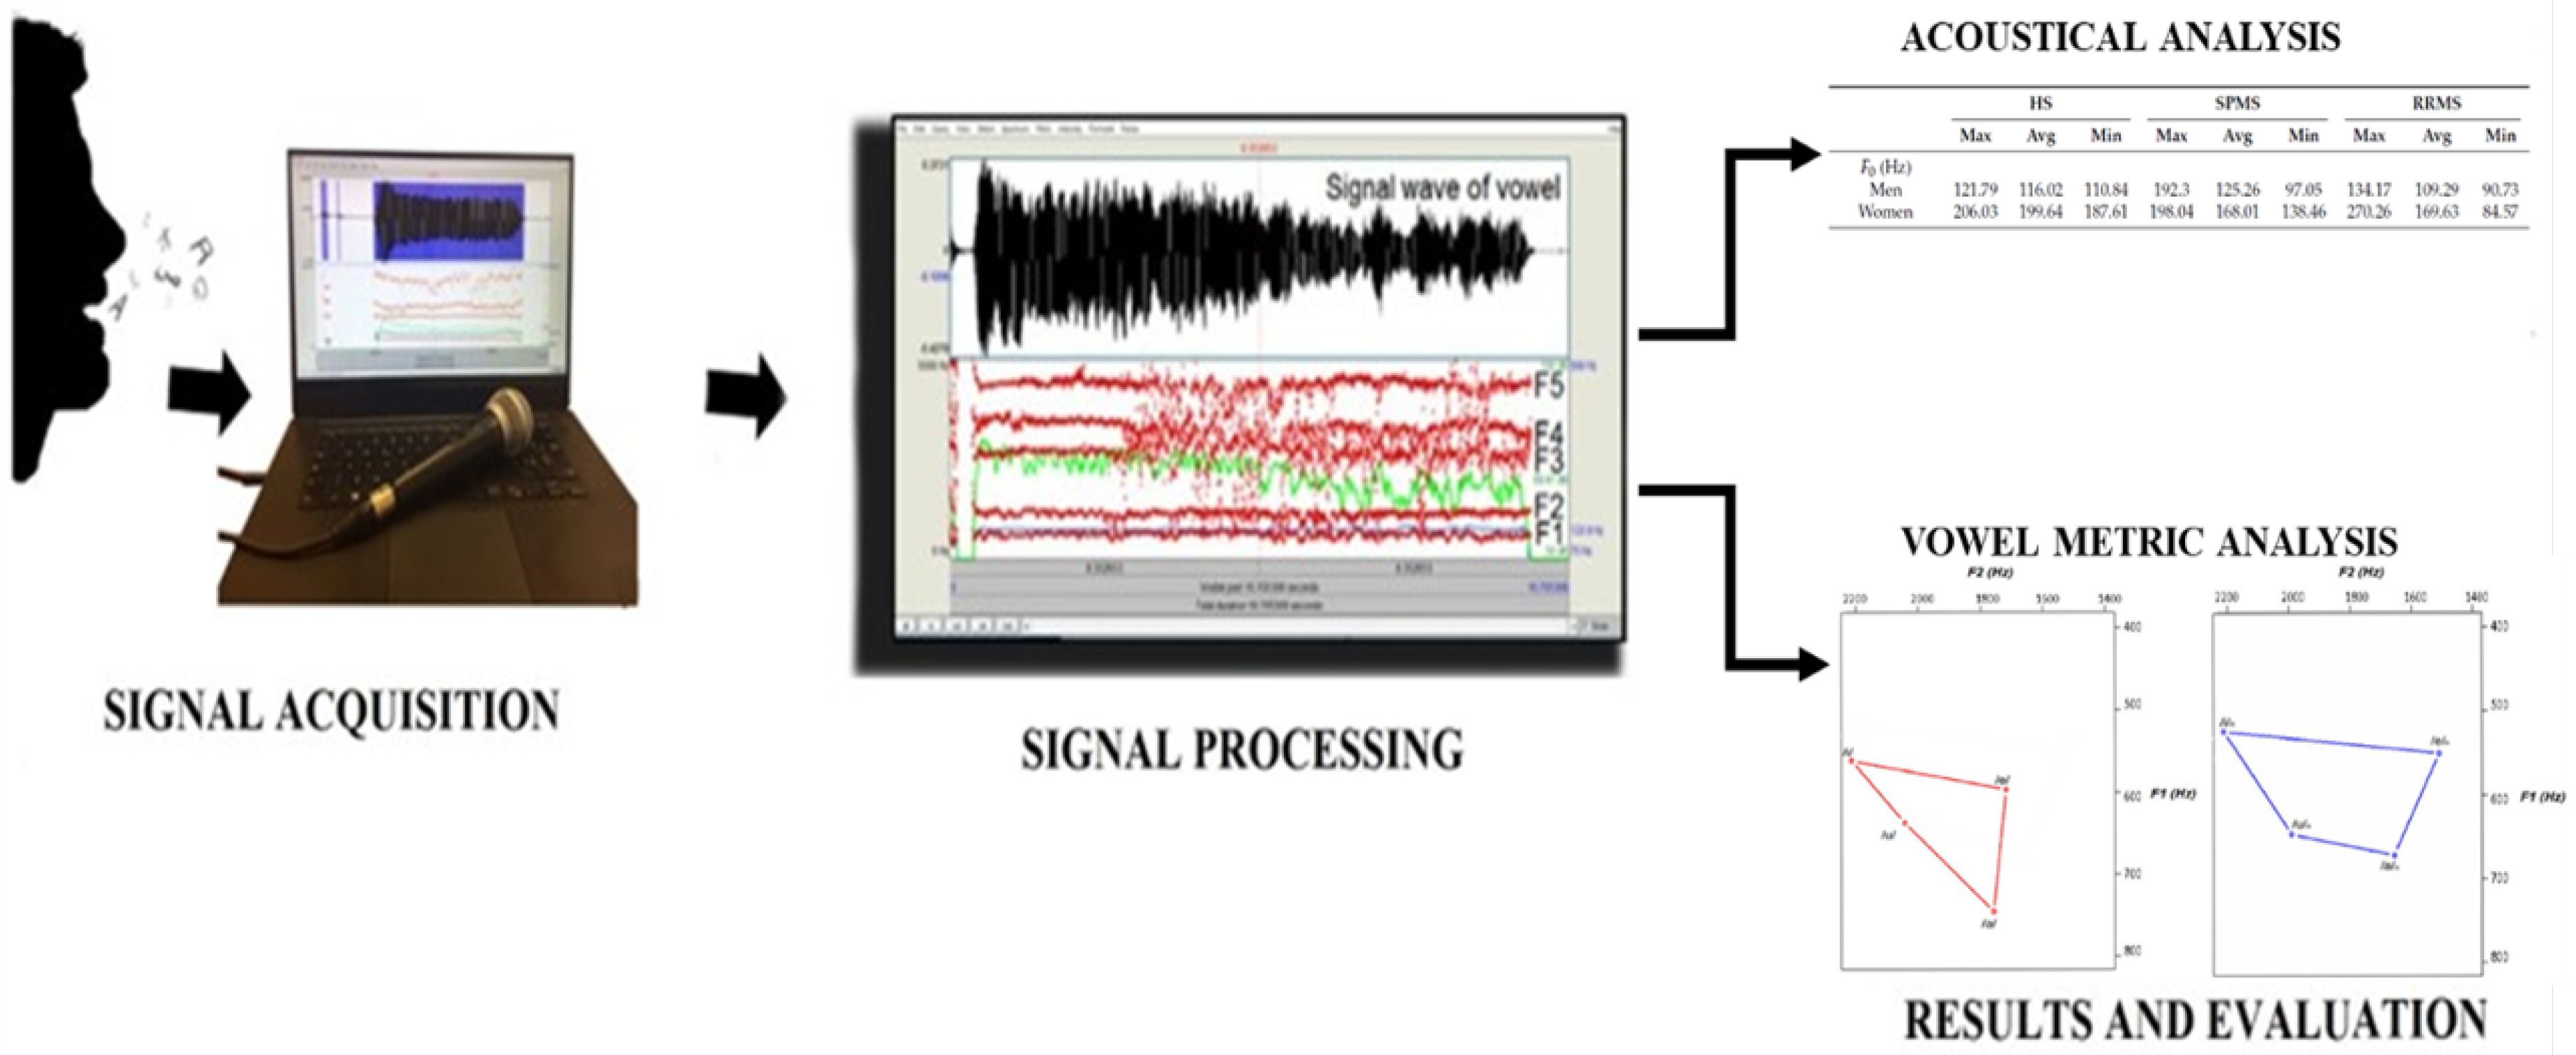
Figure 4.
Quadrilateral vowel space area (qVSA) and triangular VSA (tVSA) for healthy subjects (blue) and pathological subjects (red).
Figure 4.
Quadrilateral vowel space area (qVSA) and triangular VSA (tVSA) for healthy subjects (blue) and pathological subjects (red).
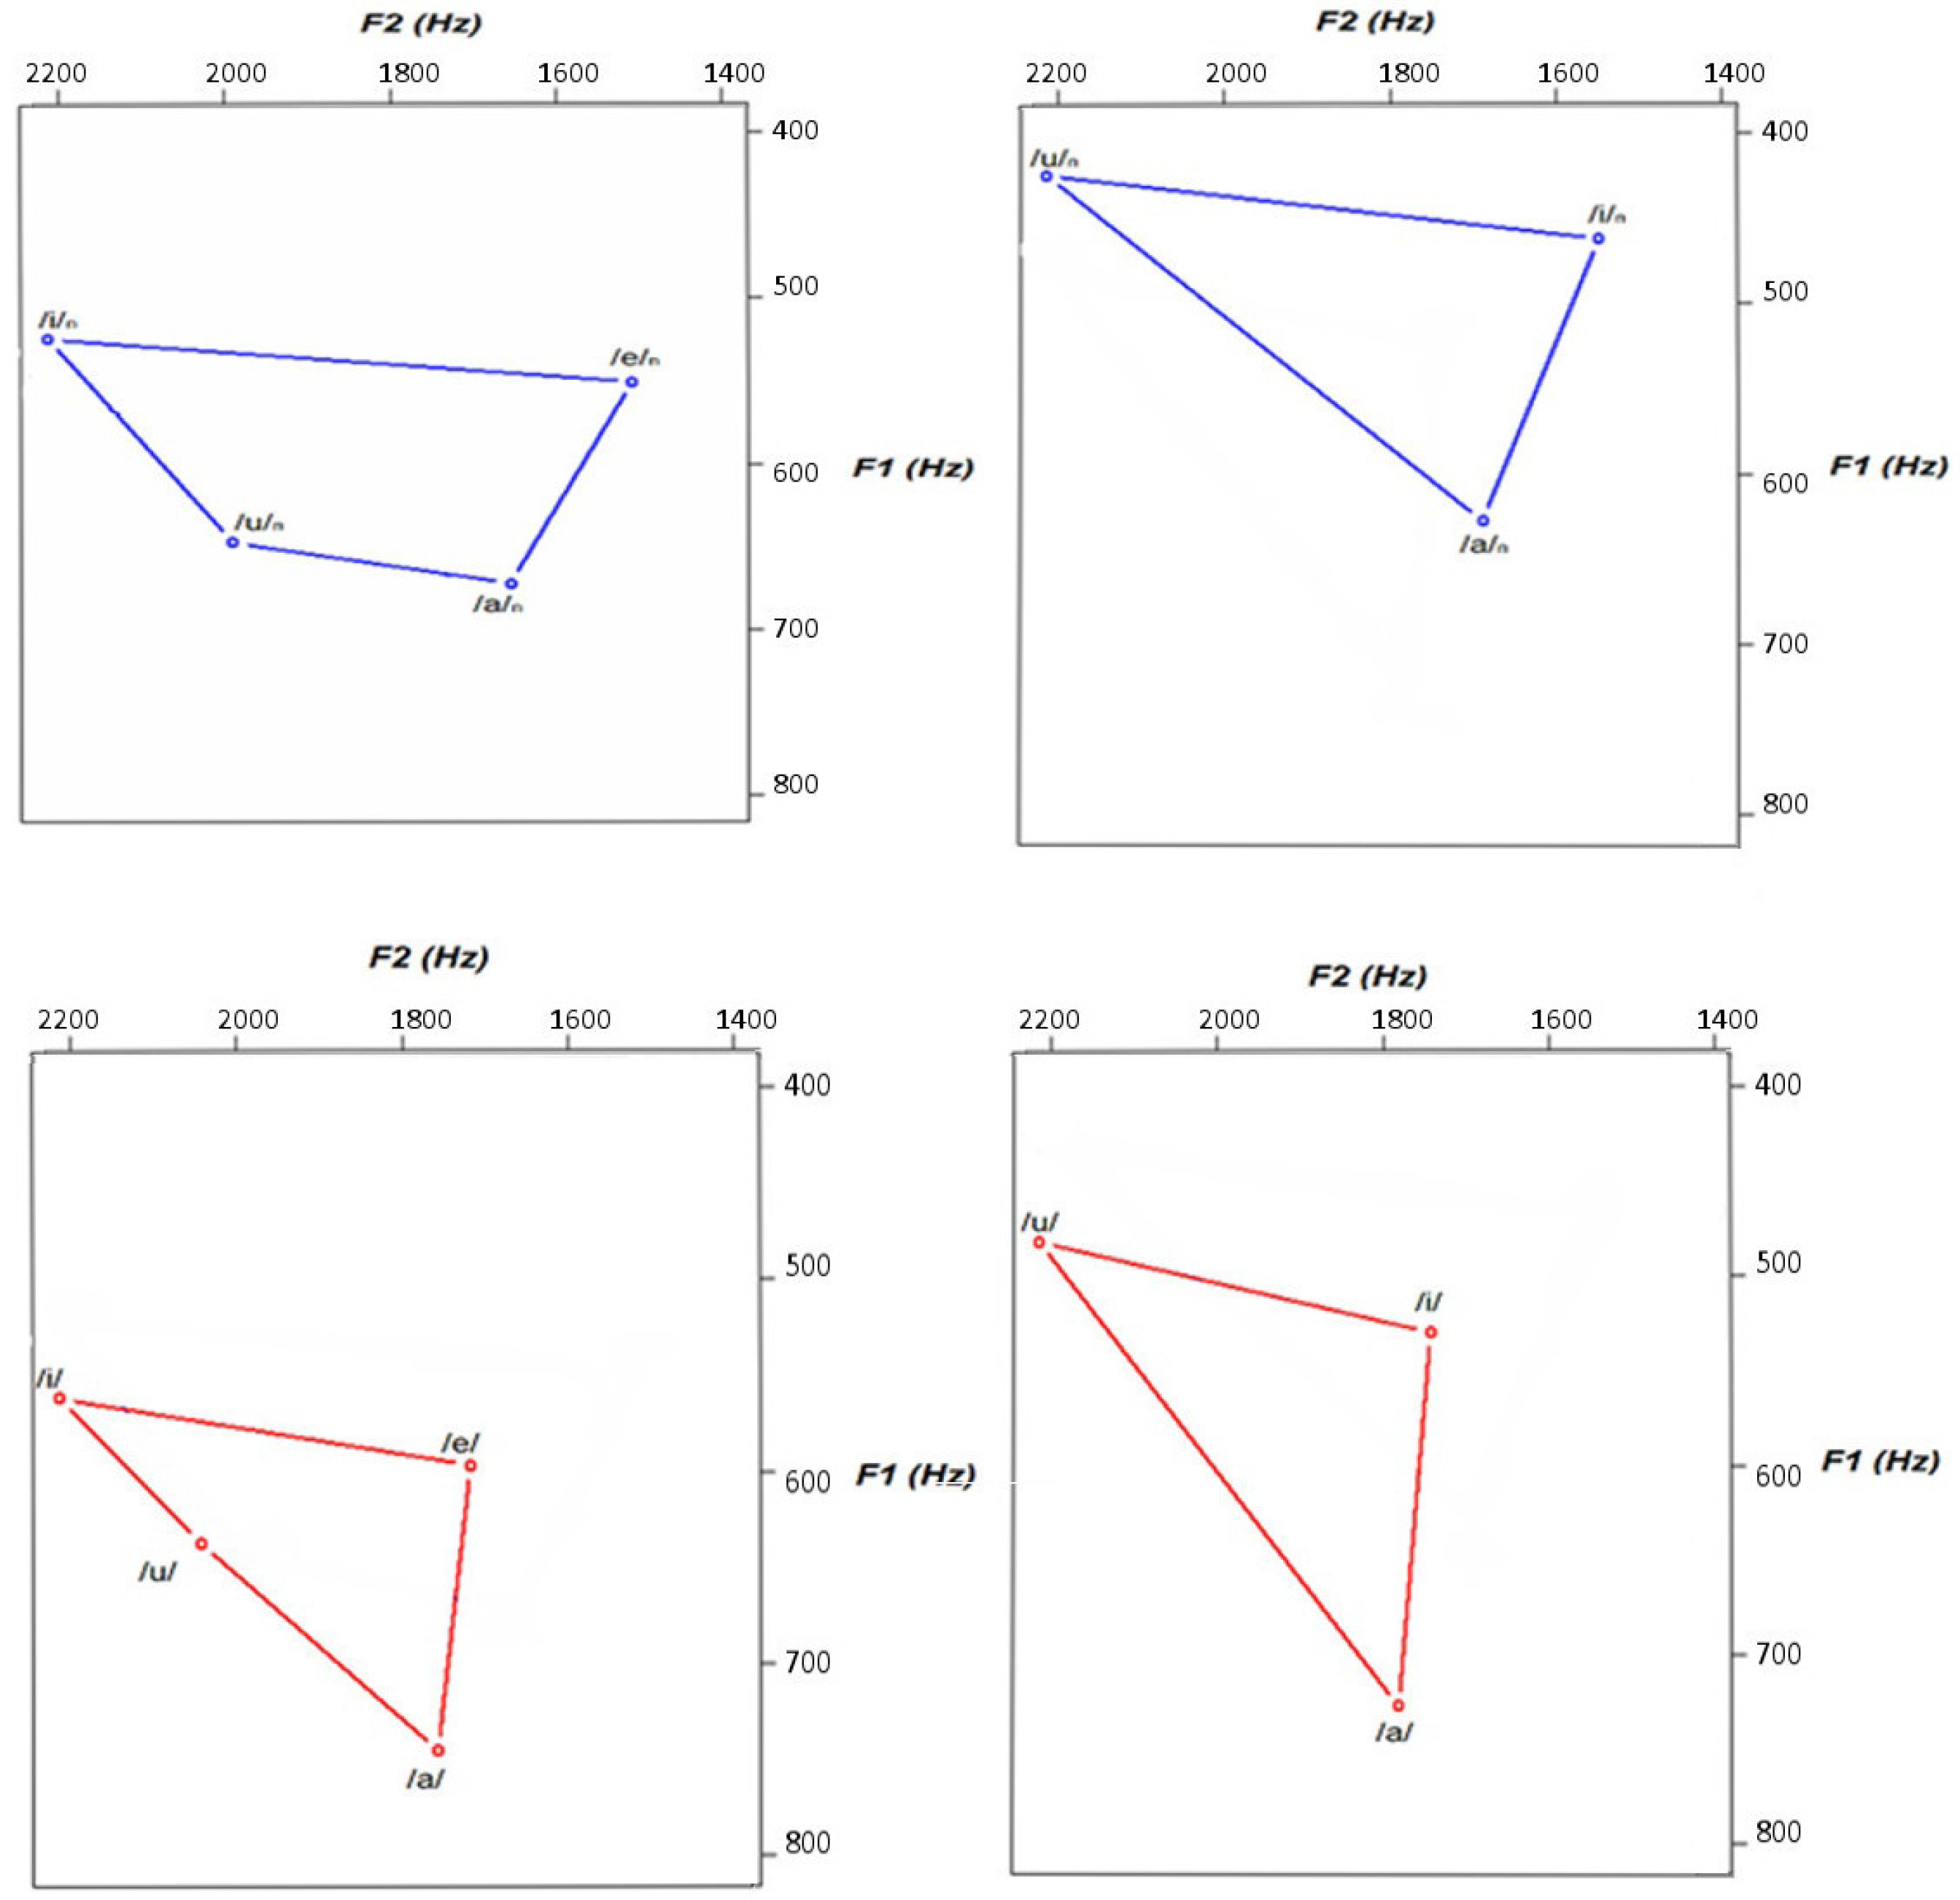
Figure 5.
Quadrilateral vowel space area (qVSA) for healthy (green), relapsing–remitting multiple sclerosis (RRMS; blue) and secondary progressive MS (SPMS; red) subjects.
Figure 5.
Quadrilateral vowel space area (qVSA) for healthy (green), relapsing–remitting multiple sclerosis (RRMS; blue) and secondary progressive MS (SPMS; red) subjects.

Table 1.
Results of the Fundamental Frequency for healthy subjects (HS) and patients affected by secondary progressive multiple sclerosis (SPMS) and relapsing–remitting MS (RRMS).
Table 1.
Results of the Fundamental Frequency for healthy subjects (HS) and patients affected by secondary progressive multiple sclerosis (SPMS) and relapsing–remitting MS (RRMS).
| HS | SPMS | RRMS | |||||||
|---|---|---|---|---|---|---|---|---|---|
| Max | Avg | Min | Max | Avg | Min | Max | Avg | Min | |
| (Hz) | |||||||||
| Men | 121.79 | 116.02 | 110.84 | 192.3 | 125.26 | 97.05 | 134.17 | 109.29 | 90.73 |
| Women | 206.03 | 199.64 | 187.61 | 198.04 | 168.01 | 138.46 | 270.26 | 169.63 | 84.57 |
| Jitter (%) | |||||||||
| Men | 0.42 | 0.36 | 0.29 | 1.83 | 0.7 | 0.19 | 4.57 | 0.79 | 0.21 |
| Women | 0.4 | 0.32 | 0.21 | 3.83 | 0.82 | 0.12 | 2.99 | 0.5 | 0.08 |
| Shimmer (%) | |||||||||
| Men | 15.16 | 8.46 | 3.98 | 13.54 | 8.7 | 4.67 | 22.06 | 8.13 | 2.31 |
| Women | 8.06 | 5.81 | 4.63 | 16 | 8 | 2 | 16.51 | 6.73 | 2.94 |
| Harmonic Noise Ratio (dB) | |||||||||
| Men | 20.25 | 13.44 | 9.6 | 18.15 | 14.29 | 11.23 | 21.01 | 14.39 | 4.25 |
| Women | 18.26 | 16.71 | 13.09 | 27.64 | 17.42 | 7.31 | 26.16 | 16.98 | 6.71 |
Table 2.
Results expressed as average values for triangular vowel space area (tVSA), quadrilateral VSA (qVSA) and formant centralization ratio (FCR) for healthy subjects (HS) and patients affected by secondary progressive multiple sclerosis (SPMS) and relapsing–remitting MS (RRMS).
Table 2.
Results expressed as average values for triangular vowel space area (tVSA), quadrilateral VSA (qVSA) and formant centralization ratio (FCR) for healthy subjects (HS) and patients affected by secondary progressive multiple sclerosis (SPMS) and relapsing–remitting MS (RRMS).
| Metric | HS | SPMS | RRMS |
|---|---|---|---|
| tVSA | 579.8 | 673.45 | 97.45 |
| qVSA | 674.23 | 525.89 | 108.56 |
| FCR | 1.95 | 1.96 | 1.98 |
Table 3.
Results of t-test for healthy subjects (HS) and pathological patients (MS).
| Parameter | Subjects | Number | Mean | Standard Deviation | p-Value |
|---|---|---|---|---|---|
| HS | 7 | 165.08 | 51.4 | 0.97 | |
| MS | 55 | 179.9 | 25.7 | ||
| Harmonic Noise Ratio | HS | 7 | 0.035 | 0.047 | 0.47 |
| MS | 55 | 0.057 | 0.069 | ||
| Jitter | HS | 7 | 0.341 | 0.0007 | 0.379 |
| MS | 55 | 0.65 | 0.0085 | ||
| Shimmer | HS | 7 | 6.9 | 0.3 | 0.027 |
| MS | 55 | 8.07 | 0.04 |
Table 4.
Results of Wilcoxon test for healthy subjects (HS) and pathological patients (MS).
| Parameter | Subjects | Number | Mean | SD | p-Value |
|---|---|---|---|---|---|
| HS | 7 | 165.08 | 51.4 | 0.499 | |
| MS | 55 | 156.01 | 33.5 | ||
| Harmonic Noise Ratio | HS | 7 | 0.035 | 0.047 | 0.86 |
| MS | 55 | 0.05 | 0.069 | ||
| Jitter | HS | 7 | 0.26 | 0.71 | 0.04 |
| MS | 55 | 0.80 | 1.65 | ||
| Shimmer | HS | 7 | 5.89 | 3.64 | 0.31 |
| MS | 55 | 6.62 | 3.92 |
© 2017 by the authors. Licensee MDPI, Basel, Switzerland. This article is an open access article distributed under the terms and conditions of the Creative Commons Attribution (CC BY) license (http://creativecommons.org/licenses/by/4.0/).
Share and Cite
MDPI and ACS Style
Vizza, P.; Tradigo, G.; Mirarchi, D.; Bossio, R.B.; Veltri, P. On the Use of Voice Signals for Studying Sclerosis Disease. Computers 2017, 6, 30. https://doi.org/10.3390/computers6040030
AMA Style
Vizza P, Tradigo G, Mirarchi D, Bossio RB, Veltri P. On the Use of Voice Signals for Studying Sclerosis Disease. Computers. 2017; 6(4):30. https://doi.org/10.3390/computers6040030
Chicago/Turabian StyleVizza, Patrizia, Giuseppe Tradigo, Domenico Mirarchi, Roberto Bruno Bossio, and Pierangelo Veltri. 2017. "On the Use of Voice Signals for Studying Sclerosis Disease" Computers 6, no. 4: 30. https://doi.org/10.3390/computers6040030
Note that from the first issue of 2016, this journal uses article numbers instead of page numbers. See further details here.