Article

Self-Monitoring of Emotions and Mood Using a Tangible Approach †

by
Federico Sarzotti
Department of Computer Science, University of Torino, 10124 Turin, Italy
This paper is an extended version of paper presented at the HCI International 2015 Parallel Session on Quantified Self and Personal Informatics entitled “Engaging Users in Self-Reporting Their Data: A Tangible Interface for Quantified Self”.
Computers 2018, 7(1), 7; https://doi.org/10.3390/computers7010007
Submission received: 1 November 2017 / Revised: 19 December 2017 / Accepted: 19 December 2017 / Published: 8 January 2018
(This article belongs to the Special Issue Quantified Self and Personal Informatics)

Abstract

:
Nowadays Personal Informatics (PI) devices are used for sensing and saving personal data, everywhere and at any time, helping people improve their lives by highlighting areas of good and bad performances and providing a general awareness of different levels of conduct. However, not all these data are suitable to be automatically collected. This is especially true for emotions and mood. Moreover, users without experience in self-tracking may have a misperception of PI applications’ limits and potentialities. We believe that current PI tools are not designed with enough understanding of such users’ needs, desires, and problems they may encounter in their everyday lives. We designed and prototype the Mood TUI (Tangible User Interface), a PI tool that supports the self-reporting of mood data using a tangible interface. The platform is able to gather six different mood states and it was tested through several participatory design sessions in a secondary/high school. The solution proposed allows gathering mood values in an amusing, simple, and appealing way. Users appreciated the prototypes, suggesting several possible improvements as well as ideas on how to use the prototype in similar or totally different contexts, and giving us hints for future research.

1. Introduction

Quantified self (QS), also known as Personal Informatics (PI), is the concept of tracking, recording, and analyzing any kind of biological, physical, behavioral, or environmental information about ourselves in order to find previously unknown patterns [1,2]. Thanks to smartphones and tracking devices, everyone can collect and monitor traits of “the self” at every time and everywhere: a self-tracker can use a PI system to acquire data on parameters of interest. In the U.S.A., 60% of adults monitor some personal factors like weight, diet, or athletics, while 33% observe other parameters such as sleep patterns, blood pressure, blood sugar, or headaches [3,4]. Moreover, 27% of Internet users track health data online [5], 9% have decided to receive messages that refer to health alerts [6], and the number of health apps continues to increase. In 2012, there were over 13,000 smartphone apps; today there are approximately 18,000. Across all platforms, there are more than 40,000 available; however, less than 1% have been evaluated scientifically [4].
The first PI systems were conceived mainly for clinical purposes, to help patients in tracking dysfunctional behaviors. Thanks to the expansion of the Internet of things (IoT), the miniaturization of sensors, and research in ubiquitous technologies and mobile devices, PI systems have started to be used outside the clinical setting. Nowadays, a large variety of data can be monitored and analyzed: from sleep quality to weight, from heart rate and step count to performance values, habits, and actions [7,8,9,10]. Collecting these data allows users to self-monitor their behaviors in a way inconceivable without such technological means. It has become relatively easy to monitor certain physical states of interest (such as body temperature or heart rate) or to track, for example, kilometers run or the quality or amount of sleep. However, some other factors still remain difficult to track. The increasing popularity of PI systems among “inexperienced users” [11,12], who track for enjoyment and wellness (e.g., by using commercial devices like the FitBit), has led researchers to explore new ways for collecting [13], structuring [14,15], visualizing [16,17], prompting [18,19], and using [20] personal data.
In particular, emotional data require the conscious act of self-reporting. This practice is burdensome and time-consuming, and inexperienced trackers could find it annoying. We think that such users need novel interaction modalities to make the self-reporting of data more engaging, and thus motivate the use of self-tracking instruments over time. Otherwise, after an initial engagement, they will soon abandon the use of their trackers, as recent research has highlighted [12]. In this article we will explore novel possibilities for collecting mood and emotional data by means of a tangible interface. We believe that a “tangible approach” may increase the user’s enjoyment in gathering her own data, lowering the burden of self-monitoring, which requires compliance and a long-standing engagement to be effective.

2. Emotions and Mood

Emotion, generally speaking, is any relatively brief conscious experience characterized by intense mental activity and a high degree of pleasure or displeasure [21,22]. Emotions are one of the core components that characterize human beings, with physiological, affective, behavioral, and cognitive elements. Emotions are intentional, i.e., they imply and involve a relationship with a particular object and they are relatively short lived; moods, instead, are triggered by a particular stimulus or event and they are experienced as more diffuse, general, and long-term. While moods usually influence which emotions are experienced, emotions often cause or contribute to moods [23]. Emotions are often contradictory and it is possible to perceive different emotions, of different intensities and type intensities, simultaneously. Moreover, people usually report about their emotions on the basis of their belief about them [24]. Identifying emotions, then, is a key challenge for healthcare professionals; however, it would be useful to increase the individual’s wellbeing.
Mood and emotions can reveal what makes us feel happy or unhappy or what could have positive or negative effects on us; knowing them and their variations over time can help us to better understand the impact of the environment on us and better understand others and ourselves. Therapists, indeed, ask patients to keep track of their changing emotional states (together with other aspects of their daily lives). The monitoring activity is conducted in order to (1) help people with depression and other mood disorders; (2) better understand why symptoms occur; (3) find correlations among data that suggest a change of their behavior in a particular direction; and, once a consistent amount of data has been gathered (4) check if the treatments are working or not.
However, emotional tracking may have advantages outside the clinical context as well. How can individuals keep track of this information? Emotions have two components: a physical one (e.g., the arousal, i.e., the physiological reaction to stimuli, which involves changes in physical parameters such as blood pressure, heart rate, temperature) and a cognitive one, which classifies the physiological changes in a specific emotion [24].
The data related to emotions may be gathered automatically in a transparent way with respect to the user or it can be self-reported by the user herself. Even if a multitude of new PI tools are trying to infer the emotions from the arousal measured by means of physical parameters, such as heart rate, skin temperatures, eye movements, etc. (see, for instance, [25,26]), they can only track the physical component of the emotions, missing the cognitive one. Moreover, the currently available technologies permit an automatic detection of emotions only by using cumbersome and/or intrusive means for the user, since she has to be equipped with a set of invasive devices (such as sensors or wearable devices, like bracelets, helmets, belts, etc.). This makes the gathering of parameters very awkward, not natural and, above all, not easily applicable to everyday life [12,27].
For these reasons, we think that the tracking of people’s emotions can be done only with the direct participation of the user, using introspective reports. In fact, it is not possible to measure the way in which a person experiences the physiological and behavioral changes that cause the emotion other than through a self-report capturing what the user has subjectively experienced [28]. Several techniques exist for measuring emotions through self-report. The first one is a checklist of adjectives, presented to the participants, asking them to specify which ones describe their emotional states [29]: such lists can comprehend several terms such as calm, nervous, bored. Another approach relies on dimensional theories of emotion and mood, asking people to rate one or more dimensions of their emotional states, such as arousal (activation) and valence (pleasant/unpleasant) [30]. Sometimes the instructions ask an individual to report an immediate feeling, sometimes for feelings experienced in a recent period, sometimes for feelings experienced over long periods [31]. However, questions about emotions and mood often refer to past emotional states, relying on imperfect and biased memory; otherwise, asking a subject to self-report her emotions when they occur inevitably interrupts the experience [23]. In addition, questionnaires and more general self-reporting activities commonly employed in psychology are burdensome and time-consuming, making it difficult to imagine their usage in the everyday life of people that want to keep trace of their emotional states without having therapeutic motivations or impellent needs. Usually, gathering activities are carried out using old tools like pen and paper. however, in recent days, PI technologies can be exploited for supporting the self-reporting process.
Nevertheless, inexperienced users in self-tracking are unfamiliar with PI tools and may have a misperception of their limits and potentialities [12]. We believe that current PI tools are not designed with enough understanding of common users’ needs, desires, and problems they may encounter in their everyday lives. In fact, PI technologies show some practical issues [11]:
  • First, inexperienced users may not be so compliant in tracking their own emotions. This issue is also present in clinical settings, where therapists compel the patient to track her emotions. Users can fail to self-monitor themselves due to lack of motivation, lack of time, or to forgetfulness. Moreover, the user can avoid the tracking activity proposed because she could consider the entire process onerous. Indeed, for every record she has to take out the smartphone, open the app, insert data, close the app, put away the smartphone. Furthermore, much of the output of self-monitoring devices and mobile health applications, including the data that they generate, fail to engage people [32] because they are designed on the basis of existing healthcare systems and do not involve the end users in the design process, as also indicated by the World Health Organization [33].
  • Second, users usually tend to self-report data after the event to be recorded has occurred. In fact, often it is not feasible for the user to interrupt her activity in order to record what she feels. However, when the user is reminded of reporting the data, it is often too late to recollect the exact experienced emotional states. This is the case when beliefs stand above feelings in the self-reporting of emotions [24]. For example, beliefs can influence the emotions felt in a particular event or situation (e.g., birthdays are considered happy events), or generalized beliefs can influence consideration about the self (e.g., derived by trait measures of extraversion or neuroticism) or related social stereotypes (e.g., women are more emotional than men) only when the actual experience is relatively inaccessible (later in the time). In fact, memory is reconstructive [34]: with the passage of time, a shift from relatively veridical memories to relatively schematic or stereotypical ones can be observed.
Our main goal is to find a solution for tracking emotions, which addresses these two issues. A possible way for reducing them is, respectively, to:
  • Make self-monitoring more fun and enjoyable. Over the last 10 years, novel design solutions have been explored to allow a serendipitous navigation through data [35,36] or content [37,38,39], and gamification techniques [40,41,42,43,44] have been employed to enhance users’ motivation [45] or change individuals’ behavior [46,47], foreseeing the use of game design elements in personal informatics context [48]. Building on these attempts for making content and data exploration and management more enjoyable, we here propose the use of tangible interaction to involve people in self-reporting their emotional states. Tangible User Interfaces (TUIs) leverage physical representations for connecting the digital and physical worlds [49]; interaction with TUIs relies on users’ existing skills of interaction with the real world [50], offering interfaces that are learned quickly and easier to use. Using personal objects as tangible interfaces could be even more straightforward, since users already have a mental model associated to the physical objects, thus facilitating the comprehension and usage modalities of those objects [51]. TUIs can remind people to insert data, motivating users to perform tasks usually perceived as repetitive and burdensome. In fact, TUIs involve the user more than Graphical User Interfaces (GUIs) when a task is not appealing enough on its own [52], providing a more engaging experience that can increase the repetition of the activities carried out by the user [53]. Moreover, using TUIs for self-reporting can make users more physically engaged, providing richer feedback during the interaction [53]. The act of self-reporting becomes a physical activity where users, playing with the object, automatically provide information on their emotional state. Earlier studies demonstrate that data produced by research participants have a more consistent quality if the subjects feel that they have mastered the use of the data tracking equipment [54]. In other words, the better the subjects control the equipment, the less cumbersome it is for them.
  • Supporting users in the retrospective reconstruction of emotions. Since people’s reports of their emotions reflect whatever information is accessible at the time [24], we aim to provide people with some hints in order to recall the experience where the emotions arose. This would allow the user to connect her emotional states to the places visited, the people met, and the task accomplished, and, through them, remember what happened to her during the day and report her emotions more faithfully, in a way as similar as possible to how it actually happened (trying to avoid the influence of beliefs).
  • Supporting users to track their emotions with a low cognitive load. Since a complex self-tracking process may lead users to avoid the recording of their emotional states, we aim to provide the user with a TUI in order to help her to self-report them in a simple and less onerous way. This would allow her to immediately report her emotions, avoiding the possibility that subsequent beliefs could produce bias in the reporting process.
In the following sections, we present a prototype for tracking mood. To this aim, a PI solution based on a tangible interface is proposed, helping users in tracking their mood with a low cognitive load in the tracking process. The article is structured as follows. In Section 3 we present a review on the related work dealing with tools for emotion and mood tracking. In Section 4 we briefly present a conceptual proposal, and we introduce the implemented prototype in Section 4.2. In Section 5 we describe the evaluation of the prototype and in Section 6 results are presented. Finally, Section 7 provides a conclusion as well as a description of the work in progress.

3. Related Work

3.1. Emotional Tracking

Today, mood and emotion tracking is a widely studied topic.
As stated in Section 2, two principal tracking mechanisms for qualitative phenomena like mood and emotion exist: the self-tracker specifies qualitative descriptors such as words to monitor activities or inputs numbers, whereby qualitative phenomena have been modulated onto quantitative scales (e.g., my mood today is 7 on a 10-point scale). Several applications, research works, and technological tools addressed to this aim, either self-reported or automatic, have been developed so far [1].
Regarding self-reporting, many systems collect users’ emotions to help users increase their awareness of the factors that have an impact on their mood states and their mental health and, in most cases, this activity is done for therapeutic and rehabilitation purposes.
Track Your Happiness [55] notifies the user about variations in her happiness over time and what possible elements have had an influence on it, asking them, via email or SMSs, what they are doing and how they feel at that time. Happy Factor [56] evaluates happiness on a 10-point scale, associating the activities carried out at that particular time. MoodPanda [57] rates happiness on a 10-point scale, adding factors that influence the mood, and it has also a social component where users can share their mood with friends in order to be supported by and support each other. Mobile Mood Diary [58] is a mobile and online symptom-tracking tool for recognizing the factors that influence mood, addressed especially to adolescents with mental problems. Mood 24/7 [59] is an online and mobile mood tracker developed by HealthCentral. It sends users a daily SMS message asking them to rate how they feel on a scale from 1 to 5. It tracks and graphs those results over time, providing mood data that can be shared with friends, family, and physicians.
Other services, such as Moodscope [60] and MoodTracker [61], take into consideration other emotions and dimensions to manage depression, bipolar disorder, or anxiety.
Less oriented to the therapeutic scope is Gotta Feeling [62]: users’ emotions are tracked and shared on their private social networks. Users have to choose emotions felt, selecting from certain categories, and bind them to a list of words expressing a feeling: the reports show all the recorded feelings, places, and people to which they were linked.
Mappiness [63] is a research project at the London School of Economics that, a few times a day, ask the user to report how she is feeling, where she is, and what she is doing. The data is then anonymously aggregated and analyzed for understanding the effect of environment (including noise) on people’s mood. Users can view their own happiness history directly in the app.
There are also a lot of commercial applications and devices with the goal of promoting the user’s self-knowledge through a visual exploration of the gathered data. In fact, beside the data collection, they are able to suggest patterns, trends, and correlations between emotions changes and habits or occurred events. For example, StressEraser [64] is a portable biofeedback device with the aim of reducing the user’s stress by synchronizing her heartbeat with her respiratory rate. The device shows heart rate variability on a graphical display, suggesting how to control breath using visual cues. We can also cite T2 Mood Tracker [65], an app designed to help users in tracking emotional experiences over time and sharing these data with a healthcare provider; MedHelp Mood Tracker [66] also tracks general mood as well as symptoms and treatments related to specific mood disorders. Finally, Feelytics [67] and Moodjam [68] are apps in which users can publish in a community their emotional state using expressive emoticons (Feelytics) or colors (Moodjam).
Most of these apps force the user to suspend her current task to interact with the smartphone. This makes tracking burdensome and annoying and, in the long term, users may decide to abandon the activity tracking. Some other services, instead, use ad hoc devices to track automatically personal parameters (arousal, heart rate, etc…) in order to return the overall mood of the user. PSYCHE [69], for example, uses textile and portable sensing devices for data acquisition in patients affected by mood disorders, while Fractal [70] uses sensors to detect the wearer’s muscle tension, movements, excitement levels, and proximity of other people. Textile Mirror [71], instead, is a wall panel made of felt that changes its textural structure according to emotional signals coming from its viewer. BodyMonitor [72] deduces users’ emotional states using a wearable armband, monitoring heart rate and skin conductance. Rationalizer [73] is a system used by investors that helps them avoid making decisions based on emotion by using biofeedback; a bracelet tracks the arousal component of the user’s emotion and a ’bowl’ is used to display a dynamic pattern of lights related to the emotion level measured by the bracelet. Users can see when they are taking actions based on strong emotions and can use this as a hint to reconsider.
An alternative way to detect the user’s emotions is to interpret facial changes, using also eye-tracking technologies. They are becoming widely used because of their relatively low cost (i.e., a user can install a specific app on her smartphone) and they are not as intrusive as most neurological measurements. For example, Affectiva [25] uses computer vision and deep learning methodologies to develop a face and emotion detection algorithm, while Emotient [26] (acquired by Apple in January 2016) uses pattern recognition techniques in order to measure and detect facial expressions and correlate them to emotions. Emotish [74] allows the user to snap a selfie and investigate what she is feeling in that moment. Other examples which use similar techniques can be found in References [75,76,77]. Other apps exist that use emotions to provide suggestions or correlations. For example, the app developed by scientists at Oxford University (such as psychologist Professor Charles Spence, who has studied the importance of taste perception) in collaboration with JustEat, a food delivery firm, uses face recognition technology to discern what mood the user is in and recommend her a specific meal or snack—for example avocados or dark chocolate if she feels angry and potatoes or chicken if she is happy [78]. Another example is Emotion Sense [79], which correlates users’ emotions with other factors such as time of day, location, physical activities, phone calls, and SMS patterns.
Even if we consider such advancements in technology, emotions remain difficult automatically monitor due to their dual nature: the physical component and the cognitive one.

3.2. Tangible Interfaces and Intuitive Visualiztions

Tangible User Interfaces (TUIs) and Tangible Interaction are topics increasingly gaining interest within Human Computer Interaction (HCI). Hornecker [80] introduced a framework that focuses on the interweaving of the physical and the social, contributing to understanding the user experience of tangible interaction. The framework is structured around four themes: the Tangible Manipulation theme, which refers to the reliance on material representations typical for tangible interaction; the Spatial Interaction theme, which emphasizes that tangible interaction is embedded in space; the Embodied Facilitation, which focuses on how configurations of objects and space affect social interaction; and the Expressive Representation theme, which highlights the legibility and significance of material and digital representations.
More specifically, over the years, researchers have developed a variety of tangible devices relating to logging action and mood monitoring, which could be inspiring for the present work. Papier-Mâché (Klemmer [81] and Klemmer et al. [82]), for instance, is a toolkit for building tangible interfaces using computer vision, electronic tags, and barcodes, introducing high-level abstractions to work with these input technologies facilitating technology portability. CookieFlavors [83] is a TUI tool that provides a set of physical input primitives realized by coin-size Bluetooth wireless sensors which can be attached to any physical objects augmenting them.
Jacquemin [84], instead, designed a head-shaped input device to produce expressive facial animations: through contact with the interface, users can generate basic expressions. On the same line, Cohen et al. [85] developed a board as an interface that enables a group of people to log video footage together. Terrenghi et al. [86] used the shape of a cube to implement a general learning platform supporting test based quizzes, in which questions and answers might be text or images. Navigational Blocks [87] provide a physical embodiment of digital information through tactile manipulation and haptic feedback, proposing a tangible user interface that supports the retrieval of historical stories and navigation in a virtual gallery. In the same vein, Van Laerhoven [88] presented a low-cost approach to achieve basic inputs by using a tactile cube-shaped object, augmented with sensors, processor, batteries, and wireless communication; this in turn yielded a series of prototype applications, such as on-screen navigation and an audio mixer profile controller. On the other hand, Huron et al. [89], recognizing the need of providing means for non-experts to create visualizations that allow them to engage directly with datasets, presented a constructive visualization paradigm enabling the creation of flexible, dynamic visualizations. Such visualizations can be manipulated through a playful approach as well as rebuilt and adjusted. Other examples that combine playful visualization with tactile interaction, also falling outside the academic field, can be found in References [90,91,92,93,94,95,96].

4. Our Conceptual Framework

To address the three main barriers identified in Section 3, we present a conceptual PI framework able to support users in the self-reporting of emotions and mood. The proposal has the following features:
  • It allows the self-reporting of emotions or mood in an amusing (i.e., which fosters the use of the device), simple (i.e., which does not require previous knowledge), and appealing (i.e., which might engage users) way by means of a tangible interface;
  • It allows one to automatically collect contextual aspects related to the emotions, including location, time and people in the surrounding environment when the emotion occurs, that will help users in recalling their emotion;
  • It provides this contextual information to users to help them in remembering their emotions;
  • It will be able to provide users with a complex aggregated picture of the emotions of a period of time or of an experience, and correlations among data.
The idea is to create a portable, entertaining and, above all, not burdensome platform that would be composed of several parts: a mobile application on the user smartphone to automatically gather contextual data and visualize collected data and one TUI, i.e., a physical object that the user can manipulate in order to communicate with the system.
Figure 1 shows the system architecture.
The TUI is built on Arduino, an open source platform for building digital devices, prototypes, and interactive objects that can sense and control the physical world [97]. It is composed of:
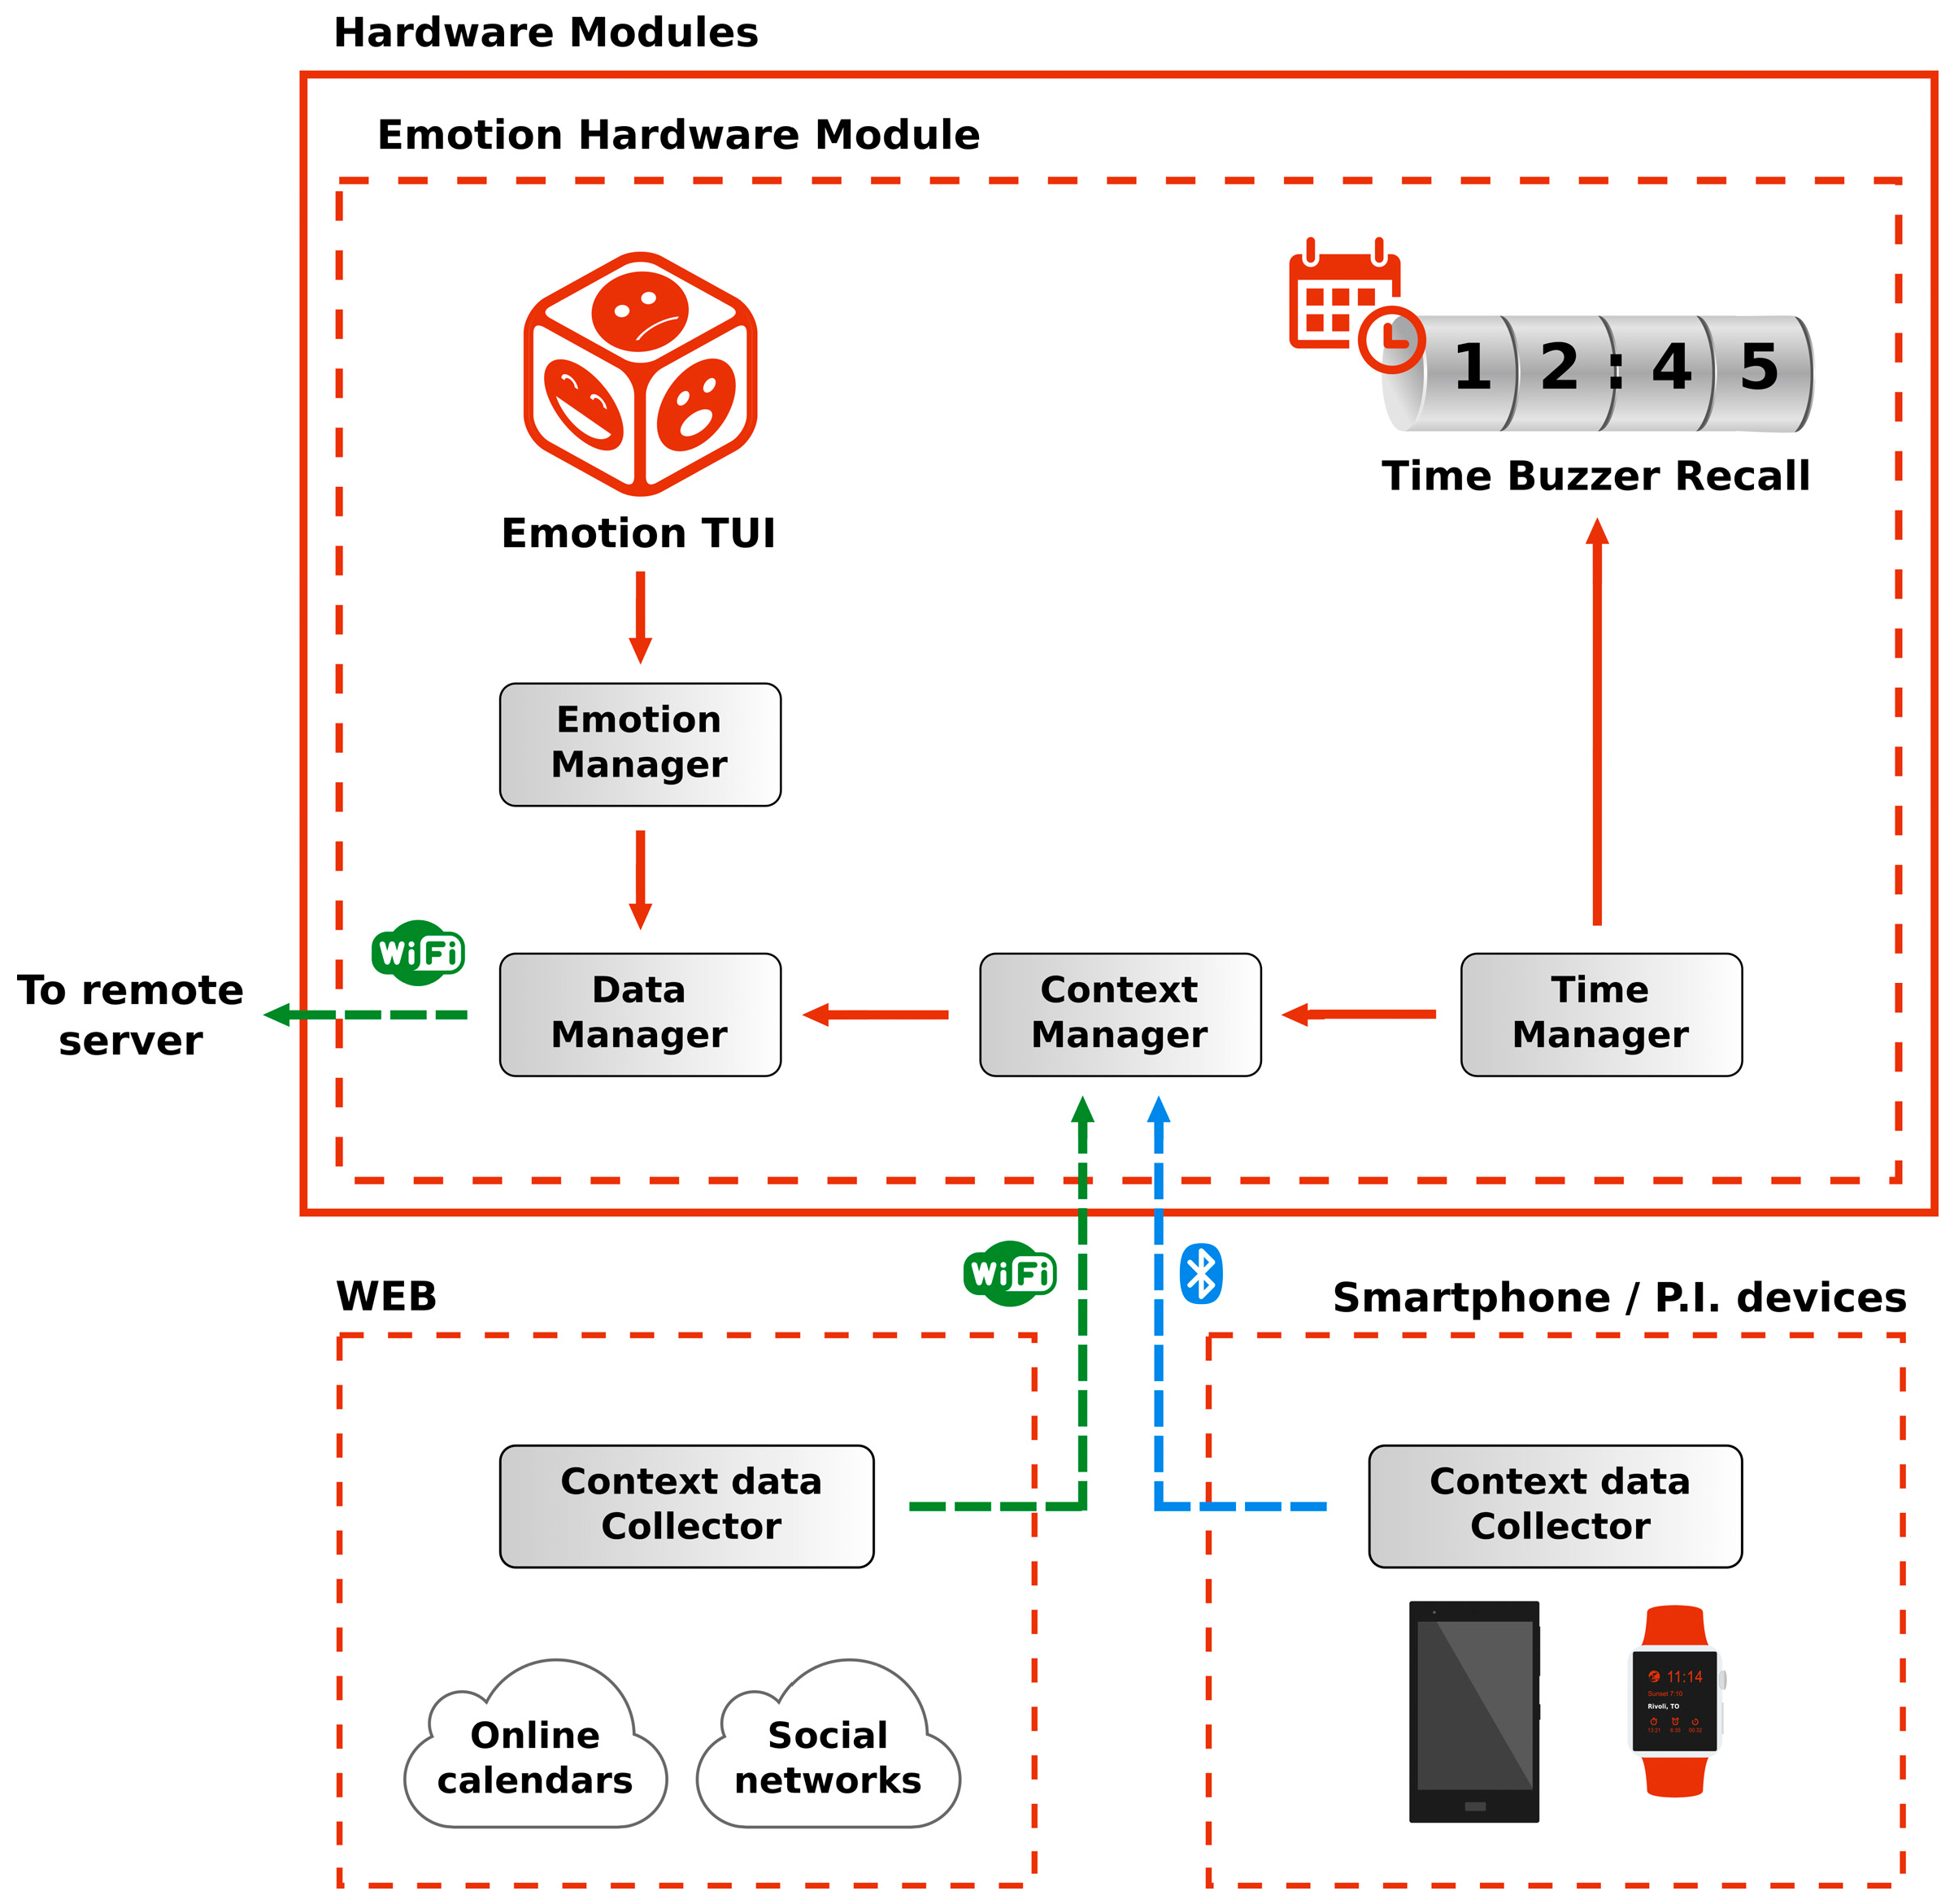
  • Emotion TUI, used to provide user emotions;
  • Time Buzzer Recall, a buzzer inside the TUI that reminds the user of reporting her emotions.
The first component is used to gather a user’s emotion data and it is the core of the system. The second, instead, helps the user be reminded of reporting her data by providing a jingle.
User can report her data whenever she wishes and several times a day, simply by moving the Emotion TUI. Otherwise, the user can set some specific daily times and the buzzer will remind the user of reporting her data via a jingle.
When the user wants to report her data, she can select her emotion on the Emotion TUI. The context manager notes the time information from the time manager and will automatically recollect the context (place and people) in which that emotional state is happening, inferring it by e.g., the GPS sensor of user’s smartphone, the user’s social networks (Facebook, Twitter, WhatsApp, Google+), shared calendars (Google calendar, Facebook), etc. Consequently, the emotion manager will send the information to the data manager, that will merge this data with the corresponding context and send the information gathered to a remote server for elaboration.
The user could browse her emotional history by consulting a mobile website, having a representation of her emotional states through different points of view, and inspecting correlations among data.
The Emotion TUI communicates via Bluetooth with the smartphone and via WiFi/Ethernet with the remote server and the data sources exploited to infer the context (social networks, online calendars, personal information tools, etc.).

4.1. Instantiation of the Proposal

Given the technical and conceptual difficulty of implementing a tangible interface for emotion collection (due to e.g., the many dimensions that characterize emotional states), we decided to start approaching the problem by designing a device for mood gathering [98,99]: we called it Mood TUI.

4.2. Scenario

In order to better understand the motivation of the work, we provide a usage scenario for our TUI.
Michael is a 35-year-old programmer. During the day, he spends a lot of time on the computer: both for his work and to play and keep in touch with his friends when he returns home. He considers himself anxious and he would like to live a more relaxing life. Using a PI tool, he decides to monitor some aspects of his everyday life that could be an obstacle to truly relaxing. The TUI positioned on his desk (both at home and at workplace) reminds him (with a jingle or only with its presence) to periodically track his mood. Thus, Michael, rotating the object, can report his data in every moment of the day.
Michael can view on his smart phone all the information and correlations gathered about his moods and habits. Selecting a period of time, he can investigate and explore his “self”, looking for any correlation among aggregated data about mood and other contextual and behavioral data (e.g., physical parameters collected with other PI devices, such where he has been, what he has done, who he has met, etc.). This permits him to find an unexpected correlation among his habits and his mood: every time he does not come back home by walking, he feels anxious. Thus, he considers to change his habits in order to be more relaxed during the day.

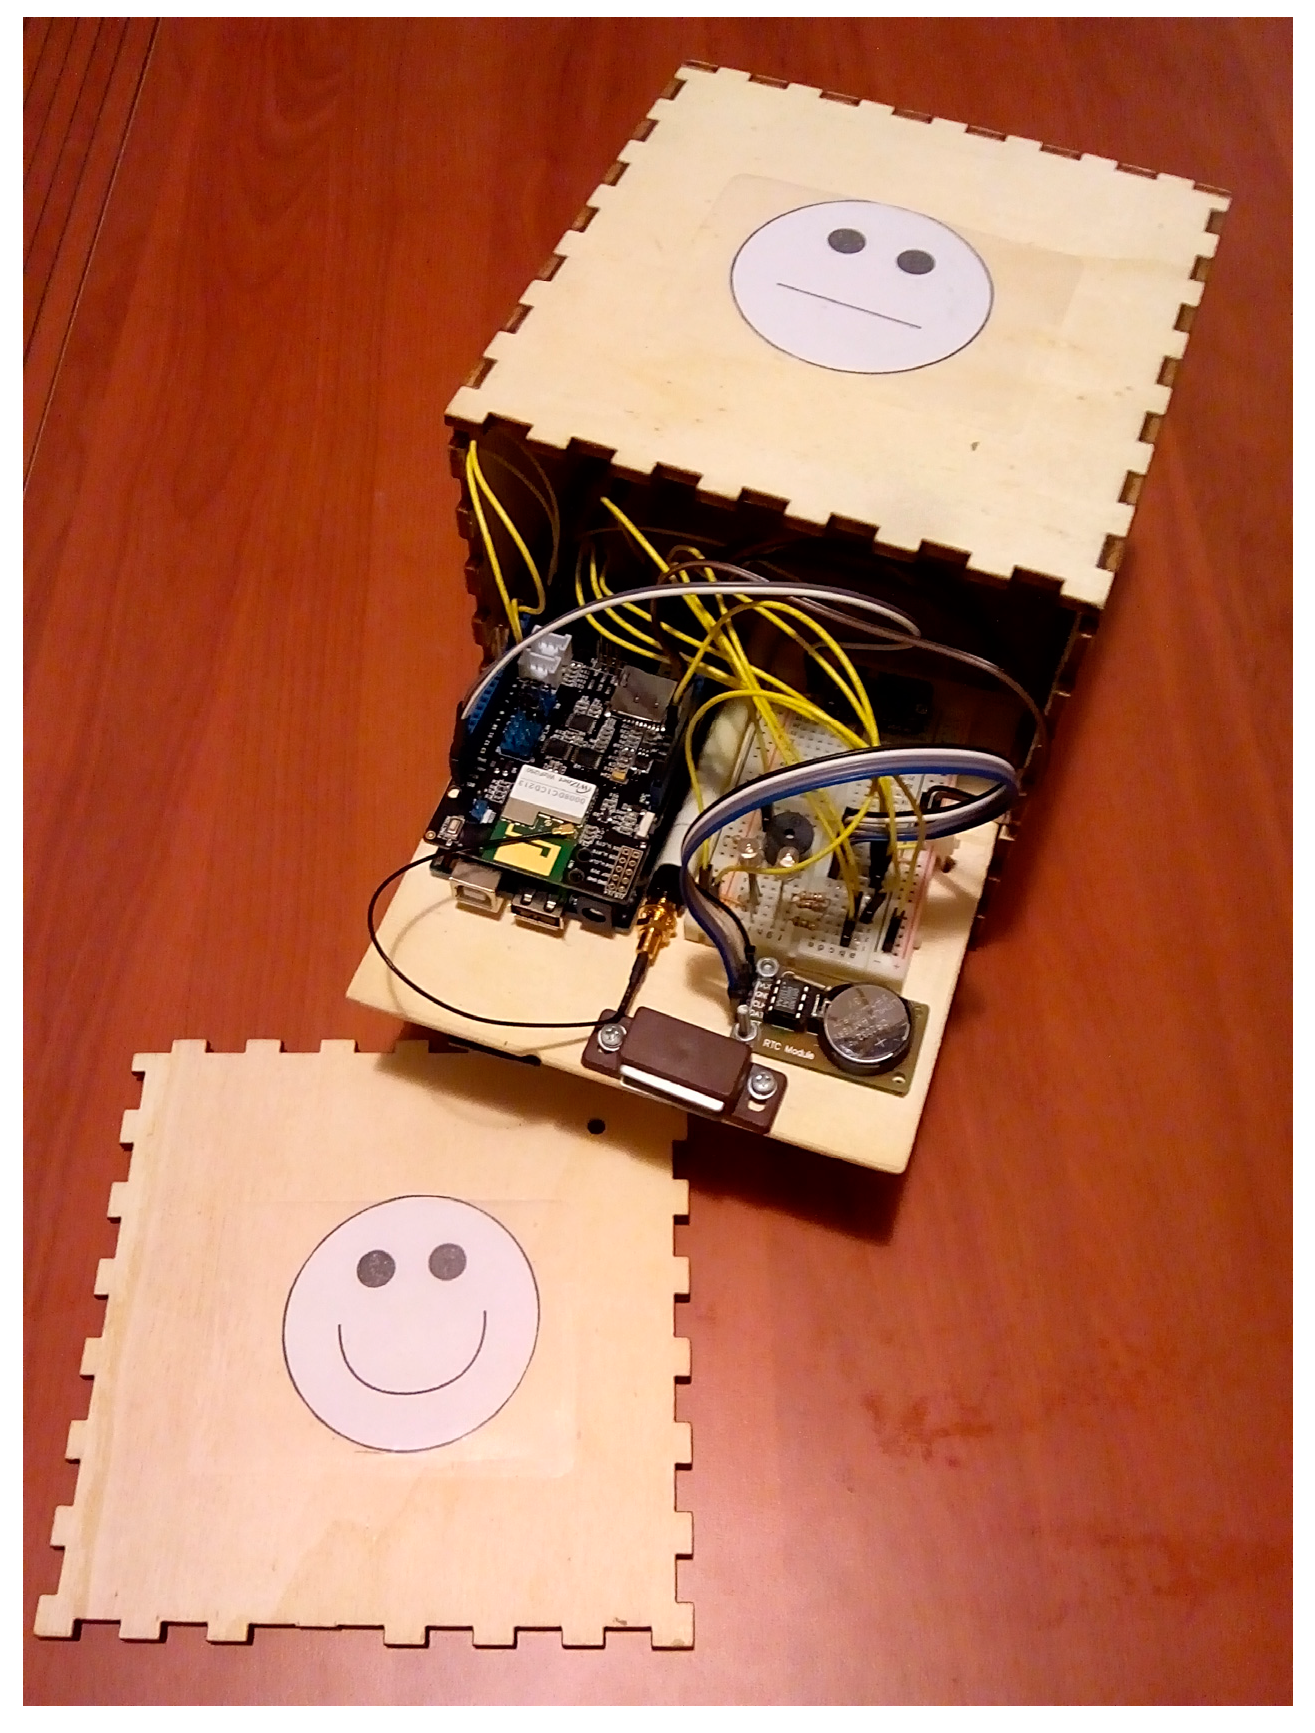
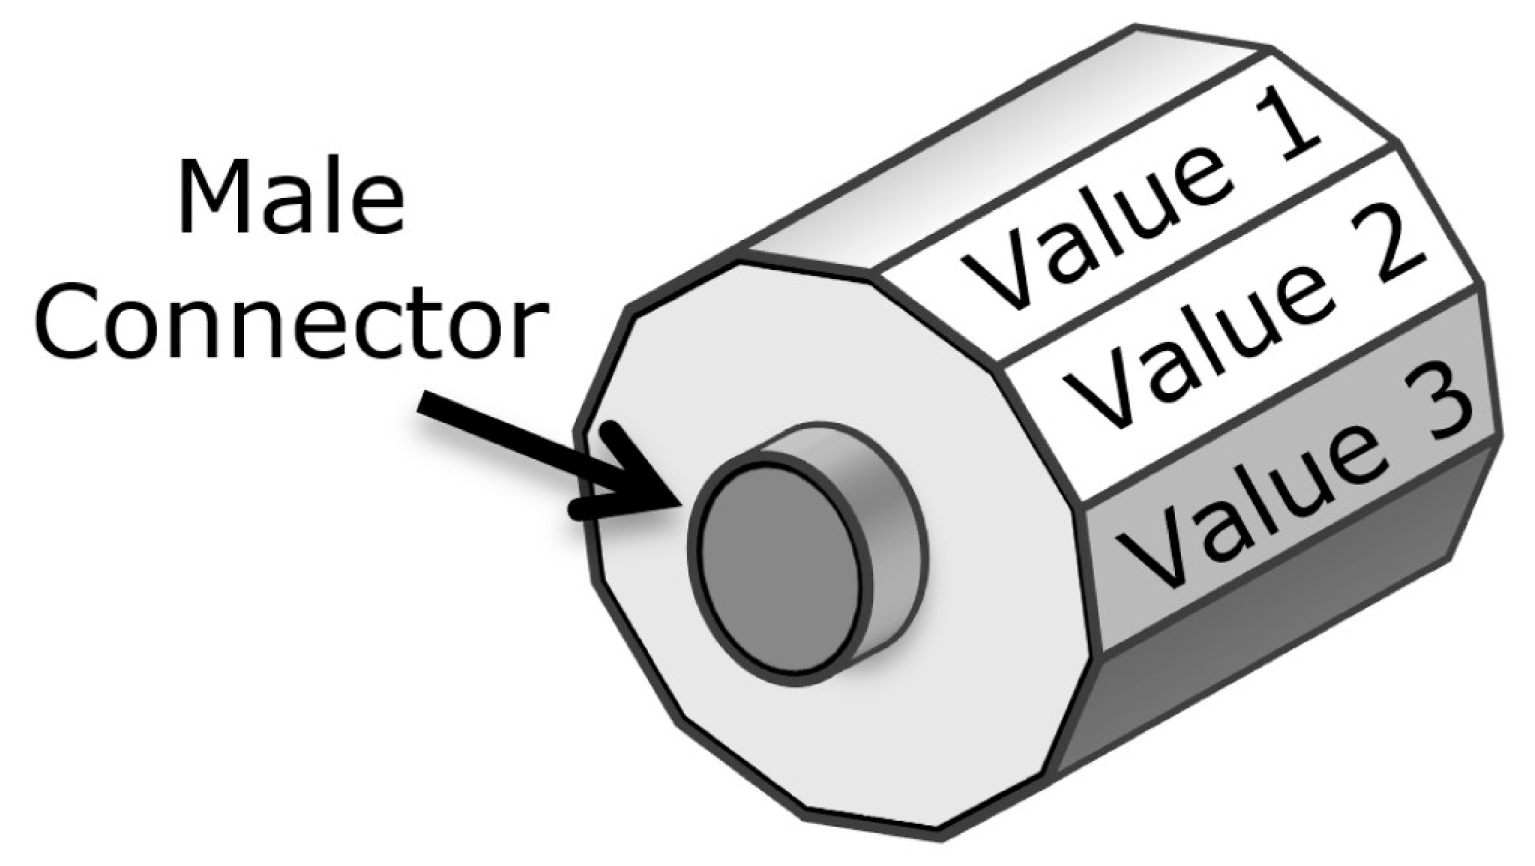
4.3. TUI Implementation

We created a simple standalone platform based on a client-server architecture (see Figure 2) to test the prototype.
The client is the Mood TUI (presented as Emotion TUI at the beginning of Section 4), i.e., a physical smart object that the user can manipulate in order to communicate her mood, while the server has the aim of storing the received information in a database, to enable other platforms to integrate and analyze them. The client and the server communicate each other with a Wi-Fi connection.
Moods are typically described as having either a positive or negative valence and can be represented using a numeric or symbolic scale. We implemented the Mood TUI by means of a wooden cube with each face representing a specific mood state (see Figure 3). The cube shape was chosen due to its stability (it can be leaned on a table without drifting away, as could happen in the case of as a sphere) and because of the possibility of having six different “states” that could be put in the spotlight from time to time (the up face of the cube points to the current mood). Each face of the cube displays a different “mood state” by depicting a different “emoticon”. The affordances of the cube can be easily understood by every individual. It can be picked up, rotated, and played with, and then put down again. This is true for users of all ages. By relying on their previous knowledge about dice games, users might expect to find different textual and pictorial information on each side of the cube [86], making the interaction with a cube easy and intuitive [87].
We decided to monitor six different mood levels: one for each face of the cube. The mood level is represented as an emoticon picture placed on the relative face of the cube.
Users can communicate their mood by rotating the cube and positioning it on the table/desk so that the specific mood state chosen is the top face. The TUI is built on an Arduino board [97]. When the TUI recognizes the selected face (Mood Manager), the value of the mood state and the time (Time Manager) are saved into a storage device by the Data Manager, potentially with other data gathered from some sensors such as ambient temperature or atmospheric pressure. Later, the Communication Manager reads this information and sends them wirelessly to a remote server. On the server side, the Communication Manager receives these data and the Data Manager saves them into a storage device. Then some checks are performed and, if the data are consistent and considered valid, they are stored in a database. Then the user, through her PC/device, can be notified or she can investigate specific conditions, patterns, and correlations (e.g., every time she receives a call from a particular person, she becomes happy), consulting a mobile website created using D3.js [100]. The information is displayed using some graphs that represent mood data on a time basis (some histograms) and a map that represents locations and places where the user felt those moods (using Mapbox [101]). However, a description of the data visualization modalities goes beyond the scope of this paper, which is focused on the reporting of data.
In the following, we provide a technical description of our solution, both for the client and the server sides.

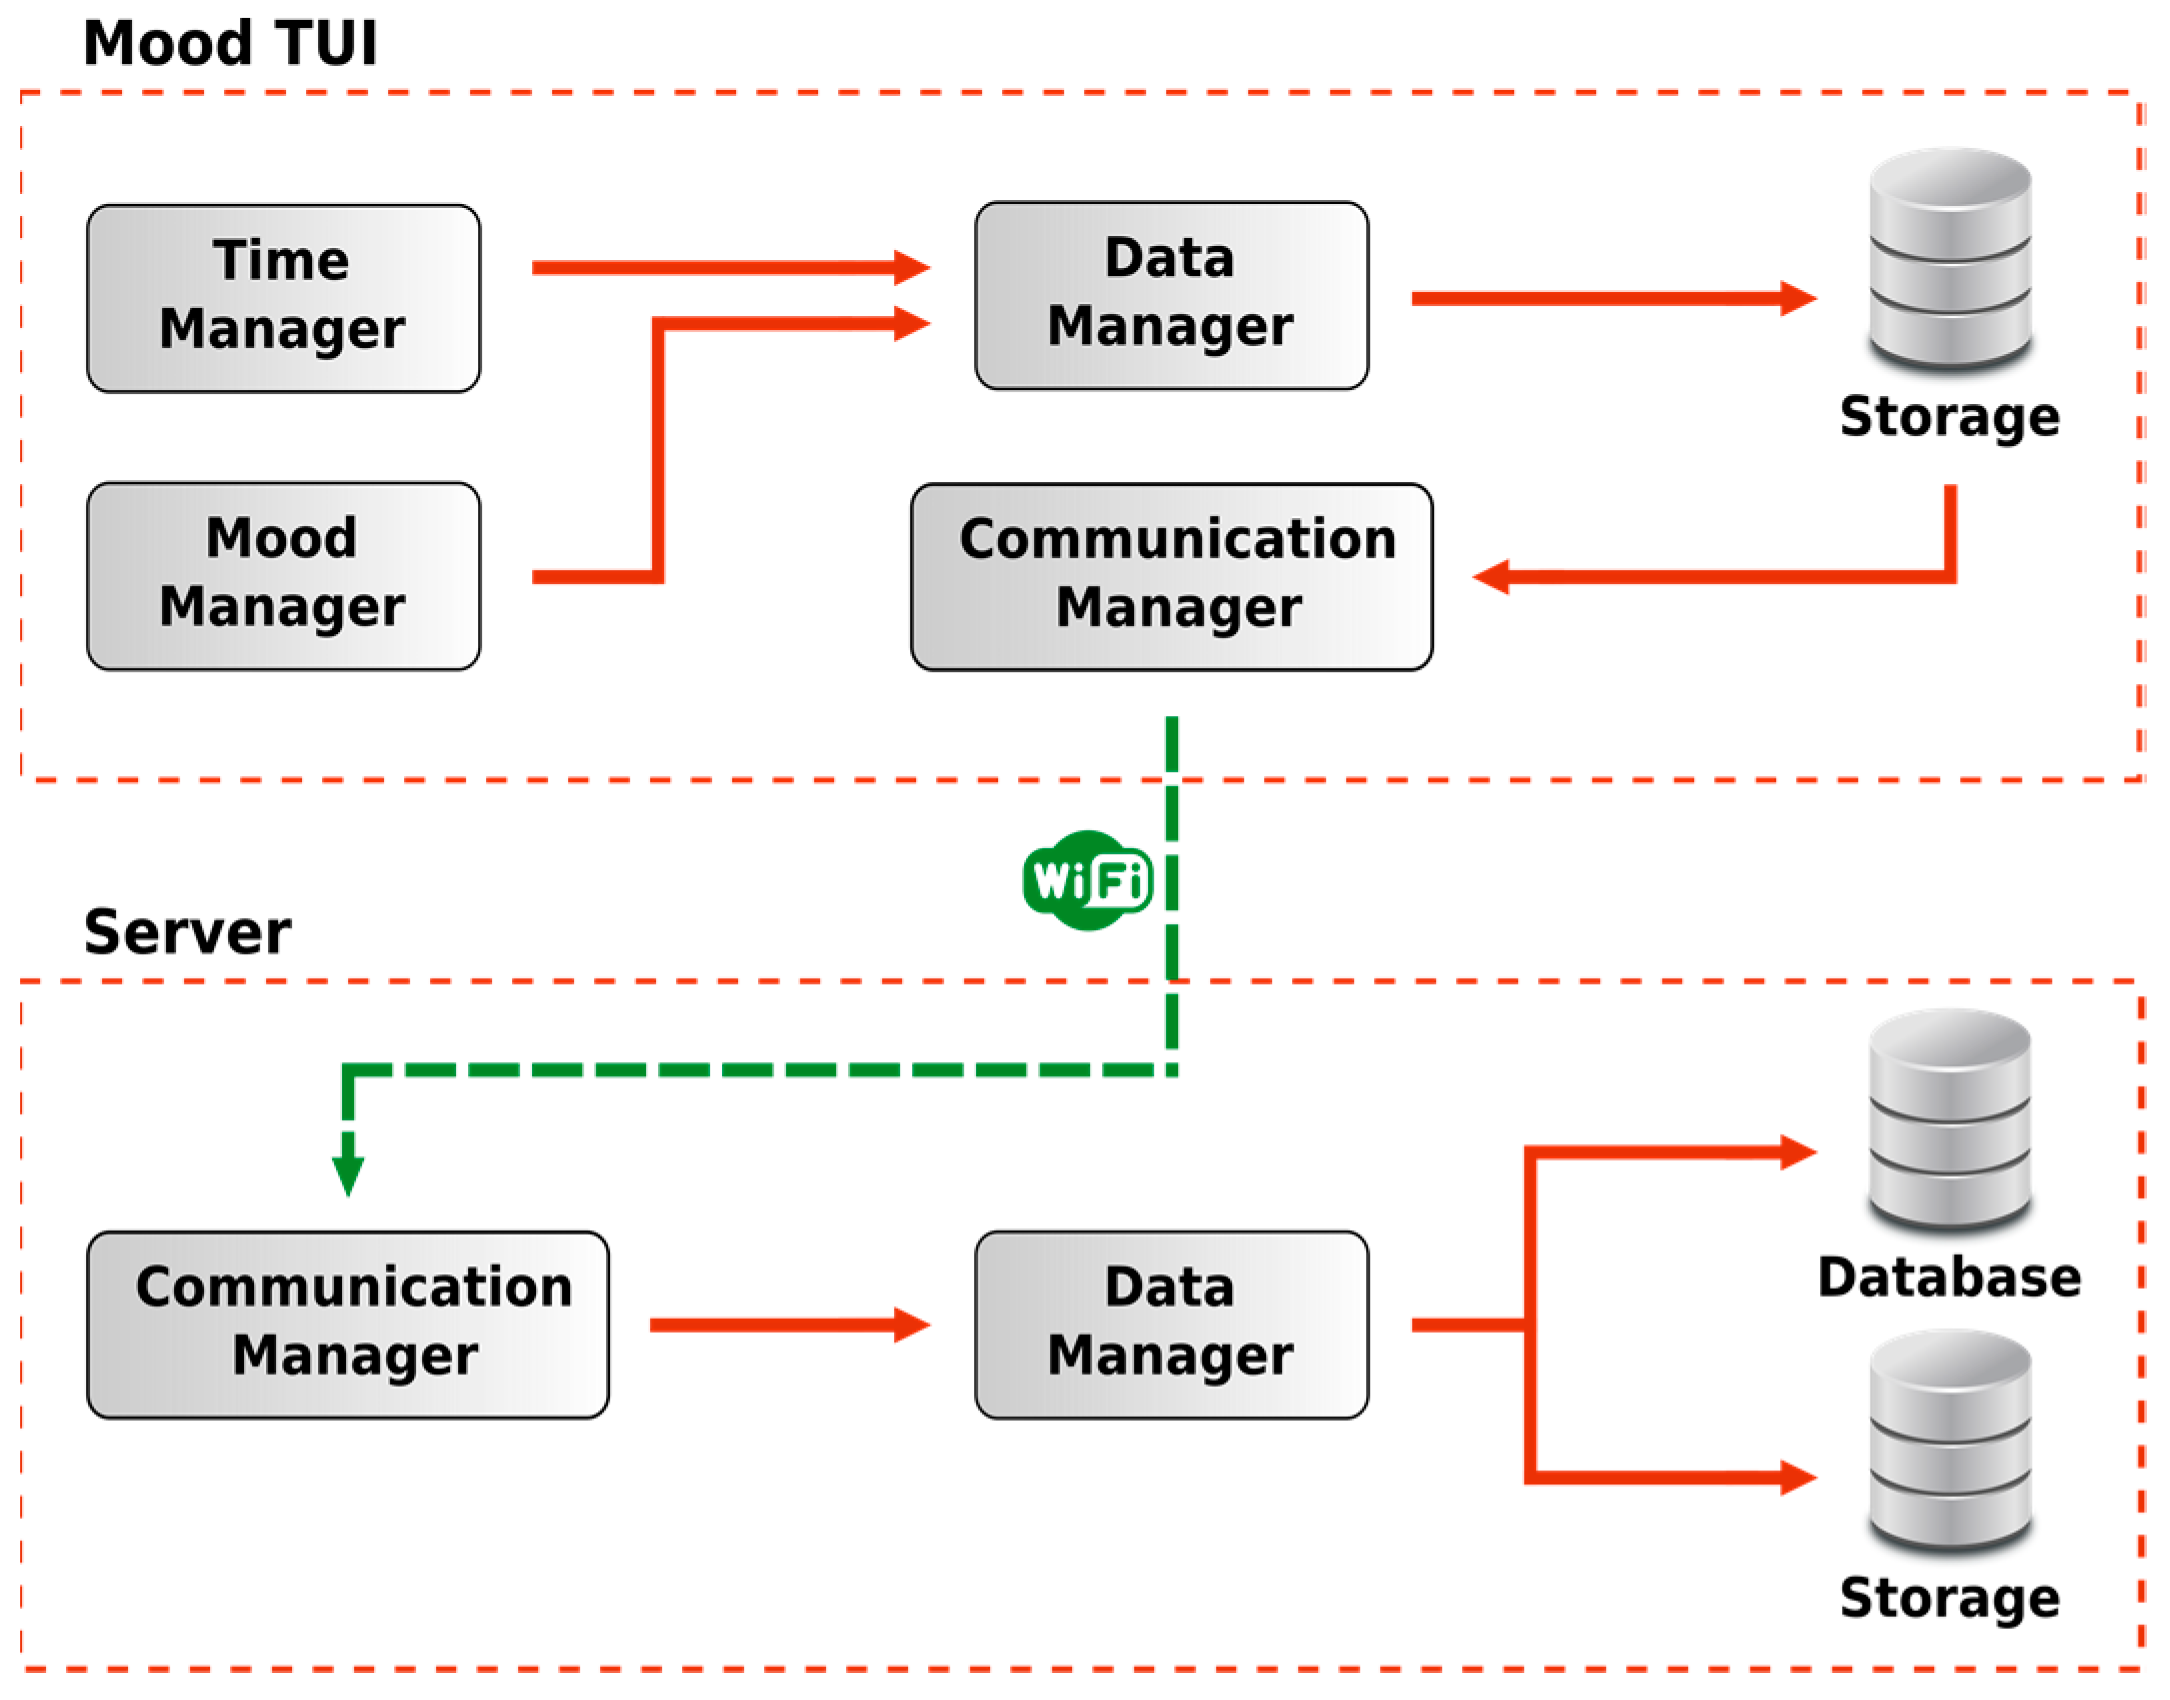
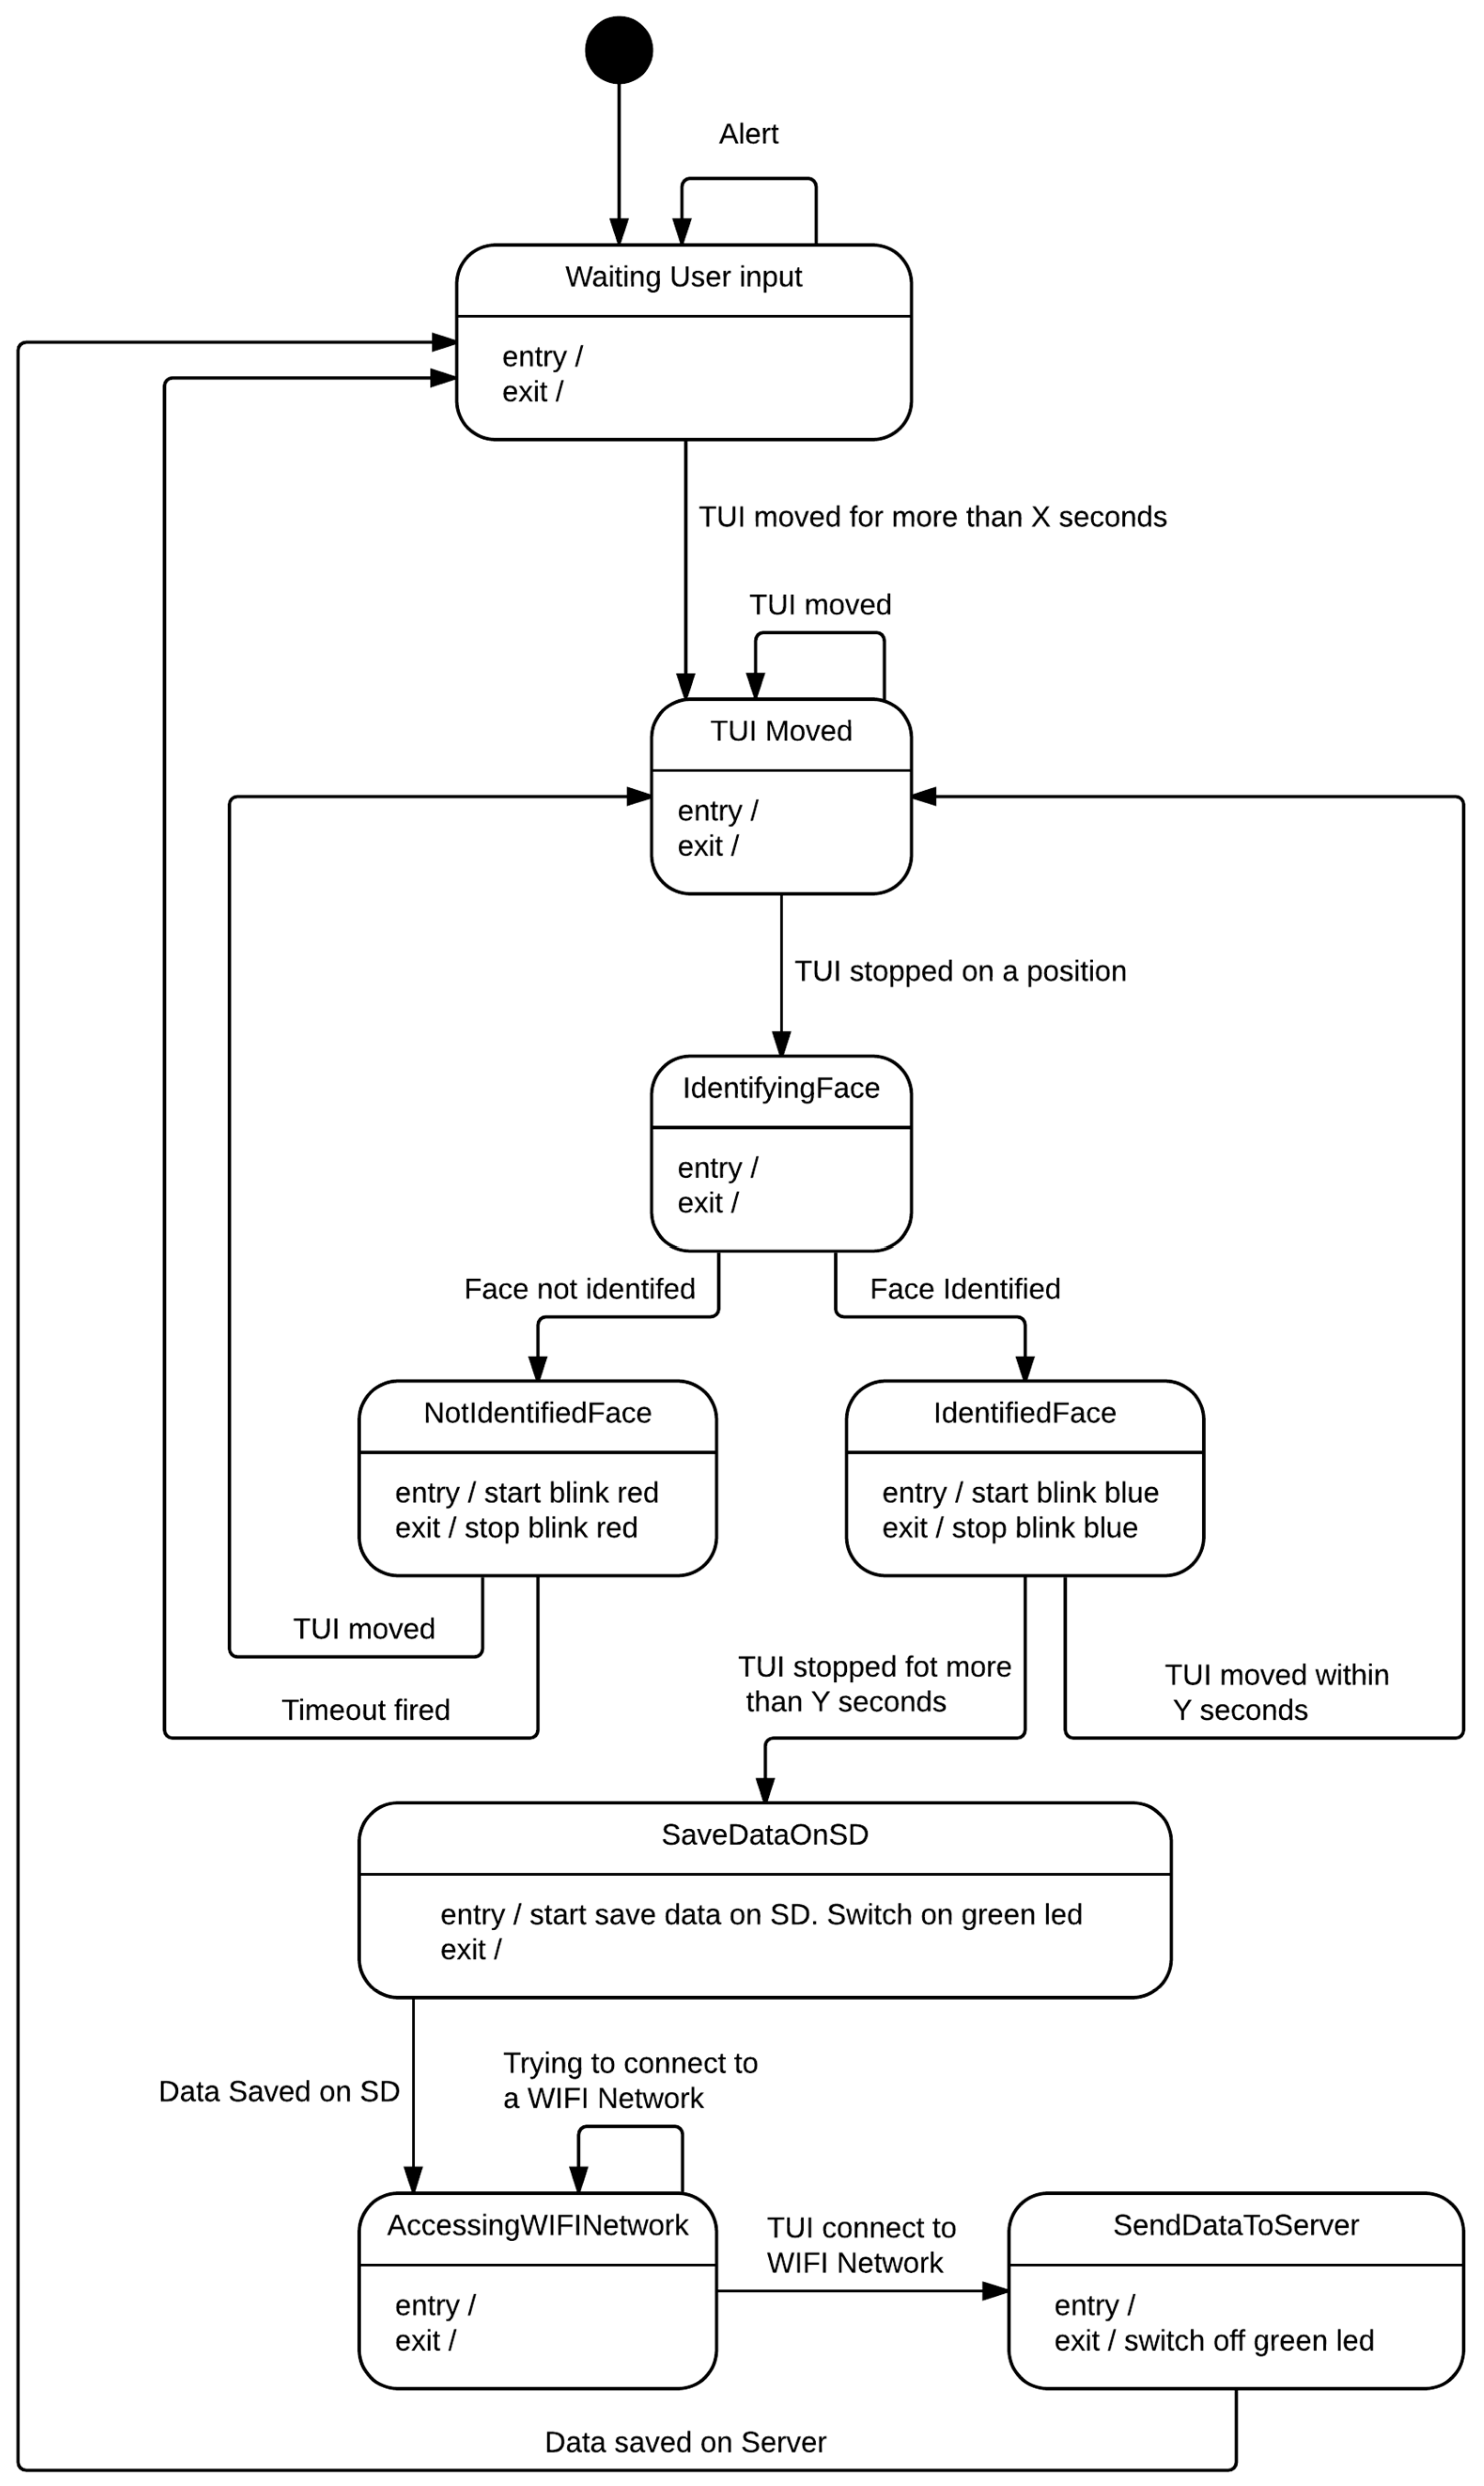
4.3.1. Implementation: Client Side (Mood TUI)

To support users in self-collecting their mood states, we have to recognize the TUI face, matching it with an event or a specific time, gather some data from several sensors, send this information to a remote server, and save it in a database.
Hardware architecture. We created a first prototype using an Arduino Uno board. Some sensors/components have been added to the platform:
  • An inertial measurement unit (IMU) is used to recognize which face of the TUI the user selects. We used an IMU with 10 degrees of freedom (SEN0140 by dfRobot). It integrates an accelerometer (ADXL345), a magnetometer (HMC5883L), a gyro (ITG-3205), and a barometric pressure and temperature sensor (BMP085). To communicate with this sensor, we used a dedicated free library, FreeIMU [102];
  • A Real Time Clock (RTC) is necessary to obtain the current date/time and allow for associating the mood state to a particular event or time. It holds a battery to preserve the time information;
  • A secure digital (SD) card reader;
  • An SD card that contains initialization parameters used by the platform, such as Wi-Fi network name and passphrase and server IP and port and where data are stored before sending them to the remote server;
  • A Wi-Fi shield enables the wireless connection to the remote server. We used the WizFi250 shield by Seeedstudio;
  • A buzzer, used to inform the user that the platform is waiting for her input;
  • Some red, green and blue (RGB) light emitting diodes (LEDs) show the state of the platform to the user;
  • A global positioning system (GPS) sensor to collect information about the user location.
The Wi-Fi shield is plugged directly into the Arduino Uno board while the remaining parts are mounted on a breadboard and then connected to the board, as shown in Figure 3. After assembling the system, we ran into a memory space problem: these components and the source code ran out the firmware space in the Arduino Uno board. To accomplish the original idea, we needed to move to the Arduino Mega board that provides more memory space for the firmware, although it also takes up more space. Moreover, we removed the GPS sensor from the architecture for two reasons. First, a GPS sensor decreases the autonomy of the system. In order to provide accurate information on the position, it should be constantly in connection with the GPS network that implies a significant consumption of the battery. Second, Mood TUI will be used in closed locations (see, for example, Section 4.2) where a GPS signal is too difficult to intercept (at the same time, if precise information about the user’s location is desired, we can gather the position using the built-in GPS sensor of the user’s smartphone).
Finally, we designed the physical object that will contain the platform described. We had to satisfy some constraints: (i) the internal dimension should be at least 15 × 10 cm in order to contain the Arduino Mega platform and all the other components; (ii) a metal case is not appropriate due to the wireless activity (metal can shield the wireless signal); and (iii) we had to detect six different states, one for each mood level. The simplest object that satisfies the constraints is a wooden cube, as shown in Figure 3.
Software modules. We envisaged a scenario where the user tracks her mood at home or in the workplace with our TUI (Section 4.2). In such a context, we can assume that the TUI is always switched on and placed in an area covered by a Wi-Fi network. The user can always interact with the TUI, in every moment of the day: it chooses a face of the cube that represents her mood (the one facing upward), then some parameters are automatically gathered and all the data are stored into the SD card. Then, these data are read and sent to a remote server. Every interaction is temporarily stored on the SD card, and marked with a timestamp.
The overall behavior of the client is modeled by the finite state machine shown in Figure 4.
In the following, we describe the client side software modules.
Time Manager. Users can also fail to self-monitor themselves due to forgetfulness (Section 2): we wanted to offer them the opportunity to remember themselves by monitoring their mood. The user can choose several times in a day when she would like to gather a mood state. These times are stored in the file Request.txt. When a time is reached (we compare the times stored with the time information provided by the Real Time Clock), the platform alerts the user that it is waiting for its input by activating a buzzer. It plays a jingle for one minute, if in the meantime the user interacts with the TUI, the song stops; otherwise, after one minute, the buzzer stops anyway so as not to burden the user.
Mood Manager. The system identifies as “user interaction” any handling of the TUI (detected by the IMU) that lasts for at least X seconds. Once detected, the procedure that recognizes the face of the cube chosen by the user will start. If the system is not able to correctly recognize the face (i.e., the TUI is not properly placed on a face), a red LED is turned on intermittently, and if it keeps failing to identify a face within a specified timeout, it aborts the “user interaction” operation and reverts to waiting for a new user input. Otherwise, once the face has been identified, a blue LED is turned on intermittently for Y seconds as feedback for the user indicating that the system has recognized the TUI movement and, consequently, her choice was identified. During this period, the user has the possibility to change the selected face: in this case, the blue LED is turned off. When the device correctly detects the new selected face, it will be turned back on intermittently. Once the registration process starts (i.e., the movements detected last more than X seconds), it can no longer be stopped, and the device, once it has identified the face of the cube, will necessarily proceed to save the data.
Data Manager. When the system is ready to store the data, the blue LED is turned off and a green one is turned on, alerting the user that it is starting to save the data. To grant privacy and data security, every TUI has a unique identifier (TUI ID, i.e., its Wi-Fi MAC address) and every user has a username and a password. These data are stored in the SD card; username and password can be changed by the user. All the data both gathered from the sensors (the cube face, time, etc.) and others (TUI ID, username, and password) are saved in a file on the SD card formatted as a JSON string.
Communication Manager. Once the information is stored on the SD card, the device tries to send it to the remote server, using one of the known Wi-Fi networks. The system will attempt to connect to any Wi-Fi network whose parameters are written in the file Wi-fi.txt. Once connected, it tries to establish a TCP (transmission control protocol) connection to the remote server using the parameters stored in the file Server.txt. All data stored into the SD card will be then transferred to the server, including any other data that have not been previously transferred, due, for example, to a temporary Wi-Fi connection loss. If the transmission is successful, the data on the SD card are deleted and the system returns to its initial state (all LEDs off), waiting for future user input.

4.3.2. Implementation: Server Side

On the server side, there are two modules working together in order to manage the data gathered from the Mood TUI: the Communication Manager and the Data Manager (Figure 2).
Communication Manager. It receives JSON data from the Mood TUI Communication Manager and passes it to the Data Manager.
Data Manager. It performs a data check. The TUI ID, the username, and the password contained in the incoming JSON string are validated. It checks if they are correct, valid, and exist in the central database where all users are signed in. If so, the data are stored in files on the server and sent to a document database (MongoDB); otherwise, data are only stored as files on the server for logging purposes and future checks and controls but no information will be sent and saved to the database.

5. Evaluation Method

Once the first implementation of the prototype was made, we decided to discuss the prototype with users in order to generate insights and opinions connected with it, as well as make a preliminary assessment of its acceptance. To this aim, we used several user-centered design workshops.
As discussed in Section 4, we propose the use of a TUI rather than using a traditional GUI to monitor mood data. TUIs have an instant appeal to a broad range of users; TUIs are normally considered a more natural interaction means with respect to GUI and they are also suitable for people who are not acquainted to new technologies such as children, the elderly, etc. [53,103].
The tracking of users’ mood and emotions can be done only by directly involving the user, who may fail to self-monitor herself due to lack of motivation (as discussed in Section 2). Since our study is not currently addressed to patients with mood disorders (it could be an interesting future work), to cope with the cited issue, we needed to recruit people who could be open to gathering their mood for whatever reason. Nowadays, especially people who belong to younger generations are used to publishing and sharing their mood/emotional states by using social networks, even when they do not use a self-tracking tool. Moreover, they are keen on using videogames, and thus more open to a playful approach that may involve the use of tangible interfaces for interacting with digital information.
For these reasons, we focused our study on two specific generations, generally tagged by an accrued use and familiarity with communications, media and digital technologies: Generation Y, better known as “Digital Natives” or Millennials [104,105], and Generation Z, also known as Post-Millennials, the iGeneration [106], or the Homeland Generation [107].
Generation Y are people born during the 1980s and early 1990s (some definitions taking in those born up to 2000). People born during this time period started to have access to technology (computers, cell phones) in their youth. Millennials are the first generation that uses social networks, such as Facebook, to create a different sense of belonging, make acquaintances, and to remain connected with friends and parents [108]. The name is based on Generation X, the generation that preceded them (born 1965–1979), also known as “Non-Digital Natives”, that had been introduced to the Internet, social networks, and smartphones only in their adult years. Another common epithet is Generation Me, coined by Twenge [106], that defines this generation as tolerant, confident, open-minded, and ambitious but also disengaged, narcissistic, distrustful, and anxious.
Generation Z, on the other hand, includes newborns to actual teenagers. Researchers typically use starting birth years ranging from the mid-1990s to early 2000s and ending birth years ranging from the late 2000s to early 2010s. A significant aspect of this generation is its widespread usage of the Internet from a young age. Receiving a mobile phone is considered a rite of passage, and it is “normal” to own one in childhood. Members of Generation Z are typically thought of as being comfortable with technology; they want to be connected with their peers, and interact on social media websites for a significant portion of their socializing [107]. Their main communication tools are video or movies, instead of text and voice like Generation Y; this marks the shifts from PC to mobile and text to video common among this generation [109,110].
In order to conduct our sessions with people belonging to the generations cited above, we focused our attention to a secondary/high school where we could find people belonging to:
  • Generation Z (students aged 14 to 17 years);
  • Generation Y (students aged 18 years and over and teachers under the age of 35 years);
  • Generation X (teachers aged 35 years and over).

5.1. Sample

We organized our evaluation sessions in a secondary/high school in Italy. People were informed about the study through posts published on bulletin boards of the school and on its Intranet; moreover, we published an article in the alumni newspaper. People interested had to send an e-mail to a specific account indicating their age.
We informed minors (students under the age of 18 years) who wanted to participate that they had to fill in a parents’ permission to be involved in the study (they had to attach it to the e-mail). We received 39 requests; 31 coming from students/teachers, two from school personnel, and six from ex-alumni. Seven out of 31 requests from students/teachers came from minors without parental authorization, and they were excluded. In Table 1 we present the age distribution of participants.
We recruited 32 participants: 20 males and 12 females, distributed as shown in Table 2. Their age ranged between 14 and 52 years, with an average of 21.2 years (SD = 10.1). Participants comprised students, teachers, a Ph.D student, and two secretaries.
All participants owned a mobile phone: 30 out of 32 owned a smartphone with Internet capabilities and able to run modern apps; the remaining two used a mobile phone with very limited Internet capabilities because of the small screen, and slower hardware and software. All participants were open to technology and felt themselves quite confident toward digital devices and tracking technologies (M = 3.8 out of a five-point scale).

5.2. Procedure

We sent an e-mail to each participant with a link to a doodle: each participant could choose her preferred session, according to her needs.
Relying on the number of participants and their age, we scheduled six sessions (S1–S6): three sessions for the group aged 14–17 years, two sessions for the group aged 18–35 years, and one session for the group aged >35 years. Each session had a minimum of five participants, up to a maximum of seven.
The resulting sessions were distributed across three consecutive weeks, as shown on Table 3. Participants received, finally, an e-mail with information about the booked session in terms of day, time, and place.
Every session took place in the afternoon, when people were not engaged in classroom activities. Each session lasted about 1 h and was organized as follows:
  • Quantified-self context. We introduced the main concept, discussing several parameters that people would like to track: heartbeat, steps, etc. We introduced some specific terms or acronyms like IoT, wearable devices, and tangible interfaces that we used in the discussion. We asked participants what kind of data would be useful to track and which devices they normally use. Participants discussed the cited parameters, citing apps or devices they use (about 10 min).
  • Conceptual framework. We introduced some parameters that are not easy to monitor like food eaten, dreams, and emotion/mood and guided the discussion toward how they could track them (some of them cited the apps used). We introduced our conceptual framework (Section 4) related to monitoring mood (about 5 min).
  • Questionnaire. Each participant had to fill in a questionnaire composed of nine questions (about 5 min). Participants could ask information if some questions were not clear. The questionnaire is listed in Appendix A. Results of the questionnaire are presented in Table 4 and Table 5 (the column headings refer to the questions of the questionnaire—see Appendix A).
  • Prototype. We introduced our Mood TUI prototype by showing it to participants. Subsequently, we asked each participant to use it; each one chose a value representing her current mood (about 10–15 min).
  • Ideas and feedback. A blank sheet was delivered to each participant. We asked them to express their feedback (even in a graphic form) about the following themes: what they thought about the device, where they would place it, what kind of improvements they suggested to make the device more suitable to their daily habits in terms of design, form, material, tracked parameters (ideas to use the prototype to monitor other parameters), connection to social networks, etc. During this time, each participant could use and/or analyze the prototype (about 10 min).
  • Discussion. Each participant read aloud her feedback, presenting it to others. During the discussion, participants were free to intervene, expressing all their thoughts in order to improve the open discussion (about 20–30 min).
Audio of each session was recorded. All the original questionnaires and all the sheets were gathered and analyzed. Participants were not compensated for their time. Results were analyzed through a thematic analysis [111].

5.3. Data Analysis

Results were coded independently through open and axial coding technique by two coders; data were broken down by taking apart sentences and by labeling them with a code. Then, the two coders reviewed the results to assess consistency. All inconsistencies were resolved. The resulting codes were finally grouped in themes. Four main themes emerged: user acceptance, design (including input and feedback modalities), enhanced features, and long-term sustainability.

6. Results

Participants appreciated the system’s concept and were interested in adopting it. In particular, those belonging to Generation Z appreciated the system’s concept and they were interested in adopting it. The discussion generated a large number of insights and suggested improvements for the concept: for example, participants proposed alternative forms, as well as alternative materials. In particular, participants suggested novel, enhanced features that may improve the design concepts by, for example, allowing the user to automatically “log” into the device (if multiple users have to use the device), to add contextual elements to the recorded mood, or to being reminded of recording a value. Finally, participants highlighted some potential issues for the device sustainability over time, proposing to reduce the device dimensions as well as reduce at minimum the maintenance needs.
User acceptance. Half of the participants claimed to have already monitored some personal parameters: some while doing sports; U02 has traced speed, distance, and heart rate during skiing activities, U20 has tracked heart rate and body temperature for fitness activities, and U31 has tracked heart rate, body temperature, and sleep pattern during a stressful period. Others tracked for entertainment and fun: U14 and U07 tried to test some features built in a smartwatch received as a gift, but they shortly abandoned the data gathering because they did not feel the need to monitor those parameters and they did not understand their utility. None of them ever analyzed retrieved data in order to identify patterns or correlations; the monitoring took place simultaneously with the task being performed and ended with it. Four users had already tried to track their mood; they used apps on their smartphone but they only tried them for fun, not for satisfying real needs. U09 at the end of his session (S2), declared, in private, that he has suffered from attention deficit hyperactivity disorder (ADHD); in the previous years he also had mood-related disorders and had to keep track of his mood throughout all the day. He would be very interested in testing our Mood TUI for collecting data. Most users find the use of a tangible interface to monitor mood interesting, instead of using apps on their smartphone, although some of them (eight out of 32) thought that its use could not be enough to encourage the monitoring of one or more personal parameters in contrast to the smartphone. However, although participants did not have specific goals in mind, they were curious and interested in collecting and exploring their personal data. Everyone would have preferred a smaller object; some proposed implementing the functionality in an already owned portable/wearable object (i.e., a smartwatch) to reduce the number of these devices. In terms of age range, reactions to the system’s concept and prototype were different.
Participants belonging to Generation Z (participants of S1, S2, and S3 sessions) appreciated the system’s concept and they were interested in adopting it: “I’m usually posting my status on Facebook. It would be nice to use the Mood TUI to gather my mood and automatically post it to Facebook without logging in” (U08). “Using emoticons is cool: I can publish it and I could associate to each emoticon a phrase that could be automatically posted as a status on Facebook” (U12).
U21, who belongs to Generation Y (participants belonging to S4 and S5 sessions), said: “It could be interesting to use it, but I no longer public my status on social network: why should I tell everyone how my mood is?” (U21). Most of them (nine out of 12) reported that before starting university, they were used to publishing their emotional state on Facebook, but now “It is no longer so important to do it: before starting the university, I felt the need to do so, because everyone did it” (U17).
Finally, two out of five participants belonging to Generation X (S6 session) used PI tools to gather some personal data in the past (heartbeat, sleep patterns, and body temperature) but not anymore. Most of the participants belonging to that session claimed that “I currently do not trace any personal parameters. I do not think I’ll do it in the future unless for medical reasons” (U28).
Design. Most participants (24 out of 31) liked a cubic form, but some suggested that “the device could have different shapes so everyone could choose her preferred one” (U01, U02, U08). They suggested implementing our concept using other objects, such as:
  • A bracelet (U02, U04): mood levels could be represented with buttons positioned along the outer surface. To select the preferred mood level, the user has to push the relative button. Protection to avoid false inputs (pushing) has to be implemented;
  • A pendant (U25): a small pendant could be inserted into a necklace, kept anchored by two magnets. When the user wants to insert a mood value, she releases the pendant, shakes it and then presses one of its faces. The pendant might be a cube or have another shape based on the number of states the user wants to handle;
  • A smartwatch (U05, U13): similar to the bracelet shape, mood levels would be represented by buttons placed along the strap. To select the mood level, the user has to push over one button. Protection to avoid false inputs has to be implemented (i.e., user has to rotate the clock ring); U19, instead, suggested implementing a force sensor into the strap: when a user wants to enter the mood value, she has to open the strap and straighten it. Then she can fold it according to the value she wants to insert. The emoticon related to the mood value could be shown on the screen of the smartwatch. More mood values could be managed than with the cubic form.
Some participants (U11, U13, U22) would prefer changing the material of the TUI: instead of wood, they suggested to made it with a plastic material because “it would be more resistant to accidental bumps or falls” and/or with a transparent material (LED light could be visible on each face). Almost all participants (29 out 32) would prefer the use of emoticons instead of a numeric value to represent their mood: “their meaning is immediate” (U26), “we are more confident on them, because we use them daily to communicate on social networks and instant messaging tools, like whatsapp, twitter, etc.” (U10), “I find myself more comfortable” (U18). Most of the participants would have changed the input channel: instead of choosing the face based on orientation (thanks to the IMU), they suggested to use a button on each face: when the user has to select her mood rate, simply she presses the button. Many participants were doubtful about the real portability of the object. They proposed to create two objects: a smaller one that can be portable (they suggested removing the Wi-Fi connection to further reduce the size and to also improve the battery autonomy) and a larger one to be kept at home or in the office that can collect the information and sends it to the remote server. When the user comes home, she connects the small device to the large one and transfers the data gathered to the remote server. Some users, however, were critical of this configuration because “As long as I’m not at home (or in the office), I cannot send data to remote server and they are not available for any analysis” (U25).
Enhanced features. In a scenario where the same Mood TUI could be shared with other users (e.g., a workplace or at home with the family), U4 suggested implementing a fingerprint reader in one of the faces of the Mood TUI: “the mood value could be then correlated with the right user, without the use of other techniques or devices”. Other users disagreed: for them (U07, U15, U16, U24), “a TUI must be personal and I don’t want to share it with other users”. U25 and U31 suggested implementing a wireless charge for the TUI: “I often forget to charge some of my devices: using a wireless charge would grant me that TUI would be always charged when I would like to use it”. U30 suggested to add a camera on one of TUI faces: the user could take pictures of herself or the environment or people around her. U27 suggested using vibration as a reminder, instead of a jingle: “It is less intrusive and it would grant me more privacy”. Some users (U17, U20) suggested inserting a screen on each face of the TUI: the user could personalize emoticons or she could associate to each mood value a personal picture or a preferred image. U09 proposed adding another feedback to the TUI. He suggested adding a LED that lights up the TUI based on the mean value of the mood recorded by the user during the day. Each user could choose the color associated to every mood value. Different participants (especially from S1, S2, and S3 sessions) proposed directly uploading data gathered by the TUI to a social network profile: it could be used as status.
Long-term sustainability. Although users appreciated the prototype and its functionality, they reported some problems that could hinder the adoption of the Mood TUI in the long-term: the size and customization of the prototype, the user’s motivation, and maintenance actions. All users proposed reducing the size of the prototype, creating a portable object. Some users proposed creating an object that can be integrated and camouflaged in the environment, making it invisible to others (ensuring greater privacy for the user). For instance, U20 said: “if the object was smaller, nobody would notice its presence on the table”. Other participants proposed implementing its functionality in an already owned wearable object (i.e., a smartwatch) to reduce the number of these portable devices. Some participants suggested making the object customizable in terms of color, shape, and functionality: in this way, the object could always be renewed in its appearance, adapting to different occasions. In terms of users’ motivation, the reactions to the long-term adoption of the system’s concept and prototype varied according to age group. People belonging to Generation Z (users of S1, S2, and S3 sessions) said that they would have no problem in continuing to collect their mood/state in the future, while some participants of Generation Y (users belong to S4 and S5 sessions) were perplexed. They reported that, without strong motivation, they would not collect data about their mood; only those who really want to monitor their mood (motivated user) or those who are forced for health reasons (who suffer, e.g., from mood disorders) would continue to do so. For instance, U22 reported: “I should have a motivation to use it over time”, while U21 said: “Why should I continue to collect my mood data? Why should I tell to someone how my mood is?”. The other participants would use it intensively for the first period (being a novelty) but then they would abandon it, not finding any benefit in use (this behavior would be even more marked if the device was bigger—as discussed earlier). People belonging to Generation X stated a similar analysis: none of them would use Mood TUI for a long time unless they were obliged for medical reasons. Finally, all the participants stated that Mood TUI should not be constrained by too many maintenance actions, such as recharging or the need of continuously being supplied with electric power. They reported that the prototype must have an autonomy of at least one day and a half and must be rechargeable. In this way, they could use it continuously throughout the day and reload it at the end of the day. Some suggested implementing wireless charging.

7. Discussion

Our results highlight that tangible interfaces can be a useful means to increase the self-reporting of emotional data. However, designers should pay attention to the following points:
-
Tangible interfaces should be designed in a way that allows for the portability of the device, since the monitoring of mood may occur in every situation of an individual’s life.
-
Maintenance should be reduced to a minimum, since the monitoring of emotions should not require supplementary actions apart from the act of recording.
-
Maintaining the engagement over time is difficult, and designers should focus on how we can motivate users to continuously use the tangible interface, by experimenting novel forms of reminders, which, nevertheless, should not be annoying.
-
The playful approach is paramount for users that are not strongly self-motivated in monitoring their emotions (i.e., they do not have a mood disorder); designers should explore how such an approach could be made more effective, for example, by experimenting with gamification techniques that could be paired with a tangible approach to design [112].
Once the design workshops ended, we thought about how to continue our research and how we could improve the Mood TUI. Two possible paths could be followed: (i) optimizing the Mood TUI according to some of the ideas that emerged during participatory design sessions; (ii) further investigating the initial proposal to accomplish the first goal of tracking emotions.

7.1. Optimizing Mood TUI

We planned to optimize the Mood TUI according to the participatory design sessions. Several main themes emerged: platform, design, dimension, material, and enhanced features.
Platform and dimension. We had to create a smaller and, consequently, a more portable object. We changed the platform, using an Arduino Yun (normal or Mini version) or a Lilypad (an Arduino platform for wearable devices) instead of the Arduino Mega. Arduino Yun is smaller than Arduino Mega and integrates a Wi-Fi shield and an SD card reader. Using this, we were able to reduce the dimension occupied by our TUI as well as the firmware size. Otherwise, we could use a Lilypad platform; we would lose the Wi-Fi feature but we could reduce even more the dimension of our TUI. In the latter scenario, a base station would be required. The portable TUI collects mood values during the day. When the user comes home, the portable TUI would be connected to the base station and data would be downloaded by wire (USB) or Bluetooth. Reducing the TUI dimension would permit us to create several personalized shapes, different from the current cubic form. The user could personalize each face of the TUI; she could choose an emoticon or a personal picture/photo that could better represent a specific mood value. Choosing the mood value could be done by selecting the face up of the TUI (using the IMU as in our prototype—see Section 4.3.1) or we could implement on each face a pressure sensor or a button which the user could press to select her mood value.
Material end enhanced features. The TUI could be made of some plastic material or plexiglass instead of wood; it would be sturdier, more resistant to accidental bumps or falls, and transparent. In this configuration, we can add a new RGB LED to the TUI that can emit a colorful light according to the mean value of the user mood. Every time a mood value is saved into the SD card, the RGB LED lights up, signaling the average of the daily measures gathered up until that moment. The user could further personalize her TUI by choosing her favorite color scale associated with the different mood values. By using an RGB LED, it would be possible to cover all the palette colors. On one face, we would add a fingerprint reader; the user could be recognized by her fingerprint (eliminating the need for a username and password in the Param.txt—see Section 4.3.1). Moreover, this feature offers the possibility of more people using the TUI at once. In an environment with more than one user, each person could use the TUI and data collected can be simply be associated with the right user without changing the user information on the SD files.
Furthermore, we wanted to integrate mood data with information taken from other sources; the system could automatically collect the context (place and people) in which the mood state arises, inferring it from e.g., the GPS sensor of the user’s smartphone, events gathered from the user’s social networks (Facebook, Twitter, WhatsApp, Google+), shared calendars (Google calendar), etc. Moreover, the platform could receive further information from other devices that are able to automatically detect physiological indicators (such as heart rate, body temperature, etc.).

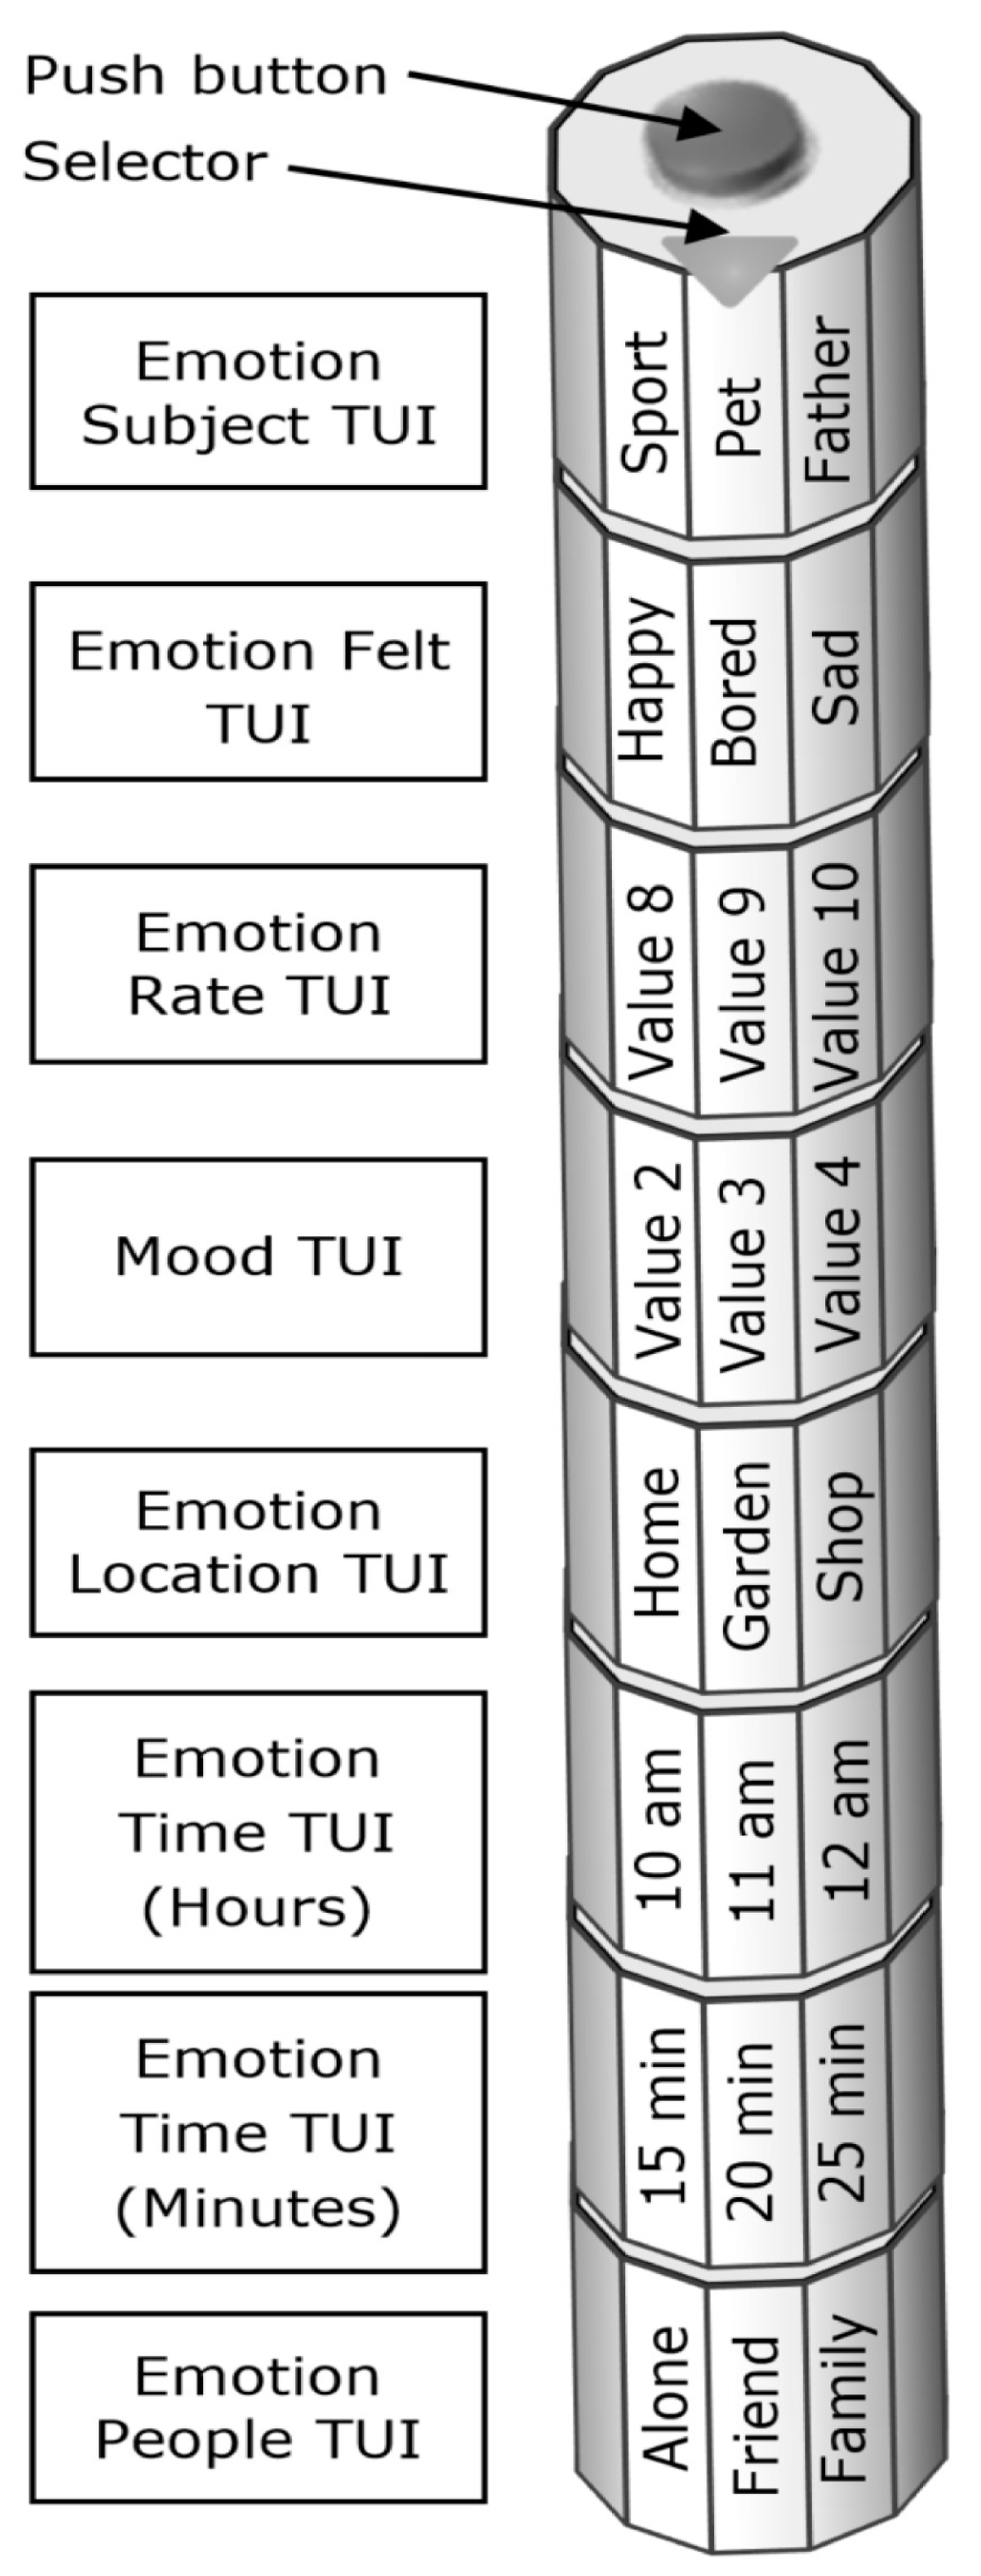
7.2. Tracking Emotions

Once having implemented and optimized the Mood TUI according to the suggestions that emerged during the evaluation sessions (as shown in Section 7.1), we further investigated the initial proposal to accomplish the first goal: tracking emotions [113].
The idea is to propose a PI system able to support users in self-reporting their emotions. Since people can feel different emotions at the same time and without some contextual information it would be difficult to rightly describe and understand them, we have to associate to each emotion with some other information such as the people the user was with, location, time, etc. The platform would be composed by an app on the user’s smartphone that automatically gathers contextual data (place, people, time) and the data of some modular TUIs (Figure 5 and Figure 6) composed, basically, the same as the Mood TUI (see Section 4.3 and Section 7.1).
The user would have to use each TUI to communicate with the system in order to provide:
  • The subject related to the emotion felt: sports, family, pets, friends, colleagues, workplace, home, etc. (Emotion Subject TUI);
  • The type of emotion felt (stressed, worried, sad, motivated, bored, happy, etc.) (Emotion Felt TUI);
  • The rate of the emotions felt (Emotion Rate TUI);
  • The mood felt (Mood TUI);
  • The location where the emotion was felt (this parameter could be collected directly from the user’s smartphone or by the system itself if a GPS sensor is installed in) (Emotion Location TUI);
  • The time when the emotion was felt (this parameter could be collected directly from the user’s smartphone or by the system itself if a Real Time Clock is installed in). This TUI is composed of two subTUIs: one for the hour and one for the minute (Emotion Time TUI);
  • People involved in the context or within the environment (Emotion People TUI).
Every TUI has several faces: a different value is represented on each face (for example in the Emotional Subject TUI, on each face there is a different subject related to the emotion felt: e.g., one for sport, one for each family component, one for the pet, etc.).
Every user could have a different configuration because she could choose which TUI elements will compose her system: only some TUIs could be used and in other ones, some elements can be duplicated. In some configurations, the user can have more Emotion TUIs and Emotional Rate TUIs in order to assign more emotions that are concurrent to a specific event. Each TUI is physically connected to the next one through a male/female connector, as shown in Figure 5 and Figure 6: it communicates with the others and with the system itself by wireless technology (ZigBee, Bluetooth or Wi-Fi) or by an internal bus. To select a particular value, the user has to rotate, like a wheel, the TUI until the right value is aligned with the selector that identifies the right combination (see the arrow in Figure 7).
When the user is going to report her emotions, first of all, she manually selects the subject related to the emotion, rotating the Emotional Subject TUI (or pressing the right face as indicated in the optimized Mood TUI. See Section 7.1) until the right subject is selected. If the emotion occurred to the past, she manually selects in the Emotion Time TUI the time when the emotion occurred and the system automatically recollects the context (place and people) in which that emotional state happened, inferring it by e.g., the GPS sensor of user’s smartphone, user’s social networks (Facebook, Twitter, WhatsApp, Google+), shared calendars (Google calendar, Facebook), etc.
Otherwise, if the emotion refers to a present situation, the system automatically sets the Emotional Time TUI (using a Real Time Clock or the user’s smartphone). Subsequently, the user selects which emotion she is feeling (using the Emotional TUI—rotating it or pressing the right face) and the rate associated with that emotion (using the Emotional Rate TUI). Then she could proceed to rotate the remaining TUI components, until all values selected are aligned with the Selector (see Figure 7). When she ends and decides to save the information, she pushes the button at the top of the TUI system (see Figure 7): the information will then be saved into an internal memory (SD card) as a JSON file, inside the Emotion Subject TUI. Then the information will be transferred to a remote document database (such as MongoDB) in order to be analyzed. Moreover, the platform would be able to receive further information from other devices able to automatically detect physiological indicators (such as heart rate, body temperature, etc.) or environmental indicators (such as temperature, pressure, humidity, etc.). Every time a value referred to the Mood TUI is saved into the SD card, an RGB LED, inserted into the same TUI, lights up, signaling the average of the measures gathered up to that moment (the RGB LED can use a multitude of colors, i.e., starting from the red for the lowest value to the green for the highest value). Data collected on the database can be browsed and analyzed afterwards by the user in order to (1) see her emotional history; (2) have a representation of her emotional states through different points of view; and (3) inspect correlations among data.

8. Limitations

The main limitations of the proposed method lie in the fact that the workshops provide opinions, but they do not show if and how people would actually use a device. This does not provide a realistic situation, but only consultative data reporting, i.e., the opinion one has on the system and not usage data. We cannot claim, therefore, that our interface will actually increase the users’ compliance in reporting their data over time. Moreover, we only made participants use the prototype for 15 min; this weakens our claims about the fun and engaging experience that our prototype could provide.

9. Conclusions

In this article we presented a platform based on a tangible user interface for self-monitoring mood and emotions. We realized a prototype and tested it during several participatory design sessions. Based on feedback received during the sessions, participants found the TUI interesting and more amusing than the use of smartphone. In particular, participants who daily publish their mood or status on social networks found its use faster and more fun than the use of an app on a smartphone. In fact, with its use, they can quickly and easily collect mood or emotion data without being distracted by long procedures or running the risk of forgetting or losing the proven sensation. With the integration with a data visualization tool, they will have the possibility of analysing all their data whenever they want, helping them in the retrospective reconstruction of emotions. Finally, participants found the use of a tangible interface very exciting and stimulating: in fact, they thought about how to use them in similar or totally different contexts, further broadening our horizon in the use of this kind of interface.

Conflicts of Interest

The authors declare no conflict of interest.

Appendix A

The following shows the questionnaire used during the participatory design sessions (in parentheses, the expected value):
Q1
Sex (closed question: M or F);
Q2
Profession;
Q3
Age (numeric value);
Q4
On a scale 1 to 5 (1 = not confident, 5 = very confident) how would you rate your confidence with technological devices (numeric value);
Q5
Smartphone/Mobile phones.
  • How many smartphones do you own? (user has to answer with the number of smartphones owned);
  • What type of smartphones do you own? (open answer with brand and specific model)
  • How many mobile phones do you own? (user has to answer with the number of mobile phones owned);
  • What type of mobile phones do you own? (open answer with information about brand and specific model)
Q6
How many hours per day do you use the phone:
  • to make calls? (numeric value);
  • to play? (numeric value)
  • to chat? (numeric value)
  • to surf on the Internet? (numeric value)
  • to send/receive mails? (numeric value)
  • to take/see photos/videos? (numeric value)
  • to listen to the music? (numeric value)
Q7
How many hours per day do you use the Internet? (numeric value)
Q8
How many hours per day do you play videogames? (numeric value)
Q9
Wearable devices.
  • Have you ever used a wearable device? (closed question: T or F);
  • Do they monitor some personal data? (closed question: T or F);

References

  1. Marcengo, A.; Rapp, A. Visualization of human behavior data: The quantified self. In Innovative Approaches of Data Visualization and Visual Analytics; Huang, M.L., Huang, W., Eds.; IGI Global: Hershey, PA, USA, 2014; pp. 236–265. ISBN 9781466643093. [Google Scholar]
  2. Rapp, A.; Tirassa, M. Know Thyself: A Theory of the Self for Personal Informatics. Hum.-Comput. Interact. 2017, 32, 335–380. [Google Scholar] [CrossRef]
  3. Fox, S.; Duggan, M. Health Online 2012; Pew Internet & American Life Project: Washington, DC, USA, 2012. [Google Scholar]
  4. Jimison, H.; Gorman, P.; Woods, S.; Nygren, P.; Walker, M.; Norris, S.; Hersh, W. Barriers and drivers of health information technology use for the elderly, chronically ill, and underserved. Evid. Rep./Technol. Assess. 2008, 1, 1–1422. [Google Scholar]
  5. Fox, S. The Social Life of Health Information, 2011; Pew Internet & American Life Project: Washington, DC, USA, 2011. [Google Scholar]
  6. Fox, S. Is There Hope for SMS Health Alerts. Available online: http://www.pewinternet.org/2012/12/17/is-there-hope-for-sms-health-alerts/ (accessed on 4 January 2018).
  7. Rapp, A.; Cena, F.; Kay, J.; Kummerfeld, B.; Hopfgartner, F.; Plumbaum, T.; Larsen, J.E. New frontiers of quantified self: Finding new ways for engaging users in collecting and using personal data. In Proceedings of the 2015 ACM International Joint Conference on Pervasive and Ubiquitous Computing and Proceedings of the 2015 ACM International Symposium on Wearable Computers, Osaka, Japan, 7–11 September 2015; ACM: New York, NY, USA, 2015; pp. 969–972. [Google Scholar]
  8. Rapp, A.; Cena, F.; Kay, J.; Kummerfeld, B.; Hopfgartner, F.; Plumbaum, T.; Larsen, J.E.; Epstein, D.A.; Gouveia, R. New frontiers of quantified self 2: Going beyond numbers. In Proceedings of the 2016 ACM International Joint Conference on Pervasive and Ubiquitous Computing, Heidelberg, Germany, 12–16 September 2016; ACM: New York, NY, USA, 2016; pp. 506–509. [Google Scholar]
  9. Rapp, A.; Cena, F.; Kay, J.; Kummerfeld, B.; Hopfgartner, F.; Plumbaum, T.; Larsen, J.E.; Epstein, D.A.; Gouveia, R. New frontiers of quantified self 3: Exploring understudied categories of users. In Proceedings of the 2017 ACM International Joint Conference on Pervasive and Ubiquitous Computing and Proceedings of the 2017 ACM International Symposium on Wearable Computers, Maui, HI, USA, 11–15 September 2017; ACM: New York, NY, USA, 2017; pp. 861–864. [Google Scholar]
  10. Cena, F.; Likavec, S.; Rapp, A. Quantified self and modeling of human cognition. In Proceedings of the 2015 ACM International Joint Conference on Pervasive and Ubiquitous Computing and Proceedings of the 2015 ACM International Symposium on Wearable Computers, Osaka, Japan, 7–11 September 2015; ACM: New York, NY, USA, 2015; pp. 1021–1026. [Google Scholar]
  11. Rapp, A.; Cena, F. Self-monitoring and Technology: Challenges and Open Issues in Personal Informatics. In Universal Access in Human-Computer Interaction. Design for All and Accessibility Practice, Part IV, Proceedings of the 8th International Conference, UAHCI 2014, Held as Part of HCI International 2014, Heraklion, Crete, Greece, 22–27 June 2014; Stephanidis, C., Antona, M., Eds.; Springer: Cham, Switzerland, 2014; pp. 613–622. ISBN 978-3-319-07509-9. [Google Scholar]
  12. Rapp, A.; Cena, F. Personal informatics for everyday life: How users without prior self-tracking experience engage with personal data. Int. J. Hum.-Comput. Stud. 2016, 94, 1–17. [Google Scholar] [CrossRef]
  13. Matassa, A.; Rapp, A.; Simeoni, R. Wearable accessories for cycling: Tracking memories in urban spaces. In Proceedings of the 2013 ACM Conference on Pervasive and Ubiquitous Computing Adjunct Publication, Zurich, Switzerland, 8–12 September 2013; ACM: New York, NY, USA, 2013; pp. 415–424. [Google Scholar]
  14. Banaee, H.; Ahmed, M.U.; Loutfi, A. Data mining for wearable sensors in health monitoring systems: A review of recent trends and challenges. Sensors 2013, 13, 17472–17500. [Google Scholar] [CrossRef] [PubMed]
  15. Cena, F.; Likavec, S.; Rapp, A.; Marcengo, A. An ontology for quantified self: Capturing the concepts behind the numbers. In Proceedings of the 2016 ACM International Joint Conference on Pervasive and Ubiquitous Computing, Heidelberg, Germany, 12–16 September 2016; ACM: New York, NY, USA, 2016; pp. 602–604. [Google Scholar]
  16. Hilviu, D.; Rapp, A. Narrating the quantified self. In Proceedings of the 2015 ACM International Joint Conference on Pervasive and Ubiquitous Computing and Proceedings of the 2015 ACM International Symposium on Wearable Computers, Osaka, Japan, 7–11 September 2015; ACM: New York, NY, USA, 2015; pp. 1051–1056. [Google Scholar]
  17. Nafus, D.; Denman, P.; Durham, L.; Florez, O.; Nachman, L.; Sahay, S.; Savage, E.; Sharma, S.; Strawn, D.; Wouhaybi, R.H. As simple as possible but no simpler: Creating flexibility in personal informatics. In Proceedings of the 2016 CHI Conference Extended Abstracts on Human Factors in Computing Systems, San Jose, CA, USA, 7–12 May 2016; ACM: New York, NY, USA, 2016; pp. 1445–1452. [Google Scholar]
  18. Rapp, A.; Cena, F. Affordances for self-tracking wearable devices. In Proceedings of the 2015 ACM International Symposium on Wearable Computers, Osaka, Japan, 7–11 September 2015; ACM: New York, NY, USA, 2015; pp. 141–142. [Google Scholar]
  19. Rapp, A.; Cena, F.; Hilviu, D.; Tirassa, M. Human body and smart objects. In Proceedings of the 2015 ACM International Joint Conference on Pervasive and Ubiquitous Computing and Proceedings of the 2015 ACM International Symposium on Wearable Computers, Osaka, Japan, 7–11 September 2015; ACM: New York, NY, USA, 2015; pp. 939–943. [Google Scholar]
  20. Cena, F.; Rapp, A.; Likavec, S.; Marcengo, A. Envisioning the Future of Personalization through Personal Informatics: A User Study. Int. J. Mob. Hum. Comput. Interact. (IJMHCI) 2018, 10, 52–66. [Google Scholar] [CrossRef]
  21. Cabanac, M. What is emotion? Behav. Process. 2002, 60, 69–83. [Google Scholar] [CrossRef]
  22. Schacter, D.L.; Gilbert, D.T.; Wegner, D.M. Psychology, 2nd ed.; Worth: New York, NY, USA, 2011. [Google Scholar]
  23. Brave, S.; Nass, C. Emotion in human-computer interaction. In The Human-Computer Interaction Handbook; L. Erlbaum Associates Inc.: Mahwah, NJ, USA, 2002; pp. 81–96. [Google Scholar]
  24. Clore, G.L.; Robinson, M.D. Knowing our emotions: How do we know what we feel. Handb. Self-Knowl. 2012, 1, 194–209. [Google Scholar]
  25. Affectiva. Available online: http://www.affectiva.com/technology/ (accessed on 13 August 2017).
  26. Emotient. Available online: http://www.emotient.com (accessed on 13 August 2016).
  27. Marcengo, A.; Rapp, A.; Cena, F.; Geymonat, M. The Falsified Self: Complexities in Personal Data Collection. In Proceedings of the HCI International Conference on Universal Access in Human-Computer Interaction, Toronto, ON, Canada, 17–22 July 2016; Methods, Techniques, and Best Practices, Lecture Notes in Computer Science. Springer: Cham, Switzerland, 2016; Volume 9737, pp. 351–358. [Google Scholar]
  28. Wallbott, H.G.; Scherer, K.R. Assessing emotion by questionnaire. Emot. Theory Res. Exp. 1989, 4, 55–82. [Google Scholar]
  29. Lorr, M. Models and methods for measurement of mood. In Emotion: Theory, Research, and Experience; The Measurement of Emotions; Plutchik, R., Kellerman, H., Eds.; Academic Press: San Diego, CA, USA, 1989; Volume 4, pp. 37–53. [Google Scholar]
  30. Lang, P.J. The emotion probe: Studies of motivation and attention. Am. Psychol. 1995, 50, 372. [Google Scholar] [CrossRef] [PubMed]
  31. Plutchik, R. Measuring emotions and their derivatives. Emot. Theory Res. Exp. 1989, 4, 1. [Google Scholar]
  32. McCurdie, T.; Taneva, S.; Casselman, M.; Yeung, M.; McDaniel, C.; Ho, W.; Cafazzo, J. mHealth Consumer Apps: The Case for User-Centered Design. Biomed. Instrum. Technol. 2012, 46, 49–56. [Google Scholar] [CrossRef] [PubMed]
  33. Kay, M.; Santos, J.; Takane, M. mHealth: New horizons for health through mobile technologies. World Health Organ. 2011, 3, 66–71. [Google Scholar]
  34. Bartlett, F.C.; Burt, C. Remembering: A study in experimental and social psychology. Br. J. Educ. Psychol. 1933, 3, 187–192. [Google Scholar] [CrossRef]
  35. Cardillo, D.; Rapp, A.; Benini, S.; Console, L.; Simeoni, R.; Guercio, E.; Leonardi, R. The art of video MashUp: Supporting creative users with an innovative and smart application. Multimed. Tools Appl. 2011, 53, 1–23. [Google Scholar] [CrossRef] [Green Version]
  36. Console, L.; Antonelli, F.; Biamino, G.; Carmagnola, F.; Cena, F.; Chiabrando, E.; Cuciti, V.; Demichelis, M.; Fassio, F.; Franceschi, F.; et al. Interacting with social networks of intelligent things and people in the world of gastronomy. ACM Trans. Interact. Intell. Syst. 2013, 3, 1–38. [Google Scholar] [CrossRef]
  37. Simeoni, R.; Etzler, L.; Guercio, E.; Perrero, M.; Rapp, A.; Montanari, R.; Tesauri, F. Innovative TV: From an old standard to a new concept of Interactive TV—An Italian job. In Proceedings of the International Conference on Human-Computer Interaction, Beijing, China, 22–27 July 2007; HCI Intelligent Multimodal Interaction Environments, Lecture Notes in Computer Science. Springer: Berlin/Heidelberg, Germany, 2007; Volume 4552, pp. 971–980. [Google Scholar] [CrossRef]
  38. Simeoni, R.; Geymonat, M.; Guercio, E.; Perrero, M.; Rapp, A.; Tesauri, F.; Montanari, R. Where Have You Ended Up Today? Dynamic TV and the Inter-tainment Paradigm. In Proceedings of the European Conference on Interactive Television, Salzburg, Austria, 3–4 July 2008; Springer: Berlin/Heidelberg, Germany, 2008; pp. 238–247. [Google Scholar]
  39. Vellar, A.; Simeoni, R.; Montanari, R.; Rapp, A. A parasocial navigation concept for movie discovery. In Proceedings of the Interfaces and Human Computer Interaction (IHCI), Amsterdam, The Netherlands, 25–27 July 2008; pp. 291–296, ISBN 978-972-8924-59-1. [Google Scholar]
  40. Rapp, A.; Marcengo, A.; Console, L.; Simeoni, R. Playing in the wild: Enhancing user engagement in field evaluation methods. In Proceedings of the 16th International Academic MindTrek Conference, Tampere, Finland, 3–5 October 2012; ACM: New York, NY, USA, 2012; pp. 227–228. [Google Scholar]
  41. Rapp, A. A Qualitative Investigation of Gamification: Motivational Factors in Online Gamified Services and Applications. Int. J. Technol. Hum. Interact. 2015, 11, 67–82. [Google Scholar] [CrossRef]
  42. Rapp, A.; Cena, F.; Gena, C.; Marcengo, A.; Console, L. Using game mechanics for field evaluation of prototype social applications: A novel methodology. Behav. Inf. Technol. 2016, 35, 184–195. [Google Scholar] [CrossRef]
  43. Rapp, A. Beyond Gamification: Enhancing User Engagement through Meaningful Game Elements. In Proceedings of the Foundation of Digital Games, Chania, Greece, 14–17 May 2013; Society for the Advancement of the Science of Digital Games. ISBN 978-0-9913982-0-1. [Google Scholar]
  44. Rapp, A.; Cena, F.; Hopfgartner, F.; Hamari, J.; Linehan, C. Fictional game elements: Critical perspectives on gamification design. In Proceedings of the 2016 Annual Symposium on Computer-Human Interaction in Play Companion Extended Abstracts (CHI PLAY Companion 2016), Austin, Texas, USA, 16–19 October 2016; ACM: New York, NY, USA, 2016; pp. 373–377. [Google Scholar]
  45. Rapp, A. Designing interactive systems through a game lens: An ethnographic approach. Comput. Hum. Behav. 2017, 71, 455–468. [Google Scholar] [CrossRef]
  46. Rapp, A. Drawing inspiration from World of Warcraft: Gamification design elements for behavior change technologies. Interact. Comput. 2017, 29, 648–678. [Google Scholar] [CrossRef]
  47. Rapp, A. From games to gamification: A classification of rewards in World of Warcraft for the design of gamified systems. Simul. Gaming 2017, 48, 381–401. [Google Scholar] [CrossRef]
  48. Rapp, A. Meaningful game elements for personal informatics. In Proceedings of the 2014 ACM International Symposium on Wearable Computers: Adjunct Program, Seattle, WA, USA, 13–17 September 2014; ACM: New York, NY, USA, 2014; pp. 125–130. [Google Scholar]
  49. Shaer, O.; Hornecker, E. Tangible user interfaces: Past, present, and future directions. Found. Trends Hum.-Comput. Interact. 2010, 3, 1–137. [Google Scholar] [CrossRef] [Green Version]
  50. Ishii, H.; Ullmer, B. Tangible bits: Towards seamless interfaces between people, bits and atoms. In Proceedings of the ACM SIGCHI Conference on Human Factors in Computing Systems, Atlanta, GA, USA, 22–27 March 1997; ACM: New York, NY, USA, 1997; pp. 234–241. [Google Scholar]
  51. Mugellini, E.; Rubegni, E.; Gerardi, S.; Khaled, O.A. Using personal objects as tangible interfaces for memory recollection and sharing. In Proceedings of the 1st International Conference on Tangible and Embedded Interaction, Baton Rouge, LA, USA, 15–17 February 2007; ACM: New York, NY, USA, 2007; pp. 231–238. [Google Scholar]
  52. Xie, L.; Antle, A.N.; Motamedi, N. Are tangibles more fun?: Comparing children’s enjoyment and engagement using physical, graphical and tangible user interfaces. In Proceedings of the 2nd International Conference on Tangible and Embedded Interaction, BatBonn, Germany, 18–20 February 2008; ACM: New York, NY, USA, 2008; pp. 191–198. [Google Scholar]
  53. Zuckerman, O.; Gal-Oz, A. To TUI or not to TUI: Evaluating performance and preference in tangible vs. graphical user interfaces. Int. J. Hum.-Comput. Stud. 2013, 71, 803–820. [Google Scholar] [CrossRef]
  54. Christensen, P.; Mikkelsen, M.R.; Nielsen, T.A.S.; Harder, H. Children, mobility, and space: Using GPS and mobile phone technologies in ethnographic research. J. Mix. Methods Res. 2011, 5, 227–246. [Google Scholar] [CrossRef]
  55. Track Your Happiness. Available online: https://www.trackyourhappiness.org/ (accessed on 5 July 2016).
  56. Happy Factor. Available online: http://howhappy.dreamhosters.com/ (accessed on 13 August 2017).
  57. Mood Panda. Available online: http://www.moodpanda.com/ (accessed on 13 August 2016).
  58. Matthews, M.; Doherty, G. In the mood: Engaging teenagers in psychotherapy using mobile phones. In Proceedings of the SIGCHI Conference on Human Factors in Computing Systems, Vancouver, BC, Canada, 7–12 May 2011; ACM: New York, NY, USA, 2011; pp. 2947–2956. [Google Scholar]
  59. Mood 24/7. Available online: https://www.mood247.com/ (accessed on 13 August2017).
  60. Mood Scope. Available online: https://www.moodscope.com// (accessed on 13 August 2016).
  61. Mood Tracker. Available online: https://www.moodtracker.com/ (accessed on 13 August 2016).
  62. Gotta Feeling. Available online: http://gottafeeling.com// (accessed on 13 August 2017).
  63. Mappiness. Available online: http://www.mappiness.org.uk/ (accessed on 13 August 2016).
  64. StressEraser. Available online: http://www.stresseraser.com (accessed on 5 July 2016).
  65. T2 Mood Tracker. Available online: http://www.t2.health.mil/apps/t2-mood-tracker (accessed on 5 July 2016).
  66. Med Help Mood Tracker. Available online: http://www.medhelp.org/user-trackers/gallery/mood/ (accessed on 13 August 2016).
  67. Feelytics. Available online: Http://feelytics.me/index.php (accessed on 13 August 2016).
  68. Li, I. Designing personal informatics applications and tools that facilitate monitoring of behaviors. In Proceedings of the UIST 2009, Victoria, BC, Canada, 4–7 October 2009. [Google Scholar]
  69. Valenza, G.; Gentili, C.; Lanatà, A.; Scilingo, E.P. Mood recognition in bipolar patients through the PSYCHE platform: Preliminary evaluations and perspectives. Artif. Intell. Med. 2013, 57, 49–58. [Google Scholar] [CrossRef] [PubMed]
  70. Fractal. Available online: http://www.design.philips.com/about/design/designportfolio/design-futures/fractal.page (accessed on 13 August 2016).
  71. Davis, F.; Roseway, A.; Carroll, E.; Czerwinski, M. Actuating mood: Design of the textile mirror. In Proceedings of the 7th International Conference on Tangible, Embedded and Embodied Interaction, Barcelona, Spain, 10–13 February 2013; ACM: New York, NY, USA, 2013; pp. 99–106. [Google Scholar]
  72. BodyMonitor. Available online: http://bodymonitor.de (accessed on 13 August 2017).
  73. Rationalizer. Available online: http://www.mirrorofemotions.com/ (accessed on 5 July 2016).
  74. Bretl, D. Emotish. Available online: https://www.appfutura.com/app/emotish-dj (accessed on 4 January 2018).
  75. Ouellet, S. Real-time emotion recognition for gaming using deep convolutional network features. arXiv 2014, arXiv:14083750. [Google Scholar]
  76. Yu, Z.; Zhang, C. Image based static facial expression recognition with multiple deep network learning. In Proceedings of the 2015 ACM on International Conference on Multimodal Interaction, Seattle, WA, USA, 9–13 November 2015; ACM: New York, NY, USA, 2015; pp. 435–442. [Google Scholar]
  77. Kim, B.-K.; Roh, J.; Dong, S.-Y.; Lee, S.-Y. Hierarchical committee of deep convolutional neural networks for robust facial expression recognition. J. Multimodal User Interfaces 2016, 10, 173–189. [Google Scholar] [CrossRef]
  78. Knapton, S. Bad mood? New app senses emotion and suggests food to lift spirits. The Telegraph, 27 November 2016. [Google Scholar]
  79. Lathia, N.; Pejovic, V.; Rachuri, K.K.; Mascolo, C.; Musolesi, M.; Rentfrow, P.J. Smartphones for Large-Scale Behavior Change Interventions. IEEE Pervasive Comput. 2013, 12, 66–73. [Google Scholar] [CrossRef]
  80. Hornecker, E.; Buur, J. Getting a grip on tangible interaction: A framework on physical space and social interaction. In Proceedings of the SIGCHI Conference on Human Factors in Computing Systems, Montréal, QC, Canada, 22–27 April 2006; ACM: New York, NY, USA, 2006; p. 437. [Google Scholar]
  81. Klemmer, S.R.; Landay, J.A. Tangible User Interface Input: Tools and Techniques. Ph.D. Thesis, University of California, Berkeley, CA, USA, 2004. [Google Scholar]
  82. Klemmer, S.R.; Li, J.; Lin, J.; Landay, J.A. Papier-Mache: Toolkit support for tangible input. In Proceedings of the SIGCHI Conference on Human Factors in Computing Systems, Vienna, Austria, 24–29 April 2004; ACM: New York, NY, USA, 2004; pp. 399–406. [Google Scholar]
  83. Kimura, H.; Tokunaga, E.; Okuda, Y.; Nakajima, T. CookieFlavors: Easy Building Blocks for Wireless Tangible Input. In Proceedings of the CHI 2006 Extended Abstracts on Human Factors in Computing Systems (CHI EA 2006), Montréal, QC, Canada, 22–27 April 2006; ACM: New York, NY, USA, 2006; pp. 965–970. [Google Scholar]
  84. Jacquemin, C. Pogany: A Tangible Cephalomorphic Interface for Expressive Facial Animation. In Proceedings of the Affective Computing and Intelligent Interaction: Second International Conference, ACII 2007, Lisbon, Portugal, 12–14 September 2007; Paiva, A.C.R., Prada, R., Picard, R.W., Eds.; Springer: Berlin/Heidelberg, Germany, 2007; pp. 558–569, ISBN 978-3-540-74889-2. [Google Scholar]
  85. Cohen, J.; Withgott, M.; Piernot, P. Logjam: A Tangible Multi-person Interface for Video Logging. In Proceedings of the SIGCHI Conference on Human Factors in Computing Systems (CHI 1999), Pittsburgh, PA, USA, 15–20 May 1999; ACM: New York, NY, USA, 1999; pp. 128–135. [Google Scholar]
  86. Terrenghi, L.; Kranz, M.; Holleis, P.; Schmidt, A. A Cube to Learn: A Tangible User Interface for the Design of a Learning Appliance. Pers. Ubiquitous Comput. 2006, 10, 153–158. [Google Scholar] [CrossRef]
  87. Camarata, K.; Do, E.Y.-L.; Johnson, B.R.; Gross, M.D. Navigational Blocks: Navigating Information Space with Tangible Media. In Proceedings of the 7th International Conference on Intelligent User Interfaces (IUI 2002), San Francisco, CA, USA, 13–16 January 2002; ACM: New York, NY, USA, 2002; pp. 31–38. [Google Scholar]
  88. Van Laerhoven, K.; Villar, N.; Schmidt, A.; Kortuem, G.; Gellersen, H. Using an Autonomous Cube for Basic Navigation and Input. In Proceedings of the 5th International Conference on Multimodal Interfaces (ICMI 2003), Vancouver, BC, Canada, 5–7 November 2003; ACM: New York, NY, USA, 2003; pp. 203–210. [Google Scholar]
  89. Huron, S.; Carpendale, S.; Thudt, A.; Tang, A.; Mauerer, M. Constructive Visualization. In Proceedings of the 2014 Conference on Designing Interactive Systems (DIS 2014), Vancouver, BC, Canada, 21–25 June 2014; ACM: New York, NY, USA, 2014; pp. 433–442. [Google Scholar]
  90. Emotional Tactile Map. Available online: http://vis4me.com/portfolio/emotional-tactile-map/ (accessed on 16 December 2017).
  91. Inca Quipus. Available online: http://dataphys.org/list/peruvian-quipus/ (accessed on 16 December 2017).
  92. Pulse: Animated Heart Shows Sentiments. Available online: http://dataphys.org/list/pulse-showing-emotional-responses-on-the-web/ (accessed on 16 December 2017).
  93. What Made Me. Available online: http://dataphys.org/list/what-made-me-interactive-public-installation/ (accessed on 16 December 2017).
  94. Physical Visual Sedimentation. Available online: http://dataphys.org/list/physical-visual-sedimentation/ (accessed on 16 December 2017).
  95. Physical Bar Charts. Available online: http://www.lucykimbell.com/LucyKimbell/PhysicalBarCharts.html (accessed on 16 December 2017).
  96. The Happy Show. Available online: https://sagmeisterwalsh.com/work/all/the-happy-show/ (accessed on 16 December 2017).
  97. Arduino. Available online: http://www.arduino.cc (accessed on 13 August 2017).
  98. Sarzotti, F.; Lombardi, I.; Rapp, A.; Marcengo, A.; Cena, F. Engaging Users in Self-Reporting Their Data: A Tangible Interface for Quantified Self. In International Conference on Universal Access in Human-Computer Interaction; Springer: Cham, Switzerland, 2015; pp. 518–527. [Google Scholar]
  99. Cena, F.; Lombardi, I.; Rapp, A.; Sarzotti, F. Self-Monitoring of Emotions: A Novel Personal Informatics Solution for an Enhanced Self-Reporting. In Proceedings of the 22nd Conference on User Modeling, Adaptation and Personalization UMAP 2014, Aalborg, Denmark, 7–11 July 2014; CEUR Workshop Proceedings. 2014; Volume 1181. [Google Scholar]
  100. D3.js. Available online: https://d3js.org/ (accessed on 18 December 2017).
  101. Mapbox. Available online: https://www.mapbox.com/ (accessed on 18 December 2017).
  102. Varesano, F. FreeIMU: An open hardware framework for orientation and motion sensing. arXiv 2013, arXiv:13034949. [Google Scholar]
  103. Ishii, H. Tangible User Interfaces. In Human-Computer Interaction: Design Issues, Solutions, and Applications; CRC Press: Boca Raton, FL, USA, 2007; p. 469. [Google Scholar]
  104. Howe, N.; Strauss, W. Generations: The History of America’s Future, 1584 to 2069; HarperCollins: New York, NY, USA, 1992; ISBN 978-0-688-11912-6. [Google Scholar]
  105. Howe, N.; Strauss, W. Millennials Rising: The Next Great Generation; Vintage: New York, NY, USA, 2009. [Google Scholar]
  106. Twenge, J.M. Generation Me-Revised and Updated: Why Today’s Young Americans Are More Confident, Assertive, Entitled—And More Miserable than Ever Before; Simon and Schuster: New York, NY, USA, 2014. [Google Scholar]
  107. Strauss, W.; Howe, N. Generations: The History of America’s Future, 1584 to 2069, 1st Quill ed.; Quill: New York, NY, USA, 1991; ISBN 978-0-688-11912-6. [Google Scholar]
  108. Woodman, D.; Wyn, J. Youth and Generation: Rethinking Change and Inequality in the Lives of Young People; Sage: Thousand Oaks, CA, USA; London, UK, 2014. [Google Scholar]
  109. Takahashi, T. Japanese youth and mobile media. In Deconstructing Digital Natives; Routledge: New York, NY, USA; London, UK, 2011; pp. 67–82. [Google Scholar]
  110. Thomas, M. Deconstructing Digital Natives: Young People, Technology, and the New Literacies; Routledge: New York, NY, USA; London, UK, 2011; ISBN 978-0-415-88993-3. [Google Scholar]
  111. Guest, G.; MacQueen, K.M.; Namey, E.E. Applied Thematic Analysis; Sage: Los Angeles, CA, USA; London, UK, 2011. [Google Scholar]
  112. Rapp, A.; Marino, A.; Simeoni, R.; Cena, F. An ethnographic study of packaging-free purchasing: Designing an interactive system to support sustainable social practices. Behav. Inf. Technol. 2017, 36, 1193–1217. [Google Scholar] [CrossRef]
  113. Sarzotti, F. A Tangible Personal Informatics System for an Amusing Self-reporting. In Proceedings of the 2015 ACM International Joint Conference on Pervasive and Ubiquitous Computing and Proceedings of the 2015 ACM International Symposium on Wearable Computers, (UbiComp/ISWC 2015), Osaka, Japan, 7–11 September 2015; ACM: New York, NY, USA, 2015; pp. 1033–1038. [Google Scholar]
Figure 1. The system architecture.
Computers 07 00007 g001
Figure 2. System architecture.
Computers 07 00007 g002
Figure 3. The Mood TUI.
Computers 07 00007 g003
Figure 4. Finite state machine describing the TUI behavior.
Computers 07 00007 g004
Figure 5. A modular TUI—front.
Computers 07 00007 g005
Figure 6. A modular TUI—rear.
Computers 07 00007 g006
Figure 7. System composed of eight different TUIs.
Computers 07 00007 g007
Table 1. Participants’ age distribution.
Age Range (years)Participants
14–1715
18–3512
>355
Table 2. Participants distribution.
Age Range (years)GenerationSexNumber of Participants
14–17Gen ZM10
F5
18–35Gen YM9
F3
>35Gen XM1
F4
Table 3. Scheduled sessions.
Age Range (years)Session NumberWeek NumberNumber of ParticipantsParticipants
14–17S1W15U01–U05
S2W25U06–U10
S3W35U11–U15
18–35S4W15U16–U20
S5W27U21–U27
>35S6W35U28–U32
Table 4. Participants’ responses to the questionnaire.
ParticipantQ1Q3Q4Q6.aQ6.bQ6.cQ6.dQ6.eQ6.fQ6.gQ7Q8Q9.aQ9.bSession
U01F144207712570TTS1
U02F1531111<11210TTS1
U03M1533<1<14<1<1120.5FFS1
U04M1540.211<10<1412TTS1
U05M15500,510<10112FFS1
U06M1440.3<122.50.30.5323.5FFS2
U07M1550.50.51.52<1<1320.5TTS2
U08M1430.2133<10.5133FFS2
U09M164001102031FFS2
U10F1551313121103185.5FFS2
U11M16301.510.500.50.532TTS3
U12F163233745752FFS3
U13M154<1<114<10.505<1FFS3
U14M1430.511.51<1<1111TTS3
U15F155215.510.52771TTS3
U16M1842.5231.50.21432TTS4
U17F2252211.50.512.531.5FFS4
U18F2141.512.50.51123.51TTS4
U19M2330.50.5411.52121FFS4
U20F1941321.510.5212TTS4
U21M1831032.5<1<1730TTS5
U22M184<1<12102210FTS5
U23M1832.50230.52330TTS5
U24M19510.51610159100.5FFS5
U25M3254.50111.5110.50.55.50TTS5
U26M1940.50530.51240FFS5
U27M2041031.50.50.52.55.51FFS5
U28F52310.51020.50.510FFS6
U29F4121.500000021FFS6
U30M3642.50.5212.500.510.5FFS6
U31F3730.50.51.502.50.5010.5TTS6
U32F453102120.5030TTS6
Table 5. Participants’ responses to the questionnaire.
ParticipantProfessionQ5.aQ5.bQ5.cQ5.d
U01High School Student1Apple—Iphone 70
U02High School Student1Apple—Iphone 60
U03High School Student1Apple—Iphone 60
U04High School Student1Samsung Galaxy S60
U05High School Student1Apple—Iphone 60
U06High School Student1Samsung Galaxy S60
U07High School Student1Apple—Iphone 6 Plus0
U08High School Student1Samsung Galaxy Core0
U09High School Student1Samsung Galaxy S3 Neo0
U10High School Student1Huawei P8 Lite0
U11High School Student1Wiko Sunset 20
U12High School Student1Samsung Galaxy S5 Mini0
U13High School Student1Apple Iphone 5S0
U14High School Student1Apple Iphone5C0
U15High School Student1Samsung S60
U16High School Student1Oppo Mirror0
U17Undergraduate1LG Spirit0
U18Undergraduate1Apple—Iphone 60
U19Employee1OnePlus 3T0
U20High School Student1Apple—Iphone 60
U21High School Student1Apple—Iphone 50
U22High School Student1Samsung Galaxy S6 Edge+0
U23High School Student1LG K50
U24High School Student1Apple—Iphone 60
U25PhD Student1Samsung Galaxy S50
U26Undergraduate1Apple—Iphone 60
U27Undergraduate1Samsung Galaxy S50
U28Teacher1Galaxy Note 40
U29Teacher0 1Nokia 3310
U30Secretary1Samsung Galaxy S50
U31Teacher0 1Nokia 3510i
U32Secretary1Apple—Iphone 70

