Improved SO2 Tolerance of Cu-SAPO-18 by Ce-Doping in the Selective Catalytic Reduction of NO with NH3


1
Key Laboratory of Beijing on Regional Air Pollution Control, Department of Environmental Science, College of Environmental and Energy Engineering, Beijing University of Technology, Beijing 100124, China
2
Institute of Engineering Technology, SINOPEC Catalyst Company, Beijing 101111, China
3
Beijing Key Laboratory for Green Catalysis and Separation, Key Laboratory of Beijing on Regional Air Pollution Control, Key Laboratory of Advanced Functional Materials, Education Ministry of China, and Laboratory of Catalysis Chemistry and Nanoscience, Department of Chemistry and Chemical Engineering, College of Environmental and Energy Engineering, Beijing University of Technology, Beijing 100124, China
*
Authors to whom correspondence should be addressed.
Catalysts 2020, 10(7), 783; https://doi.org/10.3390/catal10070783
Submission received: 31 May 2020
/
Revised: 11 July 2020
/
Accepted: 12 July 2020
/
Published: 13 July 2020
(This article belongs to the Special Issue DeNOx Systems and VOCs (Volatile Organic Compounds) for Pollution Abatement in Catalysis)
Abstract
:The Ce-Cu-SAPO-18 catalysts were prepared using the ion exchange method. The impact of sulfur dioxide on catalytic performance of Ce-Cu-SAPO-18 for the selective catalytic reduction (SCR) of NO with NH3 was examined. Detailed characterization of the fresh and sulfur-poisoning Cu-SAPO-18 and Ce-Cu-SAPO-18 samples was conducted. XRD and BET results show that SO2 treatment of the Ce-doped Cu-SAPO-18 (Ce-Cu-SAPO-18-S) sample did not induce a remarkable change in structure, as compared with that of the fresh counterpart. According to in situ DRIFT, H2-TPR, SEM, and EDS results, it is found that the sulfation species attached preferentially to the cerium species, rather than the isolated Cu2+ species. In particular, the TG/DSC results confirm that the sulfate species on the Ce-Cu-SAPO-18-S sample was easier to decompose than that on the Cu-SAPO-18-S sample. The catalytic active sites of Ce-Cu-SAPO-18 were less influenced after SO2 treatment, as demonstrated by the TPR and XPS results. All of the above results show that the Ce-Cu-SAPO-18 sample exhibited better sulfur-resistant performance than the Cu-SAPO-18 sample.
1. Introduction
Among air pollutants, NOx in diesel exhaust is harmful to human health. Selective catalytic reduction of NOx with NH3 (NH3-SCR) is a commonly used method in controlling NOx emissions [1,2,3,4], and the key issue is the availability of high-performance catalysts. The Cu-exchanged zeolite (e.g., ZSM-5 [5], SSZ-13 [6], SAPO-34 [7], and SAPO-18 [8,9]) catalysts have been studied intensively and extensively, with the emphasis being putting on the wide temperature ranges with high NOx conversions. The high-temperature hydrothermal conditions (>650 °C) can destroy the zeolitic framework structures and result in catalyst deactivation [10,11]. Additionally, most diesel fuels contain sulfur, and their combustion can give off a large amount of sulfur dioxide. According to previous studies, the catalysts were sulfated to form the sulfate species [12], thus resulting in a decrease in SCR activity [13]. Up to now, the poor resistance to SO2 poisoning of the zeolite-based catalysts still remain a primary problem in commercial applications of the diesel after-treatment systems [14,15].
The Cu-CHA (e.g., Cu-SSZ-13 and Cu-SAPO-34) has a small pore structure and good resistance to hydrothermal ageing treatments, hence attracting more and more attention in removing NOx from exhaust gas [10,11,16]. The structure of an AEI zeolite (e.g., SAPO-18 or SSZ-39) is similar to that of a CHA zeolite, in which there are a double 6-membered ring (D6R) unit linked together by a 4-membered ring (4R) unit and an 8-membered ring (8R) [8]. The SAPO-18 (silicoaluminophosphate) zeolite with an AEI structure is most used as catalyst for the reaction of methanol-to-olefins (MTO) [17,18]. Previously, we reported the activity, hydrothermal stability, and hydrocarbon poisoning resistance of the Cu-SAPO-18 catalysts for the NH3-SCR reaction of NOx [9,19]. Although the Cu-SAPO-18 catalyst performed excellently in the deNOx reaction, its ability to resist SO2 poisoning is still insufficient. Liu et al. [20] briefly studied the SO2 resistance of Cu-SAPO-18 and found that its SO2 resistance was poor. In recent years, modification of copper-exchanged zeolite catalysts has been made for better catalytic performance, hydrothermal stability, and resistance to SO2 poisoning [21,22,23]. It was reported that the second metal doping could promote the anti-sulfur poisoning performance of the SCR catalysts due to the fact that some metal oxides significantly retard the rate of sulfate formation [24,25,26]. CeO2 acts as the role of a membrane attached to the catalyst surface to protect the active center [27], which prevents formation of ammonium sulfate at low temperatures and enhances the stability of the catalyst. In the present work, we selected cerium to decorate the Cu-SAPO-18 by the ion exchange method. The anti-SO2 poisoning role of Cu-SAPO-18 after Ce doping was deeply studied, and the conclusions drawn were beneficial for the development of new SCR catalysts with improved sulfur dioxide resistance.
2. Results and Discussion
2.1. Impact of SO2 Exposure on NH3-SCR Performance
The NO conversions over the Cu-SAPO-18 and Ce-Cu-SAPO-18 samples with different Ce contents were evaluated (Figure S1). Among all of the samples, the Ce-Cu-SAPO-18 sample with a Ce content of 1.24 wt.% shows the widest reaction window and the best catalytic performance. Therefore, this catalyst was selected to study the SO2 resistance. Figure 1 shows the effect of SO2 on the SCR activity of Cu-SAPO-18 and Ce-Cu-SAPO-18 in the range of 100–600 °C. It can be seen that the sulfur resistance of Ce-Cu-SAPO-18 was better than that of Cu-SAPO-18. After pretreatment with sulfur dioxide, the activity of Ce-Cu-SAPO-18 was better than that of Cu-SAPO-18. In particular, NO conversion over the SO2-treated Ce-Cu-SAPO-18 sample was 80% at 250 °C despite a decrease in activity was observed as compared with that over the fresh counterpart, which was still higher than that over the SO2-treated Cu-SAPO-18 sample. In order to further explore their sulfur resistance, we examined the effect of SO2 on SCR activity of Cu-SAPO-18 and Ce-Cu-SAPO-18 at 300 °C (Figure 2). For the Cu-SAPO-18 and Ce-Cu-SAPO-18 samples, the original NO conversions were 89.3 and 93.4%, respectively. When 100 ppm of SO2 was introduced and the NH3-SCR reaction achieved a steady state, the NO conversion decreased from 89.3 to 52.3% over Cu-SAPO-18 after 34 h of reaction, whereas it slightly decreased from 93.4 to 78.1% over Ce-Cu-SAPO-18. Obviously, activity of the latter was much higher than that of the former, and NO conversion was not significantly altered within the subsequent 34 h of reaction over Ce-Cu-SAPO-18. With the removal of SO2, NO conversion over Ce-Cu-SAPO-18 could be quickly recovered to about 82.7%, while that over Cu-SAPO-18 was partially recovered to about 57.7%, suggesting that the Ce-Cu-SAPO-18 sample possessed a better sulfur-resistant ability. It is concluded that the addition of SO2 exerted a negative impact on SCR activity of Cu-SAPO-18 and Ce-Cu-SAPO-18, and the sulfur resistance of the latter was better than that of the former.
2.2. Surface Property
In order to better measure the changes in surface property of the samples before and after SO2 poisoning, the XPS technique was employed and the results are shown in Figure 3, Figure S3 and Table S2. Figure 3 illustrates the Cu 2p3/2 XPS spectra of the samples. The Cu 2p3/2 XPS spectrum of each sample shows two asymmetric signals, which were decomposed into three components at binding energies (BEs) of 932.6–933, 934.6–936.5, and 945.7–947.7 eV, respectively. According to the literature [28,29], the component at BE = 932.6–936.6 eV was assigned to the surface copper (including the isolated Cu2+ and CuO) species. Since the isolated Cu2+ species has a higher BE than the CuO species, the component at BE = 932.6–933.0 eV was attributed to the surface CuO species [28], the main component at BE = 934.6–936.6 eV corresponded to the surface isolated Cu2+ species, and the satellite peak at BE = 945.7–947.7 eV indicates the presence of the surface Cu2+ species [28].
In order to better understand the change of the surface Cu2+ species, the Cu2+/Cusurf molar ratios on the samples were calculated. The surface Cu2+/Cusurf molar ratio decreased in the sequence of Ce-Cu-SAPO-18 (0.336) > Ce-Cu-SAPO-18-S (0.201) > Cu-SAPO-18 (0.121) > Cu-SAPO-18-S (0.088). The surface Cu2+/Cusurf molar ratio of Cu-SAPO-18 increased from 0.121 to 0.336 after the doping of Ce. Thus, introduction of Ce promoted formation of the surface isolated Cu2+ species. Apparently, SO2 poisoning brought about a decrease in content of the surface isolated Cu2+ species. The amount of the surface isolated Cu2+ species on Ce-Cu-SAPO-18-S was more than that on Cu-SAPO-18-S. It can be concluded that sulfur resistance of the samples after Ce doping was enhanced.
It should be noted that, due to the lower Cu+ contents in the samples or the lower detection sensitivity of the XPS technique, the signals due to the surface Cu+ species were not recorded in the XPS spectra of the samples [30]. Additionally, for the Cu-zeolite catalysts, the isolated Cu2+ ions were recognized as the active sites for the NH3-SCR reaction, and the Cu+ ions did not exert a significant effect on this reaction. Therefore, we paid more attention to the content of the Cu2+ ions, other than to the content of the Cu+ ions. However, using the Auger spectra would be a good method to determine the presence of the Cu+ species [31].
Figure S3 illustrates the S 2p XPS spectra of the sulfated samples. The S 2p XPS spectrum of Cu-SAPO-18-S or Ce-Cu-SAPO-18-S could be decomposed into two components at BE = 168.4 and 170.2 eV. assignable to SO32- and SO42- species [32]. However, it cannot be distinguished among CuSO4, Ce2(SO4)3, SO32-, or (NH4)2SO4 and other sulfated species. It should be noticed that the Ce-Cu-SAPO-18-S sample showed the lower band strength, as compared with the Cu-SAPO-18-S sample. The results indicate that sulfation of the sample during the NH3-SCR reaction process produced only a small amount of sulfate species on the sample surface, which was consistent with the results of in situ DRIFTS characterization.
2.3. Morphology
It is generally believed that sulfate species are formed on the surface of the supported metal oxide catalysts after sulfur poisoning. SO2 treatment of the Cu-SAPO-18 and Ce-Cu-SAPO-18 samples could cause metal sulfates to be generated on their surface. The decomposition temperatures of copper sulfate were in the range of 600–650 °C [33], whereas those of cerium sulfate were above 700 °C [34]. In order to distinguish copper sulfate from cerium sulfate, the Cu-SAPO-18-S and Ce-Cu-SAPO-18-S samples were calcined in air at a ramp of 10 °C/min from RT to 650 and 950 °C and kept at this temperature for 1 h, the as-obtained samples were labeled as Cu-SAPO-18-S-650, Ce-Cu-SAPO-18-S-650, Cu-SAPO-18-S-950, and Ce-Cu-SAPO-18-S-950, respectively. It can be seen that morphologies of all of the samples remained unchanged from SEM images and EDS patterns (Figures S4–S6). However, the dispersion of S was different in these samples. The S content in the Cu-SAPO-18-S sample was 0.65 wt.%, which was attributed to the sulfur in copper sulfate; the S content in the Ce-Cu-SAPO-18 sample was 0.71 wt.%, which was assigned to the sulfur in copper sulfate and cerium sulfate (Figure S4); the S content in the Cu-SAPO-18-S-650 sample was 0.1 wt.%, which might be due to decomposition of copper sulfate to SO2; however, the content of S in the Ce-Cu-SAPO-18-S-650 sample was 0.45 wt.%, obviously higher than that in the Cu-SAPO-18-S-650 sample (Figure S5). In order to further determine the attribution of sulfate species, the Cu-SAPO-18-S and Ce-Cu-SAPO-18-S samples were treated at 950 °C (Figure S6). It can be seen from the EDS analysis that the sulfates in the Cu-SAPO-18-S and Ce-Cu-SAPO-18-S samples were basically decomposed after treatment at 950 °C. Although the Ce-Cu-SAPO-18-S sample still contained a large amount of S after calcination at 650 °C, the S species in the sample were completely decomposed after calcination at 950 °C. After calculation, we can realize that the content of S attributed to copper sulfate in the Ce-Cu-SAPO-18-S sample was 0.26 wt.%, whereas the other part of S (0.45 wt.%) was from cerium sulfate. The EDS data correlated with the revealed fact that the S species could attach preferentially to the cerium species rather than the copper species in the Ce-Cu-SAPO-18 sample, which was consistent with the subsequent H2-TPR results.
2.4. Reducibility
Figure 4 shows the H2-TPR profiles of the fresh and sulfated samples. For all of the samples except Ce-SAPO-18, the peak at below 420 °C (yellow region) was the reduction of Cu (isolated Cu2+ and CuO) species [28]. For the Cu-SAPO-18 and Ce-Cu-SAPO-18 samples, the peaks at 814 °C were attributed to the reduction of Cu+ species [28,35]. For the Ce-SAPO-18 sample, the peak at 637 °C was ascribed to the reduction of Ce (CeO2) species [36]. Compared with the Ce-SAPO-18 sample, however, the reduction peak at 620 °C of CeO2 in the Ce-Cu-SAPO-18 sample shifted to a lower temperature by 17 °C (637 °C → 620 °C), indicating that the co-presence of Cu and Ce in SAPO-18 could modify the reducibility.
Reducibility of the sulfated samples (Cu-SAPO-18-S and Ce-Cu-SAPO-18-S) was also measured by the H2-TPR technique, as illustrated in Figure 4. Compared with their fresh counterparts, the sulfated samples show strong reduction peaks in the range of 550–700 °C, which might be attributed to the reduction of sulfate species [36]. The subsequent S 2p XPS results demonstrate that sulfated species existed in the Cu-SAPO-18-S and Ce-Cu-SAPO-18-S samples. Therefore, it can be inferred that the stronger reduction peaks (550–700 °C) of the sulfated samples were mainly due to the reduction of metal sulfate species. The reduction peak appeared at 686 °C on the Cu-SAPO-18 sample, which was attributed to the reduction of copper sulfate species. For Ce-Cu-SAPO-18-S sample, a new reduction peak appeared at 567 °C, besides the reduction peak at 686 °C, which was ascribed to the reduction of cerium sulfate species. It can be seen that the intensity of the peak at 567 °C is higher than that of the peak at 686 °C, which also shows that the amount of cerium sulfate species on Ce-Cu-SAPO-18-S sample are significantly higher than that of copper sulfate species. It is apparent that the shift in reduction temperature towards a lower temperature was a result due to ceria addition. The introduction of cerium weakens the interaction between copper species and sulfate species in Ce-Cu-SAPO-18-S samples. Although sulfate species with reducibility can be produced in sulfur dioxide poisoned samples, the reducibility of these sulfate species will not have a positive impact on the catalytic activity. In addition, compared with the reduction of Cu-SAPO-18-S and Ce-SAPO-18-S below 500 °C, the change of hydrogen consumption of Ce-Cu-SAPO-18-S (0.175 mmol/g) is significantly larger than that of Cu-SAPO-18-S (0.161 mmol/g) (Table S3). The results of H2-TPR also confirm that cerium doping enhances the anti-sulfur dioxide poisoning ability of the catalyst.
2.5. Adsorption of NH3 by the Sulfated and Fresh Samples
The DRIFTS spectra of NH3 adsorption on the fresh Cu-SAPO-18 samples are shown in Figure 5. When NH3 adsorption reached saturation, three bands at 1629, 1325, and 1217 cm−1 (Lewis acid centers) and two bands at 1461 and 3400–3000 cm−1 (Brönsted acid centers) were detected. The bands at 1325 and 1217 cm−1 were due to the symmetric deformation of NH3 coordination with the Lewis acid centers [37], the band at 1629 cm−1 was due to NH3 coordination at the Lewis acid sites, and the weak band at 1461 cm−1 was the symmetric and asymmetric bending vibrations of the NH4+ species at the Brønsted acid sites [38]. Furthermore, NH3 adsorption at 3000 to 3400 cm−1 was attributed to the combination of coordinated NH3 and NH4+ on Brőnsted acid centers [39]. Figure 5B shows the DRIFTS spectra of NH3 adsorption on the Cu-SAPO-18-S sample. The initial band at 1629 cm−1 ascribed to the coordinated NH3 on the Lewis acid sites was sharply weakened, while the band at 1467 cm−1 due to NH4+ species bound to the Brønsted acid sites could be still observed on the Cu-SAPO-18-S sample, and the band at 1461 cm−1 was significantly enhanced in intensity. These results indicate that the sulfate species formed on the surface of Cu-SAPO-18 generated a new Brønsted acid center, but significantly reduced the amount of the Lewis acid sites in the sample. The decrease in amount of the Lewis sites might be due to the sulfation of some active Cu2+ species that produced the Lewis sites. For the Cu-SAPO-18-S sample, however, the reaction of ammonium species formed by NH3 adsorption at the Brønsted acid sites with the adsorbed nitrite, nitrate, or NO2 was strongly inhibited in a low-temperature range [40]. Therefore, it can be inferred that the Brønsted acidity generated after SO2 adsorption inhibited the SCR activity of the sample at low temperatures.
In situ DRIFTS spectra of NH3 adsorption on the fresh Ce-Cu-SAPO-18 and Ce-Cu-SAPO-18-S samples are shown in Figure 6. The peaks at 3400 ~ 3000, 1629, 1461, 1325, and 1217 cm−1 (that were recorded in the fresh Cu-SAPO-18 sample) could be also observed in the DRIFTS spectra of the fresh Ce-Cu-SAPO-18 sample. The adsorption of the combination of coordinated NH3 and NH4+ species on the Brønsted acid sites was also significantly enhanced on the Ce-Cu-SAPO-18-S sample. For the Cu-SAPO-18-S and Ce-Cu-SAPO-18-S samples, however, there was a considerable difference in the Lewis acid sites. The NH3 coordination bands at 1629 and 1217 cm−1 attributed to the Lewis acid sites still existed on the Ce-Cu-SAPO-18-S sample. An important reason for this disparity is that the Ce doping inhibited sulfation of the isolated Cu2+ species, which could produce the Lewis sites.
2.6. Competitive Adsorption between SO2 and NO on the Sample Surface
As demonstrated above, sulfation of the sample affected the adsorption of NH3, which led to formation of ammonium sulfate on the sample surface. Since both SO2 and NO are acid gases, SO2 and NO can be competitively adsorbed on the same active sites of a sample. Therefore, it is necessary to investigate the competitive adsorption of SO2 and NO on the samples.
Figure 7 shows the DRIFTS spectra of the Cu-SAPO-18 sample that was exposed first to 500 ppm NO in the presence of oxygen at 150 °C and then to 100 ppm SO2. When the sample surface was saturated by the adsorption of NO + O2, the bands at 1629 and 1575 cm−1 were observed on the in situ DRIFTS spectrum of the Cu-SAPO-18 sample, in which the band at 1629 cm−1 was assigned to the adsorbed bidentate nitrate species [41], whereas the one at 1575 cm−1 was attributed to the bridging nitrate species [34]. When SO2 was introduced to the system, the characteristic band at 1575 cm−1 attributed to the nitrate species at the copper sites disappeared with time extension, and the characteristic bands at 1644 cm−1 due to the adsorption of SO2 on the hydroxyl groups [26] and at 1375 cm−1 assigned to weak adsorption of sulfate species [42] increased in intensity. The new band at 1325 cm−1 attributed to the adsorbed bidentate sulfate appeared on the Cu-SAPO-18 sample [43]. The results show that there was a competitive adsorption of SO2 and NO on the two samples, and the adsorption capacity of SO2 was significantly higher than that of NO. As shown in Figure 8, when NO was adsorbed on the Ce-Cu-SAPO-18 surface for 30 min, the peaks that were the same as those recorded on the Cu-SAPO-18 sample were observed. When SO2 was introduced to the system, the original bands at 1629 and 1575 cm−1 rapidly decreased in intensity with time extension, and two new weak bands at 1644 cm−1 (SO2−OH group) and 1375 cm−1 (bidentate sulfate) appeared on the Ce-Cu-SAPO-18 sample. After introduction of SO2 for 60 min, the original nitrate species still existed although its band intensity was weak on the Ce-Cu-SAPO-18 sample, and the intensity of the new bands at 1644 and 1375 cm−1 was lower than that of the corresponding bands recorded on the Cu-SAPO-18 sample. This result indicates that Ce doping could effectively inhibit SO2 adsorption on the sample surface.
Figure 9 shows the DRIFTS spectra of the Cu-SAPO-18 sample that were exposed first to 100 ppm SO2 at 150 °C and then to 500 ppm NO in the presence of oxygen. When the sample surface was saturated by the adsorption of SO2 at 150 °C, the bands at 1644, 1509, and 1375 cm-1 were observed on the in situ DRIFTS spectrum of the Cu-SAPO-18 sample, in which the band at 1644 cm−1 was assigned to the SO2-OH group species [26], whereas the others bands at 1509 cm−1 and 1375 cm-1 was attributed to the SO32- species and bidentate sulfate species [42], respectively. The intensities of these peaks increase with the increasing time on stream. When NO+O2 was introduced to the system, the sulfate adsorption species existed all the time, which indicated that the adsorption of sulfate species on the catalyst surface was relatively stable, which may be one of the reasons for the irreversible poisoning and deactivation of Cu-SAPO-18 catalyst caused by SO2. The new absorption bands at 1629, and 1575 cm-1, after NO + O2 introduction, are attributed to nitrate species. As shown in Figure 10, when SO2 was adsorbed on the Ce-Cu-SAPO-18 surface for 60 min, intensity of the bands at 1644, 1509, and 1375 cm−1 attributable to the sulfate species was significantly weaker than that on the Cu-SAPO-18 sample, indicating that the addition of Ce inhibited adsorption of the sulfate species on the sample surface. After NO+ O2 was introduced on the Ce-Cu-SAPO-18 catalyst, the adsorption peak of nitrate species increased rapidly, which indicated that the addition of Ce not only inhibited the adsorption of sulfate, but also promoted the adsorption of NO species after SO2 adsorption.
2.7. Thermal Stability of Surface Species during the NH3-SCR Reaction Process
In order to further understand the SCR reaction behaviors in the presence of SO2, sulfur resistance of the Cu-SAPO-18 and Ce-Cu-SAPO-18 samples when NO, NH3, SO2, and O2 were simultaneously introduced in the reaction system was studied by the in situ DRIFTS technique.
When the Cu-SAPO-18 surface was saturated by adsorption of NO, NH3, SO2, and O2, the bands at 3328, 3284, 3187, 1629, 1495, 1287, and 1217 cm−1 were recorded, as shown in Figure 11. The bands at 1629 and 1217 cm−1 were due to the coordinated NH3 at the Lewis acid sites, and the band at 1495 cm−1 were due to the NH4+ species (symmetric and asymmetric bending vibrations) at the Brønsted acid sites, which were related to formation of sulfates [44]. In additional, the band at 1287 cm-1 was attributed to the adsorption of sulfate species [26].
The sample was then purged with N2 instead of a mixture of NO, NH3, SO2, O2, and N2, and the temperature was increased from 150 to 400 °C. For the Cu-SAPO-18 sample, the bands at 1621 and 3400–3000 cm−1 almost disappeared at above 250 °C, and the other bands at 1495, 1287, and 1217 cm−1 decreased in intensity with a rise in temperature, but they were still seen at 400 °C. For the Ce-Cu-SAPO-18 sample, all of the bands rapidly decreased in intensity with a rise in temperature and entirely disappeared at 400 °C. This result indicates that such sulfate species on the Ce-Cu-SAPO-18 sample could more readily decompose than those on the Cu-SAPO-18 sample. The presence of NH4HSO4 and/or (NH4)2SO4 and sulfation in the NH3-SCR reaction resulted in deactivation of the sample at low temperatures. It is also proven that sulfur resistance of the Ce-Cu-SAPO-18 sample was better than that of the Cu-SAPO-18 sample.
To confirm the above conclusion, the TG/DSC technique was used to evaluate sulfur resistance of the Cu-SAPO-18 and Ce-Cu-SAPO-18 samples. The fresh samples were treated in a mixture flow (300 mL/min) of 500 ppm NO + 500 ppm NH3 + 100 ppm SO2 + 14 vol.% O2 + N2 (balance) at 250 °C for 10 h, and the obtained samples were labeled as Cu-SAPO-18-SN and Ce-SAPO-18-SN, respectively. The TG curves of the pretreated Cu-SAPO-18-SN and Ce-Cu-SAPO-18-SN samples in a N2 atmosphere were quite different. Since the treatment atmosphere contained NH3 and SO2, it can be deduced that (NH4)2SO4 and NH4HSO4 existed in the Cu-SAPO-18-SN and Ce-SAPO-18-SN samples. As shown in Figure S7A, there were three weight losses in the TG curve and three corresponding peaks (the first one emerged at approximately 120 °C) in the DSC curve of the Cu-SAPO-18-SN sample. These weight losses were attributed to evaporation of water in the samples. The second peak appeared at 236 °C, which was due to decomposition of (NH4)2SO4 [26], and the third peak at 356 °C was attributed to decomposition of NH4HSO4 [26]. For the Ce-Cu-SAPO-18-SN sample, there were also three peaks in the TG/DSC curve (Figure S7B); however, temperatures of the peaks due to (NH4)2SO4 and NH4HSO4 decomposition were lower than those of the Cu-SAPO-18 sample. Such phenomena indicate that the sulfate species could more readily decompose on the Ce-Cu-SAPO-18-SN sample than on the Cu-SAPO-18-SN sample, which was consistent with the in situ DIRFTS characterization results.
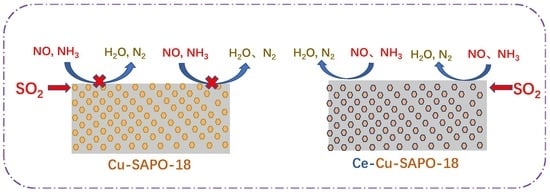
2.8. Possible Mechanism for Improved SO2 Resistance of Cu-SAPO-18 by Ce Doping
The possible mechanisms of improved NOx reduction in the absence and presence of SO2 over the Cu-SAPO-18 and Ce-Cu-SAPO-18 samples are provided in Scheme 1. The isolated Cu2+ with a positive charge could form the Lewis acid on the sample surface, which was easy to combine with SO2 in the gas phase, and translated into the sulfates and/or sulfites in the presence of gas-phase oxygen molecules [14]. It has been reported that conversion of SO2 to SO3 could result in a much higher reaction rate over the copper-containing catalysts [41]. Since Cu2+ species in the cage of Cu-SAPO-18 exist in an isolated environment, they could interact with the sulfate and/or sulfite species to form cupric sulfates and/or sulfites at the original positions of the catalyst. The above in situ DRIFTS and TG/DSC characterization results reveal that the Ce-zeolite sample exhibited a better SO2 resistance than the Ce-free (Cu-SAPO-18) sample. The formation rate of bulk sulfate or sulfite was much higher in the Ce-catalysis sample than in the Ce-free sample [26]. Cerium can act as a SO2 trap to limit sulfation of the main active phase (i.e., isolated Cu2+). The sulfation species attach preferentially to the cerium species in the Ce-Cu-SAPO-18 sample. The Lewis acid sites could be mainly created by the exchanged Cu2+ ions in the Cu-zeolite catalysts at lower temperatures [28]. After addition of SO2, the isolated Cu2+ could interact with the sulfate or sulfite species to generate cupric sulfates or sulfites, causing amount of the Lewis acid sites to decrease. In the Ce-Cu-SAPO-18 sample, however, the SO3 and sulfated species were attached preferentially to cerium species (rather than to the isolated Cu2+ species), which was confirmed by the H2-TPR and XPS results.
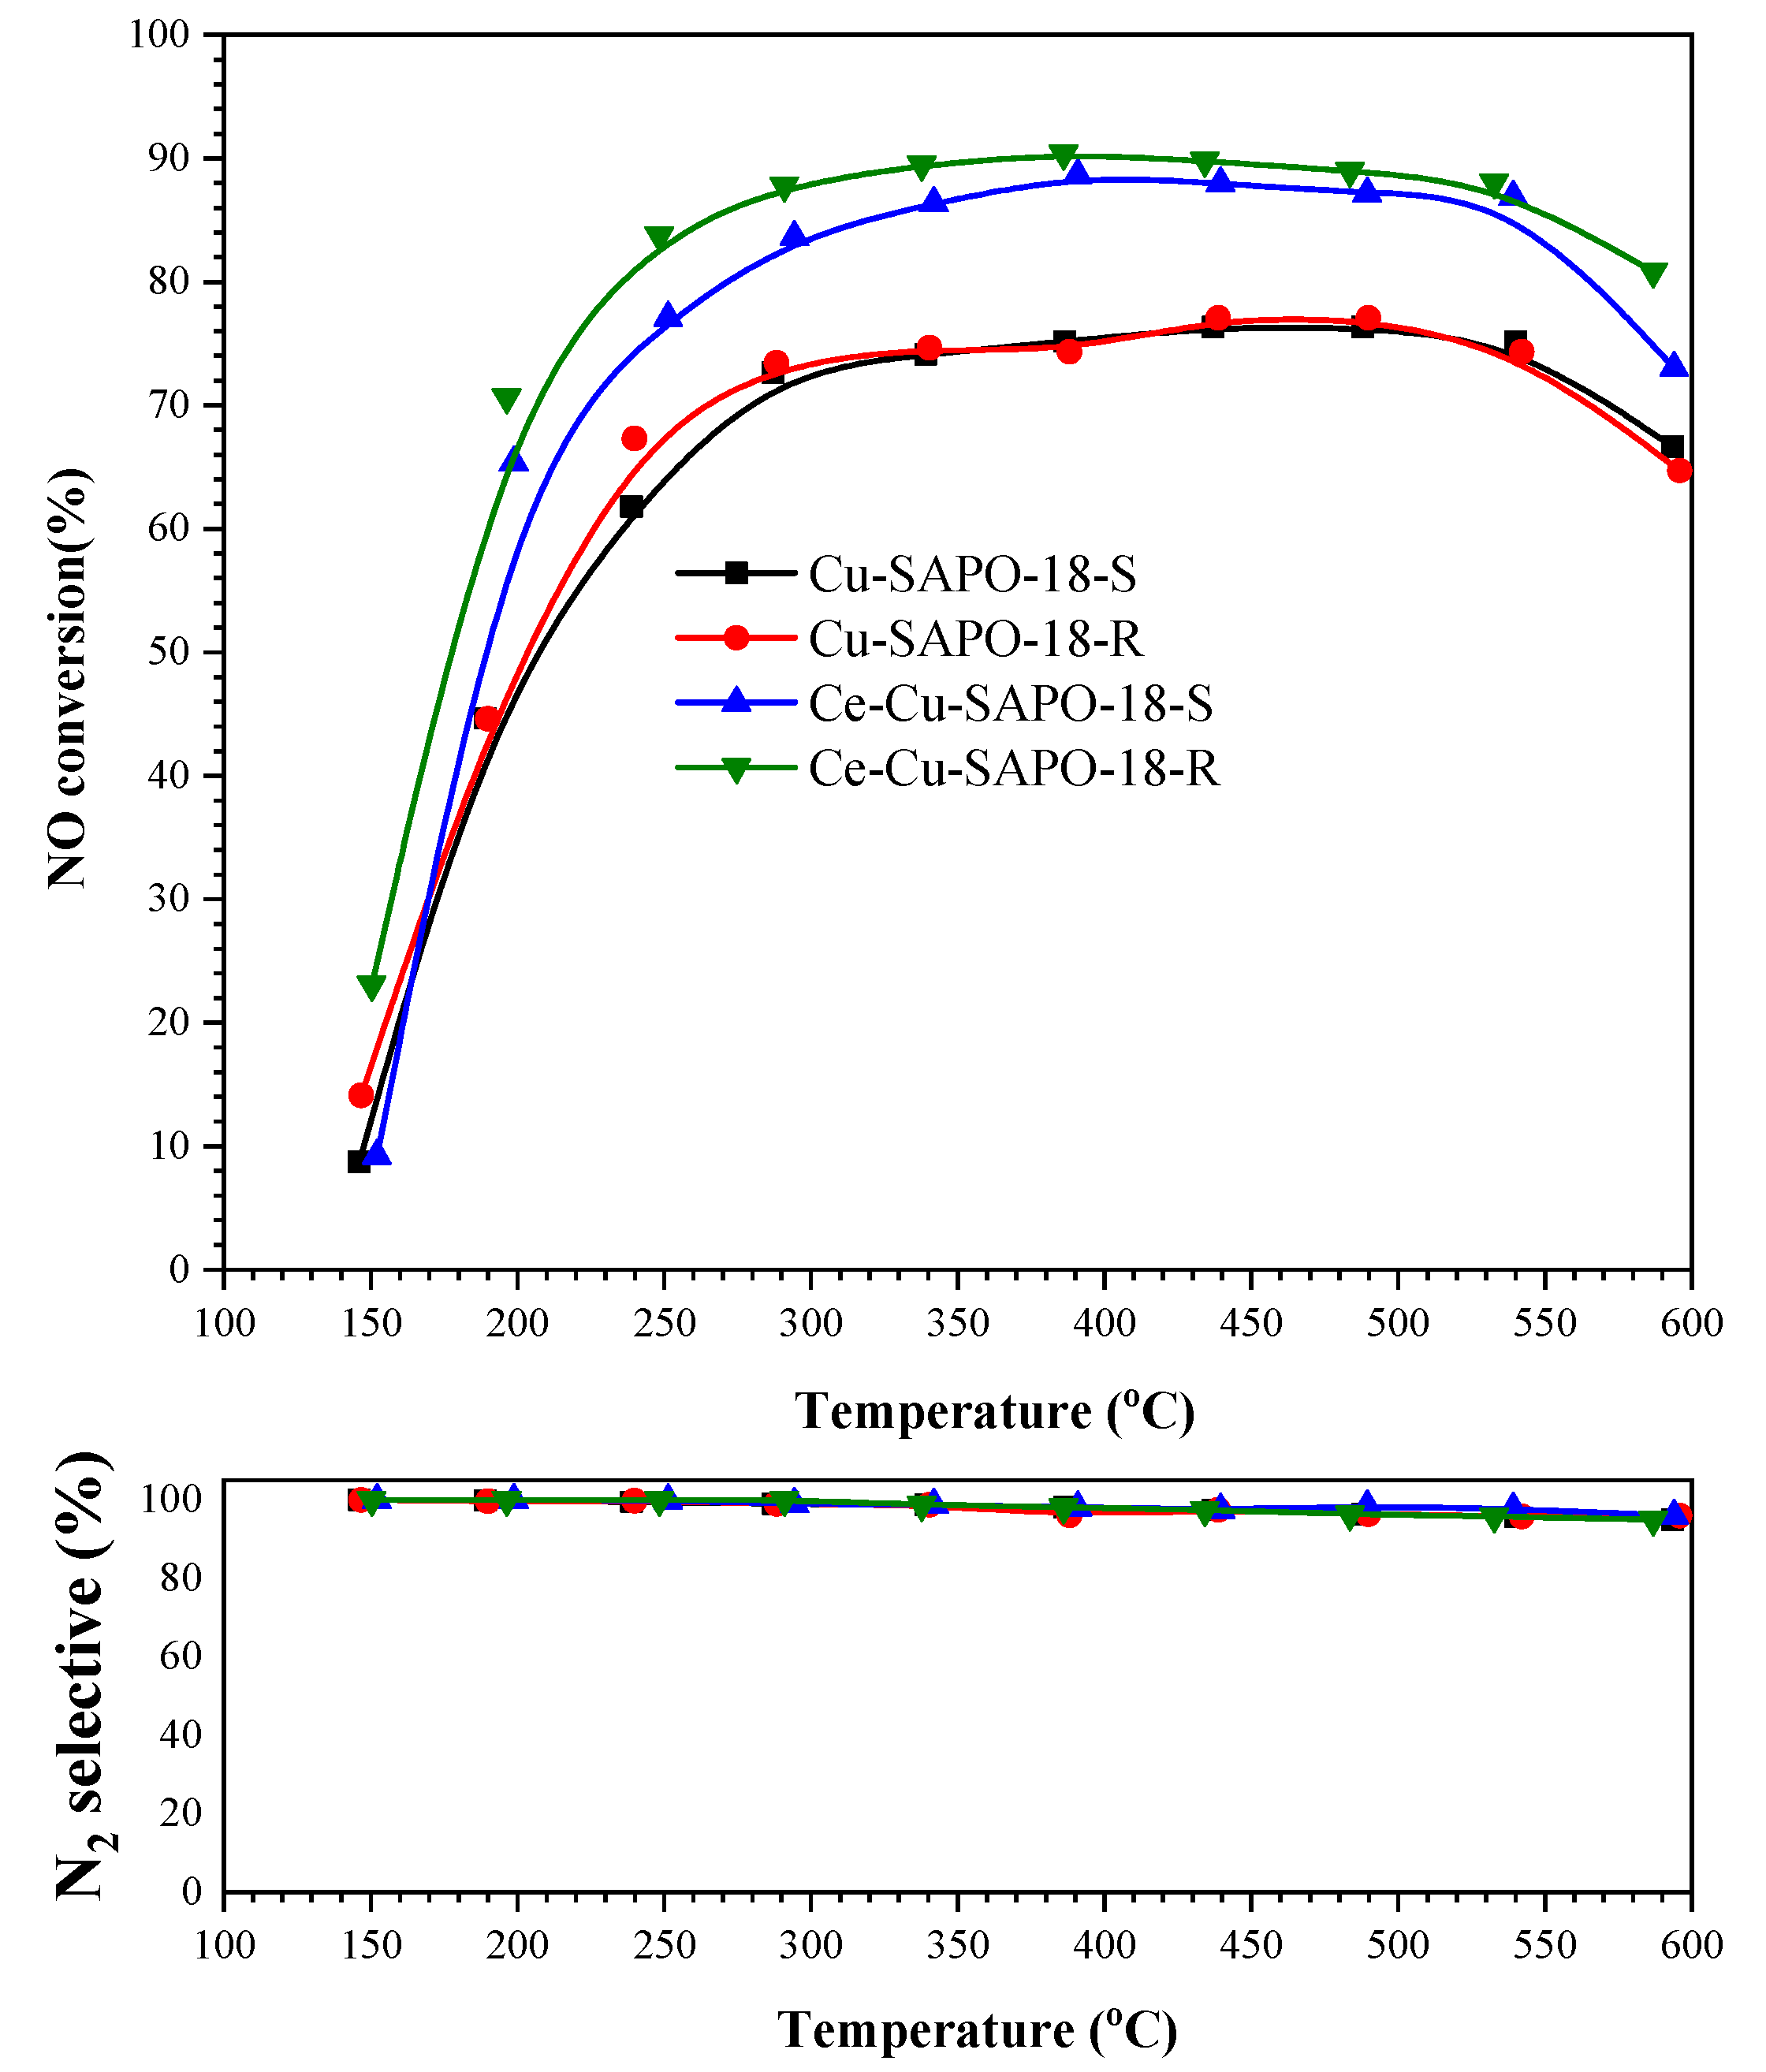
Therefore, the formed cupric sulfates or sulfites were reduced and the Lewis acid sites (the isolated Cu2+) were retained to some degree, since sulfation would normally induce the Brønsted acid sites and inhibit the Lewis acid sites. As pointed out in one of our previous works [28], adsorption and activation of the Lewis acid sites created by the exchanged Cu2+ ions were considered the key step for the low-temperature NH3-SCR reaction. Additionally, the Brønsted acid sites contributed a little to SCR performance in the presence of SO2 at low temperatures. This is one of important reasons why cerium addition could remarkably improve SO2 tolerance of the Ce-Cu-SAPO-18 sample for the NH3-SCR reaction. From Figure 12, one can see that the NH3-SCR activity over Ce-Cu-SAPO-18 was almost fully recovered after the removal of SO2; however, the NH3-SCR activity of Cu-SAPO-18 could not be fully recovered. These results can be further explained as follows: formation of cupric sulfates or sulfites was greatly inhibited after Ce doping; moreover, since a more amount of sulfate or sulfite species was stored in ceria, less amount of ammonium sulfate species was generated to cover the surface active Cu2+ of the Ce-Cu-SAPO-18 sample during the SCR process. Therefore, the activity of Ce-Cu-SAPO-18 was less influenced after the sulfated treatment. All of the above results demonstrate that the doping of Ce could effectively inhibit formation of the cupric sulfate or sulfite species, giving rise to enhancement in sulfur resistance of the Ce-Cu-SAPO-18 sample.
3. Materials and Methods
Details of the preparation of SAPO-18 and NH4-SAPO-18 can be found in previous studies [19].
In addition, 1.0 g of SAPO-18 was dispersed in 60 mL of NH4Cl aqueous solution (0.1 mol/L) at 75 °C for 6 h under stirring. The solution was in turn filtered, washed with deionized water (until no Cl− ions were detected), and dried at 120 °C for 12 h, obtaining the NH4-SAPO-18. Afterwards, 1.0 g of NH4-SAPO-18 was ion-exchanged with 29 mL of Cu(NO3)2 aqueous solution (0.05 mol/L) and/or 29 mL of Ce(NO3)3 aqueous solution (0.0075 mol/L) under stirring at 60 °C for 4 h. Then, the obtained product was filtered and washed several times with deionized water, dried in an oven at 120 °C for 12 h, and calcined in an air flow of 40 mL/min at 500 °C for 6 h, thus obtaining the Cu-SAPO-18 and Ce-Cu-SAPO-18 samples. The X-ray fluorescence (XRF) spectroscopic results reveal that the Cu contents in all of the samples were 1.7 ± 0.2 wt.%, and the Ce contents in the Ce-Cu-SAPO-18 samples were 1.24 wt.%, respectively.
The fresh samples were treated in a mixture flow (300 mL/min) of 500 ppm NO + 500 ppm NH3 + 100 ppm SO2 + 14 vol.% O2 + N2 (balance) at 250 °C for 10 h, and the obtained samples were labeled as Cu-SAPO-18-S and Ce-SAPO-18-S, respectively.
The detailed test instruments, reaction conditions, calculation formulas, and reagent sources are displayed in the Supporting Information (SI).
4. Conclusions
The Cu-SAPO-18 and Ce-Cu-SAPO-18 samples were prepared by the ion-exchanged method. The results show that introduction of Ce to Cu-SAPO-18 could markedly increase its sulfur resistance performance. The addition of Ce had a positive effect on delaying the catalyst deactivation in the presence of SO2. Furthermore, XRD and BET results show that the sulfur treatment did not induce a remarkable change in structure of Ce-Cu-SAPO-18, as compared with its fresh counterpart. The catalytically active components of Ce-Cu-SAPO-18 were less affected after the sulfur treatment, as confirmed by the TPR and XPS results. The Ce-Cu-SAPO-18 sample exhibited better sulfur resistance than the Cu-SAPO-18 sample. According to the in-situ DRIFTS characterization results, we believe that the sulfated species were attached preferentially to the cerium species (rather than to the isolated Cu2+ species). In particular, the TG/DSC results confirm that the sulfate species on the Ce-Cu-SAPO-18-S sample could decompose more readily than those on the Cu-SAPO-18-S sample. In other words, the doping of Ce could effectively inhibit formation of the cupric sulfate or sulfite species, giving rise to enhancement in sulfur resistance of the Ce-Cu-SAPO-18 sample. Therefore, it is concluded that the addition of Ce could improve the sulfur resistance performance of Cu-SAPO-18.
Supplementary Materials
The following are available online at https://www.mdpi.com/2073-4344/10/7/783/s1, Catalyst preparation procedures, catalyst characterization, catalytic evaluation, discussion, Figure S1: NO conversion and N2 selectivity as a function of temperature for the NH3−SCR reaction over the Ce-Cu-SAPO-18 samples with different Ce contents at a GHSV of 130,000 h−1. The reactant feed composition: 500 ppm NO, 500 ppm NH3, 14 vol.% O2, 5 vol.% H2O, and N2 (balance), Figure S2. XRD patterns of the Cu-SAPO-18, Cu-SAPO-18-S, Ce-Cu-SAPO-18, and Ce-Cu-SAPO-18-S samples, Figure S3. S2p XPS spectra of the sulfated samples, Figure S4. SEM images and EDS mappings of (A) Cu-SAPO-18-S and (B) Cu-SAPO-18-S-650, Figure S5: SEM images and EDS mappings of (A) Ce-Cu-SAPO-18-S and (B) Ce-Cu-SAPO-18-S-650, Figure S6: SEM images and EDS mappings of (A) Cu-SAPO-18-S-950 and (B) Ce-Cu-SAPO-18-S-950, Figure S7: TG and DSC curves of NH4HSO4 deposited on (A) Cu-SAPO-18-SN and (B) Ce-Cu-SAPO-18-SN, Table S1: Chemical compositions and textural properties of the Cu-SAPO-18, Ce-Cu-SAPO-18 samples, Table S2: Surface element compositions of the samples obtained from the XPS spectra, Table S3: H2 consumption of the samples obtained from the H2-TPR profiles.
Author Contributions
Conceptualization, Q.Y.; Methodology, S.H. and Q.G.; Software, S.H. and Q.G.; Investigation, S.H.; Resources, Q.Y.; Data Curation, Q.G.; Writing—Original Draft Preparation, S.H.; Writing—Review and Editing, H.D.; Visualization, S.H. and Q.G.; Supervision, Q.Y. and H.D.; Project Administration, Q.Y.; Funding Acquisition, Q.Y. All authors have read and agreed to the published version of the manuscript.
Funding
This work was supported by the National Natural Science Foundation of China (21277008 and 20777005), the National Key Research and Development Program of China (2017YFC0209905), and the Natural Science Foundation of Beijing (8082008).
Acknowledgments
We thank Ralph T. Yang (University of Michigan) for his helpful discussion and encouragement.
Conflicts of Interest
The authors declare no conflict of interest.
References
- Hammershøi, P.S.; Jangjou, Y.; Epling, W.S.; Jensen, A.D.; Janssens, T.V.W. Reversible and irreversible deactivation of Cu-CHA NH3-SCR catalysts by SO2 and SO3. Appl. Catal. B-Environ. 2018, 226, 38–45. [Google Scholar] [CrossRef] [Green Version]
- Deka, U.; Juhin, A.; Eilertsen, E.A.; Emerich, H.; Green, M.A.; Korhonen, S.T.; Weckhuysen, B.M.; Beale, A.M. Confirmation of isolated cu2+ ions in SSZ-13 zeolite as active sites in NH3 selective catalytic reduction. J. Phys. Chem. C 2012, 116, 4809–4818. [Google Scholar] [CrossRef]
- Giordanino, F.; Vennestrøm, P.N.R.; Lundegaard, L.F.; Stappen, F.N.; Mossin, S.; Beato, P.; Bordiga, S.; Lamberti, C. Characterization of Cu-exchanged SSZ-13: A comparative FTIR, UV-Vis, and EPR study with Cu-ZSM-5 and Cu-β with similar Si/Al and Cu/Al ratios. Dalton Trans. 2013, 42, 12741. [Google Scholar] [CrossRef] [PubMed]
- Lomachenko, K.A.; Borfecchia, E.; Negri, C.; Berlier, G.; Lamberti, C.; Beato, P.; Falsig, H.; Bordiga, S. The Cu-CHA deNOx Catalyst in Action: Temperature-Dependent NH3-Assisted Selective Catalytic Reduction Monitored by Operando XAS and XES. J. Am. Chem. Soc. 2016, 138, 12025–12028. [Google Scholar] [CrossRef]
- Góra-Marek, K.; Brylewska, K.; Tarach, K.A.; Rutkowska, M.; Jabłońska, M.; Choi, M.; Chmielarz, L. IR studies of Fe modified ZSM-5 zeolites of diverse mesopore topologies in the terms of their catalytic performance in NH3 -SCR and NH3 -SCO processes. Appl. Catal. B-Environ. 2015, 179, 589–598. [Google Scholar] [CrossRef]
- Chen, B.; Xu, R.; Zhang, R.; Liu, N. Economical Way to Synthesize SSZ-13 with Abundant Ion-Exchanged Cu+ for an Extraordinary Performance in Selective Catalytic Reduction (SCR) of NOx by Ammonia. Environ. Sci. Technol. 2014, 48, 13909–13916. [Google Scholar] [CrossRef]
- Yu, T.; Hao, T.; Fan, D.; Wang, J.; Shen, M.; Li, W. Recent NH3 -SCR Mechanism Research over Cu/SAPO-34 Catalyst. J. Phys. Chem. C 2014, 118, 6565–6575. [Google Scholar] [CrossRef]
- Li, Y.; Deng, J.; Song, W.; Liu, J.; Zhao, Z.; Gao, M.; Wei, Y.; Zhao, L. Nature of cu species in Cu-SAPO-18 catalyst for NH3-SCR: Combination of experiments and DFT calculations. J. Phys. Chem. C 2016, 120, 14669–14680. [Google Scholar] [CrossRef]
- Ye, Q.; Wang, L.; Yang, R.T. Activity, propene poisoning resistance and hydrothermal stability of copper exchanged chabazite-like zeolite catalysts for SCR of NO with ammonia in comparison to Cu/ZSM-5. Appl. Catal. A Gen. 2012, 427–428, 24–34. [Google Scholar] [CrossRef]
- Wang, D.; Jangjou, Y.; Liu, Y.; Sharma, M.K.; Luo, J.; Li, J.; Kamasamudram, K.; Epling, W.S. A comparison of hydrothermal aging effects on NH3-SCR of NOx over Cu-SSZ-13 and Cu-SAPO-34 catalysts. Appl. Catal. B-Environ. 2015, 165, 438–445. [Google Scholar] [CrossRef]
- Ma, L.; Cheng, Y.; Cavataio, G.; McCabe, R.W.; Fu, L.; Li, J. Characterization of commercial Cu-SSZ-13 and Cu-SAPO-34 catalysts with hydrothermal treatment for NH3-SCR of NOx in diesel exhaust. Chem. Eng. J. 2013, 225, 323–330. [Google Scholar] [CrossRef]
- Zhang, N.; He, H.; Wang, D.; Li, Y. Challenges and Opportunities for Manganese Oxides in Low-temperature Selective Catalytic Reduction of NOx with NH3: H2O Resistance Ability. J. Solid State Chem. 2020, 289, 121464. [Google Scholar] [CrossRef]
- Shi, Y.; Tan, S.; Li, S.; Zhao, J.; Xia, Y.; Lv, B.; Li, W. Inhibitory effect of SO2 on side reactions of NH3-SCR over olivine. Catal. Sci. Technol. 2015, 5, 3613–3623. [Google Scholar] [CrossRef]
- Shen, M.; Wen, H.; Hao, T.; Yu, T.; Fan, D.; Wang, J.; Li, W.; Wang, J. Deactivation mechanism of SO2 on Cu/SAPO-34 NH3-SCR catalysts: Structure and active Cu2+. Catal. Sci. Technol. 2015, 5, 1741–1749. [Google Scholar] [CrossRef]
- Chang, H.; Chen, X.; Li, J.; Ma, L.; Wang, C.; Liu, C.; Schwank, J.W.; Hao, J. Improvement of Activity and SO2 Tolerance of Sn-Modified MnOx CeO2 Catalysts for NH3-SCR at Low Temperatures. Environ. Sci. Technol. 2013, 47, 5294–5301. [Google Scholar] [CrossRef] [PubMed]
- Wang, J.; Yu, T.; Wang, X.; Qi, G.; Xue, J.; Shen, M.; Li, W. The influence of silicon on the catalytic properties of Cu/SAPO-34 for NOx reduction by ammonia-SCR. Appl. Catal. B-Environ. 2012, 127, 137–147. [Google Scholar] [CrossRef]
- Guo, L.; Zhu, W.; Miao, P.; Li, F.; Guo, Z.; Sun, Q. Intergrowth Silicoaluminophosphate Molecular Sieves Synthesized and Their Catalytic Performances for Methanol to Olefins Reaction. Ind. Eng. Chem. Res. 2018, 57, 10398–10402. [Google Scholar] [CrossRef]
- Ono, K.; Miyake, K.; Nakai, M.; Al Jabri, H.; Hirota, Y.; Uchida, Y.; Tanaka, S.; Miyamoto, M.; Nishiyama, N. Development of AEI type germanoaluminophosphate (GeSAPO-18) with ultra-weak acid sites and its catalytic properties for the methanol to olefin (MTO) reaction. Catal. Sci. Technol. 2017, 7, 4622–4628. [Google Scholar] [CrossRef]
- Han, S.; Cheng, J.; Ye, Q.; Cheng, S.; Kang, T.; Dai, H. Ce doping to Cu-SAPO-18: Enhanced catalytic performance for the NH3-SCR of NO in simulated diesel exhaust. Microporous Mesoporous Mater. 2019, 276, 133–146. [Google Scholar] [CrossRef]
- Li, Y.; Deng, J.; Song, W.; Liu, J.; Zhao, Z.; Gao, M.; Wei, Y.; Wang, Q.; Deng, J. The protection of CeO2 thin film on Cu-SAPO-18 catalyst for highly stable catalytic NH3-SCR performance. Chem. Eng. J. 2017, 330, 926–935. [Google Scholar] [CrossRef]
- Wang, J.; Peng, Z.; Qiao, H.; Yu, H.; Hu, Y.; Chang, L.; Bao, W. Cerium-Stabilized Cu-SSZ-13 Catalyst for the Catalytic Removal of NOx by NH3. Ind. Eng. Chem. Res. 2016, 55, 1174–1182. [Google Scholar] [CrossRef]
- Cao, Y.; Feng, X.; Xu, H.; Lan, L.; Gong, M.; Chen, Y. Novel promotional effect of yttrium on Cu-SAPO-34 monolith catalyst for selective catalytic reduction of NOx by NH3 (NH3-SCR). Catal. Commun. 2016, 76, 33–36. [Google Scholar] [CrossRef]
- Cao, Y.; Zou, S.; Lan, L.; Yang, Z.; Xu, H.; Lin, T.; Gong, M.; Chen, Y. Promotional effect of Ce on Cu-SAPO-34 monolith catalyst for selective catalytic reduction of NOx with ammonia. J. Mol.Catal. A-Chem. 2015, 398, 304–311. [Google Scholar] [CrossRef]
- Wu, R.; Li, L.; Zhang, N.; He, J.; Song, L.; Zhang, G.; Zhang, Z.; He, H. Enhancement of low-temperature NH3-SCR catalytic activity and H2O & SO2 resistance over commercial V2O5-MoO3/TiO2 catalyst by high shear-induced doping of expanded graphite. Catal. Today 2020. [Google Scholar] [CrossRef]
- Zhang, N.; Li, L.; Guo, Y.; He, J.; Wu, R.; Song, L.; Zhang, G.; Zhao, J.; Wang, D.; He, H. A MnO2-based catalyst with H2O Resistance for NH3-SCR: Study of Catalytic Activity and Reactants-H2O Competitive Adsorption. Appl. Catal. B-Environ. 2020, 270, 118860. [Google Scholar] [CrossRef]
- Jin, R.; Liu, Y.; Wang, Y.; Cen, W.; Wu, Z.; Wang, H.; Weng, X. The role of cerium in the improved SO2 tolerance for NO reduction with NH3 over Mn-Ce/TiO2 catalyst at low temperature. Appl. Catal. B-Environ. 2014, 148, 582–588. [Google Scholar] [CrossRef]
- Zhang, N.; Li, L.; Zhang, B.; Yong, Y.; Song, L.; Wu, R.; He, H. Polytetrafluoroethylene Doping: A Low Cost and Easy Way to Improve the H2O Resistance Ability over MnO2 Catalyst for Low-temperature NH3-SCR. J. Environ. Chem. Eng. 2019, 7, 103044. [Google Scholar] [CrossRef]
- Han, S.; Cheng, J.; Zheng, C.; Ye, Q.; Cheng, S.; Kang, T.; Dai, H. Effect of Si/Al ratio on catalytic performance of hydrothermally aged Cu-SSZ-13 for the NH3 -SCR of NO in simulated diesel exhaust. Appl. Surf. Sci. 2017, 419, 382–392. [Google Scholar] [CrossRef]
- Wang, J.; Liu, Z.; Feng, G.; Chang, L.; Bao, W. In situ synthesis of CuSAPO-34/cordierite and its selective catalytic reduction of nitrogen oxides in vehicle exhaust: The effect of HF. Fuel 2013, 109, 101–109. [Google Scholar] [CrossRef]
- Platzman, I.; Brener, R.; Haick, H.; Tannenbaum, R. Oxidation of Polycrystalline Copper Thin Films at Ambient Conditions. J. Phys. Chem. C 2008, 112, 1101–1108. [Google Scholar] [CrossRef]
- Papavasiliou, J.; Rawski, M.; Vakros, G.J. Avgouropoulos A Novel Post-Synthesis Modification of CuO-CeO2 Catalysts: Effect on Their Activity for Selective CO Oxidation. ChemCatChem 2018, 10, 2096–2106. [Google Scholar] [CrossRef]
- Karthe, S.; Szargan, R.; Suoninen, E. Oxidation of pyrite surfaces—A photoelectron spectroscopic study. Appl. Surf. Sci. 1993, 72, 157–170. [Google Scholar] [CrossRef]
- Lavrenyuk, H.; Kochubei, V.; Mykhalichko, O.; Mykhalichko, B. A new flame retardant on the basis of diethylenetriamine copper(II) sulfate complex for combustibility suppressing of epoxy-amine composites. Fire Saf. J. 2016, 80, 30–37. [Google Scholar] [CrossRef]
- Ma, L.; Seo, Y.; Nahata, M.C.; Chen, X.; Li, J.; Chwank, J.W. Shape dependence and sulfate promotion of CeO2 for selective catalytic reduction of NOx with NH3. Appl. Catal. B-Environ. 2018, 232, 246–259. [Google Scholar] [CrossRef]
- Richter, M.; Fait, M.J.G.; Eckelt, R.; Schneider, M.; Radnik, J.; Heidemann, D.; Fricke, R. Gas-phase carbonylation of methanol to dimethyl carbonate on chloride-free Cu-precipitated zeolite Y at normal pressure. J. Catal. 2007, 245, 11–24. [Google Scholar] [CrossRef]
- Zhang, L.; Li, L.; Cao, Y.; Yao, X.; Ge, C.; Gao, F.; Deng, Y.; Tang, C.; Dong, L. Getting insight into the influence of SO2 on TiO2/CeO2 for the selective catalytic reduction of NO by NH3. Appl. Catal. B-Environ. 2015, 165, 589–598. [Google Scholar] [CrossRef]
- Lietti, L.; Ramis, G.; Berti, F.; Toledo, G.; Robba, D.; Busca, G.; Forzatti, P. Chemical, structural and mechanistic aspects on NOx SCR over commercial and model oxide catalysts. Catal. Today 1998, 42, 101–116. [Google Scholar] [CrossRef]
- Xie, L.; Liu, F.; Liu, K.; Shi, X.; He, H. Inhibitory effect of NO2 on the selective catalytic reduction of NOx with NH3 over one-pot-synthesized Cu-SSZ-13 catalyst. Catal. Sci. Technol. 2014, 4, 1104–1110. [Google Scholar] [CrossRef]
- Zhang, T.; Qiu, F.; Li, J. Design and synthesis of core-shell structured meso-Cu-SSZ-13@mesoporous aluminosilicate catalyst for SCR of NOx with NH3: Enhancement of activity, hydrothermal stability and propene poisoning resistance. Appl. Catal. B-Environ. 2016, 195, 48–58. [Google Scholar] [CrossRef]
- Long, R.Q.; Yang, R.T. Reaction mechanism of selective catalytic reduction of NO with NH3 over Fe-ZSM-5 catalyst. J. Catal. 2002, 207, 224–231. [Google Scholar] [CrossRef]
- Xie, S.; Wang, J.; He, H. Poisoning effect of sulphate on the selective catalytic reduction of NOx by C3H6 over Ag-Pd/Al2O3. J. Mol.Catal. A-Chem. 2007, 266, 166–172. [Google Scholar] [CrossRef]
- Waqif, M.; Bazin, P.; Saur, O.; Lavalley, J.C.; Blanchard, G.; Touret, O. Study of ceria sulfation. Appl. Catal. B-Environ. 1997, 11, 193–205. [Google Scholar] [CrossRef]
- Liu, F.; Asakura, K.; He, H.; Shan, W.; Shi, X.; Zhang, C. Influence of sulfation on iron titanate catalyst for the selective catalytic reduction of NOx with NH3. Appl. Catal. B-Environ. 2011, 103, 369–377. [Google Scholar] [CrossRef]
- Jiang, B.Q.; Wu, Z.B.; Liu, Y.; Lee, S.C.; Ho, W.K. DRIFT Study of the SO2 Effect on Low-Temperature SCR Reaction over Fe−Mn/TiO2. J. Phys. Chem. C 2010, 114, 4961–4965. [Google Scholar] [CrossRef]
Figure 1.
NO conversion and N2 selectivity during the NH3-SCR reaction over the Cu-SAPO-18 and Ce-Cu-SAPO-18 samples at a GHSV of 130,000 h−1. The reactant feed composition: 500 ppm NO, 500 ppm NH3, 100 ppm SO2 (when used), 14 vol.% O2, 5 vol.% H2O, and N2 (balance).
Figure 1.
NO conversion and N2 selectivity during the NH3-SCR reaction over the Cu-SAPO-18 and Ce-Cu-SAPO-18 samples at a GHSV of 130,000 h−1. The reactant feed composition: 500 ppm NO, 500 ppm NH3, 100 ppm SO2 (when used), 14 vol.% O2, 5 vol.% H2O, and N2 (balance).

Figure 2.
NO conversion as a function of reaction time over the Cu-SAPO-18 and Ce-Cu-SAPO-18 samples in the presence and absence of SO2 at 300 °C. The reactant feed composition: 500 ppm NO, 500 ppm NH3, 100 ppm SO2 (when used), 14 vol.% O2, 5 vol.% H2O, and N2 (balance).
Figure 2.
NO conversion as a function of reaction time over the Cu-SAPO-18 and Ce-Cu-SAPO-18 samples in the presence and absence of SO2 at 300 °C. The reactant feed composition: 500 ppm NO, 500 ppm NH3, 100 ppm SO2 (when used), 14 vol.% O2, 5 vol.% H2O, and N2 (balance).
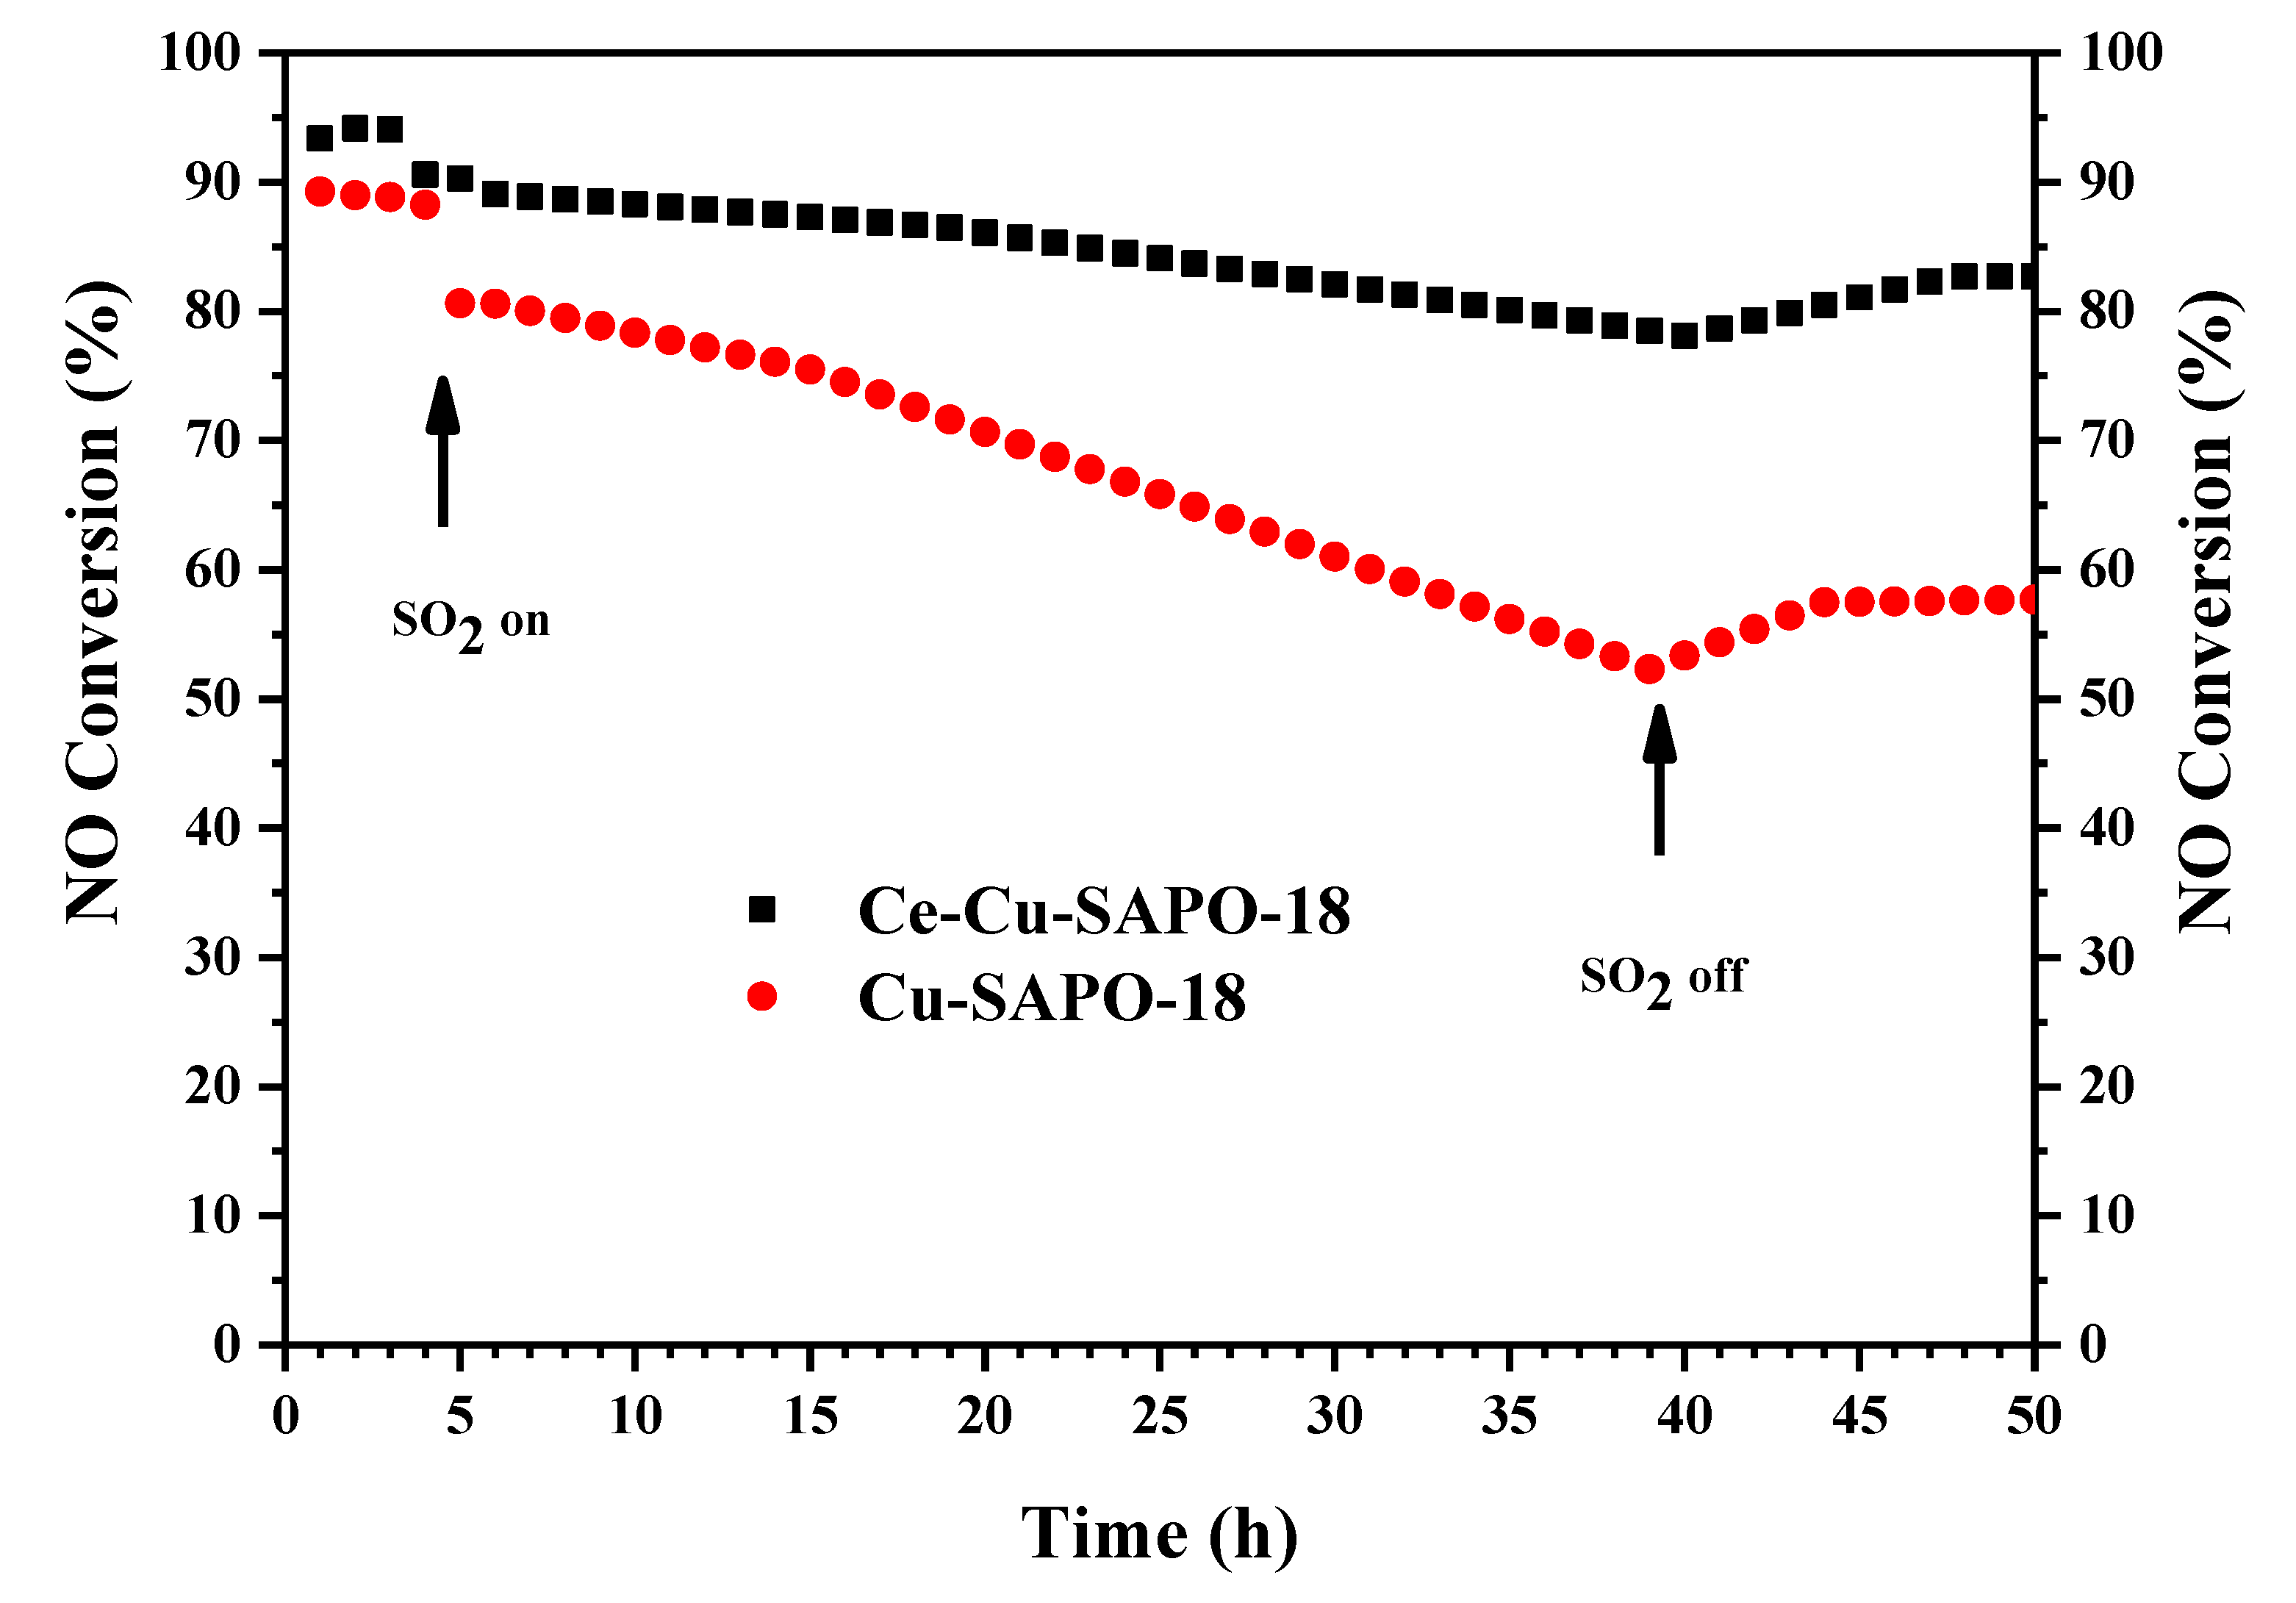
Figure 3.
Cu 2p3/2 XPS spectra of the fresh and sulfated samples: (a) Cu-SAPO-18, (b) Cu-SAPO-18-S, (c) Ce-Cu-SAPO-18, and (d) Ce-Cu-SAPO-18-S.
Figure 3.
Cu 2p3/2 XPS spectra of the fresh and sulfated samples: (a) Cu-SAPO-18, (b) Cu-SAPO-18-S, (c) Ce-Cu-SAPO-18, and (d) Ce-Cu-SAPO-18-S.
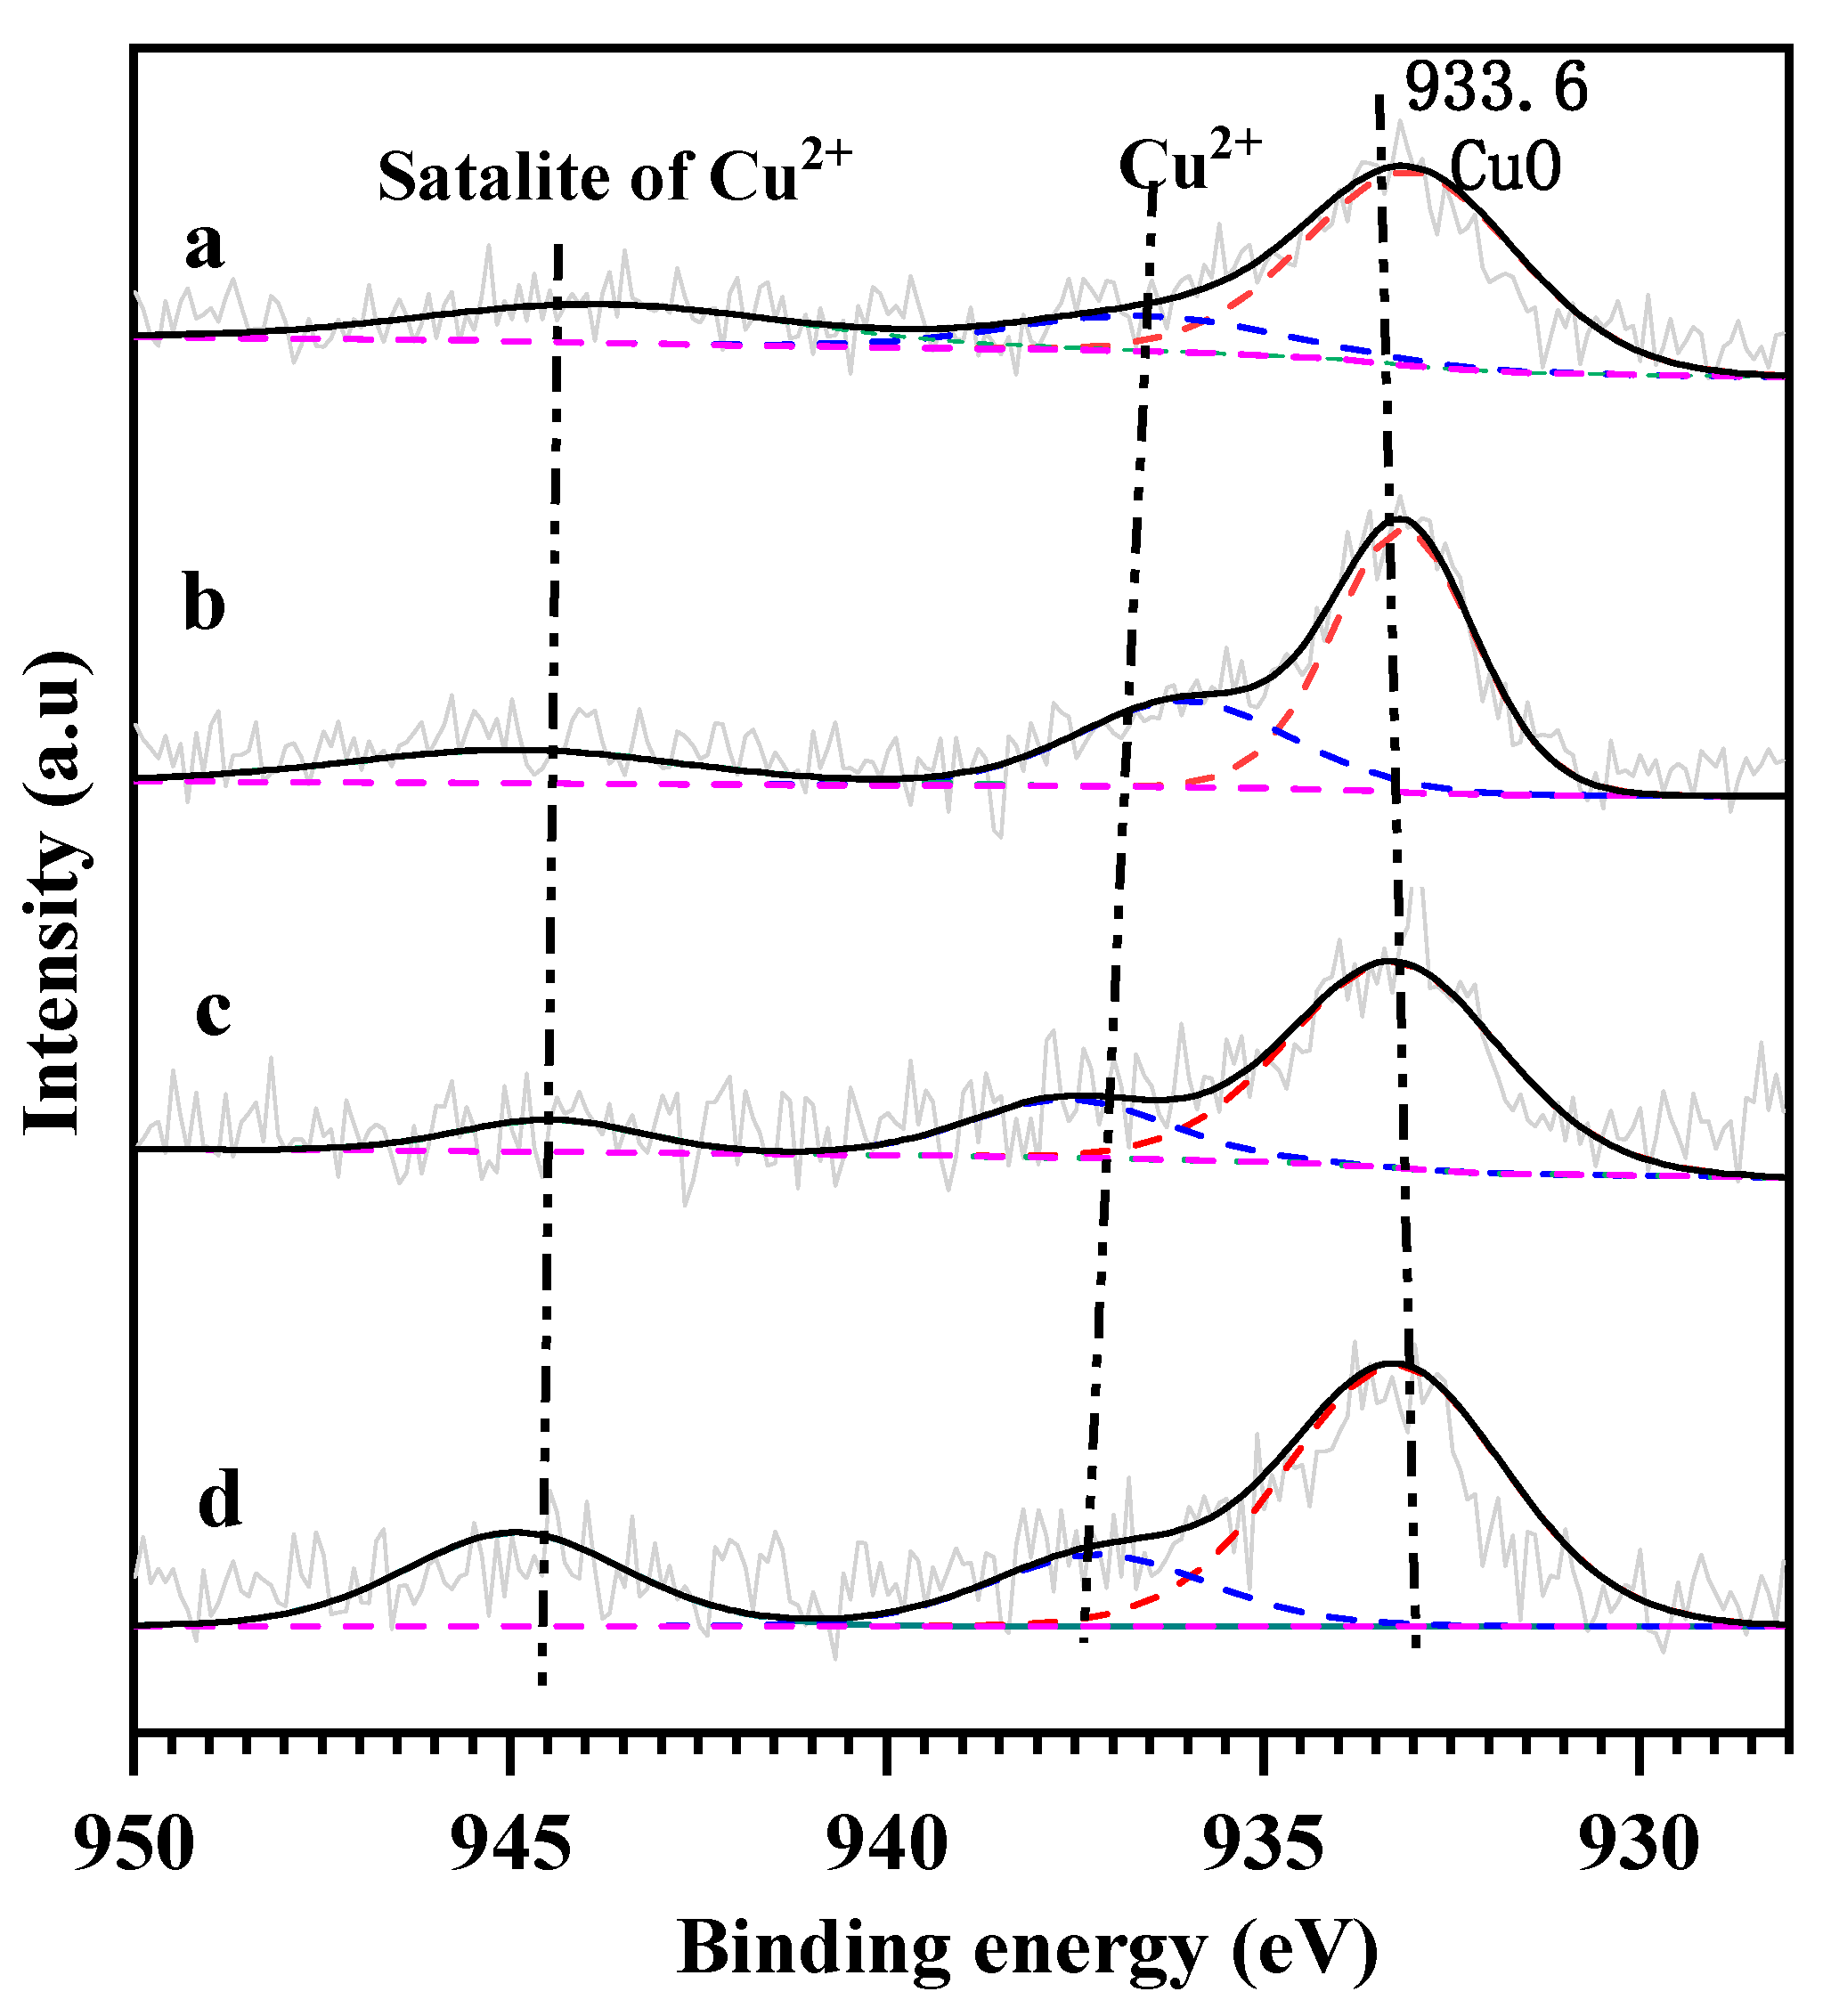
Figure 4.
H2-TPR profiles of the fresh and sulfated samples.
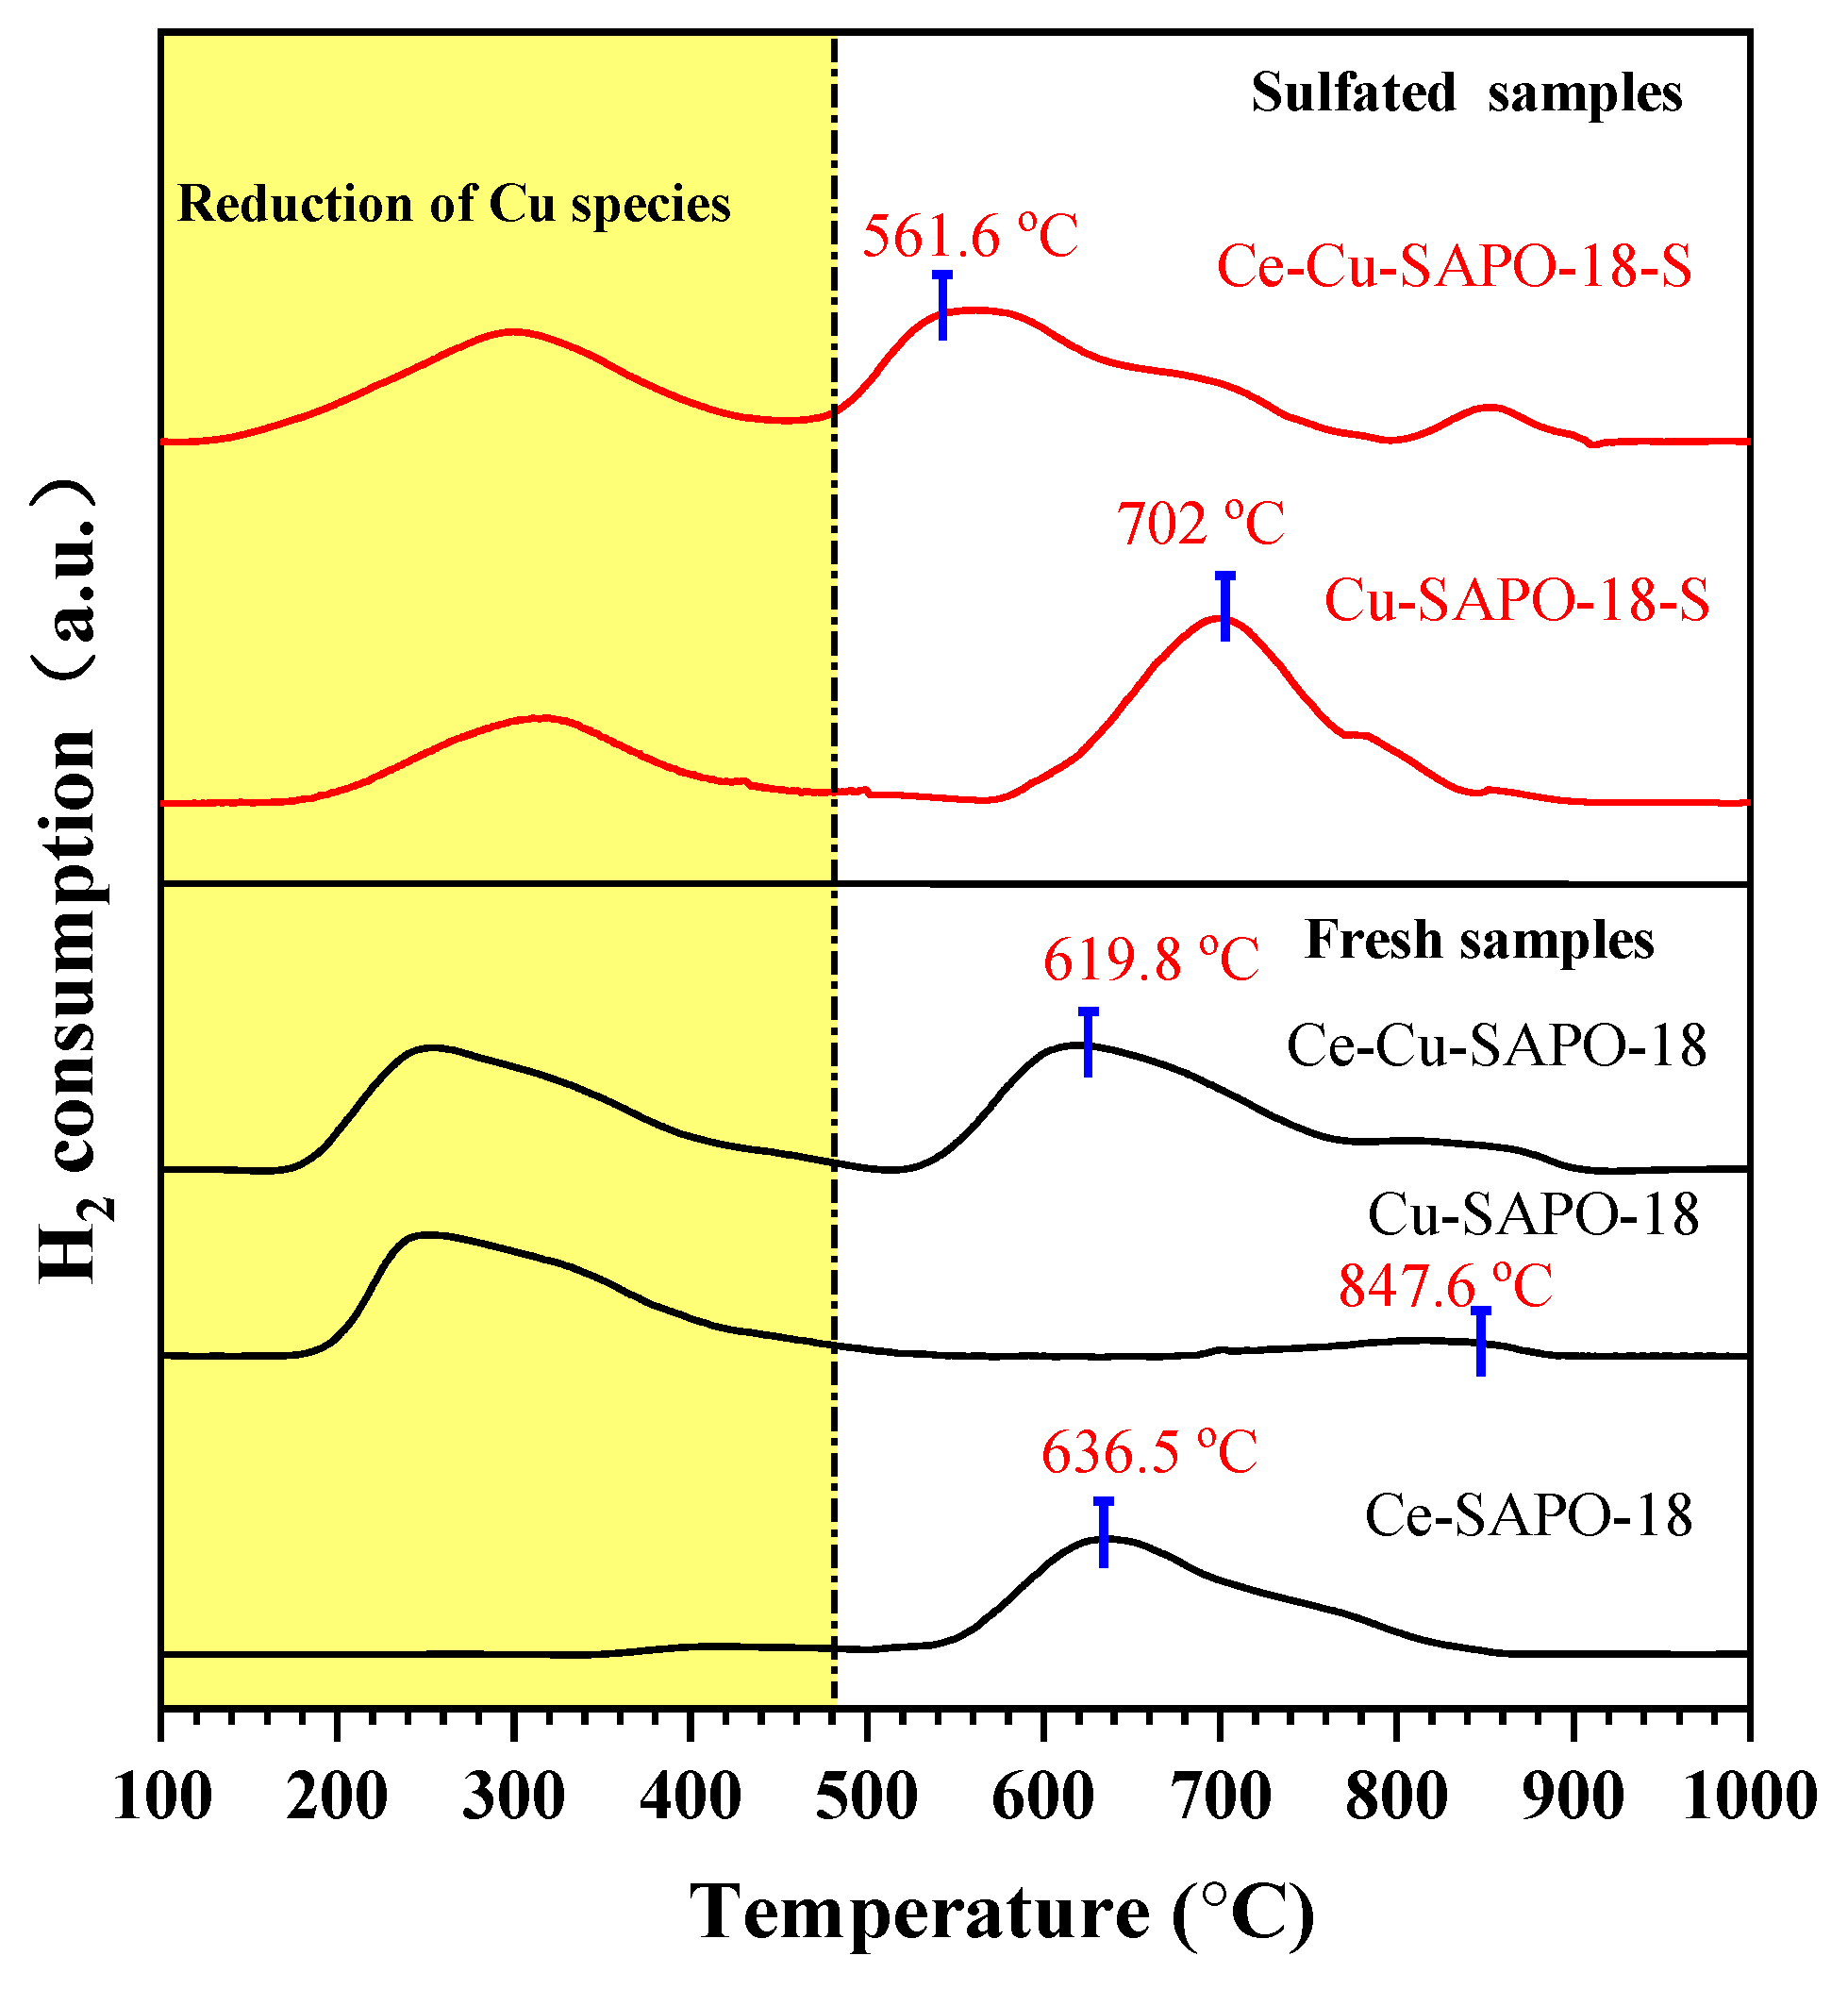
Figure 5.
DRIFT spectra of NH3 adsorption on (A) Cu-SAPO-18 and (B) Cu-SAPO-18-S at 150 °C for various time.
Figure 5.
DRIFT spectra of NH3 adsorption on (A) Cu-SAPO-18 and (B) Cu-SAPO-18-S at 150 °C for various time.
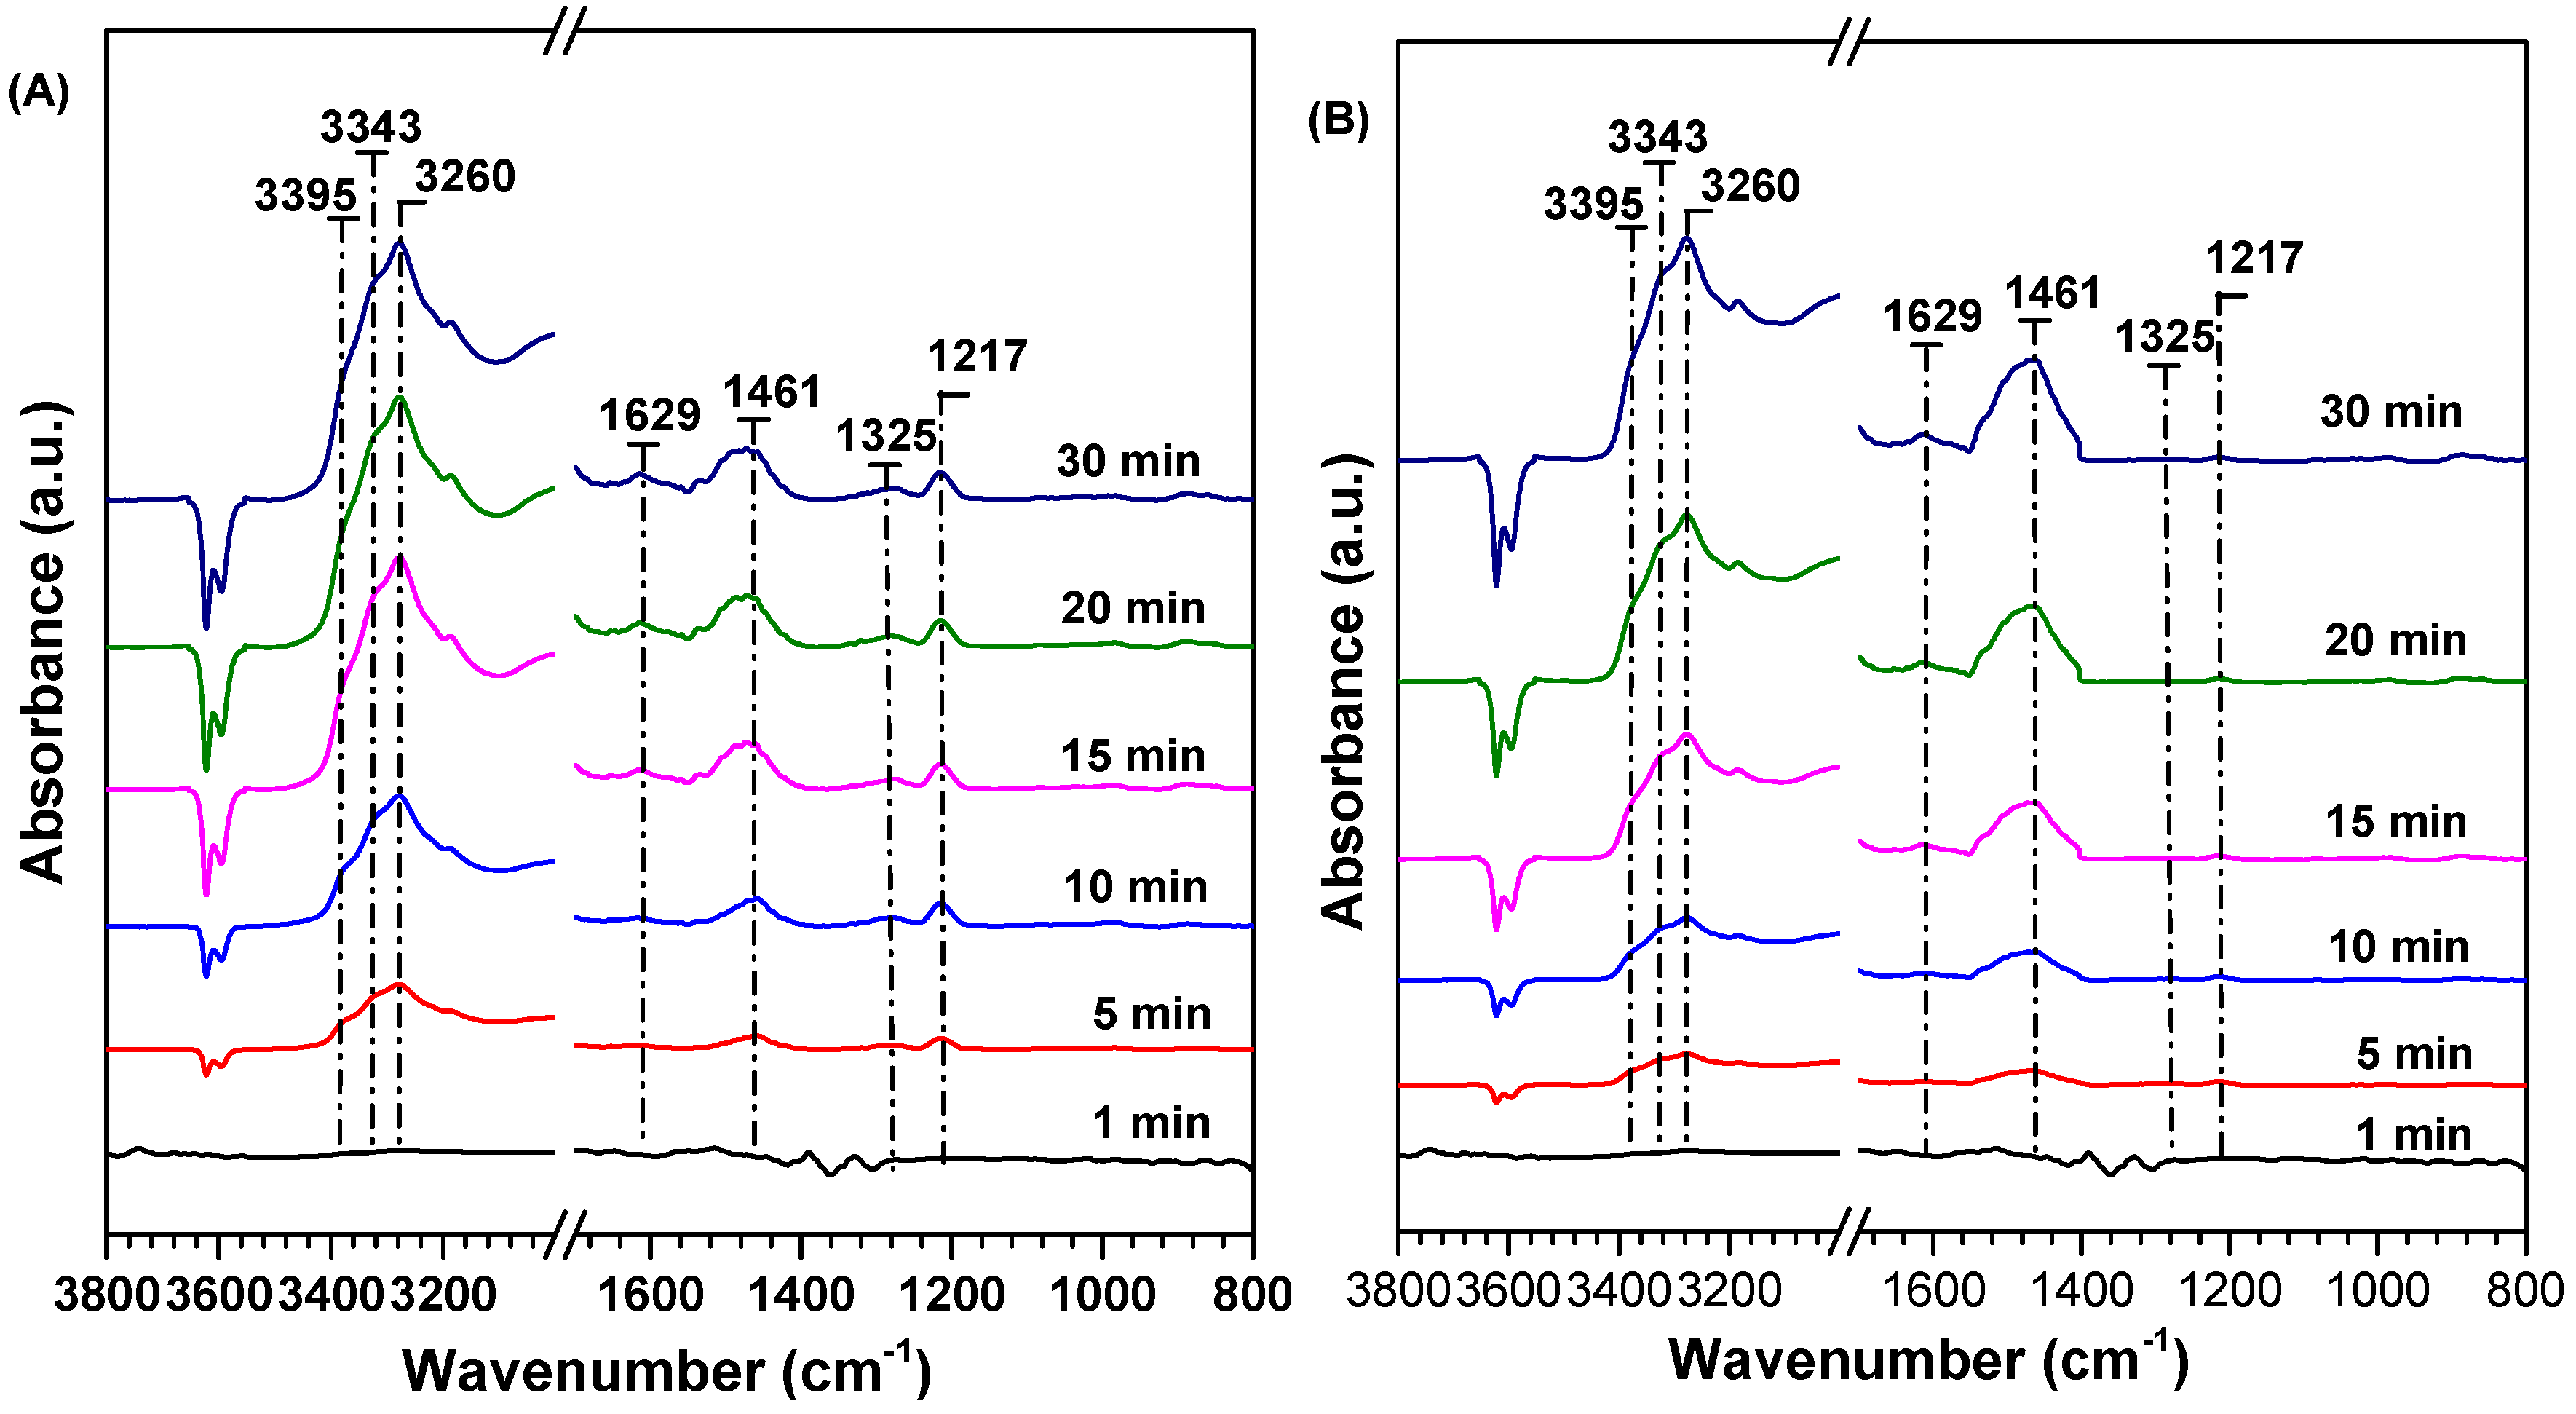
Figure 6.
DRIFT spectra of NH3 adsorption on (A) Ce-Cu-SAPO-18 and (B) Ce-Cu-SAPO-18-S at 150 °C for various times.
Figure 6.
DRIFT spectra of NH3 adsorption on (A) Ce-Cu-SAPO-18 and (B) Ce-Cu-SAPO-18-S at 150 °C for various times.
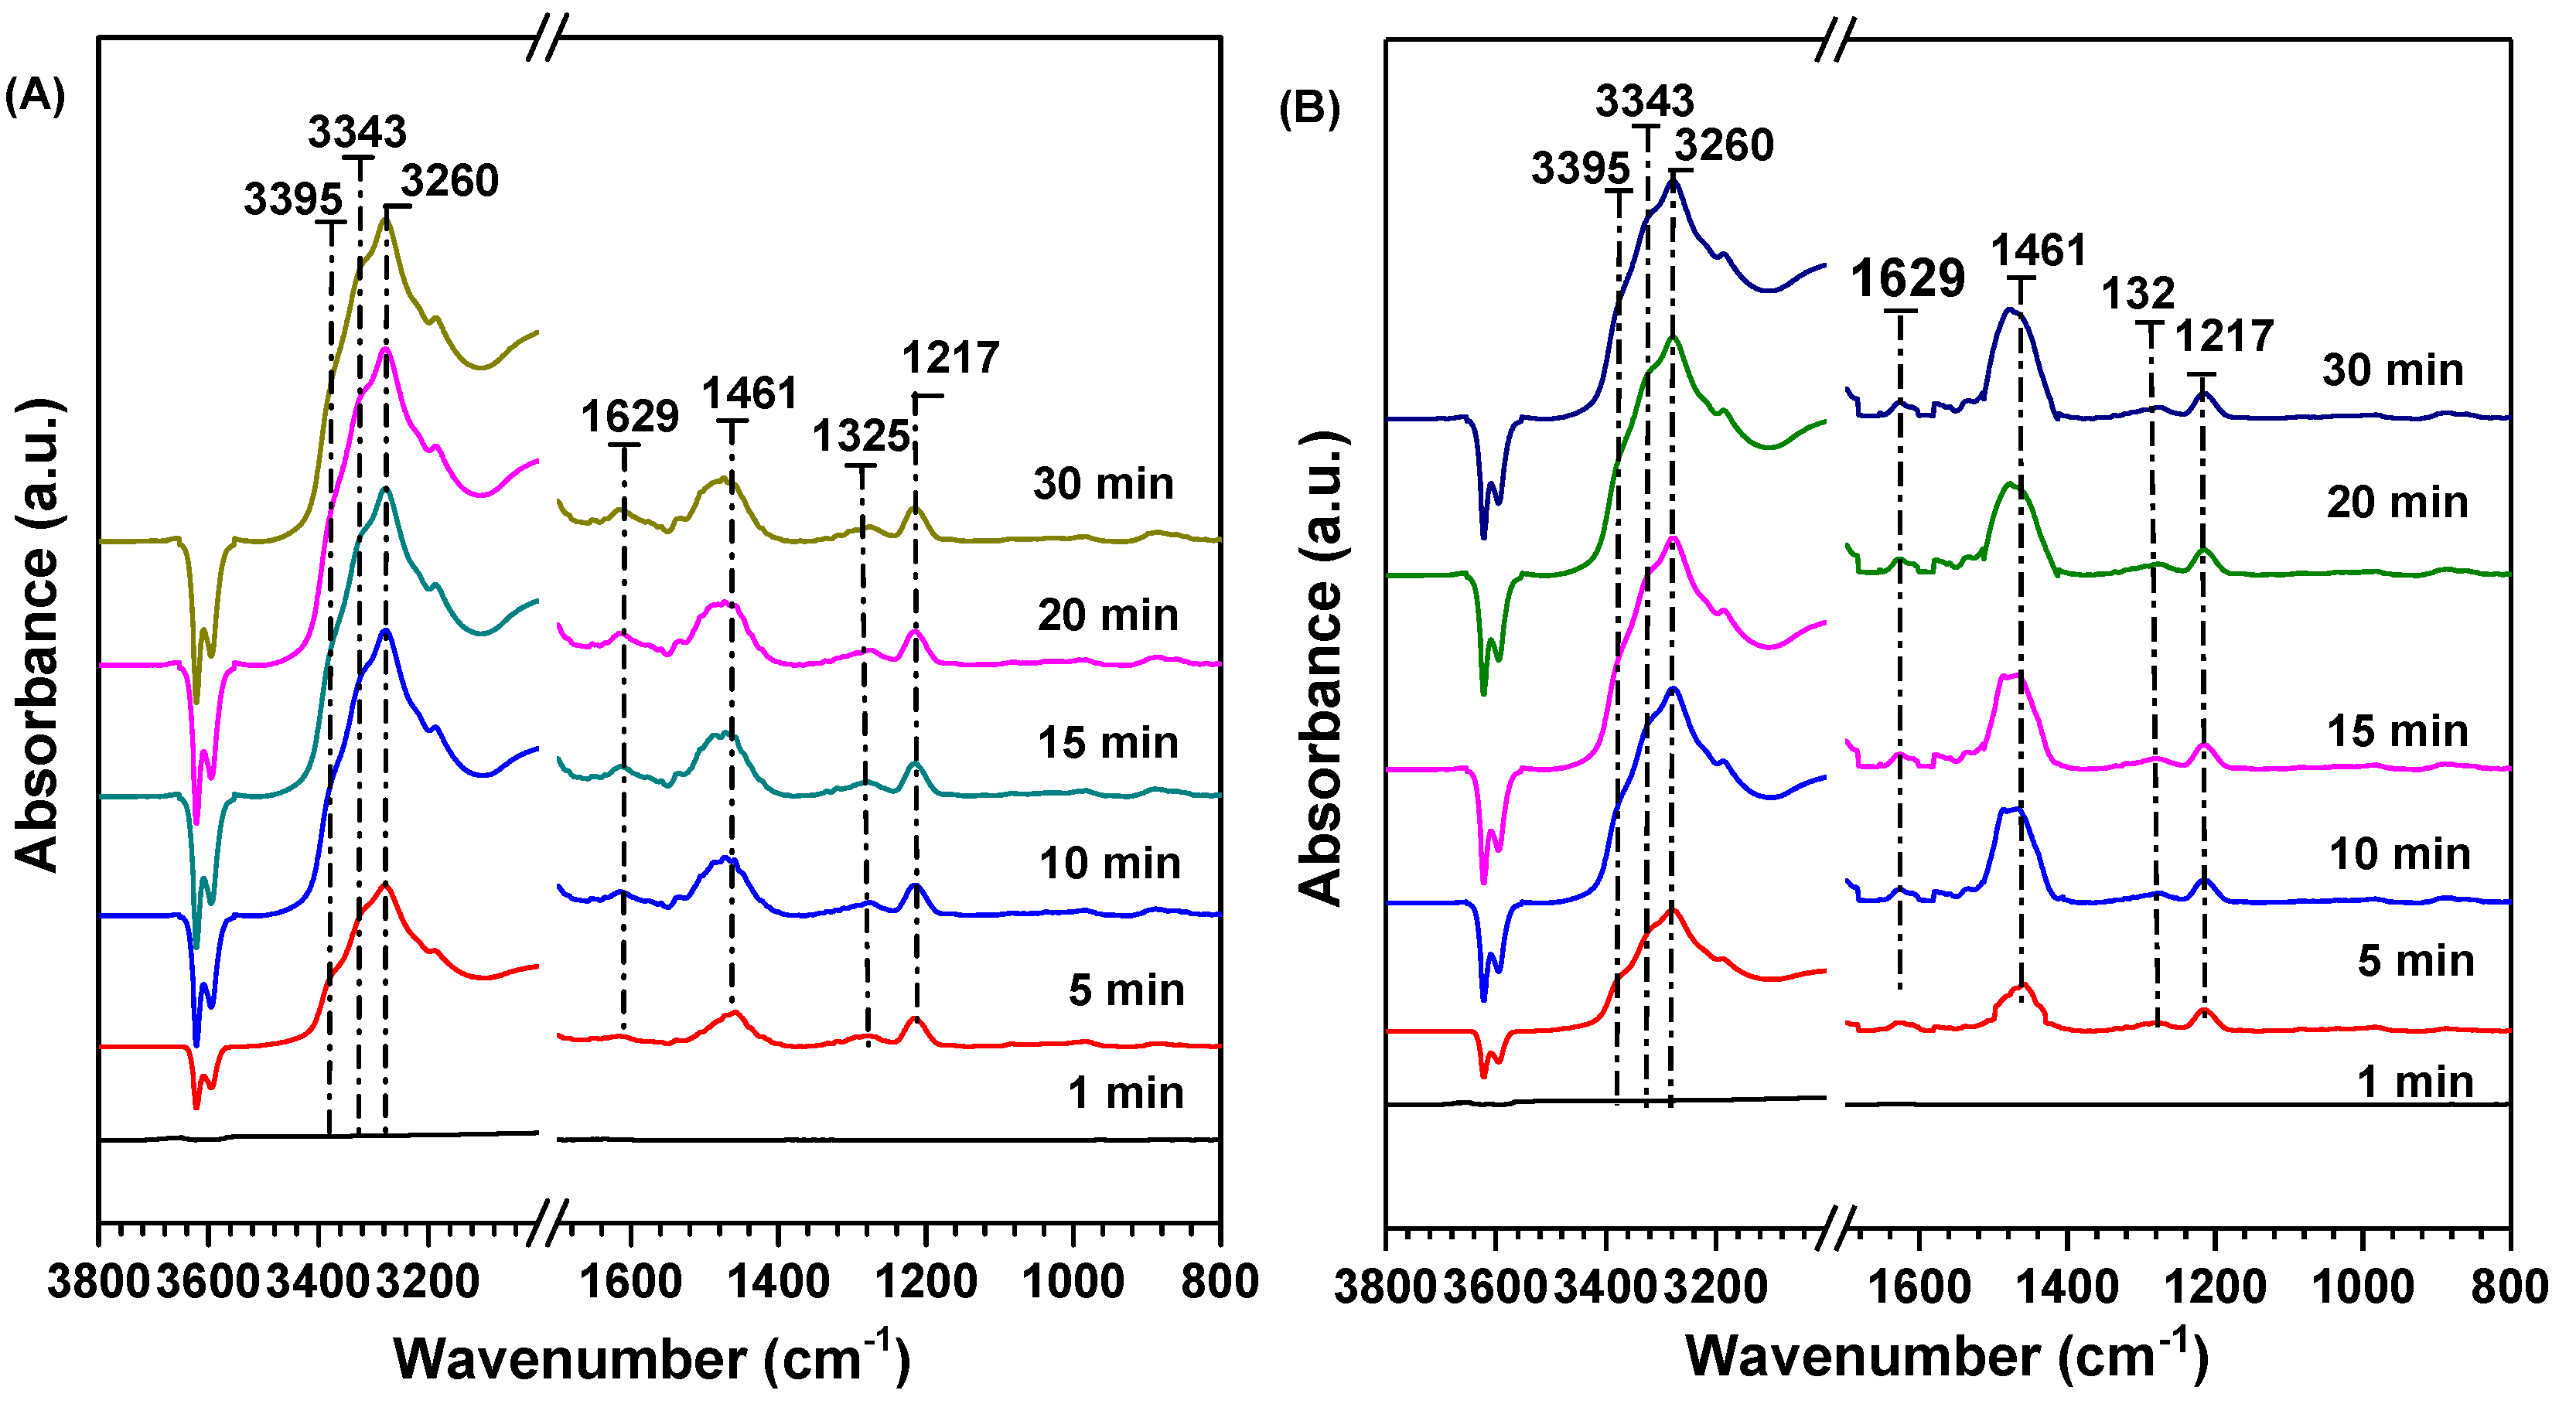
Figure 7.
DRIFT spectra of the Cu-SAPO-18 sample exposed to 500 ppm NO in the presence of O2, followed by introduction of 100 ppm SO2 at 150 °C.
Figure 7.
DRIFT spectra of the Cu-SAPO-18 sample exposed to 500 ppm NO in the presence of O2, followed by introduction of 100 ppm SO2 at 150 °C.

Figure 8.
DRIFT spectra of the Ce-Cu-SAPO-18 sample exposed to 500 ppm NO in the presence of O2, followed by introduction of 100 ppm SO2 at 150 °C.
Figure 8.
DRIFT spectra of the Ce-Cu-SAPO-18 sample exposed to 500 ppm NO in the presence of O2, followed by introduction of 100 ppm SO2 at 150 °C.

Figure 9.
DRIFT spectra of the Cu-SAPO-18 sample exposed to 100 ppm SO2, followed by introduction of 500 ppm NO in the presence of O2 at 150 °C.
Figure 9.
DRIFT spectra of the Cu-SAPO-18 sample exposed to 100 ppm SO2, followed by introduction of 500 ppm NO in the presence of O2 at 150 °C.

Figure 10.
DRIFT spectra of the Ce-Cu-SAPO-18 sample exposed to 100 ppm SO2, followed by introduction of 500 ppm NO in the presence of O2 at 150 °C.
Figure 10.
DRIFT spectra of the Ce-Cu-SAPO-18 sample exposed to 100 ppm SO2, followed by introduction of 500 ppm NO in the presence of O2 at 150 °C.
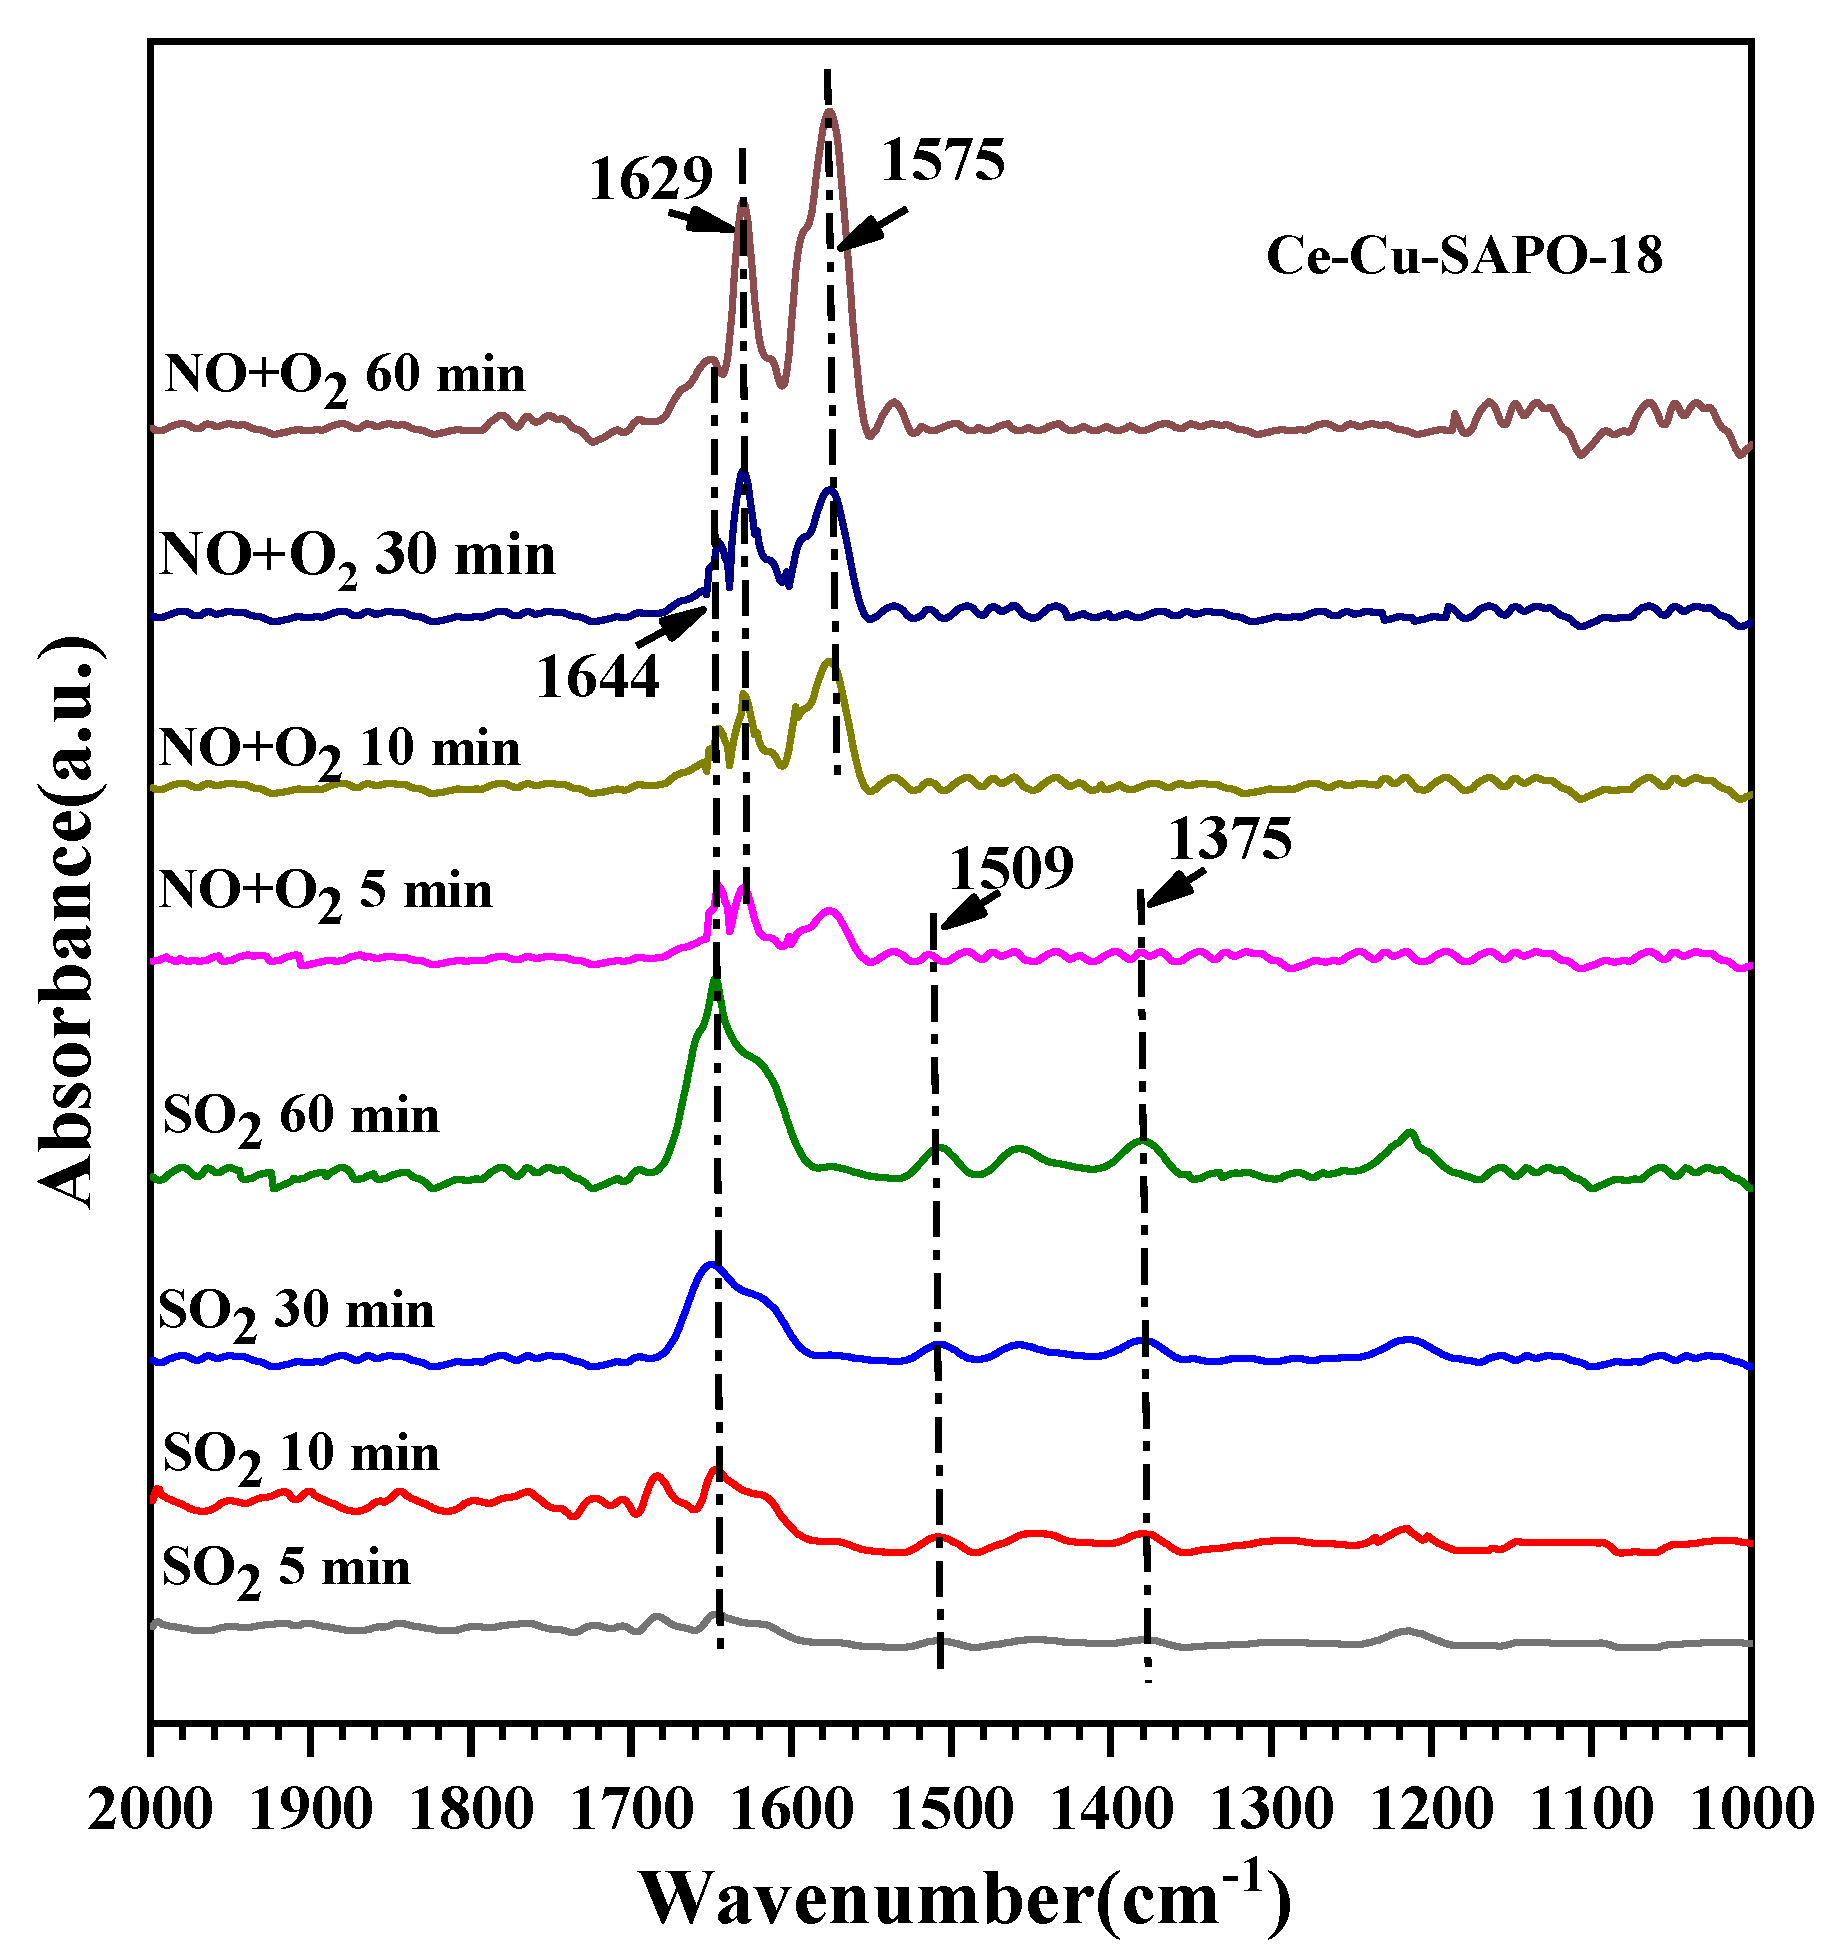
Figure 11.
DRIFT spectra of (A) Cu-SAPO-18 and (B) Ce-Cu-SAPO-18 first exposed to 500 ppm NO + 500 ppm NH3 + 100 ppm SO2 in the presence of O2 at 150 °C for various time, and then switched from the NO/NH3/SO2/N2 mixture to only N2 with the temperature being increased from 150 to 400 °C.
Figure 11.
DRIFT spectra of (A) Cu-SAPO-18 and (B) Ce-Cu-SAPO-18 first exposed to 500 ppm NO + 500 ppm NH3 + 100 ppm SO2 in the presence of O2 at 150 °C for various time, and then switched from the NO/NH3/SO2/N2 mixture to only N2 with the temperature being increased from 150 to 400 °C.

Scheme 1.
Formation pathways of the bulk-like sulfates on the Ce-Cu-SAPO-18 sample.
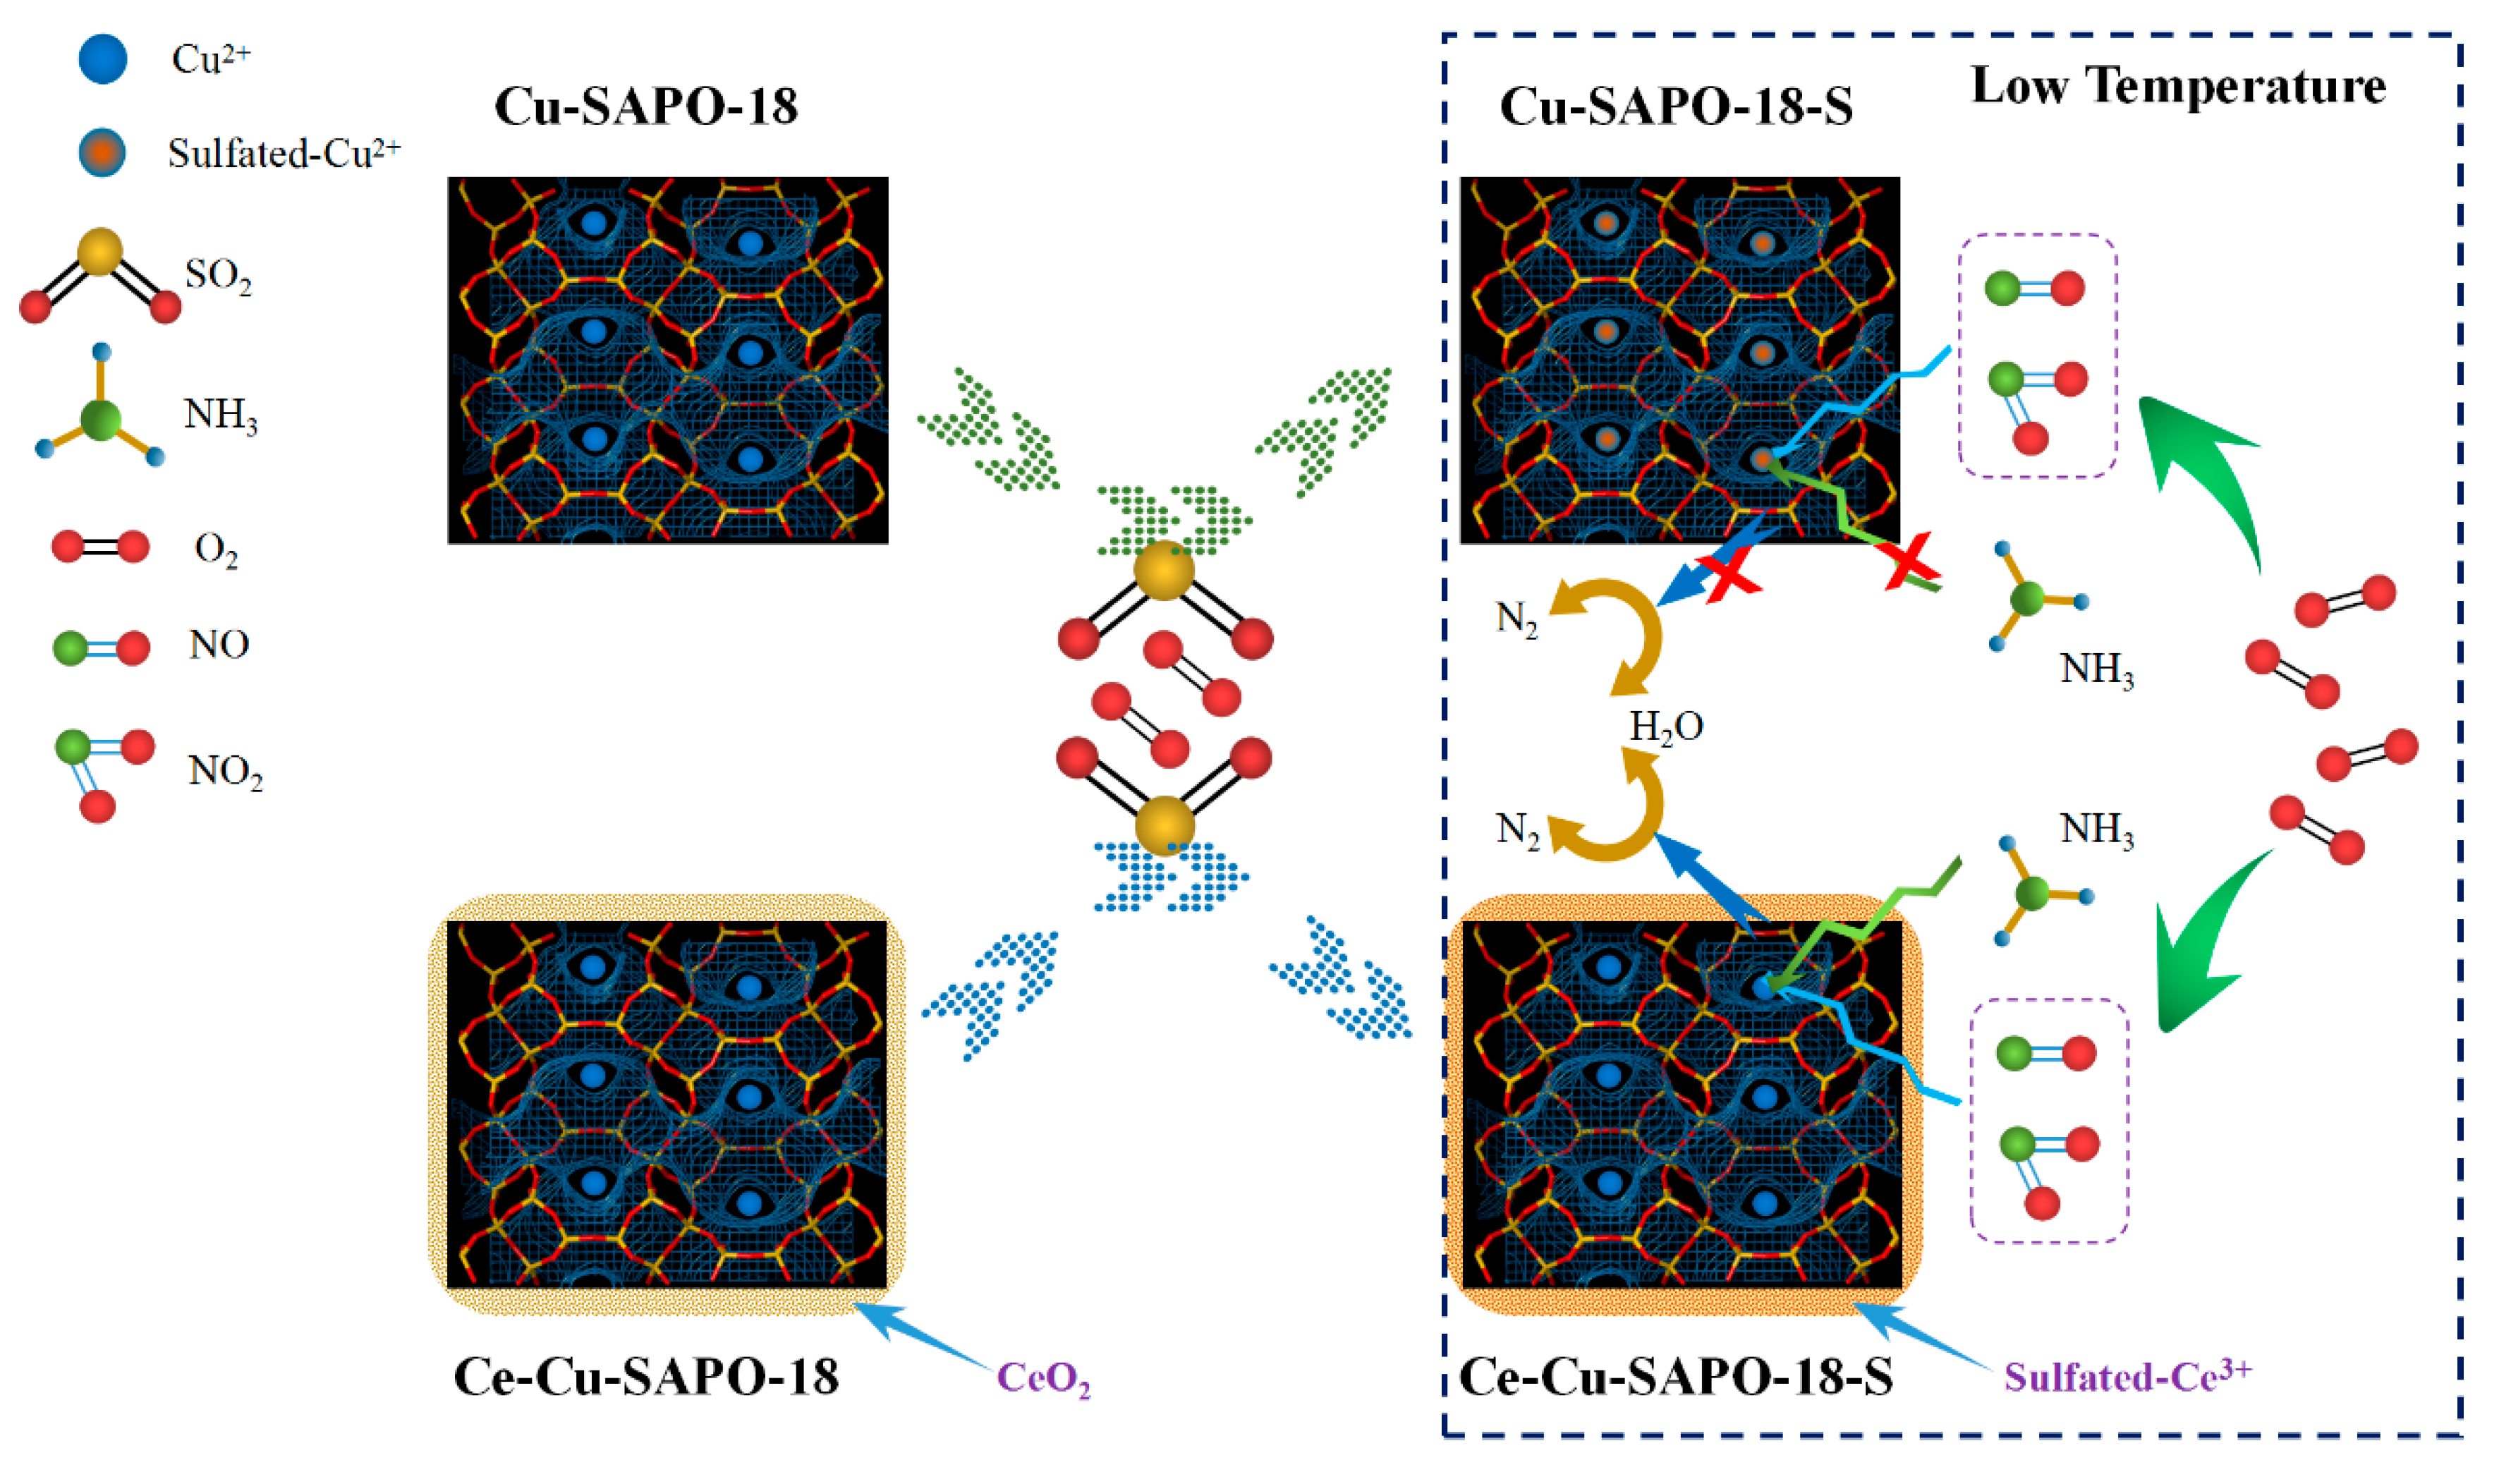
Figure 12.
NO conversion and N2 selectivity as a function of temperature for the NH3-SCR reaction over the Cu-SAPO-18-S, Cu-SAPO-18-R, Ce-Cu-SAPO-18-S and Ce-Cu-SAPO-18-R samples at a GHSV of 130,000 h−1. The reactant feed composition: 500 ppm NO, 500 ppm NH3, 14 vol.% O2, 5 vol.% H2O, and N2 (balance).
© 2020 by the authors. Licensee MDPI, Basel, Switzerland. This article is an open access article distributed under the terms and conditions of the Creative Commons Attribution (CC BY) license (http://creativecommons.org/licenses/by/4.0/).
Share and Cite
MDPI and ACS Style
Han, S.; Ye, Q.; Gao, Q.; Dai, H. Improved SO2 Tolerance of Cu-SAPO-18 by Ce-Doping in the Selective Catalytic Reduction of NO with NH3. Catalysts 2020, 10, 783. https://doi.org/10.3390/catal10070783
AMA Style
Han S, Ye Q, Gao Q, Dai H. Improved SO2 Tolerance of Cu-SAPO-18 by Ce-Doping in the Selective Catalytic Reduction of NO with NH3. Catalysts. 2020; 10(7):783. https://doi.org/10.3390/catal10070783
Chicago/Turabian StyleHan, Shuai, Qing Ye, Qi Gao, and Hongxing Dai. 2020. "Improved SO2 Tolerance of Cu-SAPO-18 by Ce-Doping in the Selective Catalytic Reduction of NO with NH3" Catalysts 10, no. 7: 783. https://doi.org/10.3390/catal10070783
Note that from the first issue of 2016, this journal uses article numbers instead of page numbers. See further details here.