
Raw Biogas as Feedstock for the OCM Process
by

Barbara Michorczyk
1,*, 
Jakub Sikora
2, 
Bogusława Kordon-Łapczyńska
3,
Dorota Gaweł
1,4 and
Izabela Czekaj
1 1
Department of Organic Chemistry and Technology, Cracow University of Technology, Warszawska 24, 31-155 Cracow, Poland
2
Department of Bioprocess Engineering, Energy and Automation, University of Agriculture in Cracow, Balicka 116 B, 30-149 Cracow, Poland
3
Department of Mechanical Engineering and Agrophysics, University of Agriculture in Cracow, Balicka 120, 30-149 Cracow, Poland
4
Jerzy Haber Institute of Catalysis and Surface Chemistry, Polish Academy of Sciences, Niezapominajek 8, 30-239 Cracow, Poland
*
Author to whom correspondence should be addressed.
Catalysts 2022, 12(1), 54; https://doi.org/10.3390/catal12010054
Submission received: 12 December 2021
/
Revised: 29 December 2021
/
Accepted: 31 December 2021
/
Published: 5 January 2022
(This article belongs to the Special Issue Catalysts in Biomass Valorization)
Abstract
:The paper presents the research results obtained in the process of oxidative coupling of methane, in which unpurified biogas was used as the feedstock. Biogas obtained from two kinds of biomass materials, i.e., plant materials (potato and beet pulp, Corn-Cob-Mix—biogas 1) and animal waste (waste from fish filleting—biogas 2) was considered. The influence of temperature, the ratio of methane/oxygen and total flows of feedstock on the catalytic performance in oxidative coupling of methane process was investigated. Comparative tests were carried out using pure methane and a mixture of methane-carbon dioxide to simulate the composition of biogas 2. The process was carried out in the presence of an Mn-Na2WO4/SiO2 catalyst. Fresh and used catalysts were characterised by means of powder X-ray diffraction, X-ray photoelectron spectroscopy, and low-temperature nitrogen adsorption techniques. In oxidative coupling of methane, the type of raw material used as the source of methane has a small effect on methane conversion (the differences in methane conversion are below 3%), but a significant effect on the selectivity to C2. Depending on the type of raw material, the differences in selectivity to C2 reach as high as 9%. However, the Mn-Na2WO4/SiO2 catalyst operated steadily in the tested period of time at any feedstock composition. Moreover, it was found that CO2, which is the second main component of biogas in addition to methane, has an effect on catalytic performance. Comparative results of catalytic tests indicate that the CO2 effect varies with temperature. Below 1073 K, CO2 exerts a small poisoning effect on methane conversion, while above this temperature the negative effect of CO2 disappears. In the case of selectivity to C2+, the negative effect of CO2 was observed only at 1023 K. At higher temperatures, CO2 enhances selectivity to C2+. The effect of CO2 was established by correlating the catalytic results with the temperature programmed desorption of CO2 investigation. The poisoning effect of CO2 was connected with the formation of surface Na2CO3, whose concentration depends on temperature.
1. Introduction
The oxidative coupling of methane has been extensively studied for over 30 years, but the feedstock was usually pure methane; meanwhile, one of the important sources of methane is biogas. Biogas is produced by microorganisms in anaerobic conditions from organic matter. To produce biogas, different organic feedstocks such as municipal, industrial, agricultural waste, waste from slaughterhouses, food waste products, and energy crops can be used [1,2,3,4,5,6]. It was recently demonstrated that industrial fish processing waste can be efficiently converted to methane in a mono-digestion process [7]. Biochemical potential methane of fish waste was 540.5 mL/gVS (vs—volatile solids) [7], whereas the potential of methane production from waste activated sludge (WAS), depending on the organic co-substrates (agricultural, industrial, municipal) used, were in the range of 90–1480 mLCH4/gVSadded [6]. Optimization of methane fermentation process of food waste products made it possible to obtain the biogas in an amount 740.4 cm3 ⋅ gODM−1 (ODM—Organic Dry Matter) with 68.6% methane, at the substrates mixture containing 50% of meat, 40% dairy products, 10% fruit and vegetables [2]. Unfortunately, the use of biogas directly as a feedstock for synthesis is difficult due to its varied composition and the presence of impurities. The biogas yield and composition are influenced by the temperature, pH, type of feedstock, organic loading rate, hydraulic retention time, C/N (carbon/nitrogen) ratio, the presence of pollutants such as heavy metals compounds, digester type and pretreatment method [1,2,3,4,5,6,7,8,9,10]. Typically, in addition to methane, biogas contains 20–50% of CO2 and other trace compounds such as H2S, NH3, siloxanes, chlorines, H2 and O2, various volatile organic compounds (VOCs) [8,9,11]. H2S and other sulfur compounds are abundant in agricultural biogas, while silicon compounds are found in low or undetectable amounts [10]. The high amounts of halogenated and organic silicon compounds in landfill biogas is largely the result from industrial waste [8]. The concentrations of VOCs can be high in biogas, especially if they came from organic materials with compounds originating from the biological degradation process, like aromatics and terpenes [8].
Biogas, after cleaning and upgrading, is currently used primarily for the production of electricity/heat, steam; it can also be used as engine fuel, or injected into the gas network. However, recently there has been a growing interest in the possibility of using biogas as a raw material for syntheses. Previous research with the use of biogas included, among others: the process of methanation of carbon dioxide contained in biogas enriched with hydrogen [12,13,14], co-production of methane and urea (bio methane—urea co-production) [15], conversion of biogas to: syngas, “bio hydrogen” [16,17,18,19,20,21,22,23,24,25,26,27,28,29,30], or liquid fuels as a result of the contact of biogas with the fraction of liquid crude oil containing a catalyst [31]. The possibility of direct conversion of biogas to methanol is also investigated with the use of methanotrophs—aerobic bacteria capable of using both methane and carbon dioxide as a carbon source for methanol synthesis [32,33,34]. The attractiveness of this type of solution is related to, inter alia, the possibility of using purified or untreated biogas [32], while in the case of catalytic processes, deep cleaning is usually necessary to remove impurities causing deactivation of the catalyst. Although biogas can be purified and upgraded so that the purity of methane is >97%, it is an expensive process [35,36,37]. The cleaning and upgrading methods, as well as the methods of biogas utilisation, have been described in many reviews [38,39,40,41,42,43,44,45,46]. In recent years some attention has also been paid to techno-economic analyses of the OCM process in order to assess the suitability of biogas as a feedstock for the OCM process [47,48]. The conducted analyses show that biogas, as a cheap and easily available raw material, can be an important source of methane for the OCM process. One of the proposed solutions with the use of biogas is to increase its calorific value as a result of its conversion in the OCM process [49,50].
Up to know many studies concerning the application of pure methane and different mixtures of gases with simulated biogas are investigated in OCM process [49,50,51,52,53,54,55]. In the tests carried out with the use of pure methane and the mixture CH4 + H2S + O2 + N2 + CO2 as a feed stream, under OCM process conditions, the Mn-Na2WO4/SiO2 catalyst worked stably during 100 h of tests [49,51]. The presence of various pollutants present in biogas may have both a positive and negative impact on the OCM process and the stability of the catalyst operation. Trace amounts of chlorine derivatives (compounds potentially present in biogas) have a positive effect on the selectivity to C2 and ethylene/ethane molar ratio [52]. The addition of steam to the stream of reactants, when the Mn-Na2WO4/SiO2 catalyst was used, also had a beneficial effect on the OCM process [50,52,53,54], especially when H2O was added at the beginning of the process [53,54]. On the other hand, the presence of H2S in the stream of reactants reduces the methane conversion and selectivity to C2, but the deactivation of the catalyst is significantly influenced by the concentration of H2S, O2 and the temperature at which the process is carried out. [27,49]. Carbon dioxide occupies a special place among the components of biogas, because its contribution to biogas can be over 50% in volume. Research shows that the presence of carbon dioxide in the feed stream plays an important role in the OCM process, and the effect of its presence depends mainly on the process conditions (temperature and the methane/oxygen molar ratio), its concentration in the stream, and the type of catalyst [52,55]. However, the use of raw unpurified biogas as a feedstock without purification has not been a subject of research so far.
This paper presents the results of tests in which two types of crude unpurified biogas were used as the feedstock in the OCM process carried out in the presence of the 2Mn5Na2WO4/SiO2 catalyst. Biogas was obtained from plant biomass (including the most popular substrate in the world for biogas plants, which is corn silage) and animal waste. Biomass from animal waste is difficult to manage but, as shown by recent studies, it has a high potential for methane production in the mono-digestion process [7]. These two types of biogas were selected in order to compare the properties of biogas obtained from plant biomass and animal waste in terms of their use as a source of methane for the OCM process. The obtained results were compared with those obtained for pure methane and for a mixture simulating the composition of biogas 2, i.e., containing methane and carbon dioxide in the same volume ratios as in biogas 2.
2. Results and Discussion
2.1. Physicochemical Characterization
The low temperature N2 adsorption data for the multicomponent Mn-Na2WO4/SiO2 catalyst before and after the catalytic reaction are summarized in Table 1. The data for individual SiO2, Mn/SiO2, and Na2WO4/SiO2 components are provided as reference. The analysis of low temperature N2 adsorption isotherms reveals that the deposition of manganese on silica support has only a small influence on the total pore volume (Vtotal) and specific surface area (SBET), while the deposition of the Na2WO4 phase leads to the destruction of a porous structure of the support. These dramatic changes in SBET and Vtotal are due to the phase transformation of amorphous silica into crystalline α-cristobalite occurring in the thermal treatment of the catalysts. It has been found that such phase transformation of amorphous silica to either α-cristobalite or quartz is facilitated by sodium cations [56,57] originating, in our case, from Na2WO4. Amorphous silica transforms into α-cristobalite in the temperature range 1743–1973 K [56,57,58]. However, it was found that in the presence of sodium ions, the transformation of silica into α-cristobalite is possible already in the temperature range of 1023–1123 K [56,57,59,60]. Low-temperature SiO2 transformation to cristobalite was also observed in the case of the Na/SiO2 and Na2WO4/SiO2 catalysts [57,61]. It was also found that the presence of sodium in the form of NaOH leads to crystallization only at 1173 K, and the α-cristobalite phase is accompanied by the α-tridimite phase (at 1023 K, only the amorphous phase is present) [57]. In the samples containing no sodium ions, but containing manganese or tungsten ions, the low-temperature transformation of silica to α-cristobalite did not occur. The presence of crystalline α-cristobalite in all the samples containing Na2WO4 is confirmed with XRD (Figure 1). For all of those samples, reflections characteristic of the crystal phases of quartz and Na2WO4 were present simultaneously. The intensity of reflections due to quartz increases after the OCM reaction, regardless of the presence of CO2, which suggests a further phase transformation during the process.
Moreover, in the fresh and used Mn-Na2WO4/SiO2 samples, small reflections characteristic of crystalline Mn2O3 were detected. The Mn2O3 signals are not observed for the Mn/SiO2 sample, which can be explained either by high dispersion of the manganese phase on amorphous SiO2 in the absence of Na2WO4 or by a relatively low detection limit of the XRD technique. For the Mn/SiO2 sample, only small reflections characteristic of the Mn3O4 spinel phase were found. In the fresh and used Mn-Na2WO4/SiO2 catalyst, they overlap with much more intense peaks of α-cristobalite and Na2WO4. To conclude, the XRD results of the used catalysts indicated the absence of significantly abundant new structures, regardless of the type of feedstock.
The chemical composition of the Mn-Na2WO4/SiO2 catalyst surface were determined using the XPS spectra. Figure 2 shows the XPS Mn 2p, W 4f and O 1s spectra for the fresh and used catalysts. The Mn 2p spectra of all catalysts (fresh and used) show a doublet of Mn 2p3/2–Mn 2p1/2, at approximately 642 eV and 653 eV.
Additionally, a small satellite is visible at 647 eV, indicating the existence of Mn2+ in addition to Mn3+ [62]. However, the clearly outlined satellite peak, indicating a higher concentration of Mn2+ on the catalyst surface, is observed only when the CH4 + O2 + He mixture is used as feedstock. The intensity of the MnO satellite depends on the degree of reduction of the catalyst; during the reoxidation of the catalyst, its intensity decreases [62]. The W 4f XPS spectra of the fresh and used catalyst (Figure 1) have spin-orbit doublets ca. at 36 and 38 eV for W 4f7/2 and W4f5/2, respectively, which were assigned to W ions with 6+ oxidation state [62].
Table 2 shows binding energies and surface elemental compositions of the fresh catalyst Mn-Na2WO4/SiO2 and the catalysts after the OCM process, when a mixture of unpurified biogas (biogas 1 or biogas 2) or pure CH4 with oxygen and inert gas (He) was used as a feedstock.
The highest concentration of Na at the surface was found in the case of the fresh catalyst and the catalyst after the process, when a mixture CH4 + O2 + He was used as a feedstock. The use of raw biogas as a feedstock reduced the concentration of sodium ions at the catalyst surface, although in all cases the Na/W ratio on the surface was higher than 2, which indicates that some of the Na ions at the surface are not present in the form of the Na2WO4 compound, probably only in the form of Na2O or Na2O2 [55].
The surface concentration of Na and W was higher on the catalyst used in the process, when the CH4 + O2 + He mixture was used as a feedstock, than on the surface of the fresh catalyst, indicating that some of the Na and W migrated from the mass to the surface. A different situation was observed when raw biogas (1 and 2) was used as a feedstock. In this case, the concentration of Na and W on the surface was lower than on the fresh catalyst. Shi et al. [55] also observed a decrease of Na and W at the surface at high concentrations of CO2 in the feedstock as well as when the inert gas contribution in the feed stream was increased. The surface concentration of Mn in the used catalysts (regardless of the type of feedstock) is higher than in the case of the fresh catalyst, wherein it is the highest in the case of the CH4 + O2 + He mixture. Shi et al. [55] observed that the concentration of Mn increases with increasing CO2 concentration in the feed stream and decreases with dilution of inert gas reagents. As a result of the XPS O1 spectra deconvolution two peaks were obtained. The peak at about 533 eV corresponded to the O atoms bound in the SiO2 form and the other peak at about 530 eV corresponded to the O atom in the metal oxides (MOx). Oxygen present in the metal oxides has been recognized as surface active species of oxygen [55,58].
Table 2 shows the percentage contribution of oxygen atoms in MOx and SiO2 on the fresh and used catalysts. The amount of oxygen bound in the form of MOx is much greater for the fresh catalyst and the catalyst after the process in which the CH4 + O2 + He mixture was used, than on the catalysts used in the process with biogas as a feedstock—then the amount of surface oxygen species (associated with the metal ions—MOx) decreased significantly, i.e., by almost a half (in the case of both types of biogas).
Catalysts with lower Na and W ion concentrations on the surface also had lower MOx-bound oxygen concentrations. The concentration of Na and W ions, as well as O in MOx on the surface of the Mn-Na2WO4/SiO2 catalyst, was significantly lower when raw biogas was used, compared to the fresh catalyst and treated with the pure methane + oxygen mixture. At the same time, regardless of the type of biogas used (biogas1 or biogas2), the concentrations of Na, W, O in MOx were similar. This correlation, i.e., an increase in the concentration of O in MOx with an increase in the concentration of Na and W ions, was observed also by Shi et al. [55]. The changes in the surface concentration of Na, W and O in MOx on the catalyst are also influenced by the dilution of the feedstock with the CO2 and inert gas [55]. It can be concluded that the migration of Na and W to the catalyst surface increases the storage capacity of surface active oxygen species [55].
XPS experiments confirm the absence of sulphur- or nitrogen-containing compounds on the surface of used catalysts. Indeed Gu et al. [49] found the presence of Na2SO4, based on the XPS studies, but the contribution of H2S used in the research was very high, i.e., the share of H2S in the stream was 0.33% mol, while the share of H2S in biogas was 0–2000 ppm [11].
To determine the effect of surface carbonates on the catalytic behaviour of Mn-Na2WO4/SiO2, temperature-programmed desorption (TPD) of CO2 was carried out (Figure 3). In this experiment, a fresh Mn-Na2WO4/SiO2 sample was treated in a pure CO2 stream at various increasing temperatures (298, 923, 973, 1023, 1073, and 1123 K), and after cooling down, TPD profiles were recorded. All profiles in Figure 3 exhibit a small desorption maximum c.a. of 1100–1120 K, which confirms that the surface Na2CO3 is present at any investigated temperature. Semi-quantitative CO2-TPD results (inset to Figure 3) indicate that the concentration of surface carbonates decreases rapidly above 1073 K. This correlates with the poisoning effect of CO2 depicted in Figure S1A (Supplementary Materials) suggesting slight suppression of the OCM activity by high concentration of Na2CO3 on the surface of Mn-Na2WO4/SiO2. The poisoning effect of CO2 on CH4 conversion is cancelled out above 1073 K, when the concentration of the surface Na2CO3 decreases rapidly. The effect of CO2 on selectivity to C2+ is more complicated. Two inverse effects need to be considered. The first one, connected with the formation of less active and selective carbonates, is OCM retardation by surface poisoning. The second effect is positive probably due to the suppression of side reactions of methyl radicals with oxidized species. Such a promoting role of CO2 on selectivity was reported over the Li/MgO catalyst [63,64]. It was found that in the presence of CO2 the selectivity increases because the probability of methyl radicals coupling is enhanced with respect to the probability of their oxidation to CO2 via methoxide ions [63]. Our study indicates that the first poisoning effect predominates at low temperatures while the second positive effect dominates at high temperatures when the concentration of the surface Na2CO3 is relatively low.
2.2. Catalytic Performance
Figure 4 displays the temperature effect on the catalytic performance of Mn-Na2WO4/SiO2 in the presence of raw biogas (biogas 1) as a source of methane. The tests were carried out in the temperature range of 1013–1113 K. In the temperature range of 1013 K–1053 K, the conversion of methane, selectivity to C2 and the molar ratio ethylene/ethane increase with an increase in temperature. Above 1053 K, the selectivity to C2 decreases, and the conversion of methane in the temperature range of 1073 K–1113K does not change. At a molar ratio of CH4/O2 equal 3.3 and a volumetric flow rate of V = 77 cm3/min, when “biogas 1” was used as a feed, the optimal temperature range for the OCM process was 1053 K–1073K. These observations are consistent with the literature, which show that obtaining high ethylene yields in the OCM process carried out in the presence of the Mn-Na2WO4/SiO2 catalyst requires the use of high temperatures of 1053 K–1123 K [65,66]. The process of OCM is also significantly influenced by the methane/oxygen molar ratio in the feed stream. Tests are usually conducted at a methane/oxygen molar ratio of 2–7 [65,66,67], although it has been shown that in the presence of the Mn-Na2WO4/SiO2 catalyst the highest C2 yield can be achieved with a methane/oxygen ratio in the range of 2–4 [66,68]. A high concentration of oxygen in the feed stream favours the conversion of methane, as well as ethane, to ethylene dehydrogenation processes, hence the higher the ethylene/ethane ratio, the lower the methane/oxygen molar ratio. Unfortunately, a high concentration of oxygen in the feed stream also favours over oxidation reactions in which carbon oxides COx are formed, therefore, with an increase of the methane/oxygen molar ratio, the selectivity to C2 decreases [68]. This trend was also observed when biogas was used as a source of methane (Figure 5).
The addition of CO2 to the reaction stream exerts a small poisoning effect on methane conversion, but at the same time it promotes selectivity to C2+ (Figure S1). This effect rises with an increase in the partial pressure of CO2, however only for the low-pressure range (below 26 kPa). At a higher partial pressure of CO2, both the conversion of CH4 and selectivity to C2+ remain almost constant. As was mentioned above, the presence of CO2 in the stream inhibits the oxidation of CH4 and C2+ hydrocarbons to COx, probably by poisoning sites responsible for a deep oxidation that leading to an increase in C2 selectivity [69,70]. Contrary to this, the negative effect of CO2 is associated with the poisoning of the active sites for the coupling reaction. By competitive chemisorption of carbon dioxide and oxygen on the same active sites the amount of converted methane and the amount of C2+ products are reduced.
Often, the poisoning effect of CO2 is explained by blocking the active sites by surface carbonates generated in situ during the OCM process [71,72]. In the case of the mixed Mn-Na2WO4 catalysts, two carbonates, i.e., MnCO3 and Na2CO3, may be produced. However, under the OCM conditions, Na2CO3 is the only stable carbonate. Wang et al. [73] have reported that Na2CO3 decomposes between 773–1173 K. Moreover, based on the XPS data, they have estimated that in Mn-Na2WO4 containing catalysts, 20–40% of surface sodium cations are in the form of Na2CO3 after the process carried out at 1073 K [71]. In a classical OCM process, the carbonates originate from the CO2 produced in a total oxidation reaction, whereas the CO2 introduced intentionally into the stream of reagents can be an additional factor enhancing the concentration of surface Na2CO3 species leading to the observed changes in catalytic behaviour. Moreover, CO2 may have impact on the Mn-Na2WO4/SiO2 catalyst structure by changing the interaction between Na+ and WO42− as well as the structure of W species, that is, WO4 or WO6 [55]. Shi et al. [55] found that low concentrations of CO2 favour the formation selective in OCM Na2WO4 sites with tetrahedral WO4 sites, while increasing the CO2 concentration in the feed stream weakens Na+ and WO42− interaction and leads to generation less active and selective MnWO4.
The OCM process, which was carried out alternately using a gas stream with and without CO2 (Figure S2), showed that each time CO2 was added to reagents the stream selectivity to C2+ increased, while at the same time the conversion of methane decreased slightly. The effect of CO2 disappears after its removal from the reagents stream (replacing CO2 with an inert gas). This indicates clearly that under the experiment conditions CO2 does not modify the surface of Mn-Na2WO4/SiO2 permanently.
The effect of CO2 on the process also depends on temperature and oxygen concentration (Figure S3). Up to 1073 K, CO2 exerts a poisoning effect on the conversion of CH4, while above this temperature (at 1123 K) the conversion is similar for a process with and without CO2. The addition of CO2 has a similar poisoning effect on selectivity to C2+. In this case, however, starting from 1073 K, the CO2 addition promotes selectivity to C2+. This result indicates clearly that the negative effect of CO2 on OCM can be cancelled out by a temperature increase above 1073 K.
A significant influence of CO2 on the OCM process was also visible in the case of using raw biogas. Figure 6 shows the influence of the feed composition on selectivity to C2, the methane conversion and the ethylene/ethane molar ratio. A higher C2 selectivity was observed when CO2 was present in the stream, while the methane conversion and ethylene/ethane molar ratio were slightly lower than in the absence of carbon dioxide.
The highest selectivity to C2 was obtained by using “biogas 2”. Similar results were obtained when a mixture composed of pure components (i.e., methane, oxygen, carbon dioxide and helium), simulating the composition of biogas 2, was used. The use of a mixture devoid of carbon dioxide (CO2 was replaced with helium) resulted in decreasing the selectivity to C2 and increasing the conversion rate of methane. Similar results as in the case of the CH4 + O2 + He mixture were obtained with the use of raw “biogas 1”, i.e., a mixture poor in CO2. The methane conversion, regardless of the composition of feedstock used, differed slightly, i.e., by about 3%. In the tested period of time, regardless of the type of feedstock used, the Mn-Na2WO4/SiO2 catalyst worked stably (Figure 6).
The presence of an inert gas influences the catalytic performance in the OCM process as well. The results presented in Figure 7 were obtained using the feedstock diluted with helium and/or carbon dioxide and nitrogen (the presence of carbon dioxide and nitrogen results from its presence in biogas). The total contribution of these gases (helium, carbon dioxide and nitrogen) to the reaction mixture was 43% (vol.). Reducing the contribution of helium in the feed stream to less than 30% (vol.) while maintaining the volumetric flow rate (Figure 7) causes an increase in the methane conversion and the ethylene/ethane molar ratio, and decreases selectivity to C2. This effect is independent of the type of raw material used. Diluting the feed stream with helium, keeping the biogas/methane and oxygen flow rate constant, but increasing the total volumetric flow rate of the feed stream lowers the methane conversion and the ethylene/ethane molar ratio. Selectivity to C2, in the range up to 80 cm3 · min−1, increases with an increasing proportion of inert gas in the reaction mixture, and then decreases (Figure 6). Dilution of the reactants stream with inert gas had a negative effect on the methane conversion and the ethylene/ethane molar ratio, but a positive one on selectivity to C2. However, the positive effect on the selectivity to C2 was observed only when the contribution of helium to the feed stream was about 70%.
As shown in Figure 7, GHSV has an effect on the conversion of methane and selectivity to C2. Increasing the GHSV causes a decrease in the conversion of methane and the ethylene/ethane molar ratio, while increasing selectivity to C2. At low GHSV, the conversion of methane is low and the main product is C2H6 [74]. With the extension of the residence time, the conversion of methane and the selectivity to ethylene increase, but the selectivity to ethane lowers [74,75], because most of the C2H4 is formed via C2H6 [74].
3. Materials and Methods
3.1. Feedstock
Two types of raw, unpurified biogas were used for the research. Biogas obtained from plant materials, labelled “biogas 1” and biogas derived from waste of animal origin, labelled “biogas 2”, were used as feedstock. “Biogas 1” was made from potato pulp, beet pulp and Corn-Cob-Mix. Each of the raw materials was anaerobically digested in a separate glass reactors. The biogas obtained from the vegetable raw materials was mixed and labelled “biogas 1”. To produce “biogas 2”, waste from carp processing was used.
The collected waste was homogenized, and its moisture content and dry organic matter content were determined. The biomass was hydrated to 90% humidity, which is the optimal humidity for wet methane fermentation, and then placed in 2 dm3 fermenters, along with the inoculum. The support material was digestate from an agricultural biogas plant. Each batch was divided into four such fermenters plus a fermenter containing only the inoculum. The fermenter with inoculum was a reference object against which yields from each fermenter were compared. Thus, prepared fermenters were placed in a chamber with temperature control. Next, the samples were subjected to static methane fermentation, according to the methodology of DIM DIN 38414. It consisted of a single introduction of substrates into the fermentation chambers and the carrying out of the process until its completion. The pH in the fermenters was maintained at 6.5–6.9 due to the alkalinity of the fats present in the fermented biomass. The appropriate pH was maintained due to the inoculation additive. The methane fermentation process lasted 30 days. The gas resulting from methane fermentation was collected in variable volume tanks for each fermenter. The NANO SENS 60 m was used to measure the moisture content of the produced biogas and to determine its chemical composition. The results of the parameters of the process carried out were read daily at the same time and automatically saved to the computer disk using measuring software. Details on the process of obtaining biogas1 and biogas 2 have been described in the literature [78,79].
Biogas 1 and biogas2 composition were analysed using a gas chromatograph, the Agilent 6890N (Agilent Technology, Santa Clara, CA, USA) equipped with two columns (molecular sieve 5A for the analysis of N2, CO and O2 and Hayesep Q for the analysis of H2, CO2, and hydrocarbons) and TCD. Based on chromatographic analyses, the content of the main biogas components (ie CH4, CO2, N2 and O2) was determined. In “biogas1”, the volume ratio of CH4:CO2:O2:N2 = 1:0.34:0.014:0.052, and in “biogas2” it was CH4:CO2:O2:N2 = 1:0.57:0.016:0.06. Moreover, the following mixture was used for the tests: CH4 (99.95% Linde Gaz Polska) + O2 (99.96% Linde Gaz Polska) + CO2 (99.96% BOC-Gaz) + He (99.999%—BOC-Gaz), in which the contents of methane and carbon dioxide corresponded to those of biogas 2. Comparative tests were also carried out also using the mixture CH4 + O2 (99.95%)—Linde Gaz Polska + He (99.999%—BOC-Gaz).
3.2. Catalysts Preparation
The catalysts were prepared by the impregnation technique. Dry-silica gel pore size 60 A, 35–60 mesh particle size (Sigma-Aldrich) was impregnated at room temperature by the incipient wetness method with an aqueous solution of Mn(NO3)2 × 4H2O (97%, CHEMPUR) or/and Na2WO4 (99%, Aldrich,. In a typical procedure, 1 g of silica was impregnated with 1 cm3 of a solution containing desirable content of each salt needed for obtaining 2 and 5 wt% of Mn and Na2WO4, respectively. After impregnation the materials were dried for 15 h at 393 K and calcined at 1173 K for 8 h. The Mn-Na2WO4/SiO2 catalyst was obtained by impregnation of SiO2 in two steps with an aqueous solution of Mn(NO3)2 × 4H2O and Na2WO4 (Aldrich), respectively. After each impregnation, the materials were dried for 15 h at 393 K. The dried materials (after the second impregnation step) were calcined at 1173 K for 8 h. Obtained in this manner, catalysts were pelleted and crushed to obtain a fraction with a grain size of 0.2–0.3 mm.
3.3. Catalysts Characterization
Powder X-ray diffraction (XRD) patterns were collected on an X’Pert Pro instrument (Panalytical, Almelo, Netherlands) operated at 40 kV and 30 mA, equipped with a Cu Kα (λ = 0.154 nm) X-ray radiation source. The diffractograms were recorded in the 2θ range between 10° and 70° with a 2θ step size of 0.0167°.
Nitrogen adsorption-desorption isotherms were measured at 77 K using a ASAP 2020 instrument (Micrometrics, Norcross, GA, USA). The samples were degassed at 523 K before measurements for 12 h in a degas port of the sorption analyser. Specific surface areas were calculated using the Brunauer-Emmett-Teller (BET) method within the relative pressure range of P/P0 = 0.05–0.15. Total pore volumes were obtained from the amount of nitrogen adsorbed at P/P0 = 0.95 or near that value.
The analysis of the temperature programmed desorption of carbon dioxide (CO2-TPD) was conducted in the quartz micro-reactor using TCD. Before measurement each sample (1.00 g) of catalyst was outgassed at a temperature of 1223 K under a dry helium stream (1 h, VHe = 30 cm3/min.). After cooling to set temperature (298 K, 923 K, 973 K, 1023 K, 1073 K or 1123 K) an adsorption of pure CO2 was carried out at for 0.5 h. The excess of non-adsorbed CO2 was removed at the set temperature by flushing the sample with dry helium for 0.3 h. After that the temperature was lowered to 773 K and desorption of CO2 was carried out using a linear temperature rise with a ramp of 10 K/min.
A photoelectron spectrometer (ESCA/XPS) with an EA15 semispherical analyser (PREVAC, Rogów, Poland) was used for the XPS analysis. The source of Al Kα radiation (1486.6 eV) was the RS 40B1 lamp (PREVAC) with the power of 180 W. The spectra were processed with the program CasaXPS 2.3.15. The electron binding energy (BE) scale has been calibrated using the maximum of Si 2p3/2 signal with BE = 103.5 eV.
3.4. Catalytic Performance
Catalytic tests were carried out in a continuous flow quartz reactor with the following dimensions: (external diameter) × (length) × (wall thickness) = 10 × 270 × 1 mm. The weight of the catalyst was 400 mg (grain size 0.2–0.3 mm) and the temperature of the process was in the range between 1013 K and 1113 K (usually 1053 K). The methane/oxygen volumetric ratio was from 1.4 to 6.3 (typically CH4/O2 = 3.3), and the total volumetric flow rate was 77 cm3/min unless stated otherwise. The products of the reaction and the unreacted substrates were analysed using the Agilent 6890N gas chromatograph (Agilent Technology, Santa Clara, CA, USA) equipped with two columns (molecular sieve 5A for the analysis of N2, CO and O2 and Hayesep Q for the analysis of H2, CO2, and hydrocarbons) and TCD.
The conversion of methane () and selectivity to C2+ () were calculated according to the following formulas:
where: and are numbers of methane moles in the inlet and outlet of the reactor, respectively; is a number of moles of the i-th product in the outlet and ai is a number of carbon atoms in the “i” product (ethane, ethene, propane and propene).
Carbon balance in the catalytic tests was above 95%.
4. Conclusions
Unpurified biogas originating from two different raw materials was used as a feedstock in the oxidative coupling of methane. For comparison, a pure methane-based feedstock was investigated as well. The physicochemical analysis reveals small differences in the phase and chemical composition of Mn-Na2WO4/SiO2 after the OCM process in which unpurified biogas and pure methane were applied. The surface concentration of Na, W and O in (MOx) on the Mn-Na2WO4/SiO2 catalyst was lower when biogas 1 or biogas 2 were used as a feedstock. Moreover, XPS study revealed the absence of sulphur on the surface of used catalysts in the OCM process with both biogases. This indicates that under OCM conditions, sulphur-containing compounds from both studied unpurified biogas did not poisoning catalyst.
The catalytic investigation has revealed that the type of feedstock used as the source of methane has a relatively small influence on the conversion of methane. The differences in methane conversion between all tested feedstock was below 3%. On the other hand, a more significant difference was observed in selectivity to C2. Depending on the feedstock, the differences in selectivity to C2 reaches 9%. Moreover, it was found that the CO2 that is one of the main components of biogas has influence on catalytic performance in the OCM process. The appropriate selection of process conditions, particularly the temperature (above 1073 K) and the CH4/O2 molar ratio (above 3.8) in feedstock, allows for the directing of the process in such a way that the presence of CO2 has a beneficial effect on the C2 selectivity and, at the same time, does not reduce the methane conversion.
Supplementary Materials
The following supporting information can be downloaded at: https://www.mdpi.com/article/10.3390/catal12010054/s1, Figure S1: (a) Variation of methane conversion andvselectivity to C2+ with partial pressure of CO2 over Mn-Na2WO4/SiO2 catalyst. Figure S2: Variation of conversion of CH4 and selectivity to C2+ with time-on-stream during repeatable switching on CO2 during OCM process over the Mn-Na2WO4/SiO2 catalyst. Figure S3: Variation of methane conversion and selectivity to C2+ with temperature in the OCM process carried out with and without CO2 over Mn-Na2WO4/SiO2 catalyst.
Author Contributions
Conceptualization, B.M., B.K.-Ł. and I.C.; methodology, B.M. and J.S.; validation, B.M., J.S. and D.G.; formal analysis, B.M., B.K.-Ł. and I.C.; investigation, B.M., J.S. and D.G.; resources, J.S.; data curation, B.M.; writing—original draft preparation, B.M.; writing—review and editing, B.M. and I.C.; visualization, B.M.; supervision, I.C. and B.K.-Ł. All authors have read and agreed to the published version of the manuscript.
Funding
This research received no external funding.
Conflicts of Interest
The authors declare no conflict of interest.
References
- Ali, M.M.; Ndongo, M.; Bilal, B.; Yetilmezsoy, K.; Youm, I.; Bahramian, M. Mapping of biogas production potential from livestock manures and slaughterhouse waste: A case study for African countries. J. Clean. Prod. 2020, 256, 120499. [Google Scholar] [CrossRef]
- Kazimierowicz, A.; Dzienis, L.; Dębowski, M.; Zieliński, M. Optimisation of methane fermentation as a valorisation method for food waste products. Biomass Bioenergy 2021, 144, 105913. [Google Scholar] [CrossRef]
- Otero, A.; Mendoza, M.; Carreras, R.; Fernandez, B. Biogas production from slaughterhouse waste: Effect of blood content and fat saponification. Waste Manag. 2021, 133, 119–126. [Google Scholar] [CrossRef]
- Kazimierowicz, J.; Bartkowska, I.; Walery, M. Effect of Low-Temperature Conditioning of Excess Dairy Sewage Sludge with the Use of Solidified Carbon Dioxide on the Efficiency of Methane Fermentation. Energies 2021, 14, 150. [Google Scholar] [CrossRef]
- Kazimierowicz, J.; Dzienis, L. Giant Miscanthus as a Substrate for Biogas Production. J. Ecol. Eng. 2015, 16, 139–142. [Google Scholar] [CrossRef]
- Yang, Q.; Wu, B.; Yao, F.; He, L.; Chen, F.; Ma, Y.; Shu, X.; Hou, K.; Wang, D.; Li, X. Biogas production from anaerobic co-digestion of waste activated sludge: Co-substrates and influencing parameters. Rev. Environ. Sci. Biotechnol. 2019, 18, 771–793. [Google Scholar] [CrossRef]
- Bücker, F.; Marder, M.; Peiter, M.R.; Neutzling Lehn, D.; Mendonça Esquerdo, V.; de Almeida Pinto, L.A.; Konrad, O. Fish waste: An efficient alternative to biogas and methane production in an anaerobic mono-digestion system. Renew. Energy 2020, 147, 798–805. [Google Scholar] [CrossRef]
- Rasi, S.; Läntelä, J.; Rintala, J. Trace compounds affecting biogas energy utilisation—A review. Energy Convers. Manag. 2011, 52, 3369–3375. [Google Scholar] [CrossRef]
- Li, Y.; Alaimo, C.P.; Kim, M.; Kado, N.Y.; Peppers, J.; Xue, J.; Wan, C.; Green, P.G.; Zhang, R.; Jenkins, B.M.; et al. Composition and Toxicity of Biogas Produced from Different Feedstocks in California. Environ. Sci. Technol. 2019, 53, 11569–11579. [Google Scholar] [CrossRef]
- Calbry-Muzyka, A.; Madi, H.; Rüsch-Pfund, F.; Gandiglio, M.; Biollaz, S. Biogas composition from agricultural sources and organic fraction of municipal solid waste. Renew. Energy 2022, 181, 1000–1007. [Google Scholar] [CrossRef]
- Yang, L.; Ge, X.; Wan, C.; Yu, F.; Li, Y. Progress and perspectives in converting biogas to transportation fuels. Renew. Sust. Energ. Rev. 2014, 40, 1133–1152. [Google Scholar] [CrossRef]
- Calbry-Muzyka, A.S.; Schildhauer, T.J. Direct Methanation of Biogas—Technical Challenges and Recent Progress. Front. Energy Res. 2020, 8, 570887. [Google Scholar] [CrossRef]
- Dannesboe, C.; Bøgild Hansen, J.; Johannsen, I. Catalytic methanation of CO2 in biogas: Experimental results from a reactor at full scale. React. Chem. Eng. 2020, 5, 183–189. [Google Scholar] [CrossRef] [Green Version]
- Han, D.; Kim, Y.; Byun, H.; Cho, W.; Baek, Y. CO2 Methanation of Biogas over 20 wt% Ni-Mg-Al Catalyst: On the Effect of N2, CH4, and O2 on CO2 Conversion Rate. Catalysts 2020, 10, 1201. [Google Scholar] [CrossRef]
- Baena-Moreno, F.M.; Sebastia-Saez, D.; Wang, Q.; Reina, T.R. Is the production of biofuels and bio-chemicals always profitable? Co-production of biomethane and urea from biogas as case study. Energy Convers. Manag. 2020, 220, 113058. [Google Scholar] [CrossRef]
- Nahar, G.; Mote, D.; Dupont, V. Hydrogen production from reforming of biogas: Review of technological advances and an Indian perspective. Renew. Sust. Energ. Rev. 2017, 76, 1032–1052. [Google Scholar] [CrossRef]
- Minutillo, M.; Perna, A.; Sorce, A. Green hydrogen production plants via biogas steam and autothermal reforming processes: Energy and exergy analyses. Appl. Energy 2020, 277, 115452. [Google Scholar] [CrossRef]
- Renda, S.; Ricca, A.; Palma, V. Coke-Resistant Rh and Ni Catalysts Supported on γ-Al2O3 and CeO2 for Biogas Oxidative Steam Reforming. Chem. Proc. 2020, 2, 10. [Google Scholar]
- Zhumabek, M.; Xanthopoulou, G.; Tungatarova, S.A.; Baizhumanova, T.S.; Vekinis, G.; Murzin, D.Y. Biogas Reforming over Al-Co Catalyst Prepared by Solution Combustion Synthesis Method. Catalysts 2021, 11, 274. [Google Scholar] [CrossRef]
- Goula, M.A.; Charisiou, N.D.; Siakavelas, G.; Tzounis, L.; Tsiaoussis, I.; Panagiotopoulou, P.; Goula, G.; Yentekakis, I.V. Syngas production via the biogas dry reforming reaction over Ni supported on zirconia modified with CeO2 or La2O3 catalysts. Int. J. Hydrog. Energy 2017, 42, 13724–13740. [Google Scholar] [CrossRef]
- Moral, A.; Reyero, I.; Alfaro, C.; Bimbela, F.; Gandía, L.M. Syngas production by means of biogas catalytic partial oxidation and dry reforming using Rh-based catalysts. Catal. Today 2018, 299, 280–288. [Google Scholar] [CrossRef]
- Habibi, N.; Wang, Y.; Arandiyan, H.; Rezaei, M. Effect of substitution by Ni in MgAl2O4 spinel for biogas dry reforming. Int. J. Hydrog. Energy 2017, 42, 24159–24168. [Google Scholar] [CrossRef]
- Madeira, J.G.F.; Boloy, R.A.M.; Delgado, A.R.S.; Lima, F.R.; Coutinho, E.R.; de Castro Pereira Filho, R. Ecological analysis of hydrogen production via biogas steam reforming from cassava flour processing wastewater. J. Clean. Prod. 2017, 162, 709–716. [Google Scholar] [CrossRef]
- Yao, J.; Kraussler, M.; Benedikt, F.; Hofbauer, H. Techno-economic assessment of hydrogen production based on dual fluidized bed biomass steam gasification, biogas steam reforming, and alkaline water electrolysis processes. Energy Convers. Manag. 2017, 145, 278–292. [Google Scholar] [CrossRef]
- Zeng, Y.X.; Wang, L.; Wuc, C.F.; Wang, J.Q.; Shen, B.X.; Tu, X. Low temperature reforming of biogas over K-, Mg- and Ce-promoted Ni/Al2O3 catalysts for the production of hydrogen rich syngas: Understanding the plasma-catalytic synergy. Appl. Catal. B 2018, 224, 469–478. [Google Scholar] [CrossRef] [Green Version]
- Kan, X.; Zhou, D.; Yang, W.; Zhai, X.; Wang, C.H. An investigation on utilization of biogas and syngas produced from biomass waste in premixed spark ignition engine. Appl. Energy 2018, 212, 210–222. [Google Scholar] [CrossRef]
- Chiodo, V.; Maisano, S.; Zafarana, G.; Urbani, F. Effect of pollutants on biogas steam reforming. Int. J. Hydrog. Energy 2017, 42, 1622–1628. [Google Scholar] [CrossRef]
- Gao, Y.; Jiang, J.; Meng, Y.; Yan, F.; Aihemaiti, A. A review of recent developments in hydrogen production via biogas dry Reforming. Energy Convers. Manag. 2018, 171, 133–155. [Google Scholar] [CrossRef]
- Elsayed, N.H.; Elwell, A.; Joseph, B.; Kuhn, J.N. Effect of silicon poisoning on catalytic dry reforming of simulated biogas. Appl. Catal. A Gen. 2017, 538, 157–164. [Google Scholar] [CrossRef]
- Chein, R.; Yang, Z.W. H2S effect on dry reforming of biogas for syngas production. Int. J. Energy Res. 2019, 43, 3330–3345. [Google Scholar] [CrossRef]
- Gunnerman, R.W.; Gunnerman, P.W. Process for Conversion of Biogas to Liquid Fuels. U.S. Patent 20110000128A1, 6 January 2011. [Google Scholar]
- Ge, X.; Yang, L.; Sheets, J.P.; Yu, Z.; Li, Y. Biological conversion of methane to liquid fuels: Status and opportunities. Biotechnol. Adv. 2014, 32, 1460–1475. [Google Scholar] [CrossRef]
- Patel, S.K.S.; Mardina, P.; Kim, D.; Kim, S.Y.; Kalia, V.C.; Kim, I.W.; Lee, J.K. Improvement in methanol production by regulating the composition of synthetic gas mixture and raw biogas. Bioresour. Technol. 2016, 218, 202–208. [Google Scholar] [CrossRef]
- Sheets, J.P.; Ge, X.; Li, Y.F.; Yu, Z.; Li, Y. Biological conversion of biogas to methanol using methanotrophs isolated from solid-state anaerobic digestate. Bioresour. Technol. 2016, 201, 50–57. [Google Scholar] [CrossRef] [Green Version]
- Abatzoglou, N.; Boivin, S. A review of biogas purification Processes. Biofuels Bioprod. Bioref. 2009, 3, 42–71. [Google Scholar] [CrossRef]
- Miltner, M.; Makaruk, A.; Harasek, M. Review on available biogas upgrading technologies and innovations towards advanced solutions. J. Clean. Prod. 2017, 161, 1329–1337. [Google Scholar] [CrossRef]
- Angelidaki, I.; Treu, L.; Tsapekos, P.; Luo, G.; Campanaro, S.; Wenzel, H.; Kougias, P.G. Biogas upgrading and utilization: Current status and perspectives. Biotechnol. Adv. 2018, 36, 452–466. [Google Scholar] [CrossRef] [Green Version]
- Kapoor, R.; Ghosh, P.; Tyagi, B.; Vijay, V.K.; Vijay, V.; Thakur, I.S.; Kamyab, H.; Nguyen, D.D.; Kumar, A. Advances in biogas valorization and utilization and utilization system: A comprehensive review. J. Clean. Prod. 2020, 273, 123052. [Google Scholar] [CrossRef]
- Adnan, A.I.; Ong, M.Y.; Nomanbhay, S.; Chew, K.W.; Show, P.L. Technologies for Biogas Upgrading to Biomethane: A Review. Bioengineering 2019, 6, 92. [Google Scholar] [CrossRef] [Green Version]
- Budzianowski, W.M. A review of potential innovations for production, conditioning and utilization of biogas with multiple-criteria assessment. Renew. Sust. Energ. Rev. 2016, 54, 1148–1171. [Google Scholar] [CrossRef]
- Khan, I.U.; Othman, M.H.D.; Hashim, H.; Matsuura, T.; Ismail, A.F.; Rezaei-Dasht Arzhandi, M.; Azelee, I.W. Biogas as a renewable energy fuel—A review of biogas upgrading, utilisation and storage. Energy Convers. Manag. 2017, 150, 277–294. [Google Scholar] [CrossRef]
- Sun, Q.; Li, H.; Yan, J.; Liu, L.; Yu, Z.; Yu, X. Selection of appropriate biogas upgrading technology—A review of biogas cleaning, upgrading and utilisation. Renew. Sust. Energ. Rev. 2015, 51, 521–532. [Google Scholar] [CrossRef]
- Awe, O.W.; Zhao, Y.; Nzihou, A.; Minh, D.P.; Lyczko, N. A Review of Biogas Utilisation, Purification and Upgrading Technologies. Waste Biomass Valor. 2017, 8, 267–283. [Google Scholar] [CrossRef] [Green Version]
- Scarlat, N.; Dallemand, J.-F.; Fahl, F. Biogas: Developments and perspectives in Europe. Renew. Energy 2018, 129, 457–472. [Google Scholar] [CrossRef]
- Yentekakis, I.V.; Goula, G. Biogas Management: Advanced Utilization for Production of Renewable Energy and Added-value Chemicals. Front. Environ. Sci. 2017, 5, 7. [Google Scholar] [CrossRef] [Green Version]
- Abanades, S.; Abbaspour, H.; Ahmadi, A.; Das, B.; Ehyaei, M.A.; Esmaeilion, F.; Assad, M.E.H.; Hajilounezhad, T.; Jamali, D.H.; Hmida, A.; et al. A critical review of biogas production and usage with legislations framework across the globe. Int. J. Environ. Sci. Technol. 2021, 1–24. [Google Scholar] [CrossRef]
- Penteado, A.T.; Kim, M.; Godini, H.R.; Esche, E.; Repke, J.-U. Biogas as a Renewable Feedstock for Green Ethylene Production via Oxidative Coupling of Methane: Preliminary Feasibility Study. Chem. Eng. Trans. 2017, 61, 589–594. [Google Scholar]
- Penteado, A.T.; Kim, M.; Godini, H.R.; Esche, E.; Repke, J.-U. Techno-economic evaluation of a biogas-based oxidative coupling of methane process for ethylene production. Front. Chem. Sci. Eng. 2018, 12, 598–618. [Google Scholar]
- Gu, S.; Choi, J.-W.; Suh, D.J.; Park, Y.-K.; Choi, J.; Ha, J.-M. Upgrading of sulfur-containing biogas into high quality fuel via oxidative coupling of methane. Int. J. Energy Res. 2021, 45, 19363–19377. [Google Scholar] [CrossRef]
- Sokolov, S.; Seeburg, D.; Wohlrab, S.; Friedel, M.; Nitzsche, J.; Kondratenko, E.V. An Approach Using Oxidative Coupling of Methane for Converting Biogas and Acid Natural Gas into High-Calorific Fuels. Ind. Eng. Chem. Res. 2019, 58, 2454–2459. [Google Scholar] [CrossRef]
- Pak, S.; Lunsford, J. Thermal effects during the oxidative coupling of methane over Mn/Na2WO4/SiO2 and Mn/Na2WO4/MgO catalysts. Appl. Catal. A Gen. 1998, 168, 131–137. [Google Scholar] [CrossRef]
- Michorczyk, B.; Ogonowski, J.; Michorczyk, P. Oxidative coupling of methane in the presence of various gaseous additives. Przemysł. Chem. 2015, 94, 572–576. [Google Scholar]
- Takanabe, K.; Iglesia, E. Rate and Selectivity Enhancements Mediated by OH Radicals in the Oxidative Coupling of Methane Catalyzed by Mn/Na2WO4/SiO2. Angew. Chem. Int. Ed. 2008, 47, 7689–7693. [Google Scholar] [CrossRef]
- Takanabe, K.; Iglesia, E. Mechanistic Aspects and Reaction Pathways for Oxidative Coupling of Methane on Mn/Na2WO4/SiO2 Catalysts. J. Phys. Chem. C 2009, 113, 10131–10145. [Google Scholar] [CrossRef] [Green Version]
- Shi, J.; Yao, L.; Hu, C. Effect of CO2 on the structural variation of Na2WO4/Mn/SiO2 catalyst for oxidative coupling of methane to ethylene. J. Energy Chem. 2015, 24, 394–400. [Google Scholar] [CrossRef]
- Jiang, Z.C.; Yu, C.J.; Fang, X.P.; Li, S.B.; Wang, H.L. Oxide/Support Interaction and Surface Reconstruction in the Na2WO4/SiO2 System. J. Phys. Chem. 1993, 97, 12870–12875. [Google Scholar] [CrossRef]
- Palermo, A.; Vazquezy, J.P.H.; Lee, A.F.; Tikhov, M.S.; Lambert, R.M. Critical influence of the amorphous silica-to-cristobalite phase transition on the performance of Mn/Na2WO4/SiO2 catalysts for the oxidative coupling of methane. J. Catal. 1998, 177, 259–266. [Google Scholar] [CrossRef]
- Wu, J.; Li, S.; Niu, J.; Fang, X. Mechanistic Study of Oxidative Coupling of Methane over Mn2O3-Na2WO4/SiO2 Catalyst. Appl. Catal. A Gen. 1995, 124, 9–18. [Google Scholar] [CrossRef]
- Chua, Y.; Mohamed, A.; Bhatia, S. Oxidative coupling of methane for the production of ethylene over sodium-tungsten-manganese-supported-silica catalyst (Na-W-Mn/SiO2). Appl. Catal. A Gen. 2008, 343, 142–148. [Google Scholar] [CrossRef]
- Zhang, H.; Wu, J.; Qin, S.; Hu, C. Study of the effect of gas space time on the combination of methane gas-phase oxidation and catalytic oxidative coupling over Mn/Na2WO4/SiO2 catalyst. Ind. Eng. Chem. Res. 2006, 45, 7090–7095. [Google Scholar] [CrossRef]
- Yan, Q.; Wang, Y.; Jin, Y.; Chen, Y. Methane oxidative coupling over Na2WO4/SiO2. Catal. Lett. 1992, 13, 221–228. [Google Scholar] [CrossRef]
- Fleischer, V.; Simon, U.; Parishan, S.; Colmenares, M.G.; Görke, O.; Gurlo, A.; Riedel, W.; Thum, L.; Schmidt, J.; Risse, T.; et al. Investigation of the role of the Na2WO4/Mn/SiO2 catalyst composition in the oxidative coupling of methane by chemical looping experiments. J. Catal. 2018, 360, 102–117. [Google Scholar] [CrossRef]
- Wang, D.; Xu, M.; Shi, C.; Lunsford, J.H. Effect of carbon dioxide on the selectivities obtained during the partial oxidation of methane and ethane over Li+/MgO catalysts. Catal. Lett. 1993, 18, 323–328. [Google Scholar] [CrossRef]
- Aika, K.; Nishiyama, T. Utilisation of CO2 in the oxidative coupling of methane over PbO-MgO and PbO-CaO. Chem. Commun. 1988, 1, 70–71. [Google Scholar] [CrossRef]
- Thien, C.Y.; Mohamed, A.R.; Bhatia, S. Process optimization of oxidative coupling of methane for ethylene production using response surface methodology. J. Chem. Technol. Biotechnol. 2007, 82, 81–91. [Google Scholar] [CrossRef]
- Ehsani, M.R.; Bateni, H.; Parchikolaei, G.R. Modeling the oxidative coupling of methane using artificial neural network and optimizing of its operational conditions using genetic algorithm. Korean J. Chem. Eng. 2012, 29, 855–861. [Google Scholar] [CrossRef]
- Murthy, P.R.; Liu, Y.; Wu, G.; Diao, Y.; Shi, C. Oxidative Coupling of Methane: Perspective for High-Value C2 Chemicals. Crystals 2021, 11, 1011–1030. [Google Scholar] [CrossRef]
- Yoon, S.; Lim, S.; Choi, J.-W.; Suh, D.J.; Song, K.H.; Ha, J.-M. Study on the unsteady state oxidative coupling of methane: Effects of oxygen species from O2, surface lattice oxygen, and CO2 on the C2+ selectivity. RSC Adv. 2020, 10, 35889–35897. [Google Scholar] [CrossRef]
- Papa, F.; Gingasu, D.; Patron, L.; Miyazaki, A.; Balint, I. On the nature of active sites and catalytic activity for OCM reaction of alkaline-earth oxides-neodymia catalytic systems. Appl. Catal. A Gen. 2010, 375, 172–178. [Google Scholar] [CrossRef]
- Suzuki, T.; Wada, K.; Watanabe, Y. Effects of carbon dioxide and catalyst preparation on the oxidative dimerization of methane. Appl. Catal. A Gen. 1990, 59, 213–225. [Google Scholar] [CrossRef]
- Dissanayake, D.; Lunsford, J.H.; Rosynek, M.P. Oxidative coupling of methane over oxide-supported barium catalysts. J. Catal. 1993, 143, 286–298. [Google Scholar] [CrossRef]
- Korf, S.J.; Roos, J.A.; de Bruijn, N.A.; van Ommen, J.G.; Ross, J.R.H. Influence of CO2 on the oxidative coupling of methane over a lithium promoted magnesium oxide catalyst. Chem. Commun. 1987, 19, 1433–1434. [Google Scholar] [CrossRef]
- Wang, D.; Rosynek, M.P.; Lunsford, J.H. Oxidative coupling of methane over oxide-supported sodium-manganese catalysts. J. Catal. 1995, 155, 390–402. [Google Scholar] [CrossRef]
- Pak, S.; Qiu, P.; Lunsford, J.H. Elementary Reactions in the Oxidative Coupling of Methane over Mn/Na2WO4/SiO2 and Mn/Na2WO4/MgO Catalysts. J. Catal. 1998, 179, 222–230. [Google Scholar] [CrossRef]
- Daneshpayeh, M.; Khodadadi, A.; Mostoufi, N.; Mortazavi, Y.; Sotudeh-Gharebagh, R.; Talebizadeh, A. Kinetic modeling of oxidative coupling of methane over Mn/Na2WO4/SiO2 catalyst. Fuel Process. Technol. 2009, 90, 403–410. [Google Scholar] [CrossRef]
- Bogdan, B.; Michorczyk, B.; Rokicińska, A.; Basta, M.; Myradova, M.; Kuśtrowski, P.; Michorczyk, P. Monolithic composites with geometry controlled by polymeric 3D printed templates: Characterization and catalytic performance in OCM. Appl. Surf. Sci. 2021, 553, 149554. [Google Scholar] [CrossRef]
- Michorczyk, P.; Hędrzak, E.; Węgrzyniak, A. Preparation of monolithic catalysts using 3D printed templates for oxidative coupling of methane. J. Mater. Chem. A 2016, 4, 18753–18756. [Google Scholar] [CrossRef]
- Sikora, J.; Mruk, B. Quantitative and qualitative analysis of biogas emitted from batches composed on the basis of available factions on the farm. Infrastruct. Ecol. Rural. Areas 2016, 3, 907–917. [Google Scholar]
- Sikora, J.; Niemiec, M.; Szeląg-Sikora, A.; Kuboń, M.; Olech, E.; Marczuk, A. Biogasification of wastes from industrial processing of carps. Przemysł. Chem. 2017, 96, 2275–2278. [Google Scholar]
Figure 1.
XRD patterns of (a) fresh (A) SiO2, (B) Mn/SiO2, (C) Na2WO4/SiO2 and (D) Mn-Na2WO4/SiO2 samples and (b) Mn-Na2WO4/SiO2 samples after OCM process using mixture of (A) biogas1 + O2 + He and (B) biogas2 + O2 + He (C) CH4 + O2 + He, (D) CH4 + O2 + CO2 + He. Reaction conditions: T = 1053 K; GHSV = 11,550 cm3 · g−1cat · h−1; mcat = 400 mg; total flow rate = 77 cm3 · min−1; molar ratio (in all cases); VCH4:VO2:VHe + CO2 + N2 =14.4:4.3:58.3; Reaction time = 220 min.
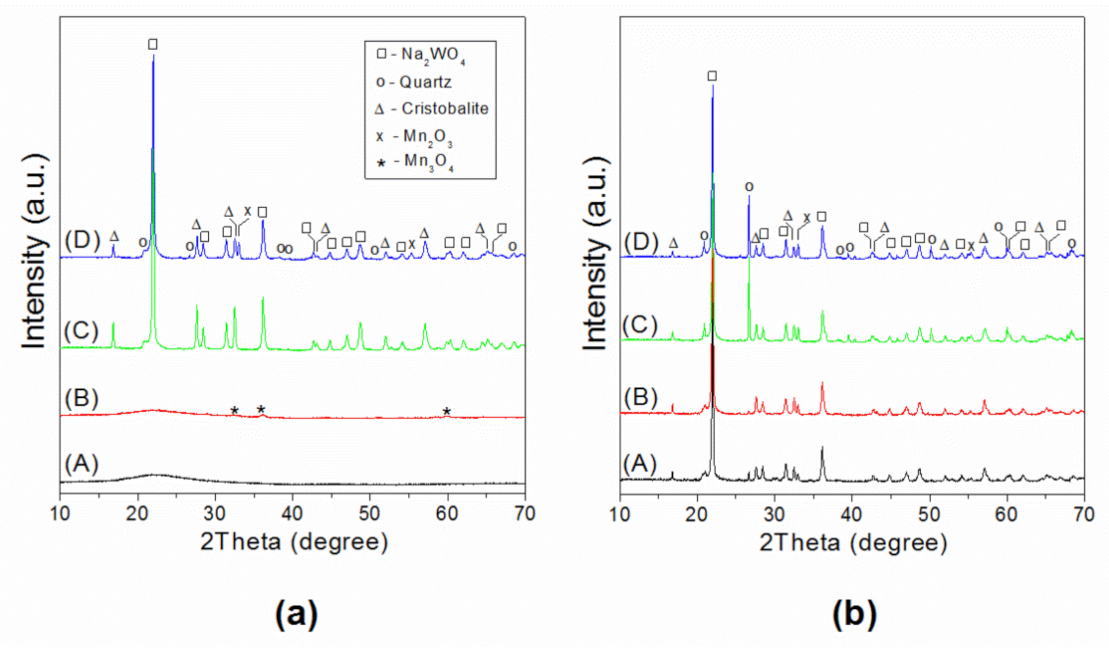
Figure 2.
XPS spectra of (a) Mn 2p, (b) W 4f and (c) O 1s level for fresh and used Mn-Na2WO4/SiO2 catalysts. (A) fresh catalyst; (B) used catalyst—feedstock biogas 1 + O2 + He, (C) used catalyst—feedstock biogas 2 + O2 + He, (D) used catalyst—feedstock CH4 + O2 + He.
Figure 2.
XPS spectra of (a) Mn 2p, (b) W 4f and (c) O 1s level for fresh and used Mn-Na2WO4/SiO2 catalysts. (A) fresh catalyst; (B) used catalyst—feedstock biogas 1 + O2 + He, (C) used catalyst—feedstock biogas 2 + O2 + He, (D) used catalyst—feedstock CH4 + O2 + He.

Figure 3.
Temperature-programmed desorption of CO2 for the Mn-Na2WO4/SiO2 sample. Experiment conditions: heating rate 10 K/min; CO2 adsorption temperatures: (A) 298, (B) 923, (C) 973, (D) 1023, (E) 1073 and (F) 1123 K.
Figure 3.
Temperature-programmed desorption of CO2 for the Mn-Na2WO4/SiO2 sample. Experiment conditions: heating rate 10 K/min; CO2 adsorption temperatures: (A) 298, (B) 923, (C) 973, (D) 1023, (E) 1073 and (F) 1123 K.
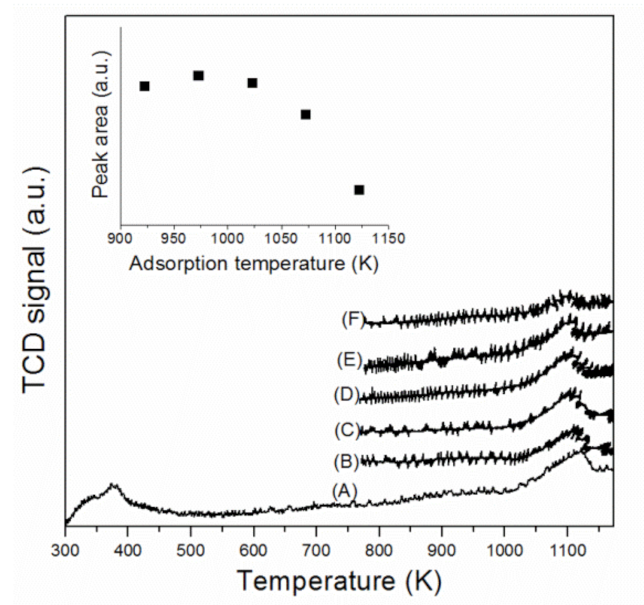
Figure 4.
The influence of temperature on the OCM process. Source of methane—“biogas 1”. Reaction conditions: GHSV = 11550 cm3 · g−1cat · h−1; mcat = 400 mg; molar ratio of CH4:O2:CO2:He + N2 = 3.3:1:1.2:12.4; total flow rate = 77 cm3 · min−1.
Figure 4.
The influence of temperature on the OCM process. Source of methane—“biogas 1”. Reaction conditions: GHSV = 11550 cm3 · g−1cat · h−1; mcat = 400 mg; molar ratio of CH4:O2:CO2:He + N2 = 3.3:1:1.2:12.4; total flow rate = 77 cm3 · min−1.

Figure 5.
Influence of the methane/oxygen molar ratio on the OCM process. Source of methane—”biogas 1”. Reaction conditions: T = 1053 K; GHSV = 11550 cm3 · g−1cat · h−1; mcat = 400 mg; total flow rate = 77 cm3 · min−1, molar ratio of CH4:O2:CO2:He + N2 = 1.4:1:0.5:4.6; CH4:O2:CO2:He + N2= 2.3:1:0.8:8.1; CH4:O2:CO2:He + N2 = 3.3:1:1.2:12.4; CH4:O2:CO2:He + N2 = 6.3:1:2.2:24:25.
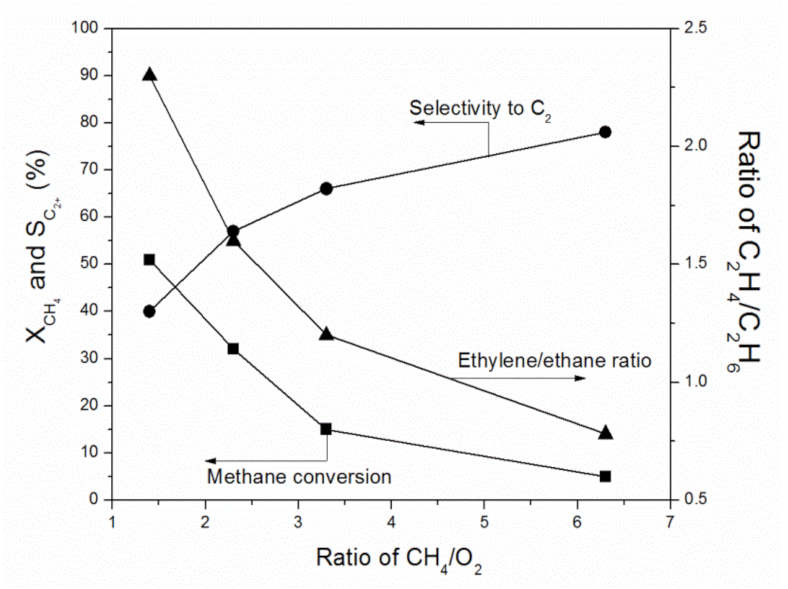
Figure 6.
Influence of feedstock composition on methane conversion, selectivity to C2 and ethylene/ethane molar ratio. Reaction conditions: T = 1053 K; GHSV = 11,550 cm3 · g−1cat · h−1; mcat = 400 mg; total flow rate = 77 cm3 · min−1; molar ratio of CH4:O2 = 3.3 (in all cases); VCH4:VO2:VHe + CO2 + N2 = 14.4:4.3:58.3. Symbols: (■) biogas 1 (as source of methane), (▲) biogas 2 (as source of methane), (●) mixture of CH4 + CO2 + O2 + He, (★) mixture of CH4 + O2 + He.
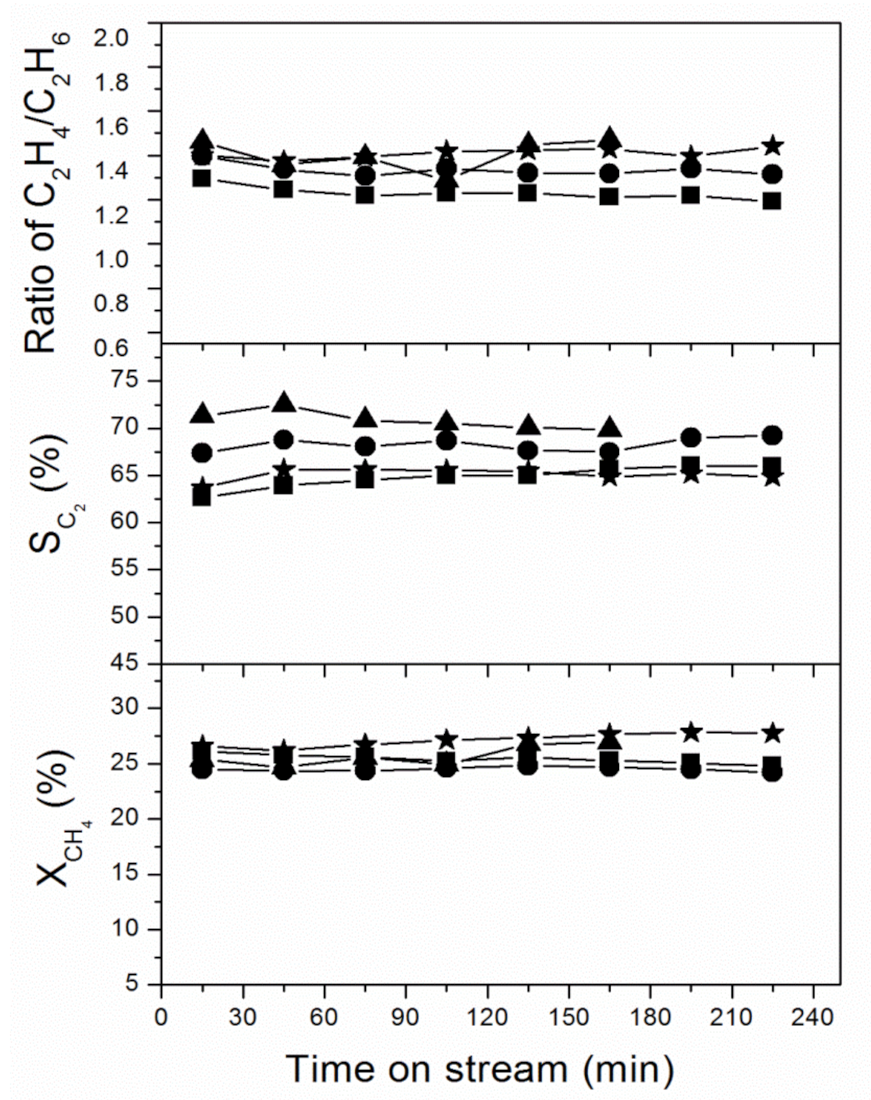
Figure 7.
Influence of diluting feedstock with inert gas (helium) on the OCM process. Reaction conditions: T = 1053 K; mcat = 400 mg; molar ratio of CH4:O2 = 3.3 (in all cases); total flow rate = 77 cm3 · min−1; VCH4:VO2 = 14.4:4.3 (solid line); VCH4:VO2: = 37.8:11.3 (dotted line). Symbols: (■) biogas 1 (as source of methane), (▲) biogas 2 (as source of methane), (●) mixture of CH4 + CO2 + O2 + He, (★) mixture of CH4 + O2 + He.


Table 1.
Porosity and phase composition of fresh and used catalysts a.
| Sample | SBET (m2g−1) | VTotal (cm3g−1) |
|---|---|---|
| SiO2 | 474 | 0.83 |
| Mn/SiO2 | 427 | 0.78 |
| Na2WO4/SiO2 | 2.1 | <0.01 |
| Mn-Na2WO4/SiO2 | 1.9 | <0.01 |
| Mn-Na2WO4/SiO2 a | 1.9 | <0.01 |
| Mn-Na2WO4/SiO2 b | 2.0 | <0.01 |
| Mn-Na2WO4/SiO2 c | 1.9 | <0.01 |
| Mn-Na2WO4/SiO2 d | 1.9 | <0.01 |
a Used sample after process with mixture of CH4 + O2 + He (for all used catalysts the reaction conditions in caption to Figure 1). b Used sample after process with mixture of CH4 + CO2 + O2 + He. c Used sample after process with mixture of biogas 1 + O2 + He. d Used sample after process with mixture of biogas 2 + O2 + He.
Table 2.
XPS results for fresh and used Mn-Na2WO4/SiO2 catalysts a.
| Feedstock | Na (1s) | W (4f) | Mn (2p) | O (1s) SiO2 | O (1s) MOx | |||||
|---|---|---|---|---|---|---|---|---|---|---|
| BE (eV) | In (at %) | BE (eV) | In (at.%) | BE (eV) | In (at.%) | BE (eV) | In (at.%) | BE (eV) | In (at.%) | |
| Fresh catalyst | 1071.7 | 4.48 | 36.0 | 0.71 | 642.7 | 0.62 | 533.1 | 30.96 | 530.7 | 9.25 |
| CH4 + O2 +He | 1071.7 | 4.89 | 36.0 | 0.82 | 642.5 | 1.57 | 533.0 | 45.71 | 530.6 | 12.9 |
| Biogas 1 + O2 + He | 1071.9 | 2.24 | 35.9 | 0.61 | 641.6 | 0.96 | 533.0 | 55.22 | 530.7 | 6.37 |
| Biogas 2 + O2 + He | 1072.1 | 3.27 | 35.9 | 0.58 | 642.1 | 1.16 | 532.8 | 54.37 | 530.5 | 7.22 |
a Used samples after OCM reaction carried out at T = 1053 K; GHSV = 11550 cm3 · g−1cat · h−1; mcat = 400 mg; total flow rate = 77 cm3 · min−1; molar ratio (in all cases); VCH4:VO2:VHe + CO2 + N2 =14.4:4.3:58.3, reaction time = 220 min.
Publisher’s Note: MDPI stays neutral with regard to jurisdictional claims in published maps and institutional affiliations. |
© 2022 by the authors. Licensee MDPI, Basel, Switzerland. This article is an open access article distributed under the terms and conditions of the Creative Commons Attribution (CC BY) license (https://creativecommons.org/licenses/by/4.0/).
Share and Cite
MDPI and ACS Style
Michorczyk, B.; Sikora, J.; Kordon-Łapczyńska, B.; Gaweł, D.; Czekaj, I. Raw Biogas as Feedstock for the OCM Process. Catalysts 2022, 12, 54. https://doi.org/10.3390/catal12010054
AMA Style
Michorczyk B, Sikora J, Kordon-Łapczyńska B, Gaweł D, Czekaj I. Raw Biogas as Feedstock for the OCM Process. Catalysts. 2022; 12(1):54. https://doi.org/10.3390/catal12010054
Chicago/Turabian StyleMichorczyk, Barbara, Jakub Sikora, Bogusława Kordon-Łapczyńska, Dorota Gaweł, and Izabela Czekaj. 2022. "Raw Biogas as Feedstock for the OCM Process" Catalysts 12, no. 1: 54. https://doi.org/10.3390/catal12010054
Note that from the first issue of 2016, this journal uses article numbers instead of page numbers. See further details here.