
LaNiO3 Perovskite Synthesis through the EDTA–Citrate Complexing Method and Its Application to CO Oxidation


1
Instituto de Investigaciones en Materiales, Universidad Nacional Autónoma de México, Circuito Exterior s/n, Ciudad Universitaria, Del. Coyoacán, Ciudad de México 04510, CP, Mexico
2
Instituto de Física, Universidad Nacional Autónoma de México, Circuito Exterior s/n, Ciudad Universitaria, Del. Coyoacán, Ciudad de México 04510, CP, Mexico
*
Author to whom correspondence should be addressed.
Catalysts 2022, 12(1), 57; https://doi.org/10.3390/catal12010057
Submission received: 24 November 2021
/
Revised: 29 December 2021
/
Accepted: 2 January 2022
/
Published: 5 January 2022
(This article belongs to the Special Issue Advances in Catalytic Oxidation of Methane and Carbon Monoxide)
Abstract
:A series of LaNiO3 materials were synthesized by the EDTA–citrate complexing method, modifying different physicochemical conditions. The LaNiO3 samples were calcined between 600 and 800 °C and characterized by XRD, SEM, XPS, CO-TPD, TG, DT, and N2 adsorption. The results evidence that although all the samples presented the same crystal phase, LaNiO3 as expected, some microstructural and superficial features varied as a function of the calcination temperature. Then, LaNiO3 samples were tested as catalysts of the CO oxidation process, a reaction never thoroughly analyzed employing this material. The catalytic results showed that LaNiO3 samples calcined at temperatures of 600 and 700 °C reached complete CO conversions at ~240 °C, while the sample thermally treated at 800 °C only achieved a 100% of CO conversion at temperatures higher than 300 °C. DRIFTS and XRD were used for studying the reaction mechanism and the catalysts’ structural stability, respectively. Finally, the obtained results were compared with different Ni-containing materials used in the same catalytic process, establishing that LaNiO3 has adequate properties for the CO oxidation process.
1. Introduction
Currently, the primary energy sources are based on the burning of fossil fuels, producing carbon oxides (CO and CO2) as undesirable products, which are two of the most hazardous gaseous atmospheric pollutants [1]. Carbon monoxide (CO) emissions are more than one million tons per year, coming from industrial, transport, and domestic sources, due to incomplete carbonaceous combustion processes [2]. Based on this, catalytic CO oxidation has been widely studied as a route for decreasing this pollutant by using different catalysts and supports for many years now [3]. Among these materials, metal transition oxides and ceramics have evidenced important catalytic properties [4,5], among which Ni-containing materials present excellent properties in different catalytic processes [6,7,8].
In this context, ABO3 perovskites have been proven to exhibit excellent conduction and catalytic properties. For example, several multi-elemental composition perovskites have been added to dense ceramic membranes to improve the ionic-electron conduction features of these systems, as perovskites can present different kinds of defects based on their chemical composition, which allows to improve their conduction properties [9,10]. Now, talking about the perovskite catalytic properties, the LaMnO3 perovskite was used as a catalyst for the CO oxidation process, where a higher amount of Mn4+ on the crystal phase resulted in a better catalytic performance [11]. In a different example, a similar perovskite, LaFeO3, was proposed for its utilization as a catalyst on the catalytic decomposition of nitrous oxide. In this study, samples showed different physicochemical properties based on the synthesis microwave conditions [12]. Thus, LaMO3 perovskite-type materials (where M can be one or more transition metal elements) seem to possess specific characteristics that may be further analyzed in different applications, e.g., where nickel cations may be considered, as this metal exhibits high catalytic properties. In fact, the LaNiO3 perovskite composition has shown interesting properties for its possible applications within different research fields [13,14,15,16,17,18,19,20,21]. This perovskite has been reported as an excellent catalyst of different reactions, such as CO2 splitting [13], electrocatalytic oxygen reduction [15], CO or CO2 methanation [16,17], or as an electro-catalyst [18,19], among others.
Other works have evidenced that LaNiO3 presents high ionic-electron conduction properties [20]. Additionally, it must be mentioned that LaNiO3 has been synthesized by different methodologies [22,23,24,25,26,27,28], although a deep analysis of the synthesis process has been rarely undertaken. Based upon this, the present work proposes two different goals: (i) to elucidate the best experimental conditions for the synthesis of LaNiO3 by the EDTA–citrate complexing methodology; and (ii) to determine the catalytic properties of the as-prepared materials through the catalytic CO oxidation process.
It must be mentioned that the present work includes a complete characterization of different LaNiO3 samples, structural and microstructurally, as a piece of complement information for the understanding of the catalytic reaction process, which has not been deeply analyzed using this new proposed material, LaNiO3.
2. Results
The EDTA–citrate complexing synthesis process [27], a modified Pechini type reaction [29], is a polymerized complex method. The metal cations are chelated by EDTA or citric acid, forming metal complexes, and then these chelates undergo a poly-esterification reaction.
During the complexing process, parasitic reactions may occur in the aqueous solution (Figure 1A), such as hydrolysis of metal cations, ligands, and metal complexes, which could affect the conditional equilibrium constant of the complexing reaction. Thus, in order to illustrate their influence on the main reaction, the parasitic reaction coefficients (αi) were calculated using the formation constant value (βi) of the different complexes [30,31,32]. As such, the formation constant values are established for each metal–hydroxyl complex ( by the following expression (Equation (1)):
where the metal is Ni or La and is the hydroxide concentration in the aqueous solution. Identically, the expressions for the ligand protonation (Equation (2)) and metal complexes (Equation (3)) were defined as:
Here, the ligands can be EDTA or citric acid, ML is the metal-complex formed by Ni, La, EDTA and citric acid, and is the proton concentration. These expressions allow one to determine the conditional stability constants (Equation (4)) for each complexing reaction in solution, where is the stability constant of each metal complex:
Based on the previous equations, Figure 1B shows the coefficient of parasitic reactions (αi) as a function of pH, where the distribution and predominance of each species can be seen, as well as their influence in the main reaction.
In the neutral–basic pH range, the main reaction is favored. Thus, in several previous publications, pH ≥ 7 values have been used for this synthesis and, in some cases, the effect of pH has been studied, although it has been concluded that the EDTA–citrate process is relatively pH insensitive. In fact, there are some microstructural differences in crystal size, surface area, and some influence on sintering processes, but this phase seems to be extremely stable over a wide pH range [30,33]. Based upon this, in this work, when the pH was adjusted to pH = 7, the solution precipitated, which is associated with the precipitation of citrates [27].
Figure 2 shows the logarithm of conditional stability constants for each complexing reaction in the solution. The reaction between citric acid and nickel is favored over other reaction processes, over a wide pH range. This complex is insoluble until the pH increases to 9–10 values when its conditional stability constant is more stable than the Ni–citrate complex, and re-dissolution of the citrate complexes takes place, resulting in a clear solution again. However, when water evaporation begins, the pH decreases to 7, and the precipitation of the citrate complexes is observed again. Therefore, a pH value of 2 was used, which ensures the homogeneity of the solution and a uniform distribution of the cations in the matrix complex.
Following the analytical analysis of the synthesis process, the LaNiO3 powders obtained at different calcination temperatures (600, 700 and 800 °C) were analyzed by XRD, as shown in Figure 3. In all cases, the XRD patterns fitted well to the 01-088-0633 PDF file, corresponding to the LaNiO3 orthorhombic crystal phase. The only differences observed on these X-ray diffraction patterns were a slight peak diffraction shift to higher 2θ values as well as an increased crystal size (determined by the Scherrer equation), both as a function of temperature. The peak shift indicates d interlayer and cell parameter contractions, for example the (110) peak shifted from 32.71° in the LNO-600 sample to 32.82° in the LNO-700 and -800 samples. This result should be attributed to differences in the ionic crystal charges and the presence of vacancies sites, as confirmed below by different techniques. The crystal size slightly increased from 10.5 to 16.3 nm when the samples were calcined at 600 and 800 °C, respectively. These results confirmed the LaNiO3 formation at temperatures as low as 600 °C when the EDTA–citrate complexing process is used for the correct cation solubility and integration. In any case, these LaNiO3 samples were further characterized to identify any physicochemical variations.
The textural properties of all samples were studied by the N2 adsorption–desorption analysis (Figure 4). According to the IUPAC classification, these samples presented isotherms type II without any evidence of hysteresis process during the desorption step [34]. This kind of isotherms is associated with non-porous or macroporous materials. Moreover, the specific surface areas (ABET) were determined using the BET model, resulting in relatively low values. As it would be expected, the ABET values decreased as a function of calcination temperature, from 20.5 m2/g on LNO-600 to 8.9 m2/g on the sample LNO-800 (see Figure 4D). The above can be explained by the sintering of LaNiO3 particles promoted by thermal effects. All these results are in good agreement with the thermal treatments applied to the samples.
To complement the characterization, the different LaNiO3 samples, as well as the precursor powder (prior calcination), were characterized by thermogravimetric (TG), differential thermal (DT), and infrared spectroscopy using the ATR-FTIR arrange. Figure 5A shows the TG and DT analyses of precursor. These curves evidence the dehydration process (85 °C) and the decomposition of all the remaining nitrates and organic compounds at 420 and 585 °C. Based on that, 600 °C was established as the lowest temperature used for the LaNiO3 calcination. In addition, the ATR-FTIR spectra did show some minor differences among the samples (Figure 5B). The vibration bands observed between 1500 and 1400 cm−1 and the less intense band at 840 cm–1 indicate the presence of coordinated nitrates. These signals tended to disappear after calcination, indicating that this precursor decomposes to give rise to the desired phase [35]. Likewise, the bands at 1700 and 1540 cm−1 are associated with the vibration of the C=O bond, while the vibration bands at 1200 and 890 cm−1 refer to the C–O and the C–O–H bonds, respectively [36,37]. These bonds arise from the complexing precursors (EDTA and citric acid). Their intensities decrease until some of them disappear in the sample calcined at 800 °C, indicating the complete calcination of the precursors. However, the bands at 1440 and 890 cm−1 remain in all the samples, and these signals can be attributed to the adsorption of H2O and CO2 from the atmosphere since in TG analyses (Figure 5A) did not show any mass loss at temperatures higher than 700 °C [38,39].
An additional TG analysis was carried out under an O2 atmosphere to elucidate the presence of LaNiO3 vacancies (Figure 6). These thermograms showed weight loss lower than 0.75% for LNO-600 and LNO-700 and 0.30% for LNO-800 at T < 300 °C, attributed to surface dehydration and dehydroxylation processes. After that, the thermograms showed a continuous weight increase process between 350 and 900 °C, indicating the O2 sorption associated with the presence of anion vacancies (Va)—most likely oxygen vacancies—where the mass gain is 3.7, 3.0, and 0.5% for LNO-700, LNO-600, and LNO-800, respectively. These results confirmed that LaNiO3 samples obtained at lower calcination temperatures present larger amounts of oxygen vacancies.
The XPS analysis was used to identify the chemical states of all the elements contained in the samples. Figure 7 shows the XPS spectra of La(3d), Ni(2p), and O(1s) edges for each sample. Initially, double La(3d) signals of all the samples were decomposed into three sub-peaks each (Figure 7A–C), corresponding to the signals previously reported La2O3 and La(OH)3 (Table 1), which are in good agreement with previous XPS reports for this material [40]. These signals were associated with characteristic lanthanum bindings within the perovskite cationic crystal sites [41]. The O(1s) core level scans of the different LaNiO3 samples are shown in Figure 7D–F. The main signal from each sample shows a double peak, which can be decomposed into three sub-peaks. While the signals located at approximately 529 and 530 eV indicate the oxygen bonding with both active metals in the perovskite structure, the signal at ~532 eV may correspond to adsorbed oxygen species as hydroxyls [36,41,42], due to the lanthanum hygroscopic properties. This result is in good agreement with the La(3d) signal associated with La(OH)3 described above (see Figure 7A–C).
On the other hand, the XPS analysis of nickel presented an overlapping of Ni(2p) and La(3d) peaks (see Figure 7A–C), stressing its analysis. In any case, these mixed signals were decomposed into three peaks, obtaining good fits (Table 1). As described above, the first signal appears at ~851 eV, which was attributed to La(3d) coming from the perovskite structure [42]. In addition, the two other XPS signals (854 and 856 eV) can be attributed as Ni(2p) signals of Ni2+ and Ni3+, respectively. In fact, these signals have been specifically reported for NiO (~854 eV) and Ni2O3 (~856 eV) [43], indicating that nickel cations present a mixed oxidation state, as evidenced by the thermogravimetric analysis showing the existence of anionic vacancies (see Figure 6). The XPS results show that all the samples present some degree of nickel partial reduction. Hence, the stoichiometry of oxygen can be affected, causing an oxygen deficiency due to the Ni mixed oxidation state [40,42]. Although these results confirm that all the samples contain a certain amount of Ni2+, it is impossible to quantify the exact nickel charge composition due to the signal overlapping, which masks the measure of the BE and intensity of the peaks. In any case, the Ni3+/Ni2+ ratios were determined from the XPS data, obtaining a value of 1.6, 3.4, and 1.9 for LNO-600, LNO-700, and LNO-800, respectively. These values do not relate to the calcination temperature, although it is confirmed that all the samples present some amounts of Ni2+ cations.
The CO chemisorption properties of the samples were studied by CO temperature-programmed desorption technique (CO-TPD). The CO-TPD profiles of each sample are shown in Figure 8. Initially, all the samples present a first peak at approximately 420 °C, although the CO desorption starts at a lower temperature for LaNiO3 calcined at 600 °C. Then, a second desorption signal appears between 440 and 500 °C, where the maximum desorption temperature is inversely displaced to higher temperatures to the sample calcination temperature. The values of the desorption temperatures are as follows: 447, 455, and 472 °C for LaNiO3 calcined at 800, 700, and 600 °C, respectively. It can be clearly seen that CO desorption increases with decreasing calcination temperature, where LaNiO3 calcined at 600 °C reached the highest peak area of both basic sites. All experiments were performed using the same amount of sample, thus suggesting that this sample (LNO-600) exhibits the highest CO adsorption capacity.
Sample characterization was complemented by scanning electron microscopy. In fact, secondary electron SEM micrographs of each sample are shown in Figure 9. The first micrograph (Figure 9A) corresponds to the LNO-600 sample. It is possible to observe a surface morphology composed of porous flake-like particles of different sizes, all of which are smaller than 1 µm. Likewise, the sample LNO-700 presents similar surface texture (Figure 9B), but these flakes are larger than those obtained at lower calcination temperatures. These larger flakes measure approximately 2 µm or more. Thus, flake-like structures tend to grow as a function of the calcination temperature, due to a particle sintering process, forming a larger porosity texture.
On the other hand, Figure 9C shows a typical SEM micrograph of LNO-800 sample, where the morphology changes into a denser, thicker, and interconnected macroporous material where the flake-like morphology disappeared and the porous system is very different. Of course, all these surface changes are associated with a continuous thermal sintering process in the sample, causing an increase in the particle size and subsequent changes in the surface textures. These microscopic observations are in good agreement with the N2 adsorption–desorption analysis, where a specific surface area decrement was obtained as a function of the calcination temperature.
After the complete characterization of the LaNiO3 samples, these were evaluated as catalysts on the CO oxidation reaction. In order to analyze the catalytic performance in this reaction, samples were dynamically and isothermally evaluated using a flow reactor connected to a gas chromatograph. LNO-600 and LNO-700 catalysts show similar performances in their dynamic evaluations, regardless of the oxygen and CO concentrations. LNO-600 presented 10% CO conversion (T10) between 179 and 155 °C when the CO concentrations were 3 and 5%, respectively (Figure 10A). Moreover, complete CO conversion was reached at 252 °C for 5% and at 289 °C for 4 and 3%, indicating a very fast CO oxidation conversion at relatively low temperatures. In fact, when the homogeneous CO oxidation reaction was performed in the presence of oxygen (without any catalyst), the conversion importantly decreased, as it would be expected (Figure 10D). In LNO-700, the CO conversion profile was slightly shifted to higher temperatures compared to the previous sample, but no other differences were detected (Figure 10B). In both samples, the maximum conversion was obtained when the CO concentration was 5%, reaching complete CO conversion at approximately 252 °C; after this temperature, the total conversion remained up to 900 °C.
On the other hand, the LNO-800 sample showed a different catalytic behavior compared to the previous samples (Figure 10C). Initially, this catalyst shifted its catalytic activity towards higher temperatures, from 120 to 210 °C (approximately 100 °C), regardless of the CO concentration, in comparison to the previous samples. This important catalytic activity shift must be associated with the microstructural and cationic speciation variations observed on the samples as a function of the LaNiO3 calcination temperature. Nickel oxidation state, vacancy presence, surface area, morphology and active CO sorption sites changed when LaNiO3 was calcined at higher temperatures resulting in a shift of the CO oxidation activity. For example, it is important to point out that, using 5% of CO in the reaction mixture decreased the CO conversion at low temperatures (T ≤ 220 °C) for LNO-800 (Figure 10D), unlike the other two samples, in which the CO conversion is favored. The above suggests that the active sites become saturated at high CO gas mixture concentrations in the sample LNO-800.
The T10 values varied as a function of the LaNiO3 calcination temperature: 155, 161 and 231 °C for samples thermally treated at 600, 700, and 800 °C, respectively. This behavior is associated with the intrinsic microstructural characteristics of these materials, as was already mentioned. However, the amount of Ni2+ cations, oxygen vacancies, and CO adsorption sites are more favorable for samples calcined at lower temperatures [44,45,46,47].
Based on the dynamic catalytic behavior of the CO conversion, different isothermal experiments were performed between 200 and 550 °C. Figure 11A,B show the corresponding experiments of LNO-600 and LNO-700, respectively. In the LNO-600 case, the isotherm obtained at 200 °C shows an initial CO conversion of 25%, which then decreases to approximately 15% of conversion, remaining relatively constant over time. For the LNO-700 sample, the experiment performed at this temperature (200 °C) shows an initial CO conversion of 90%, which decreases to 30% after 40 min of reaction. Then, the CO conversion remains relatively constant during the remaining analysis time. It seems that the LNO-700 sample possesses an initial better CO oxidation performance than that observed in the LNO-600 sample, even though the dynamic results (Figure 10D) did not show variations at 200 °C. This specific result may be attributed to the high Ni3+/Ni2+ ratio and the corresponding amount of oxygen vacancies, as demonstrated during the sample characterization. The vacancies should be filled up, getting a dynamic equilibrium, by the oxygen presence in the gas flow. Finally, the corresponding experiment (200 °C) of LNO-800 presented the worst CO conversion (~10%) during the experiment. These isothermal experiments presented an important difference in CO conversion during the first minutes (especially those calcined at 600 and 700 °C).
On the other hand, for LNO-600 and LNO-700 samples, the isotherms between 300 and 550 °C present a CO conversion of 100%, which is maintained throughout the analysis time. At these temperature conditions, the reaction process was highly efficient in both samples. However, isotherms performed at 300 and 350 °C for LNO-800 did not show stable behaviors, decreasing the CO conversion as a function of time. For example, the isotherm performed at 350 °C began with a CO conversion of approximately 95%, which decreased to 80% after 3 h. Nevertheless, the experiments performed at 400 °C, or higher temperatures, presented total conversion during the whole experiment. This variation in the CO conversion at low temperatures (300–350 °C) could be related to differences in the microstructural properties.
Based on the catalytic results, it can be established that the CO oxidation process using LaNiO3 as catalyst (reaction 5) depends on the microstructural ceramic properties, as expected, as well as on the presence of Ni2+ cations on the particle surface. The partial nickel reduction (Ni3+ → Ni2+) induces the formation of anion vacancies Va (reaction 6); these sites must favor the oxygen adsorption and subsequently dissociation, resulting in reactive oxygen species that could oxidize the CO molecules, following the Mars–van Krevelen reaction mechanism model:
Moreover, following the CO oxidation isothermal experiments, all the LaNiO3 solid products were characterized to identify any possible structural and composition modification due to the gas chemisorption and catalytic process. Figure 12 shows the XRD patterns of the LaNiO3 samples after each isothermal experiment. From this characterization process, it can be seen that there were not any evident structural changes nor the formation of other crystal phases due to the CO oxidation process, confirming the high LaNiO3 thermal and chemical stability under these reaction conditions.
To further investigate and complement the CO oxidation reaction analysis of the LaNiO3 catalysts, in-situ DRIFTS experiments were carried out (Figure 13 shows the LNO-600 spectra as an example). Two vibration bands at 2110 and 2170 cm−1 are depicted at the lowest temperature, identified as the P and R branches of gaseous CO, respectively. However, they tend to disappear upon increasing temperature. On the other hand, the progressive formation of CO2 as a function of temperature can be observed by the vibration bands observed between 2400 and 2250 cm−1. Moreover, the presence of carbonates is observed in the whole temperature range; the bands between 1420 and 1360 cm−1; and are attributed to the superficial absorption of CO2 from the atmosphere and a partial CO oxidation. It must be pointed out that carbonates were not observed in the XRD analysis, implying that the carbonation process is only occurring at the surface, and therefore only observed in the DRIFT spectra. The samples LNO-700 and LNO-800 show similar behavior (data not shown).
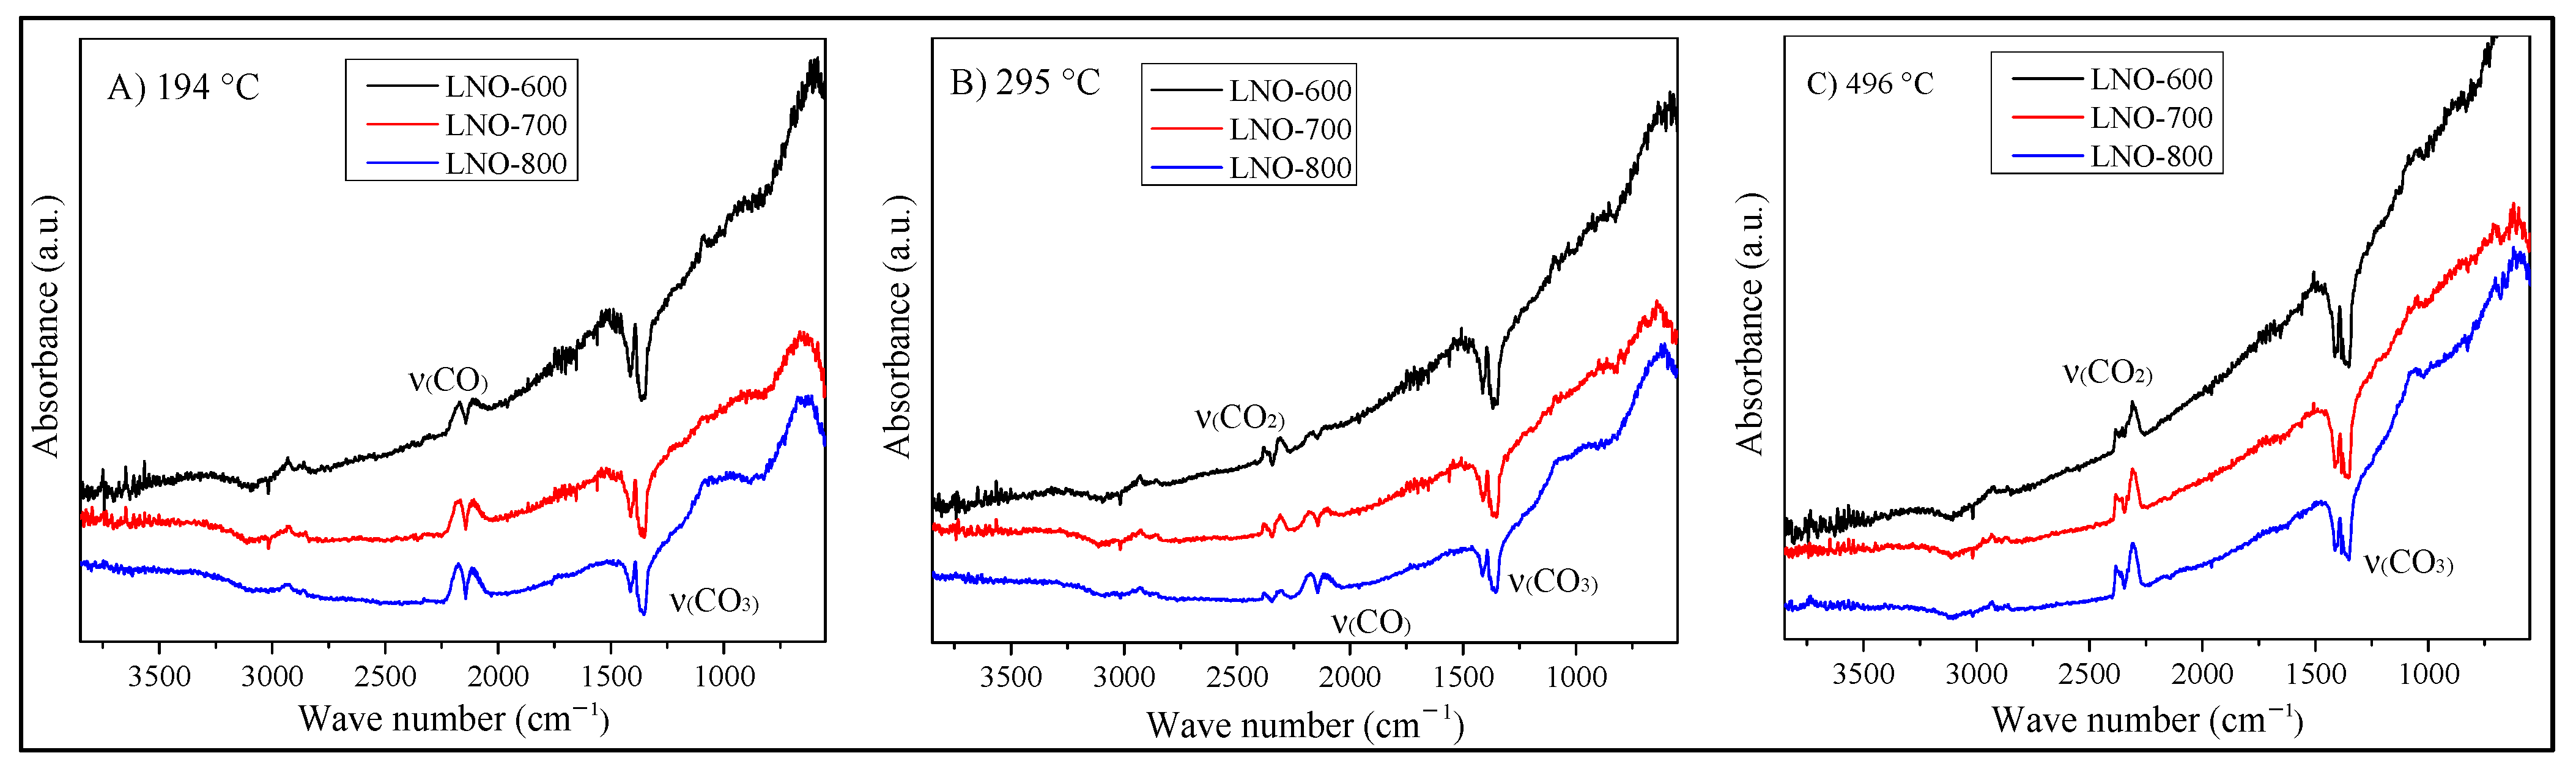
In addition, for a better comparison of the catalytic activity of the samples, Figure 14 shows the DRIFT spectra of the different samples at three specific temperatures. Initially, at 194 °C (Figure 14A), the only vibration bands observed correspond to CO and the carbonates, agreeing with the spectra interpretation described above, regardless of the analyzed sample. In other words, the surface CO oxidation is not taking place at this temperature. Moreover, an additional vibration band is observed at 880 cm−1, associated with the La(OH)CO3 complex [38]; this band was also identified in the IR spectra shown in Figure 5B. In fact, the formation of this vibration band is better developed in the LNO-800 sample. As the carbonate signal previously described, the formation of this lanthanum hydroxyl-carbonate must be produced only at the surface, associated with the sample exposition to the environment, as there is not any water supply during the catalytic process. The presence of these adsorbed species in the LNO-800 sample may be blocking the active sites, reducing the CO oxidation process, in agreement with the activity results (Figure 10D).
Then, at 295 °C, Figure 14B shows the apparition of the CO2 vibration band, with the consequent decrement in the CO vibration band intensity. This feature is more evident in the LNO-600 sample, where the CO vibrations almost disappeared. This result is associated with a higher catalytic activity for this sample at this specific temperature and is in good agreement with the previous catalytic results (see Figure 10 and Figure 11). Finally, in Figure 14C, the CO2 vibration band was only observed in the gas phase, indicating the complete CO oxidation in all the samples. On the other hand, carbonate vibration bands remained present in all the spectra, although they seem to be slightly more intense in sample LNO-600, regardless of the temperature. This result might be associated with the larger anionic vacancy presence, which may act as active sorption sites for carbonate deposition. Additionally, the La(OH)CO3 signal tended to disappear when the temperature was increased, as the particle surfaces must be dehydroxyled. Finally, it is important to point out that although these catalysts adsorb a certain amount of carbonates, these phases were not detectable by X-ray diffraction (see Figure 12), which suggests that only a small amount is produced at a superficial level. Some reports suggest that the adsorbed carbonate acts as an intermediate during CO oxidation, where the final product (CO2) is desorbed from the superficial carbonate [39,48].
If the present results are compared with the literature, especially with Ni-containing catalysts, the following facts can be established. In a recent paper, it was shown that NiO and cobalt-containing NiO samples are able to completely oxidize CO at T ≤ 200 °C as a function of the cobalt content [49]. Nevertheless, reducing the oxide samples before the CO catalytic process was necessary, and the specific surface areas were close to 100 m2/g, thanks to a solvothermal synthesis process. In a different work [47], it was shown that NiO nanorings present interesting CO oxidation yields at similar temperature regimes (150–270 °C) than the previously mentioned work and the present work using LaNiO3. Finally, the present results need to be compared with different lanthanum cobaltate perovskite (LaCoO3) and the corresponding Ni-containing solid solutions perovskites (LaCo1−xNixO3), which seem to be the closest chemical composition and crystal structure to the one analyzed here [50,51,52]. These papers reported that using LaCoO3, a total CO conversion was reached between 180 and 250 °C. Then, the Ni addition to the crystal structures only improved the CO oxidation catalytic conversion when nickel was not incorporated into the LaCoO3 crystal structure. The LaCo0.8Ni0.2O3 composition shifted the thermal CO oxidation evolution at approximately 50–80 °C, while the nickel oxide deposition over the LaCoO3 particles (Ni/LaCoO3) reduced the temperature needed for the complete CO oxidation process to 170 °C. T. Vaz and A. V. Salker reported the LaNiO3 activities in the CO oxidation [52], showing a complete CO conversion to CO2 at 350 °C, fitting with the result obtained in the present work with the sample thermally treated at 800 °C, the same thermal condition used by those authors. Based on these comparative results, it can be said that LaNiO3 may become an interesting option as a catalyst for the CO oxidation process, as it presents similar properties to other materials. However, its synthesis conditions are not as complicated as the nanoparticle syntheses proposed for other materials or the design of complex microstructured composites.
3. Materials and Methods
Lanthanum nickelate (LaNiO3) was synthesized via the EDTA–citrate complexing method. The corresponding stoichiometric amounts of each metal nitrate, La(NO3)3·6H2O, (99.9%, Sigma-Aldrich) and Ni(NO3)3·6H2O (98.0%, Baker A.C.S. Reagent) were dissolved in deionized water, followed by the addition of EDTA (98.5%, Baker A.C.S. Reagent) previously dissolved in ammonium hydroxide (28.0–30.0%, Baker A.C.S. Reagent). After 10 min of stirring, anhydrous citric acid (99.0%, Sigma-Aldrich) was added to the whole solution, where the mole ratio of EDTA:citric acid:total metal ions was established as 1:1:1. Then, the pH was set to approximately 2, by adding ammonium hydroxide to avoid the citrates precipitation. The solution was heated to 80 °C, where a dark blue gel was obtained after water evaporation. This gel was heated at 200 °C until self-ignited, removing all organic and nitrate matter by combustion. Finally, the resulting precursor powder was calcined at different temperatures—600, 700 or 800 °C (labeled as LNO-600, LNO-700, and LNO-800, respectively)—for 10 h.
After the synthesis process, the powder samples were characterized using different techniques. X-ray diffraction patterns were collected using a Bruker D8 Advance diffractometer, with a Cu Kα (0.154 nm) radiation source operating at 35 kV and 30 mA, where each sample was measured in the 2θ range of 15–80°. N2 adsorption–desorption analyses were performed using a Minisorp II instrument, from Bel-Japan at 77 K, where the samples were previously degassed at 90 °C for 24 h. The BET model was used to determine the specific surface area of each sample. The ATR-FTIR spectra (3500−500 cm−1) were obtained using ALPHA-Platinum equipment from Bruker. Then, the thermogravimetric and differential thermal analyses were performed from 30 to 800 °C using TA Instruments equipment (Q-500 and SDT-600). The surface features of the samples were analyzed by X-ray photoelectron spectroscopy (XPS) and temperature-programmed desorption (TPD). For the XPS, ESCA2000 Multilab equipment (VG Microtech from UK) was used with UHV system Al K X-ray (1486.6 eV) and CLAM4 MCD analyzer. Each powder sample was dispersed and compacted on a conductive tape forming a homogeneous thin film, where the sample holder is a Ni–Fe μ-steel support. Then, the sample surface was sputtered 1 μA/mm2 with argon ions produced at 1 kV. The peak positions on the XPS spectra were referenced to the C 1s core level. TPD of CO was performed using 15 mg of each sample pre-treated in pure Ar at 300 °C for 30 min. Then, the gas mixture flow was shifted for CO adsorption (5 vol% CO, Ar balanced, from Praixar) for 60 min and cooled down to 60 °C in that gas mixture. Finally, the temperature was increased from 60 to 900 °C at 5 °C/min in an Ar atmosphere. TPD experiments were performed using a reactor (CATLAB-PCS, Hiden Analytical) coupled to a QGA mass spectrometer (Hiden Analytical). Finally, the morphological properties of these samples were analyzed via field emission scanning electron microscopy using JEOL JSM 7800F equipment.
The catalytic performance of LaNiO3 perovskites, calcined at different temperatures, was evaluated for the CO oxidation reaction. Different dynamic (vs. temperature) and isothermal (vs. time) catalytic experiments were performed using a Bel- Rea reactor from Bel-Japan with approximately 20 mg of sample and a gas mixture of 5, 4, and 3 vol% of O2 and CO (5 vol%, N2 balanced), with a total flow rate of 60 mL/min. In the first approach, samples were dynamically heated in the gas mixture from room temperature to 900 °C at a heating rate of 3 °C/min. In the second methodology, samples were isothermally analyzed between 200 and 550 °C using the same gas mixture described above. The gas products were analyzed with a GC 2014 gas chromatograph (Shimadzu) with a Carboxen-100 column.
Further analysis of the CO oxidation process was performed through in-situ DRIFTS. Measurements were obtained with an environmentally controlled PIKE DRIFTS cell, with KBr windows, coupled to a Thermo Scientific Nicolet iS50 spectrometer. Absorbance spectra were obtained by collecting 64 scans at 4 cm−1 of resolution with a DTGS detector. A gas mixture composed of 5% CO/He (30 mL/min) and 5% O2/He (30 mL/min) was used as a reactant, reaching a 2.5 vol% concentration for each gaseous reactant and a total flow of 60 mL/min. The heating rate was set to 10 °C/min, and spectra were collected each 2 min (approximately 17 °C per spectrum).
4. Conclusions
The effects of pH and calcination conditions through the EDTA–citrate complexing synthesis process were analyzed on the catalytic performance of LaNiO3 for the CO oxidation. The synthesis results evidenced that using a pH value of 2 during the synthesis process ensured the homogeneity of all ionic species in the solution, producing a uniform distribution in the matrix complex. In fact, the conditional stability constants showed that at different pH values, the cation precipitation may not be homogeneous. After that, the obtained LaNiO3 precursor was calcined at different temperatures (600, 700, or 800 °C). A full structural, microstructural, and surface characterization through different techniques was carried out. The characterization results indicated that all the samples presented the same crystal phase, LaNiO3, although some chemical, microstructural and superficial properties, such as the Ni3+/Ni2+ ratio and anionic vacancy presence, varied as a function of the calcination temperature. Of course, these differences impacted the CO oxidation performance. While LaNiO3 samples calcined at 600 and 700 °C reached total CO conversions at temperatures equal or lower than 240 °C, the sample thermally treated at 800 °C shifted its CO total conversion to higher temperatures of approximately 100 °C (350 °C). The observed differences must be mainly attributed to the specific surface area (LNO-600) and different Ni3+/Ni2+ ratio (LNO-700), the two main differences in contrast with the LNO-800 sample. A subsequent DRIFTS analysis and the obtained XRD patterns of the spent catalysts proved that materials acted as catalysts of the CO oxidation without modification of the crystal phase, through the Mars–van Krevelen reaction model. LaNiO3 samples obtained at the lowest calcination temperatures presented better catalytic properties and thermal stability. Moreover, comparing these catalytic results with other Ni-containing materials used in the same reaction, it can be established that LaNiO3 presents at least comparable characteristics. Thus, this perovskite material could be considered a new possible catalyst for the CO oxidation process, enlarging the number of reactions for which LaNiO3 has been proposed to be a catalyst.
Author Contributions
Conceptualization, D.G.-V. and H.P.; methodology, D.G.-V.; formal analysis, D.G.-V., D.G.A., G.D. and H.P.; investigation, D.G.-V., D.G.A., G.D. and H.P.; resources, H.P.; writing—original draft preparation, review, and editing, D.G.-V., D.G.A., G.D. and H.P.; visualization, D.G.-V. and D.G.A.; supervision, H.P.; project administration, H.P.; and funding acquisition, H.P. All authors have read and agreed to the published version of the manuscript.
Funding
This research was funded SENER-CONACYT (251801) project. Moreover, D. González-Varela thanks to CONACYT for the scholarship support.
Acknowledgments
Authors thank to Adriana Tejeda, Lazaro Huerta, Lourdes Bazán-Díaz, and Eriseth Reyes-Morales for technical assistance.
Conflicts of Interest
The authors declare no conflict of interest.
References
- Lee, S.Y.; Park, S.J. A review on solid adsorbents for carbon dioxide capture. J. Ind. Eng. Chem. 2015, 23, 1–11. [Google Scholar] [CrossRef]
- Chen, R.; Pan, G.; Zhang, Y.; Xu, Q.; Zeng, G.; Xu, X.; Chen, B.; Kan, H. Ambient carbon monoxide and daily mortality in three chinese cities: The China air pollution and health effects study. Sci. Total Environ. 2011, 409, 4923–4928. [Google Scholar] [CrossRef]
- Soliman, N.K. Factors affecting CO oxidation reaction over nanosized materials: A review. J. Mater. Res. Technol. 2019, 8, 2395–2407. [Google Scholar] [CrossRef]
- Zhang, L.; Song, H.; Xu, G.; Wang, W.; Yang, L. MOFs derived mesoporous Co3O4 polyhedrons and plates for CO oxidation reaction. J. Solid State Chem. 2019, 276, 87–92. [Google Scholar] [CrossRef]
- Rastegarpanah, A.; Liu, Y.; Deng, J.; Jing, L.; Pei, W.; Zhang, X.; Hou, Z.; Rezaei, M.; Dai, H. Influence of preparation method on catalytic performance of three-dimensionally ordered macroporous NiO–CuO for CO oxidation. J. Solid State Chem. 2021, 297, 122091. [Google Scholar] [CrossRef]
- van Spronsen, M.A.; Frenken, J.W.M.; Groot, I.M.N. Surface science under reaction conditions: CO oxidation on Pt and Pd model catalysts. Chem. Soc. Rev. 2017, 46, 4347–4374. [Google Scholar] [CrossRef] [Green Version]
- Dey, S.; Mehta, N.S. Oxidation of carbon monoxide over various nickel oxide catalysts in different conditions: A review. Chem. Eng. J. Adv. 2020, 1, 100008. [Google Scholar] [CrossRef]
- Guo, Y.; Wang, G.; Yao, X.; Liu, B. A comparison of NiO–CuO–CeO2 composite catalysts prepared via different methods for CO oxidation. J Solid State Chem. 2020, 292, 121697. [Google Scholar] [CrossRef]
- Ovalle-Encinia, O.; Sánchez-Camacho, P.; González-Varela, D.; Pfeiffer, H. Development of new bifunctional dense ceramic-carbonate membrane reactors for gas mixtures separation, through CO oxidation and subsequent CO2 permeation. ACS Appl. Energy Mater. 2019, 2, 1380–1387. [Google Scholar] [CrossRef]
- Zhu, X.; Liu, Y.; Cong, Y.; Yang, W. Ce0.85Sm0.15O1.925−Sm0.6Sr0.4Al0.3Fe0.7O3 dual-phase membranes: One-pot synthesis and stability in a CO2 atmosphere. Solid State Ionics 2013, 253, 57–63. [Google Scholar] [CrossRef]
- Angel, S.; Tapia, J.D.; Gallego, J.; Hagemann, U.; Wiggers, H. Spray-flame synthesis of LaMnO3+δ nanoparticles for selective CO oxidation (SELOX). Energy Fuels 2021, 35, 4367–4376. [Google Scholar] [CrossRef]
- Kostyukhin, E.M.; Kustov, A.L.; Evdokimenko, N.V.; Bazlov, A.I.; Kustov, L.M. Hydrothermal microwave-assisted synthesis of LaFeO3 catalyst for N2O decomposition. J. Am. Ceram. Soc. 2021, 104, 492–503. [Google Scholar] [CrossRef]
- Bak, J.; Bae, H.B.; Oh, C.; Son, J.; Chung, S.Y. Effect of lattice strain on the formation of Ruddlesden−Popper faults in heteroepitaxial LaNiO3 for Oxygen Evolution Electrocatalysis. J. Phys. Chem. Lett. 2020, 11, 7253–7260. [Google Scholar] [CrossRef] [PubMed]
- Tietz, F.; Arul Raj, I.; Ma, Q.; Baumann, S.; Mahmoud, A.; Hermann, R.P. Material properties of perovskites in the quasi-ternary system LaFeO3–LaCoO3–LaNiO3. J. Solid State Chem. 2016, 237, 183–191. [Google Scholar] [CrossRef] [Green Version]
- Abe, Y.; Satoh, I.; Saito, T.; Kan, D.; Shimakawa, Y. Oxygen reduction reaction catalytic activities of pure Ni-based perovskite-related structure oxides. Chem. Mater. 2020, 32, 8694–8699. [Google Scholar] [CrossRef]
- Mosinska, M.; Maniukiewicz, W.; Szynkowska-Jozwik, M.; Miercznski, P. Influence of NiO/La2O3 catalyst preparation method on its reactivity in the oxy-steam reforming of LNG process. Catalysts 2021, 11, 1174. [Google Scholar] [CrossRef]
- Wang, H.W.; Wu, J.X.; Wang, X.Y.; Wang, H.; Liu, J.R. Formation of perovskite-type LaNiO3 on La-Ni/Al2O3-ZrO2 catalysts and their performance for CO methanation. J. Fuel Chem. Technol. 2021, 49, 186–197. [Google Scholar] [CrossRef]
- Liu, J.; Jia, E.; Stoerzinger, K.A.; Wang, L.; Wang, Y.; Yang, Z.; Shen, D.; Engelhard, M.H.; Bowden, M.E.; Zhu, Z.; et al. Dynamic Lattice Oxygen Participation on Perovskite LaNiO3 during Oxygen Evolution Reaction. J. Phys. Chem. C 2020, 124, 15386–15390. [Google Scholar] [CrossRef]
- Islam, M.; Jeong, M.G.; Oh, I.H.; Nam, K.W.; Jung, H.G. Role of strontium as doping agent in LaMn0.5Ni0.5O3 for oxygen electro-catalysis. J. Ind. Eng. Chem. 2020, 85, 94–101. [Google Scholar] [CrossRef]
- Lu, Y.; Akbar, M.; Xia, C.; Mi, Y.; Ma, L.; Wang, B.; Zhu, B. Catalytic membrane with high ion–electron conduction made of strongly correlated perovskite LaNiO3 and Ce0.8Sm0.2O2-d for fuel cells. J. Catal. 2020, 386, 117–125. [Google Scholar] [CrossRef]
- Rakshit, S.; Gopalakrishnan, P.S. Oxygen Nonstoichiometry and Its Effect on the Structure of LaNiO3. J. Solid State Chem. 1994, 110, 28–31. [Google Scholar] [CrossRef]
- Djani, F.; Omari, M.; Martínez-Arias, A. Synthesis, characterization and catalytic properties of La(Ni,Fe)O3–NiO nanocomposites. J. Sol-Gel Sci. Technol. 2016, 78, 1–10. [Google Scholar] [CrossRef]
- Phumuen, P.; Kumnorkaew, P.; Srepusharawoot, P.; Klangtakai, P.; Pimanpang, S.; Amornkitbamrung, V. Ball Milling Modification of Perovskite LaNiO3 Powders for Enhancing Electrochemical Pseudocapacitor. Surf. Interfaces 2021, 25, 101282. [Google Scholar] [CrossRef]
- Pereñíguez, R.; González-delaCruz, V.M.; Holgado, J.P.; Caballero, A. Synthesis and characterization of a LaNiO3 perovskite as precursor for methane reforming reactions catalysts. Appl. Catal. B Environ. 2010, 93, 346–353. [Google Scholar] [CrossRef]
- Talaie, N.; Sadr, M.H.; Aghabozorg, H.; Zare, K. Synthesis and Application of LaNiO3 Perovskite-Type Nanocatalyst with Zr for Carbon Dioxide Reforming of Methane. Oriental J. Chem. 2016, 32, 2723–2730. [Google Scholar] [CrossRef] [Green Version]
- Komarala, E.P.; Komissarov, I.; Rosen, B.A. Effect of Fe and Mn Substitution in LaNiO3 on Exsolution, Activity, and Stability for Methane Dry Reforming. Catalysts 2020, 10, 27. [Google Scholar] [CrossRef] [Green Version]
- Ding, X.; Liu, Y.; Gao, L.; Guo, L. Synthesis and characterization of doped LaCrO3 perovskite prepared by EDTA-citrate complexing method. J. Alloys Compd. 2008, 458, 346–350. [Google Scholar] [CrossRef]
- Yang, Z.; Huang, Y.; Dong, B.; Li, H.L. Template induced sol–gel synthesis of highly ordered LaNiO3 nanowires. J. Solid State Chem. 2005, 178, 1157–1164. [Google Scholar] [CrossRef]
- Pechini, M.P. Method of Preparing Lead and Alkaline Earth Titanates and Niobates and Coating Method Using the Same to form a Capacitor. US Patent 3 330 697, 1964. [Google Scholar]
- Zhou, W.; Shao, Z.; Jin, W. Synthesis of nanocrystalline conducting composite oxides based on a non-ion selective combined complexing process for functional applications. J. Alloys Compd. 2006, 426, 368–374. [Google Scholar] [CrossRef]
- Ringbom, A. Complexation in Analytical Chemistry; Interscience: New York, NY, USA, 1963. [Google Scholar]
- Chanaud, P.; Julbe, A.; Vaija, P.; Persin, M.; Cot, L. Study of lanthanum-based colloidal sols formation. J. Mater. Sci. 1994, 29, 4244–4251. [Google Scholar] [CrossRef]
- Wu, W.C.; Huang, J.T.; Chiba, A. Synthesis and properties of samaria-doped ceria electrolyte for IT-SOFCs by EDTA-citrate complexing method. J. Power Sources. 2010, 195, 5868–5874. [Google Scholar] [CrossRef]
- Lowell, S.; Shields, J.E.; Thomas, M.A.; Thommes, M. Characterization of Porous Solids ans Powders: Surface Area, Pore Size and Density; Springer: Berlin/Heidelberg, Germany, 2004. [Google Scholar]
- Rida, K.; Peña, M.A.; Sastre, E.; Martínez-Arias, A. Effect of calcination temperature on structural properties and catalytic activity in oxidation reactions of LaNiO3 perovskite prepared by Pechini method. J. Rare Earths. 2012, 30, 210–216. [Google Scholar] [CrossRef]
- Hyeok-Yang, E.; Moon, D.J. Synthesis of LaNiO3 perovskite using an EDTA-cellulose method and comparison with the conventional Pechini method: Application to steam CO2 reforming of methane. RSC Adv. 2016, 6, 112885–112898. [Google Scholar] [CrossRef]
- Skoog, C.S.; Douglas, A.; James, H.F. Principles of Instrumental Analysis, 6th ed.; CENGAGE Learning: Boston, MA, USA, 2008. [Google Scholar]
- He, A.; Zhou, F.; Ye, F.; Zhang, Y.; He, X.; Zhang, X.; Guo, R.; Zhao, X.; Sun, Y.; Huang, M.; et al. Preparation and characterization of lanthanum carbonate octahydrate for the treatment of hyperphosphatemia. J. Spectr. 2013, 1, 1–6. [Google Scholar] [CrossRef]
- Dreyer, M.; Krebs, M.; Najafishirtari, S.; Rabe, A.; Ortega, K.F.; Behrens, M. The effect of Co incorporation on the CO oxidation activity of LaFe1−xCoxO3 perovskites. Catalysts 2021, 11, 550. [Google Scholar] [CrossRef]
- Shahnazi, A.; Firoozi, S. Improving the catalytic performance of LaNiO3 perovskite by manganese substitution via ultrasonic spray pyrolysis for dry reforming of methane. J. CO2 Util. 2021, 45, 101455. [Google Scholar] [CrossRef]
- Mickevičius, S.; Grebinskij, S.; Bondarenka, V.; Vengalis, B.; Šliužiene, K.; Orlowski, B.A.; Osinniy, V.; Drube, W. Investigation of epitaxial LaNiO3-x thin films by high-energy XPS. J. Alloys Compd. 2006, 423, 107–111. [Google Scholar] [CrossRef] [Green Version]
- Qiao, L.; Bi, X. Direct observation of Ni3+ and Ni2+ in correlated LaNiO3-δ films. IOP Sci. 2011, 93, 57002. [Google Scholar]
- Che, W.; Wei, M.; Sang, Z.; Ou, Y.; Liu, Y.; Liu, J. Perovskite LaNiO3-δ oxide as an anion-intercalated pseudocapacitor electrode. J. Alloys Compd. 2018, 731, 381–388. [Google Scholar] [CrossRef]
- Moradi, G.R.; Rahmanzadeh, M. The influence of partial substitution of alkaline earth with la in the LaNiO3 perovskite catalyst. Catal. Commun. 2012, 26, 169–172. [Google Scholar] [CrossRef]
- Lombardo, E.A.; Ulla, M.A. Perovskite oxides in catalysis: Past, present and future. Res. Chem. Intermed. 1998, 24, 581–592. [Google Scholar] [CrossRef]
- Batiot-Dupeyrat, C.; Gallego, G.A.S.; Mondragon, F.; Barrault, J.; Tatibouët, J.M. CO2 reforming of methane over LaNiO3 as precursor material. Catal. Today 2005, 107–108, 474–480. [Google Scholar] [CrossRef]
- Bonmassar, N.; Bekheet, M.F.; Schlicker, L.; Gili, A.; Gurlo, A.; Doran, A.; Gao, Y.; Heggen, M.; Bernardi, J.; Klo, B.; et al. In Situ-Determined Catalytically Active State of LaNiO3 in Methane Dry Reforming. ACS Catal. 2020, 10, 1102–1112. [Google Scholar] [CrossRef]
- Tian, F.X.; Zhu, M.; Liu, X.; Tu, W.; Han, Y.F. Dynamic structure of highly disordered manganese oxide catalysts for low-temperature CO oxidation. J. Catal. 2021, 401, 115–128. [Google Scholar] [CrossRef]
- Gou, Y.; Liang, X.; Chen, B. Porous Ni–Co bimetal oxides nanosheets and catalytic properties for CO oxidation. J. Alloys Comp. 2013, 574, 181–187. [Google Scholar] [CrossRef]
- Wang, D.; Xu, R.; Wang, X.; Li, Y. NiO nanorings and their unexpected catalytic property for CO oxidation. Nanotechnology 2006, 17, 979–983. [Google Scholar] [CrossRef] [PubMed]
- Li, H.; Yu, K.; Wan, C.; Zhu, J.; Li, X.; Tong, S.; Zhao, Y. Comparison of the nickel addition patterns on the catalytic performances of LaCoO3 for low-temperature CO oxidation. Catal. Today 2017, 281, 534–541. [Google Scholar] [CrossRef] [Green Version]
- Vaz, T.; Salker, A.V. Preparation, characterization and catalytic CO oxidation studies on LaNi1−xCoxO3 system. Mater. Sci. Eng. B 2007, 143, 81–84. [Google Scholar] [CrossRef]
Figure 1.
pH dependence of the coefficient of parasitic reactions (A) and description of the conditional equilibrium and parasitic reactions (B).
Figure 1.
pH dependence of the coefficient of parasitic reactions (A) and description of the conditional equilibrium and parasitic reactions (B).

Figure 2.
Conditional stability constants of the La and Ni against EDTA and citrates complexes at different pH values.
Figure 2.
Conditional stability constants of the La and Ni against EDTA and citrates complexes at different pH values.
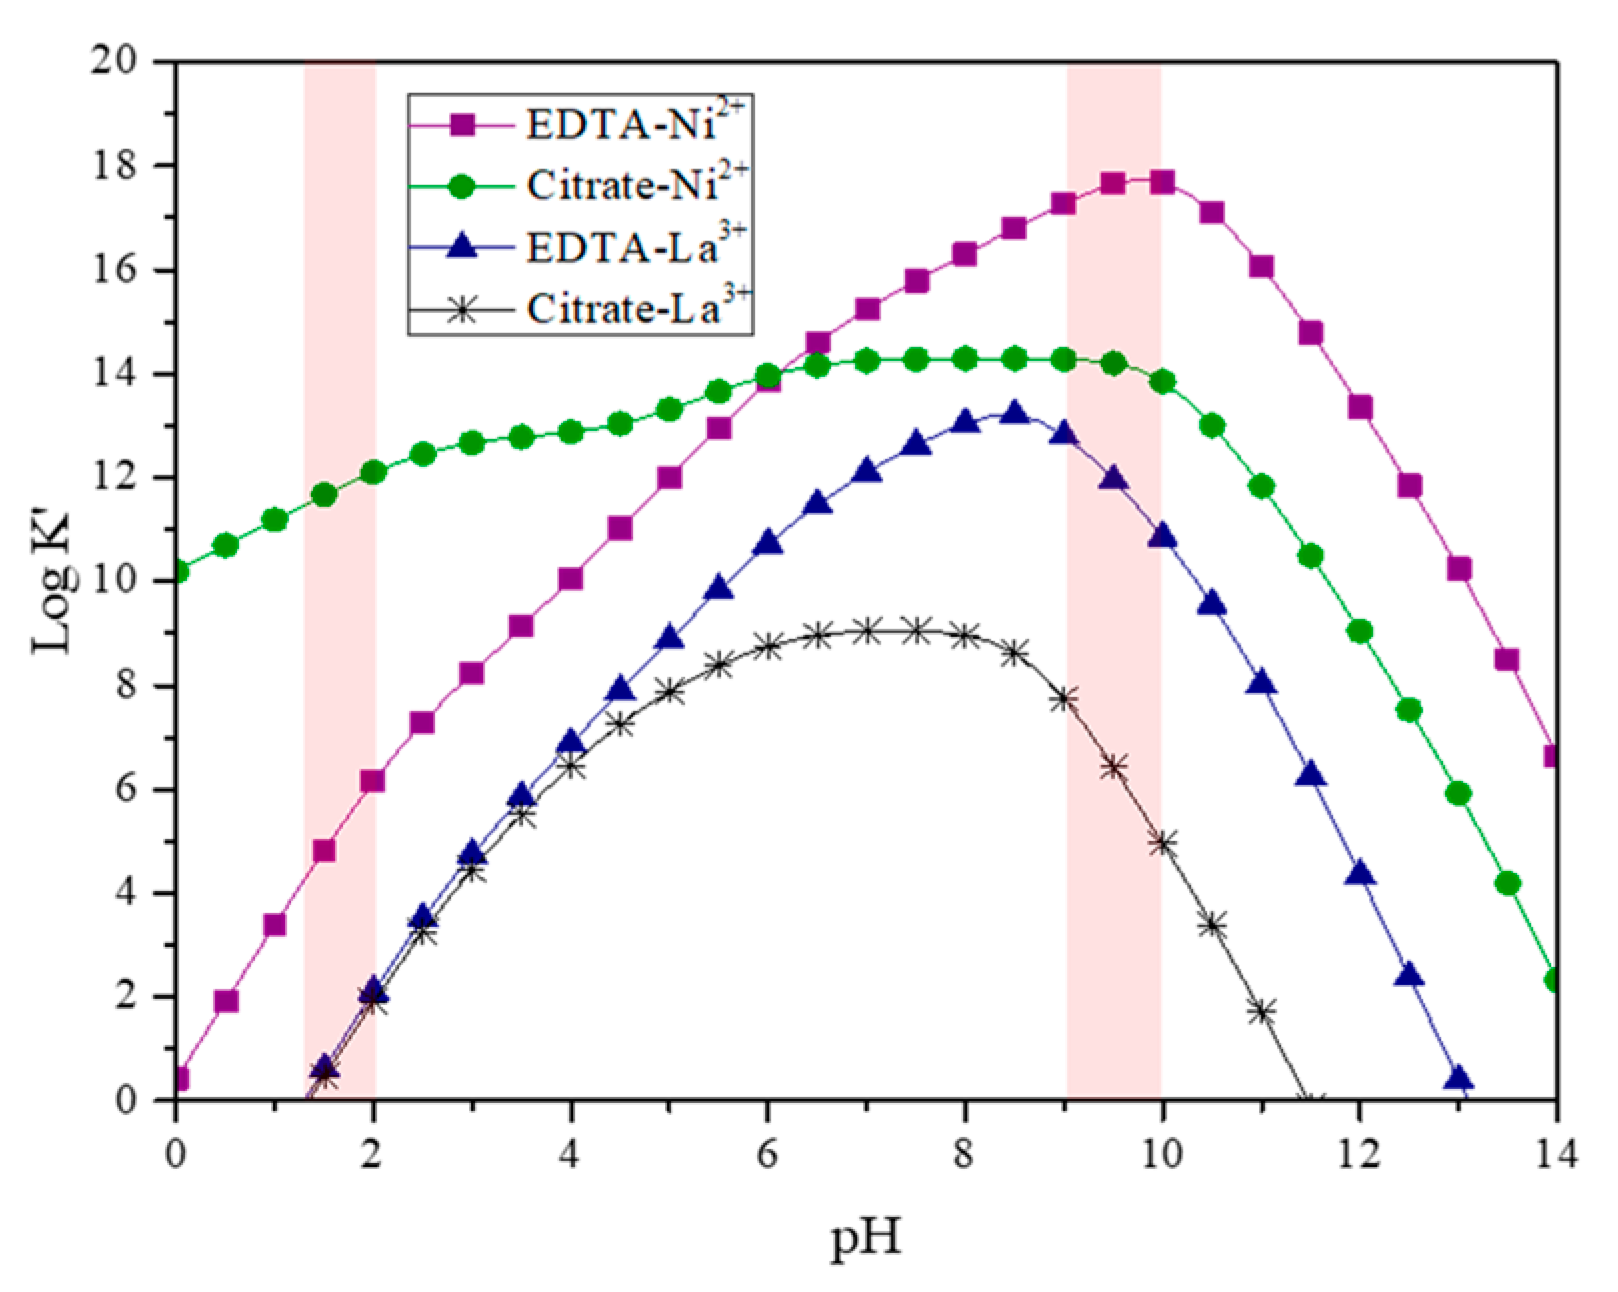
Figure 3.
X-ray diffraction patterns of the LaNiO3 samples calcined at different temperatures, where all the LaNiO3 diffraction peaks were labeled as (*), based on the 01-088-0633 PDF file.
Figure 3.
X-ray diffraction patterns of the LaNiO3 samples calcined at different temperatures, where all the LaNiO3 diffraction peaks were labeled as (*), based on the 01-088-0633 PDF file.
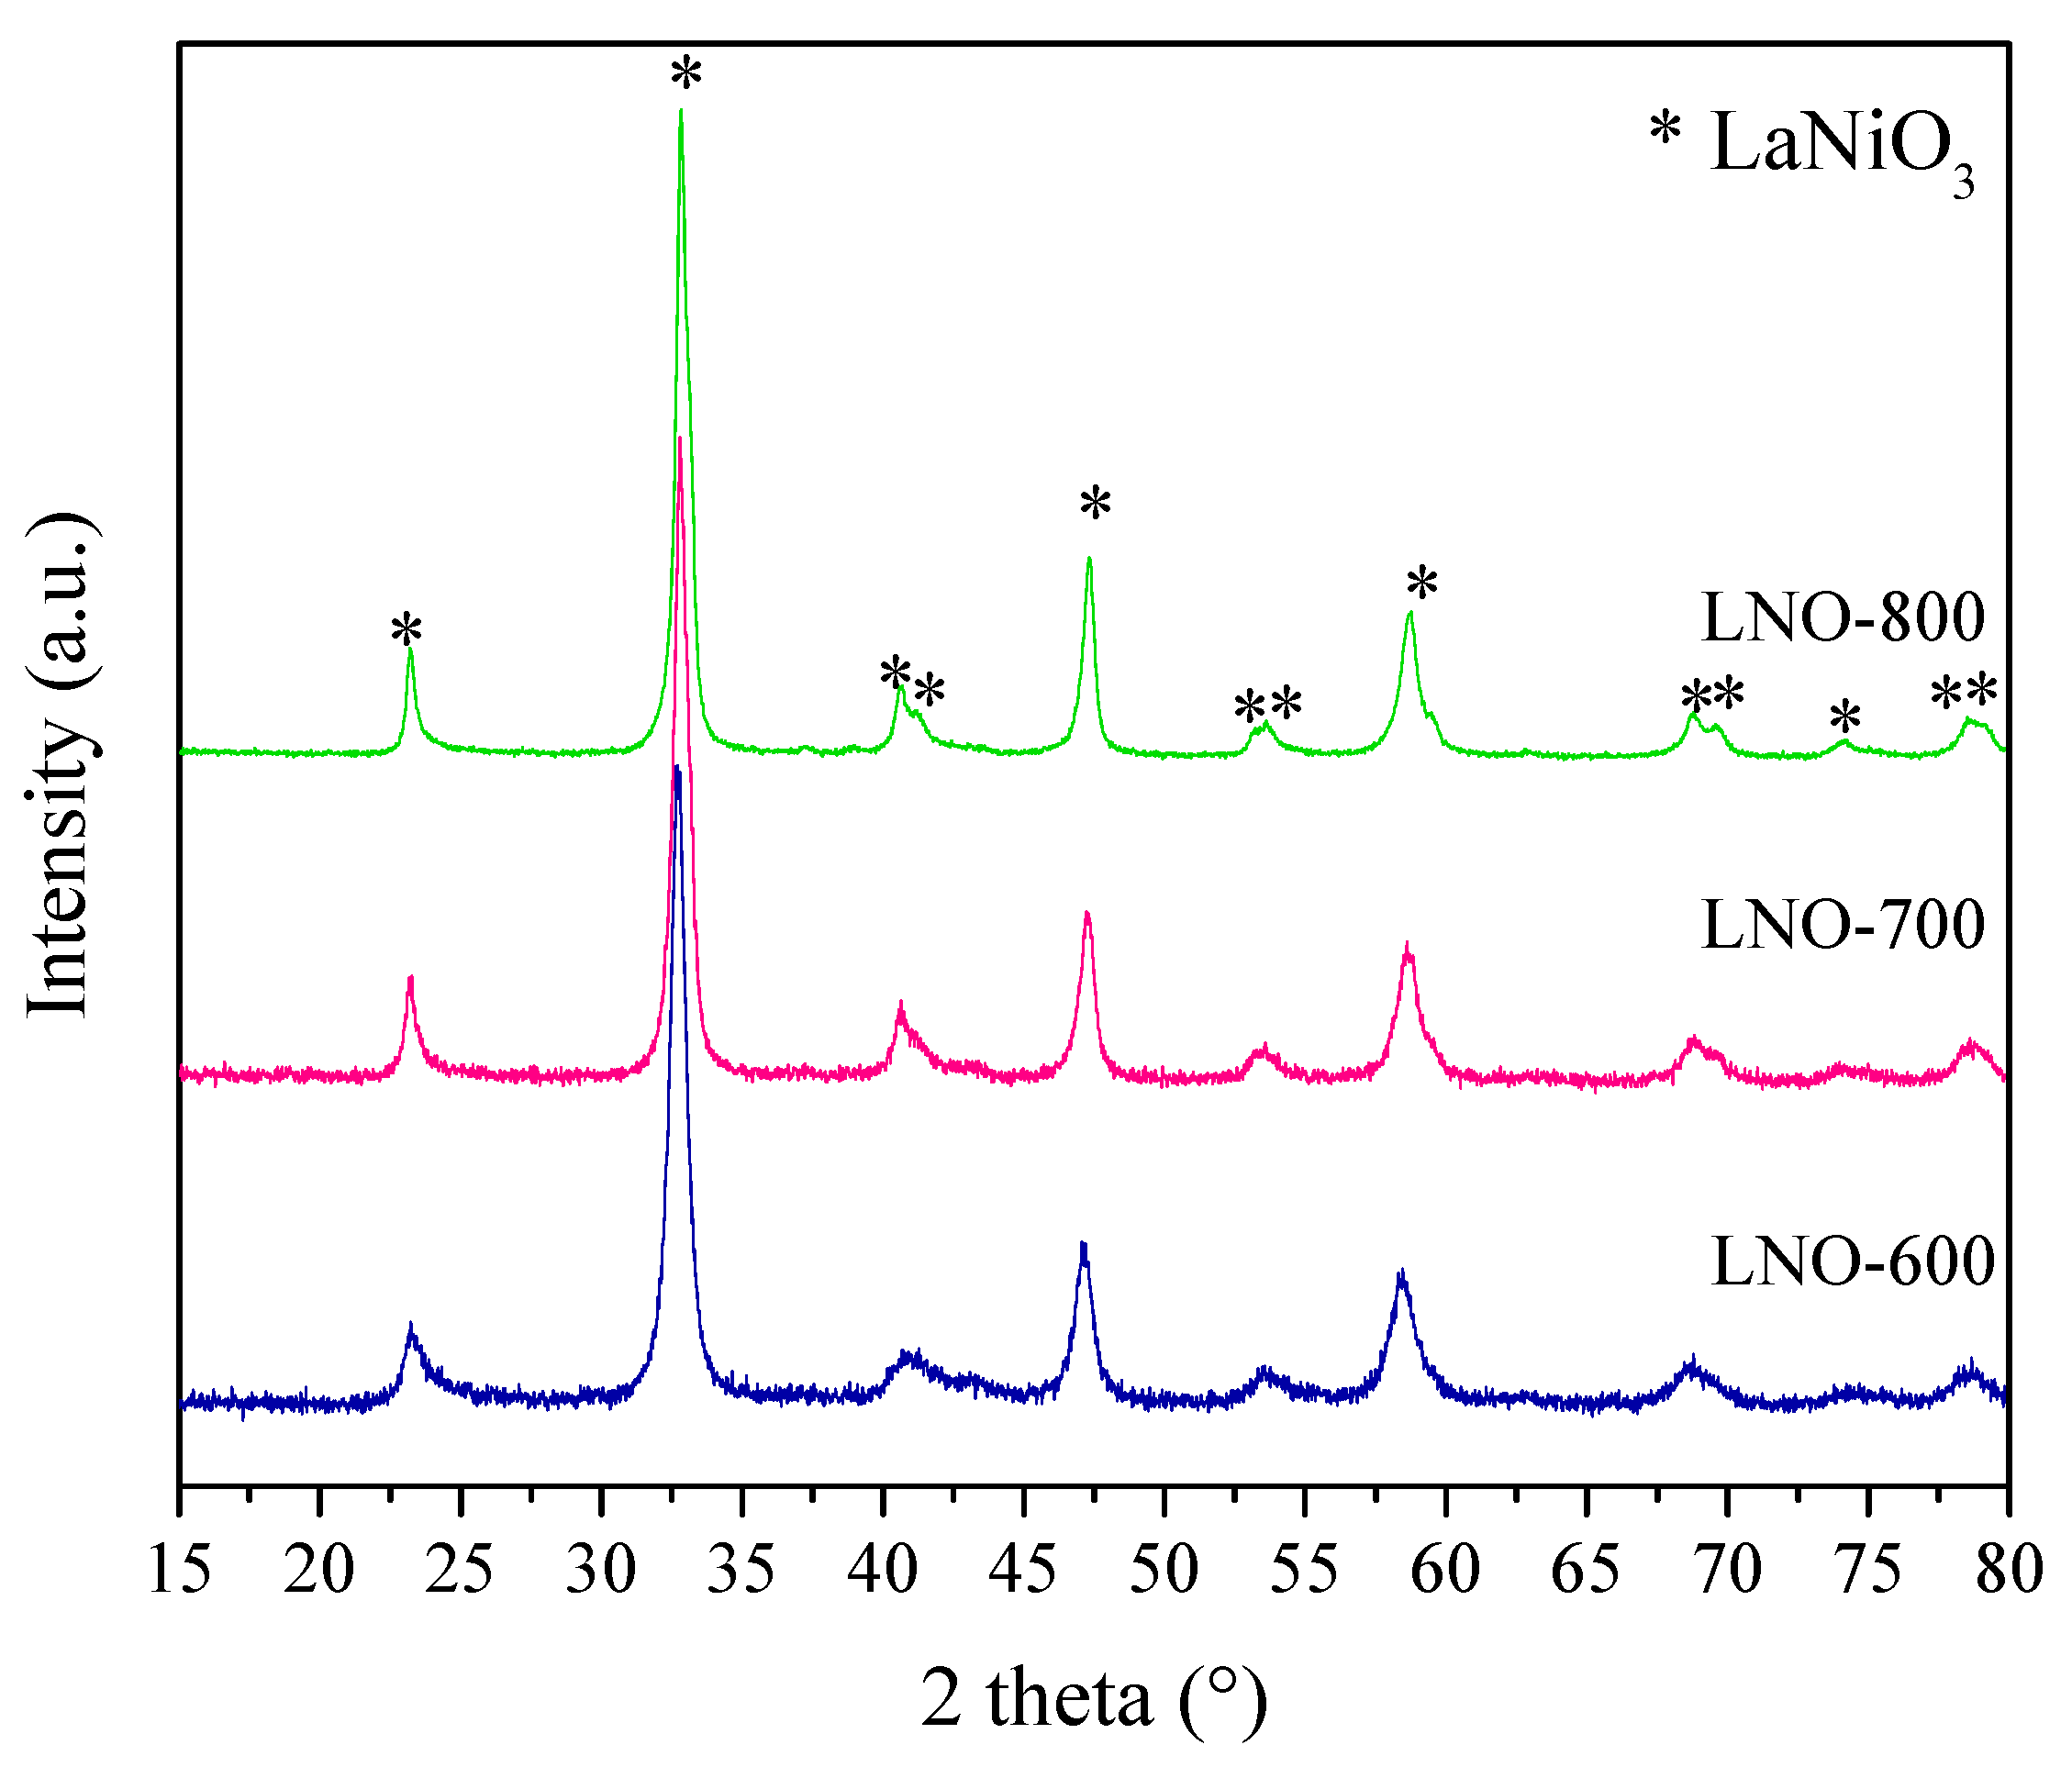
Figure 4.
N2 adsorption–desorption isotherms of LNO-600 (A), LNO-700 (B) and LNO-800 (C). BET area values vs. temperature of calcination are presented in (D).
Figure 4.
N2 adsorption–desorption isotherms of LNO-600 (A), LNO-700 (B) and LNO-800 (C). BET area values vs. temperature of calcination are presented in (D).

Figure 5.
TG and DT dynamic analyses of precursor powders in an N2 atmosphere (A) and ATR-FTIR spectra of LaNiO3 samples calcined at different temperatures (B).
Figure 5.
TG and DT dynamic analyses of precursor powders in an N2 atmosphere (A) and ATR-FTIR spectra of LaNiO3 samples calcined at different temperatures (B).
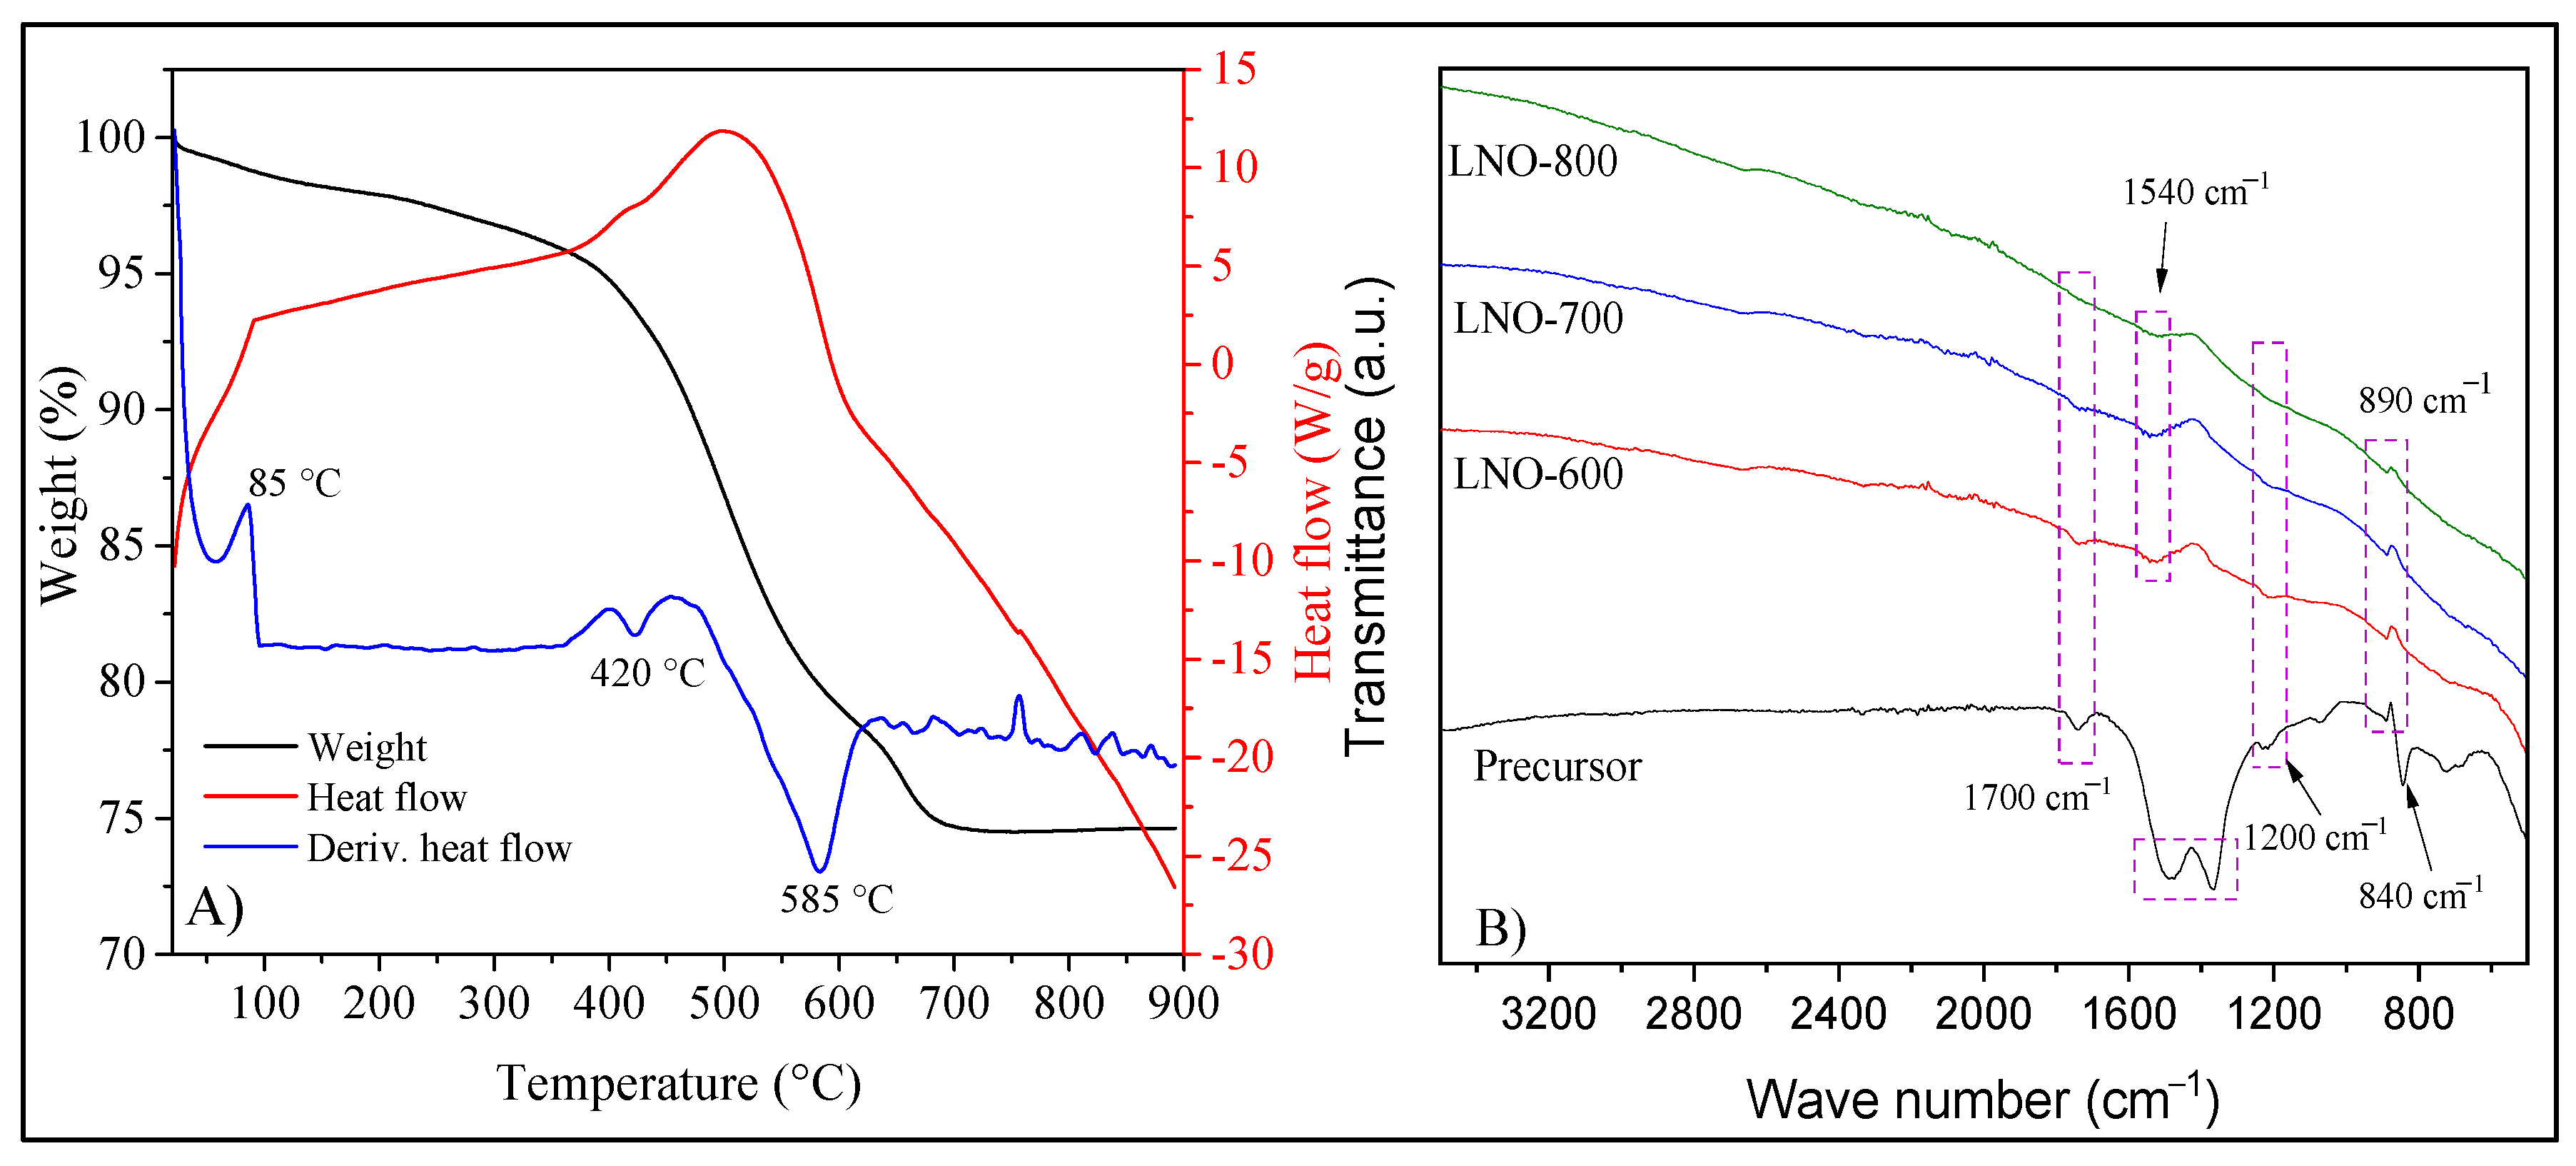
Figure 6.
Elucidation of the oxygen vacancies presence in the LaNiO3 catalysts through thermogravimetric dynamic analysis using an O2 atmosphere ( of 0.1, N2 balance).
Figure 6.
Elucidation of the oxygen vacancies presence in the LaNiO3 catalysts through thermogravimetric dynamic analysis using an O2 atmosphere ( of 0.1, N2 balance).
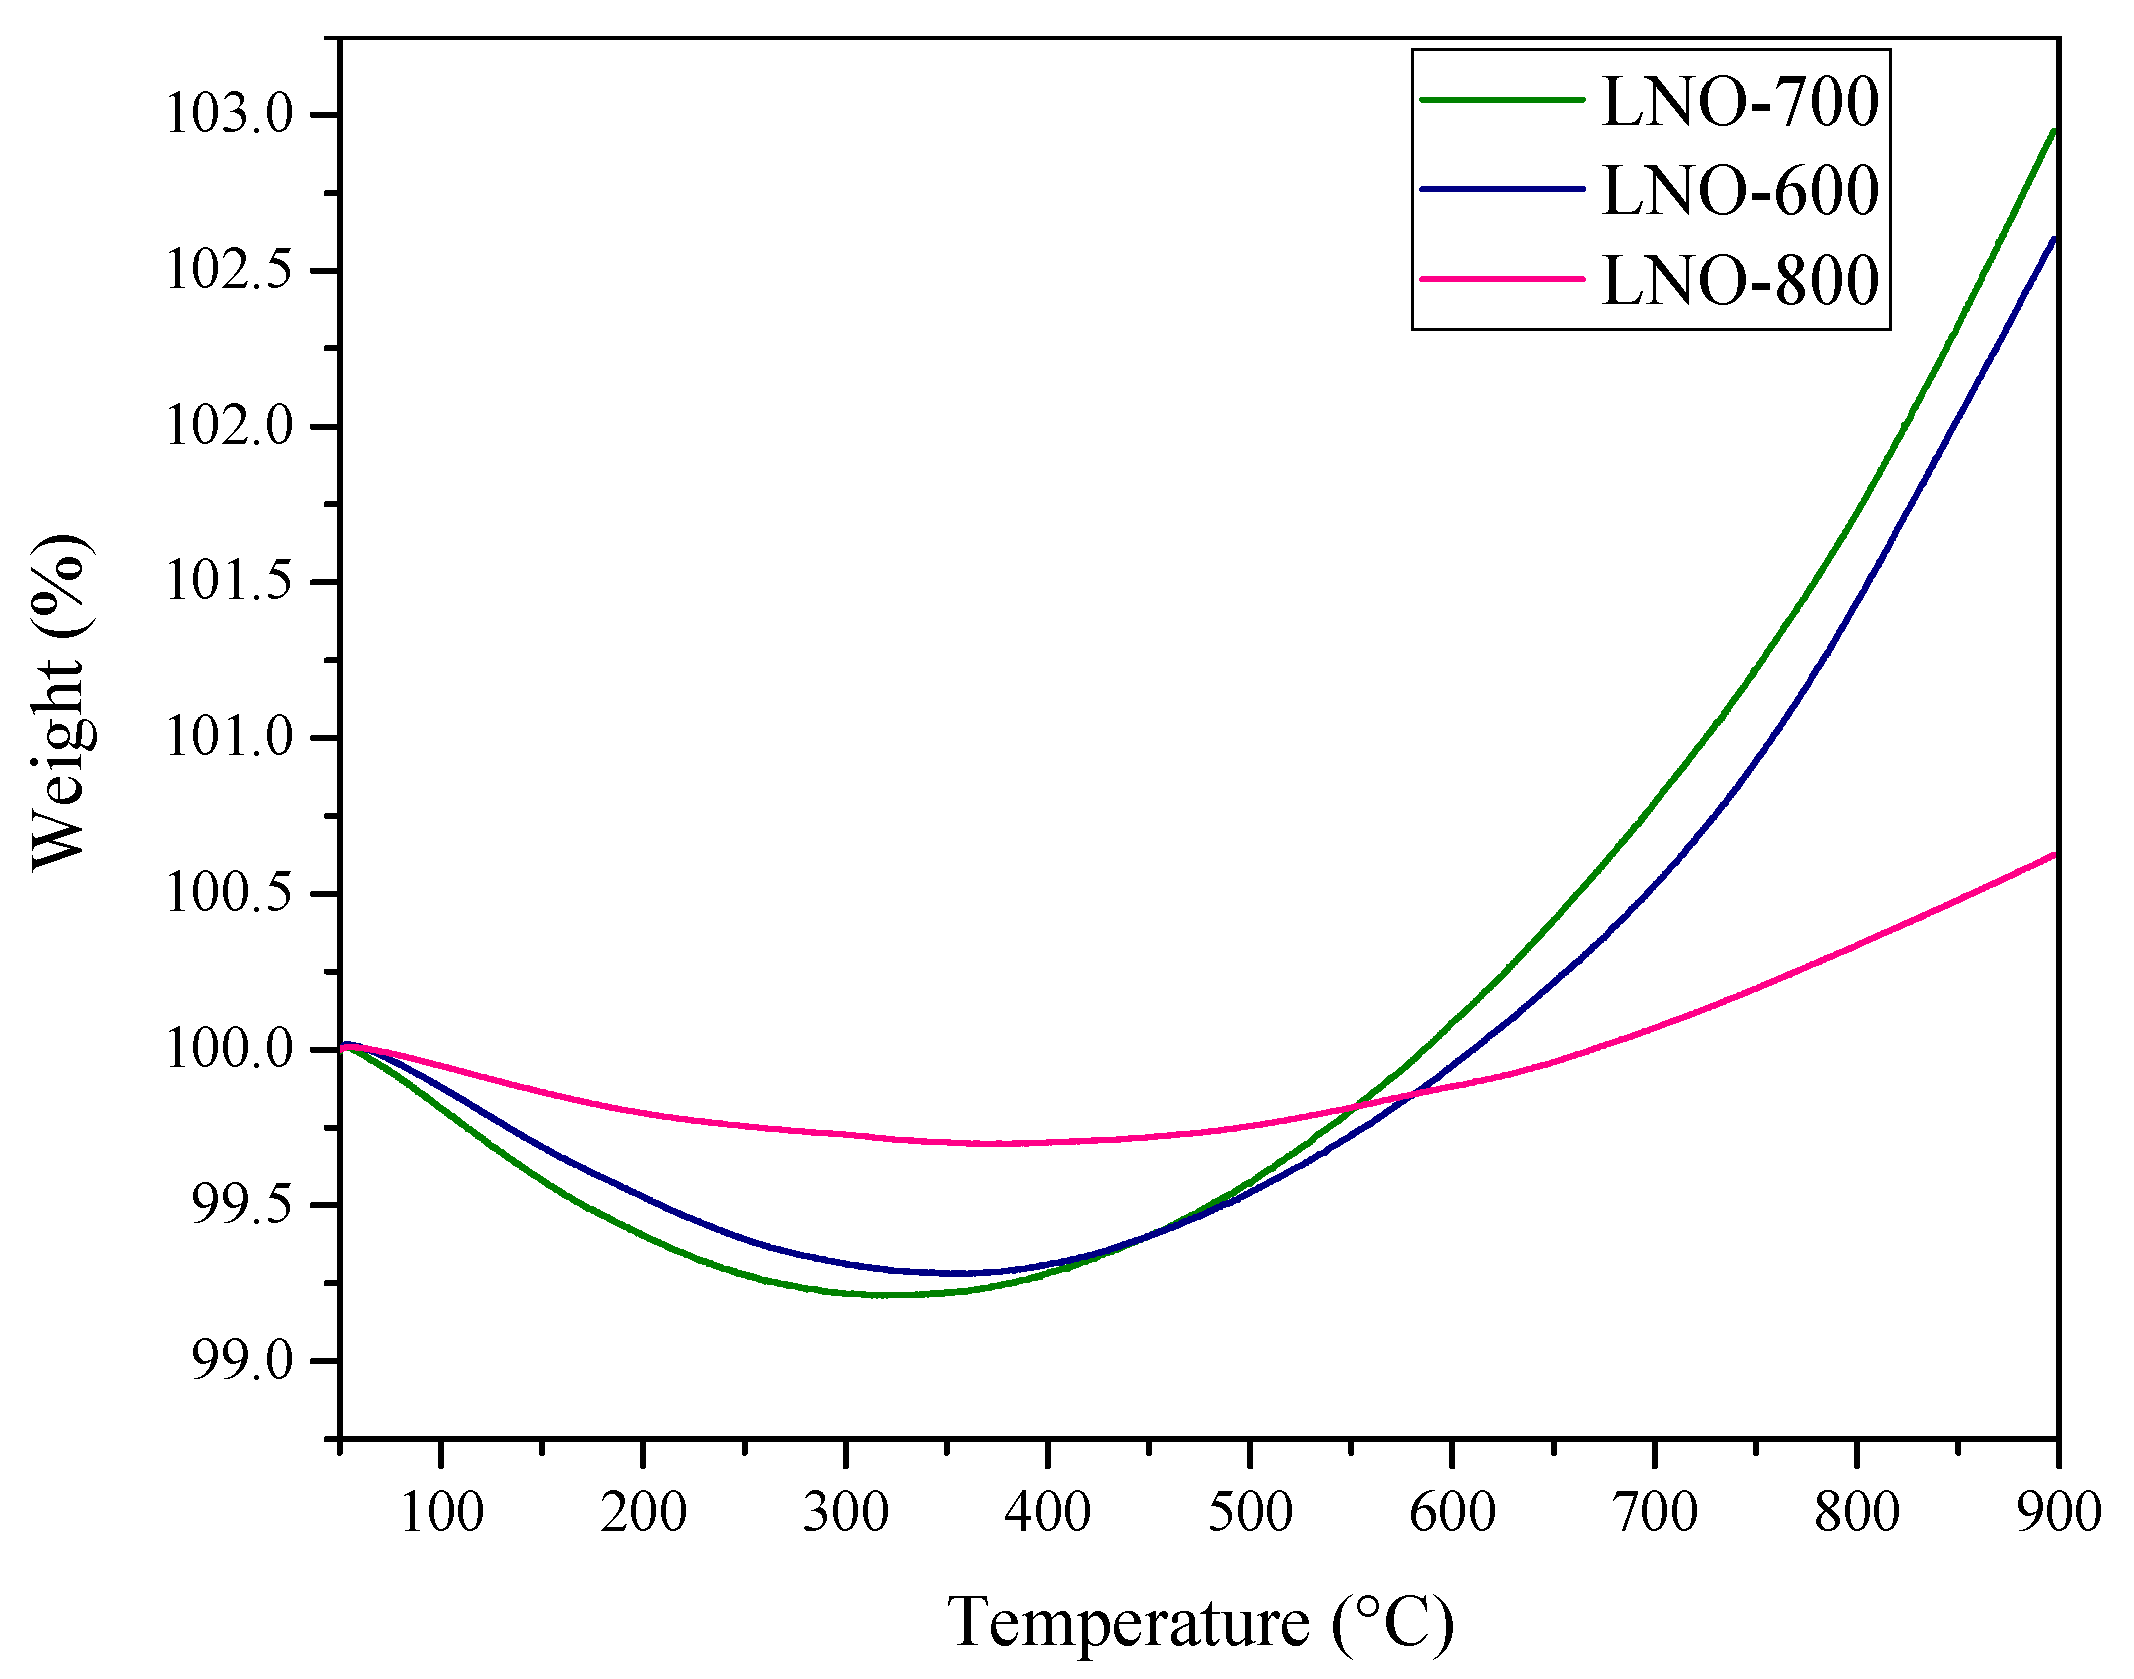
Figure 7.
XPS spectra and deconvolution analysis of La(3d) and Ni(2p) signals of LNO-600 (A), LNO- 700 (B) and LNO- 800 (C), as well as the O (1s) signal of LNO-600 (D), LNO-700 (E), and LNO-800 (F).
Figure 7.
XPS spectra and deconvolution analysis of La(3d) and Ni(2p) signals of LNO-600 (A), LNO- 700 (B) and LNO- 800 (C), as well as the O (1s) signal of LNO-600 (D), LNO-700 (E), and LNO-800 (F).
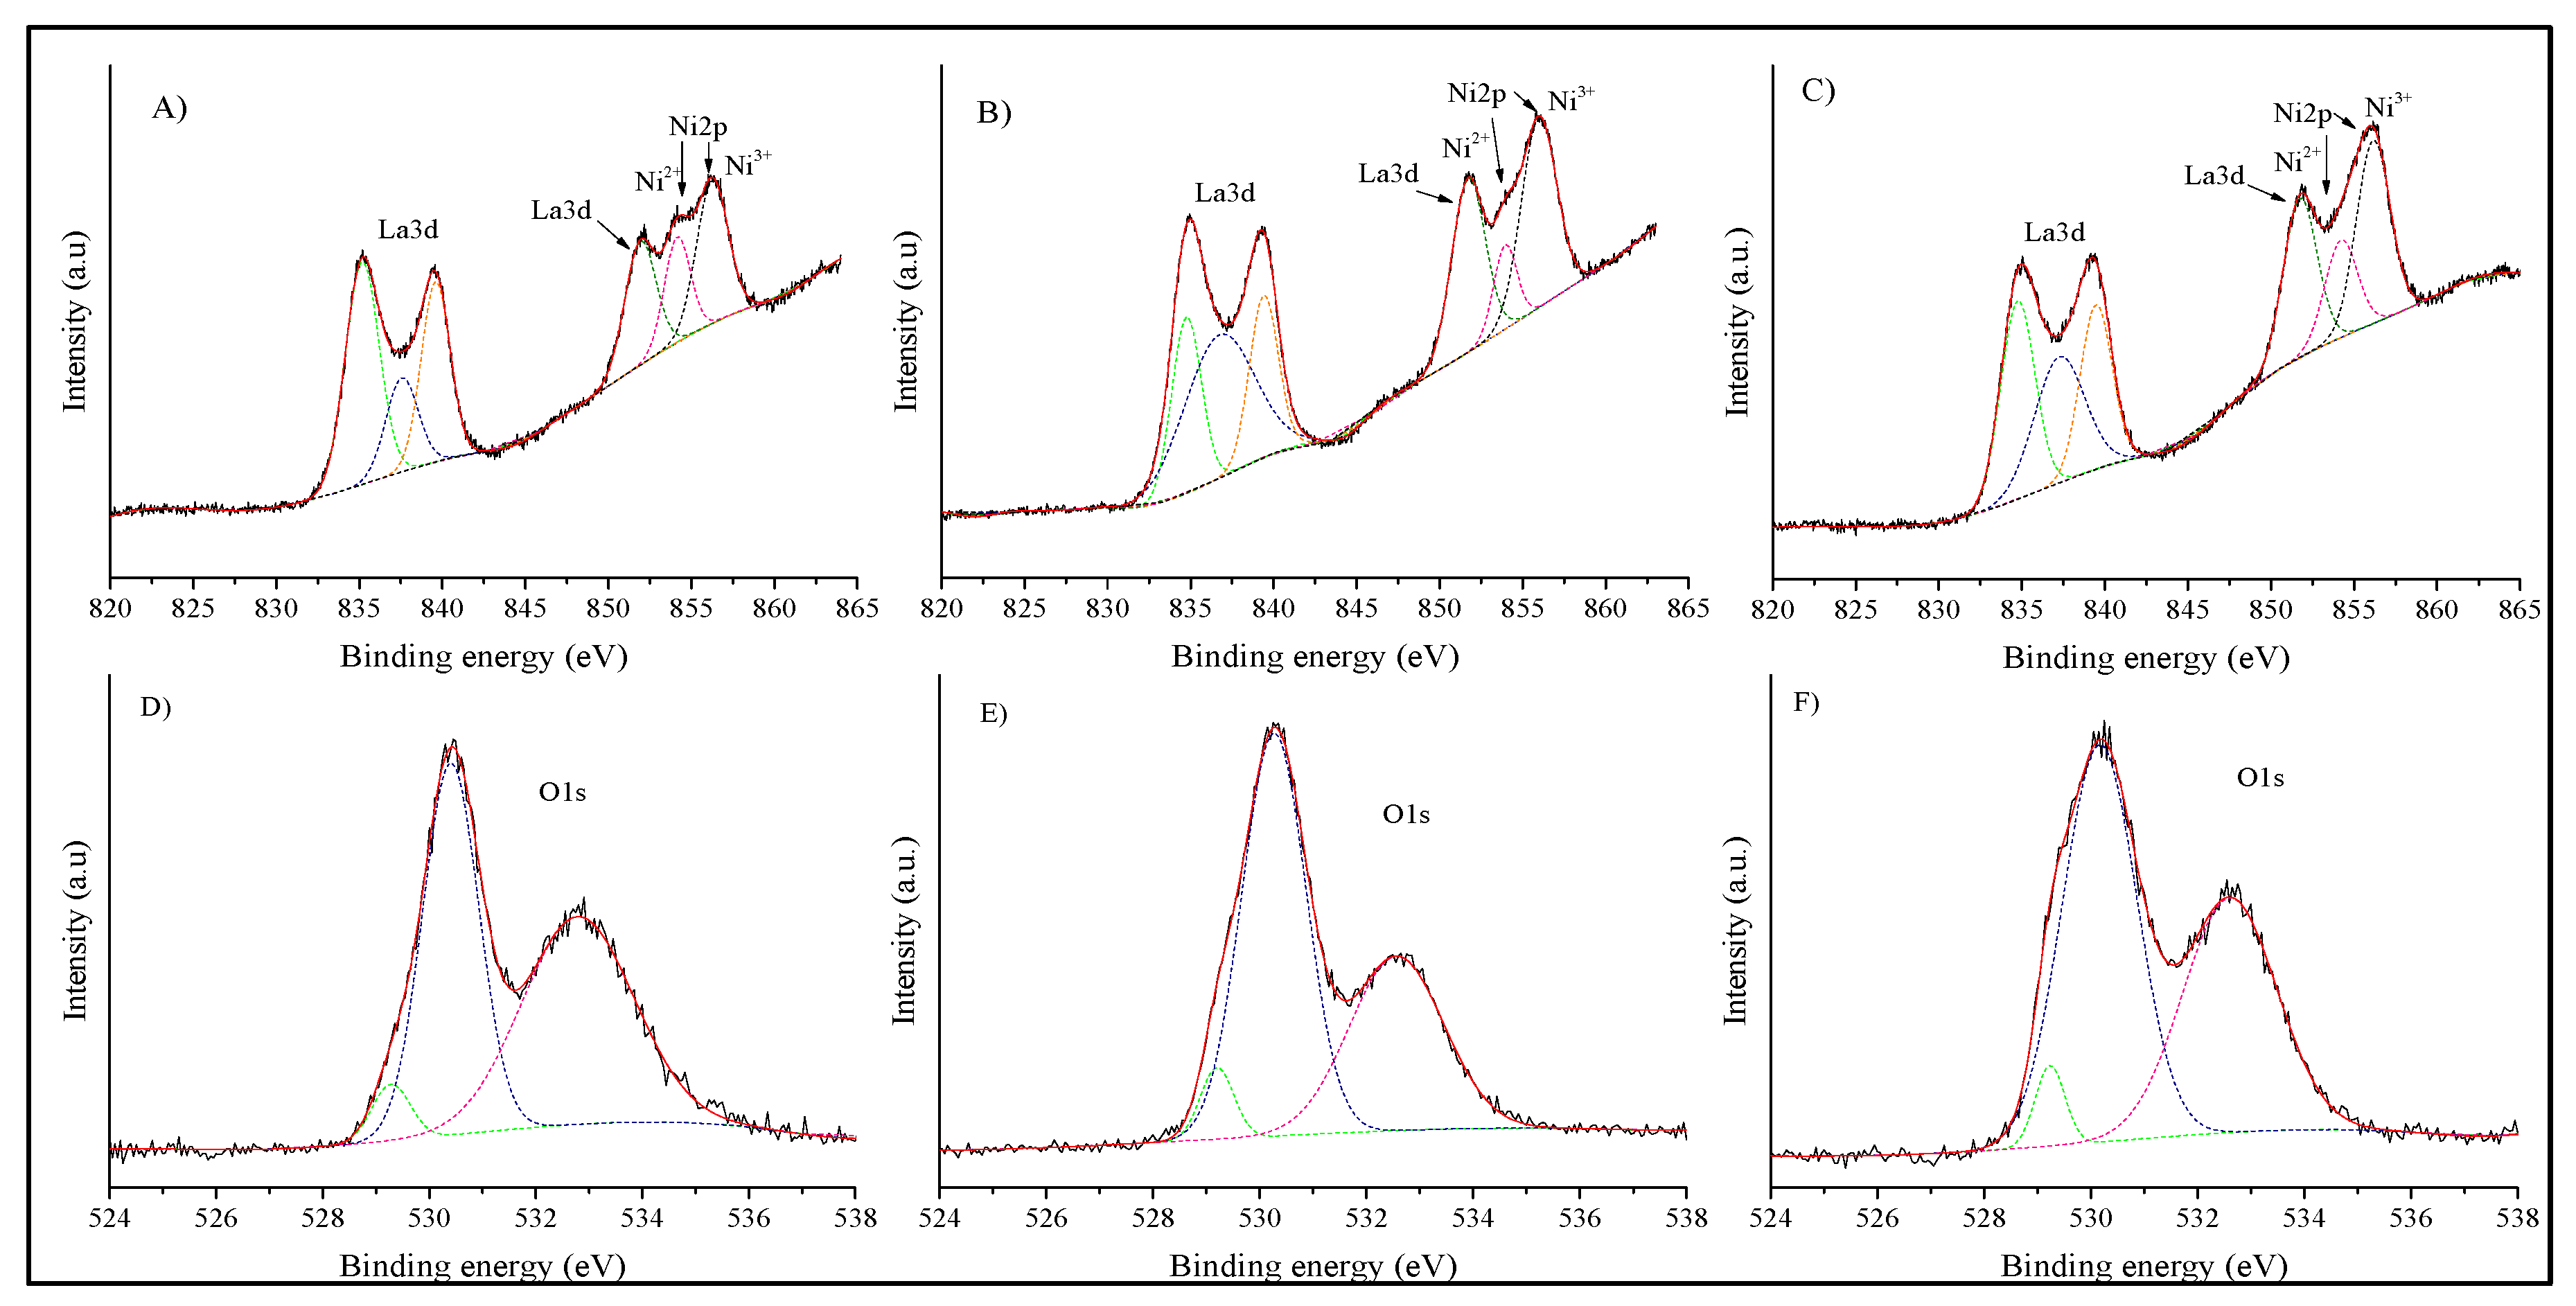
Figure 8.
CO-TPD profiles of LaNiO3 samples synthetized at different temperatures between 600 and 800 °C.
Figure 8.
CO-TPD profiles of LaNiO3 samples synthetized at different temperatures between 600 and 800 °C.
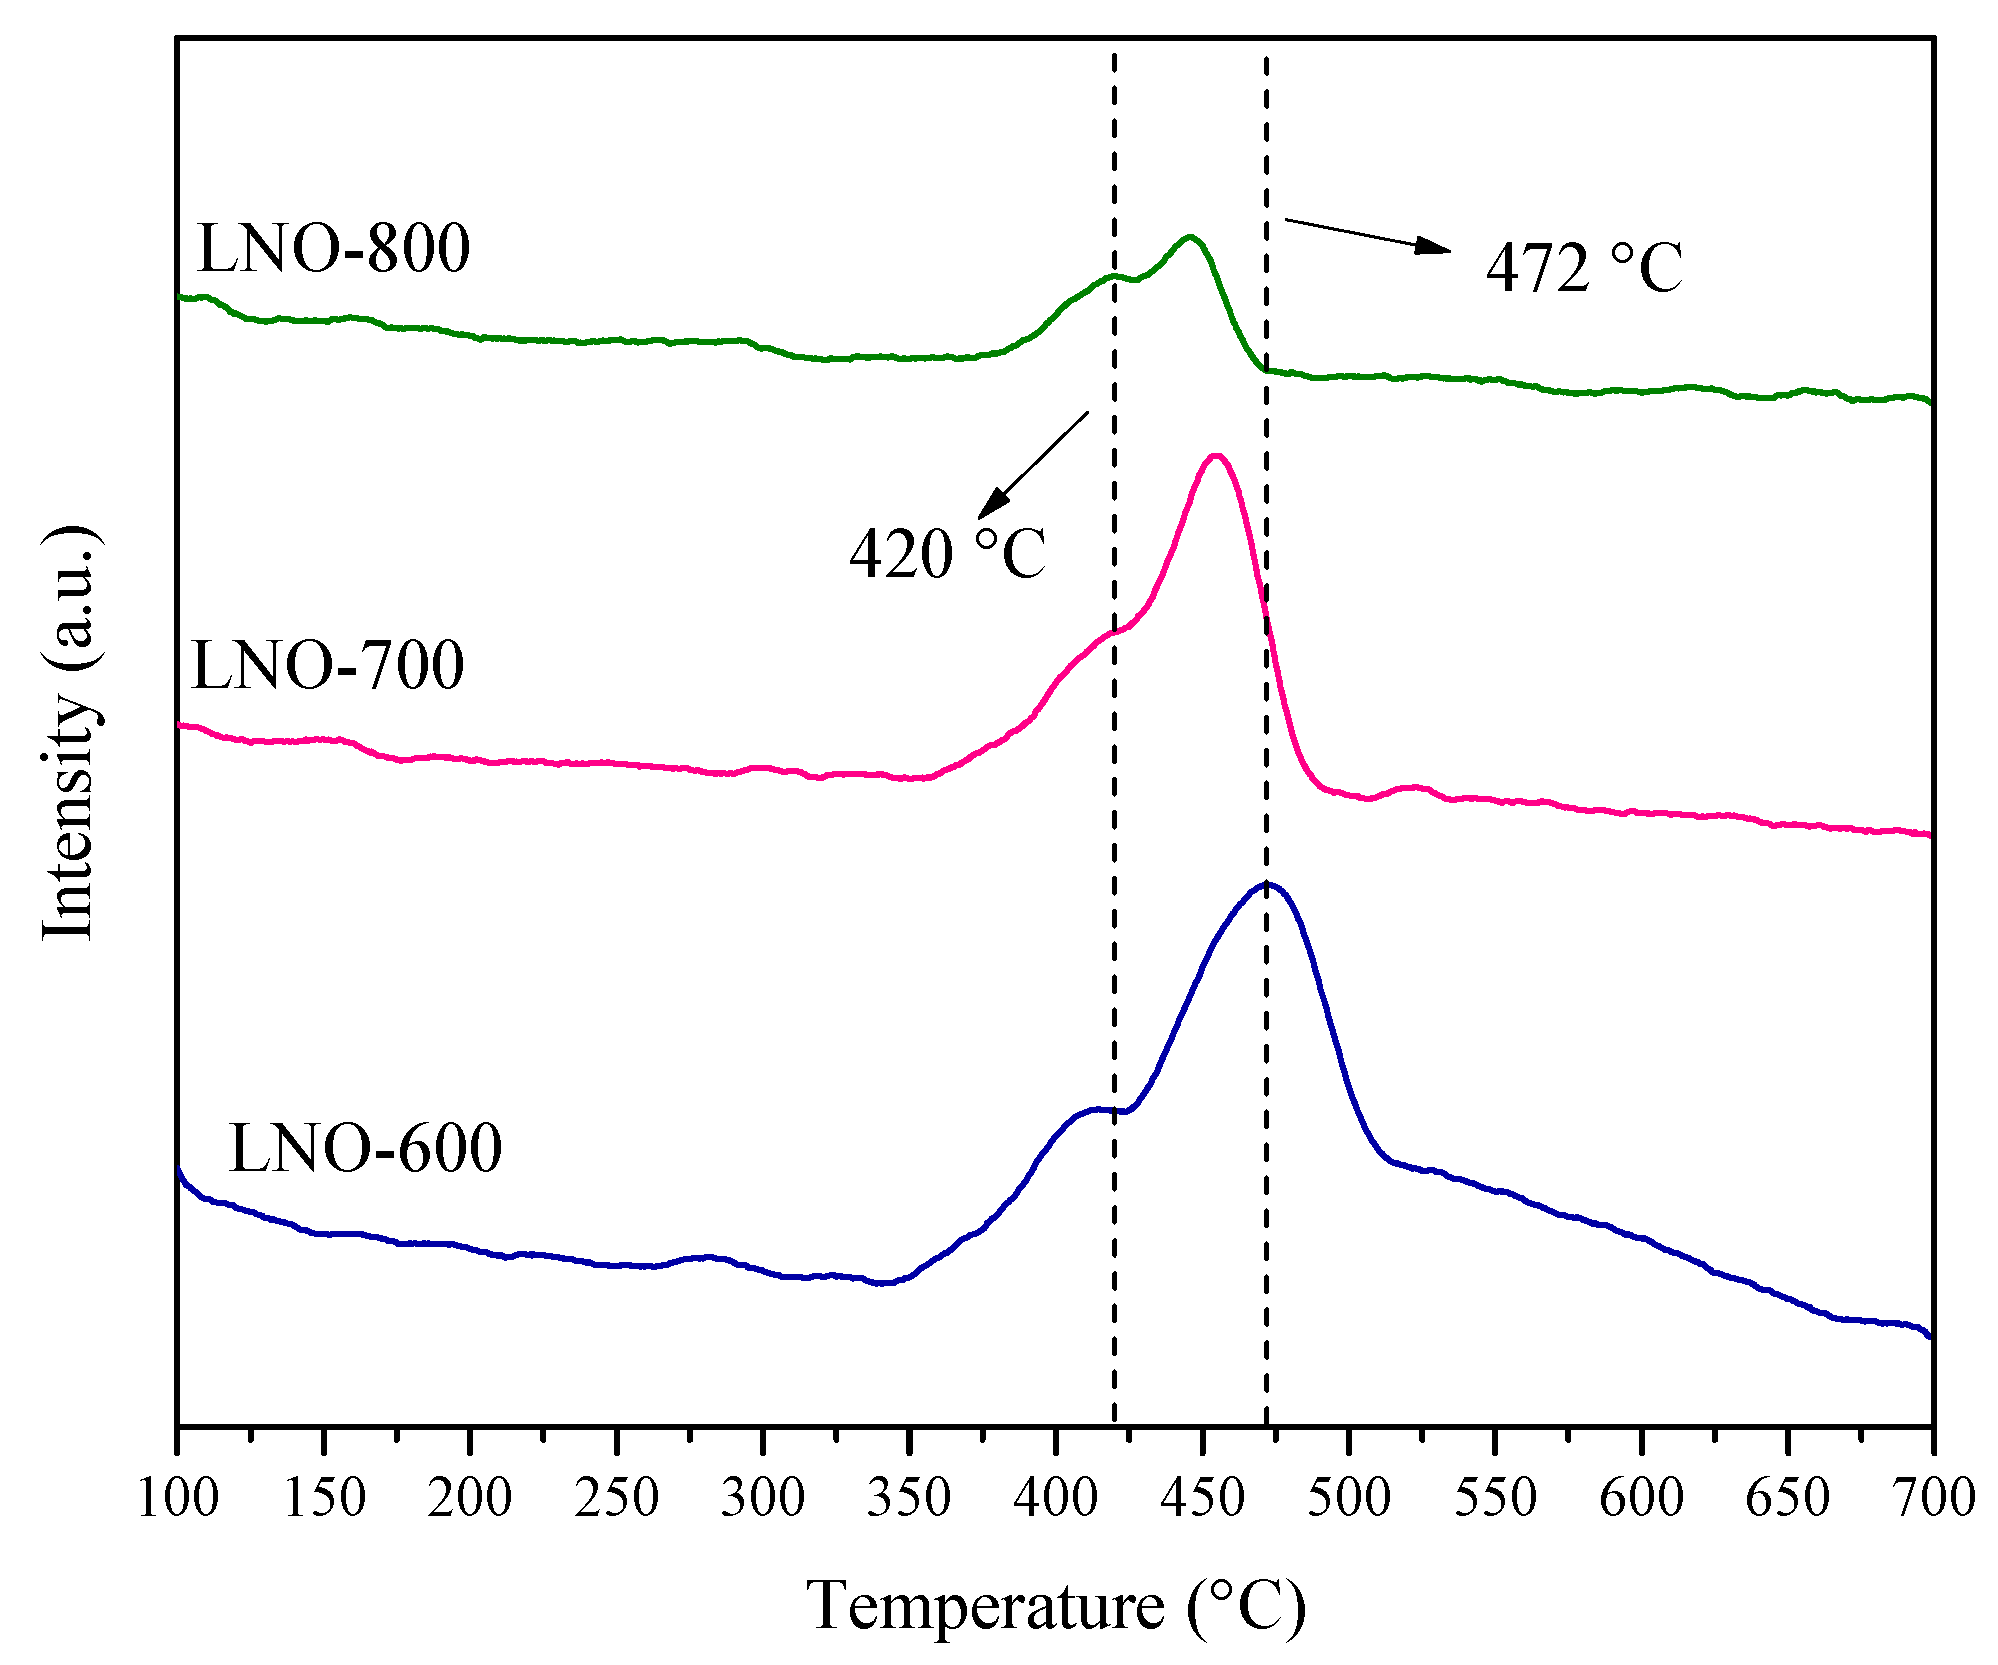
Figure 9.
Secondary electron SEM images of LNO-600 (A), LNO-700 (B), and LNO-800 (C) samples.
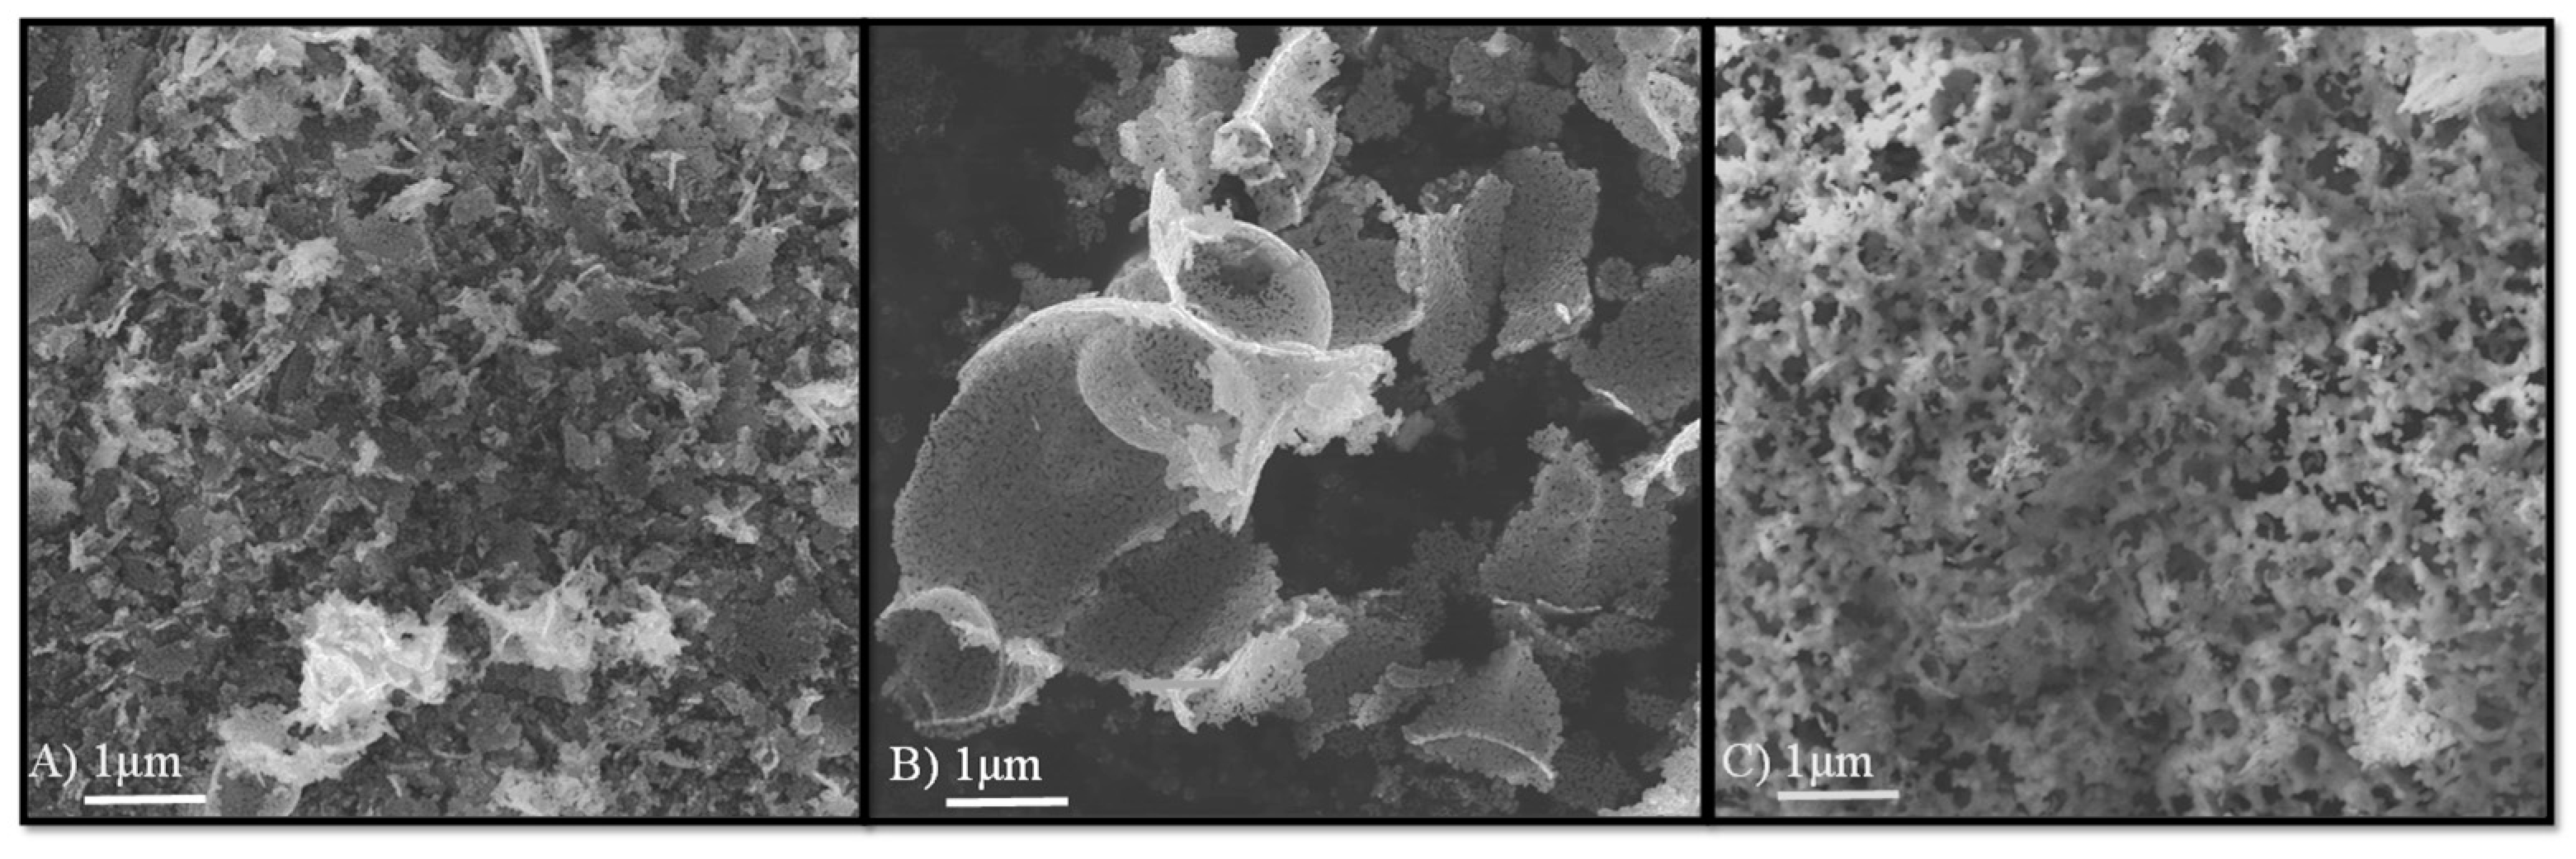
Figure 10.
Dynamic CO conversion for LaNiO3 samples calcined at 600 (A), 700 (B), and 800 °C (C), using different CO and O2 concentrations. Additionally, a direct comparison of the dynamic analysis of the three LaNiO3 samples is included, using 5% of CO and O2 (D).
Figure 10.
Dynamic CO conversion for LaNiO3 samples calcined at 600 (A), 700 (B), and 800 °C (C), using different CO and O2 concentrations. Additionally, a direct comparison of the dynamic analysis of the three LaNiO3 samples is included, using 5% of CO and O2 (D).
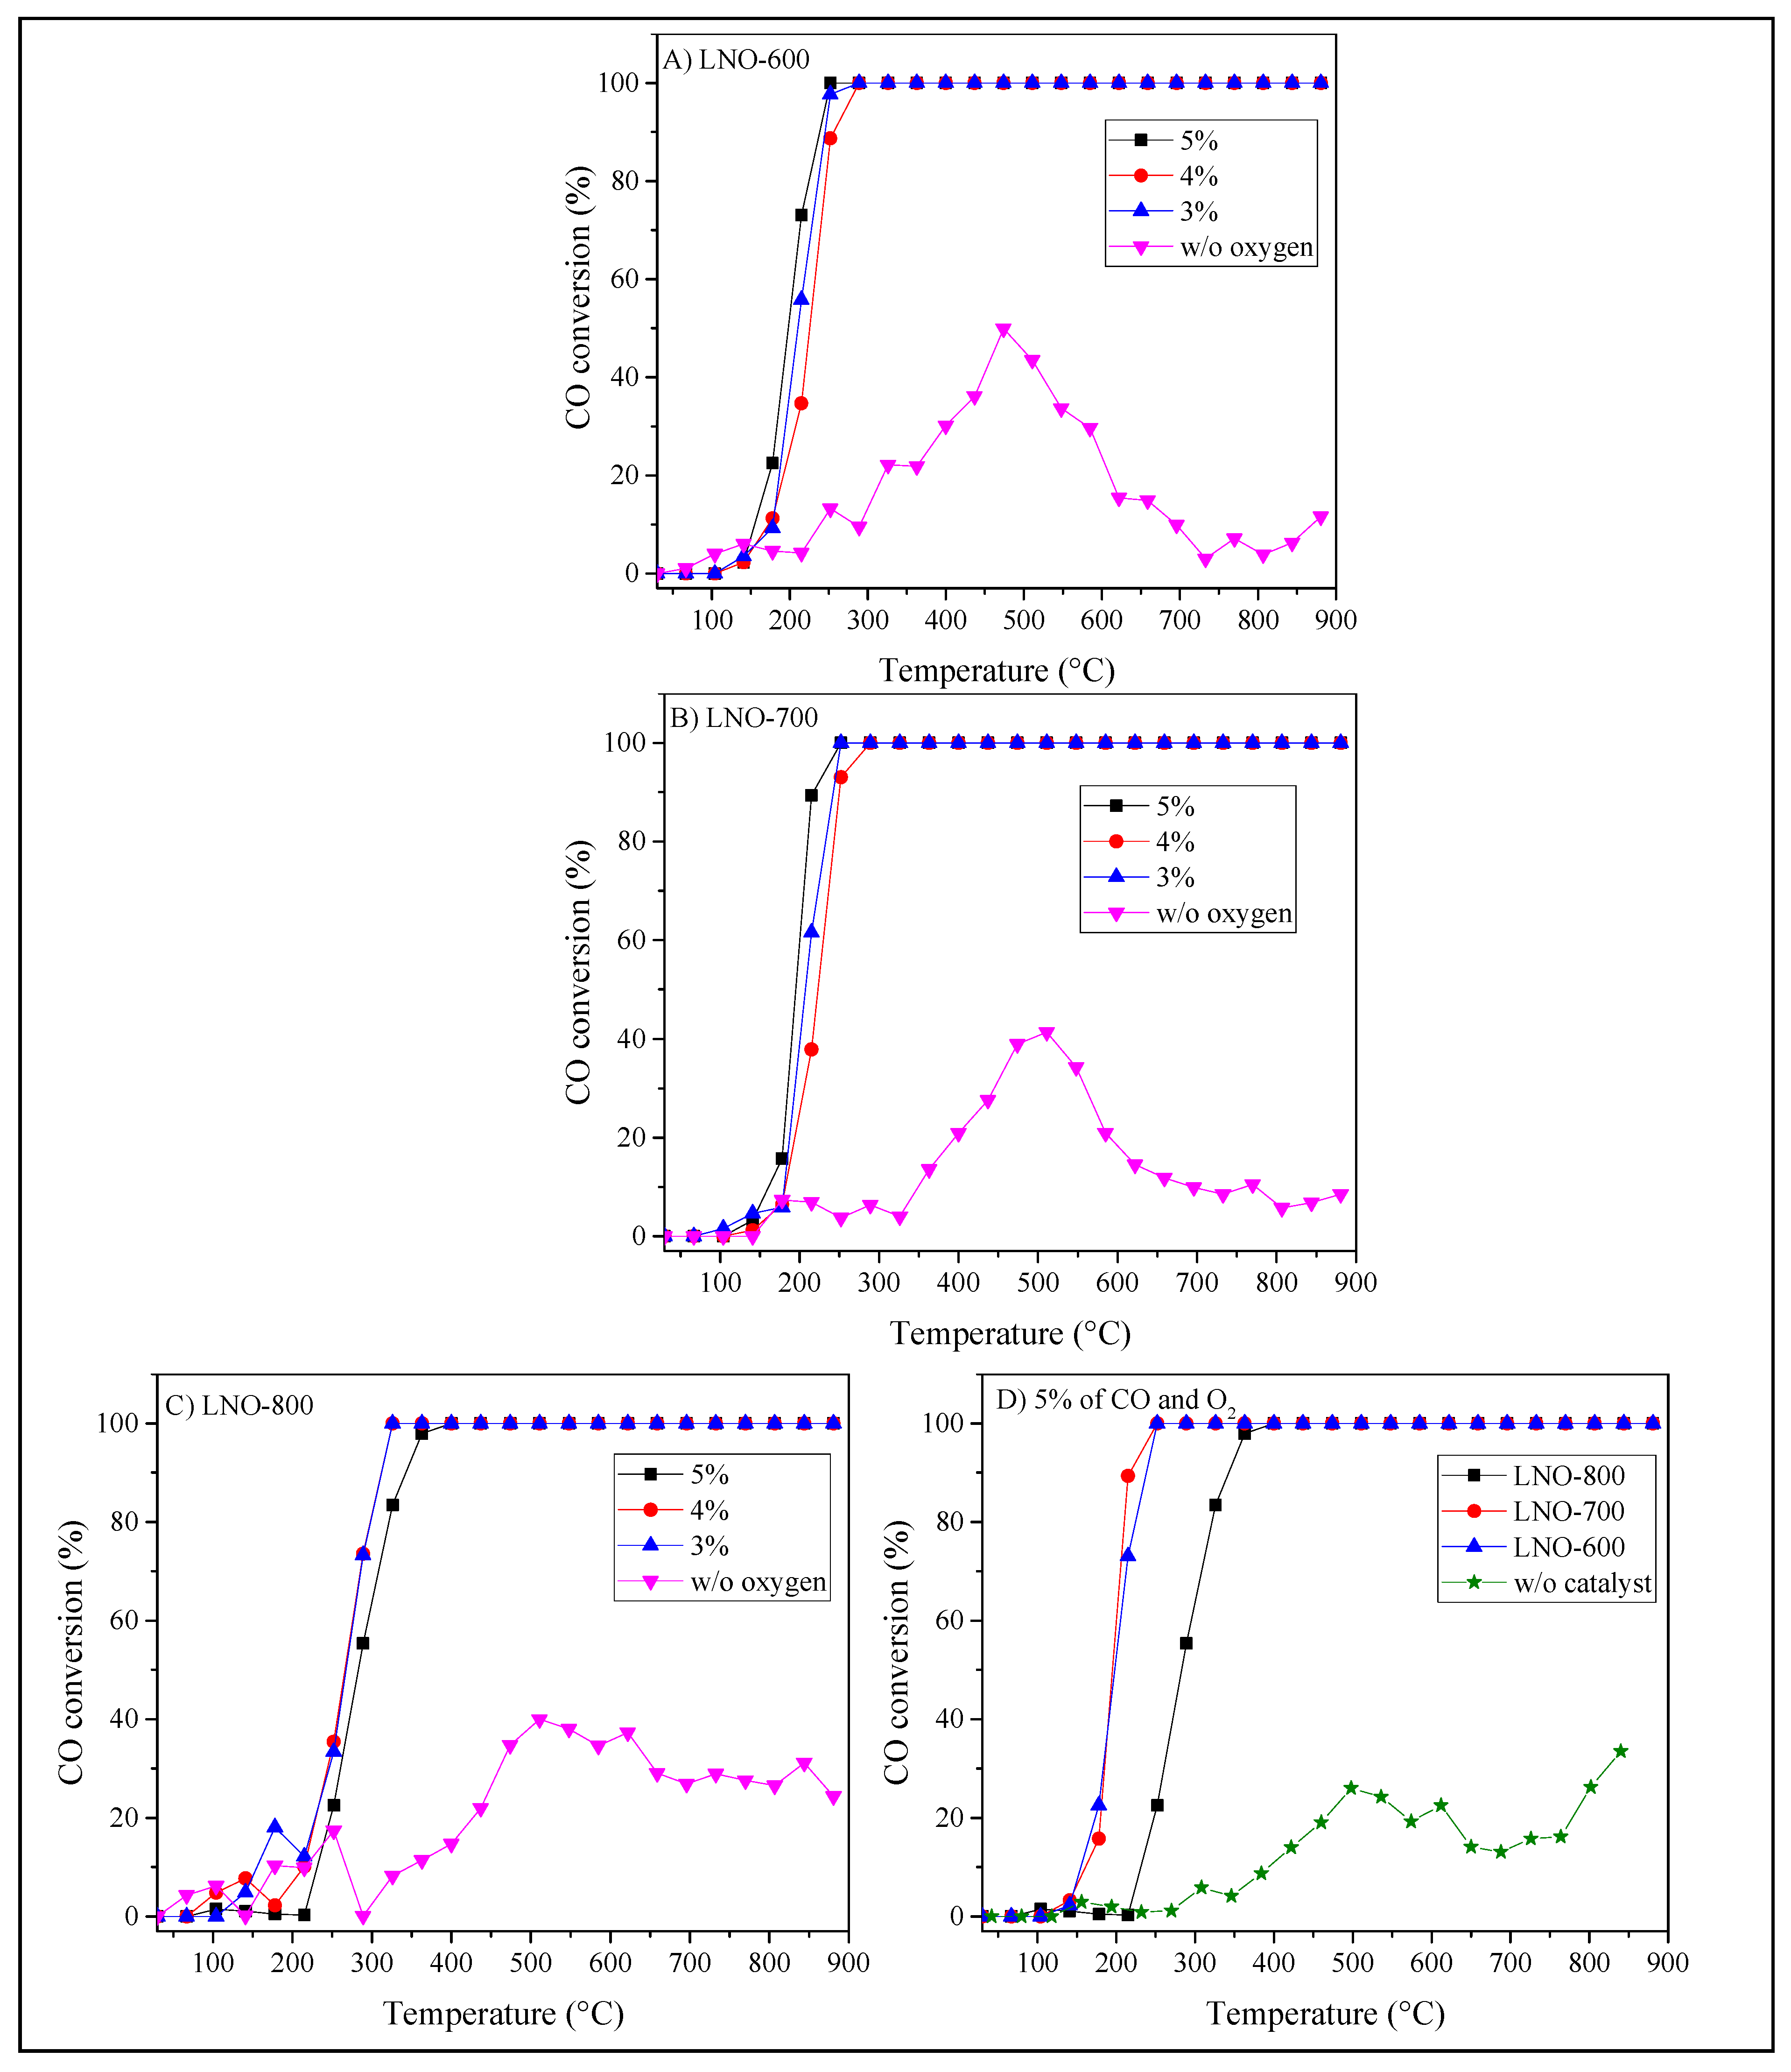
Figure 11.
Isothermal analyses for the LaNiO3 samples calcined at 600 (A), 700 (B), and 800 °C (C).
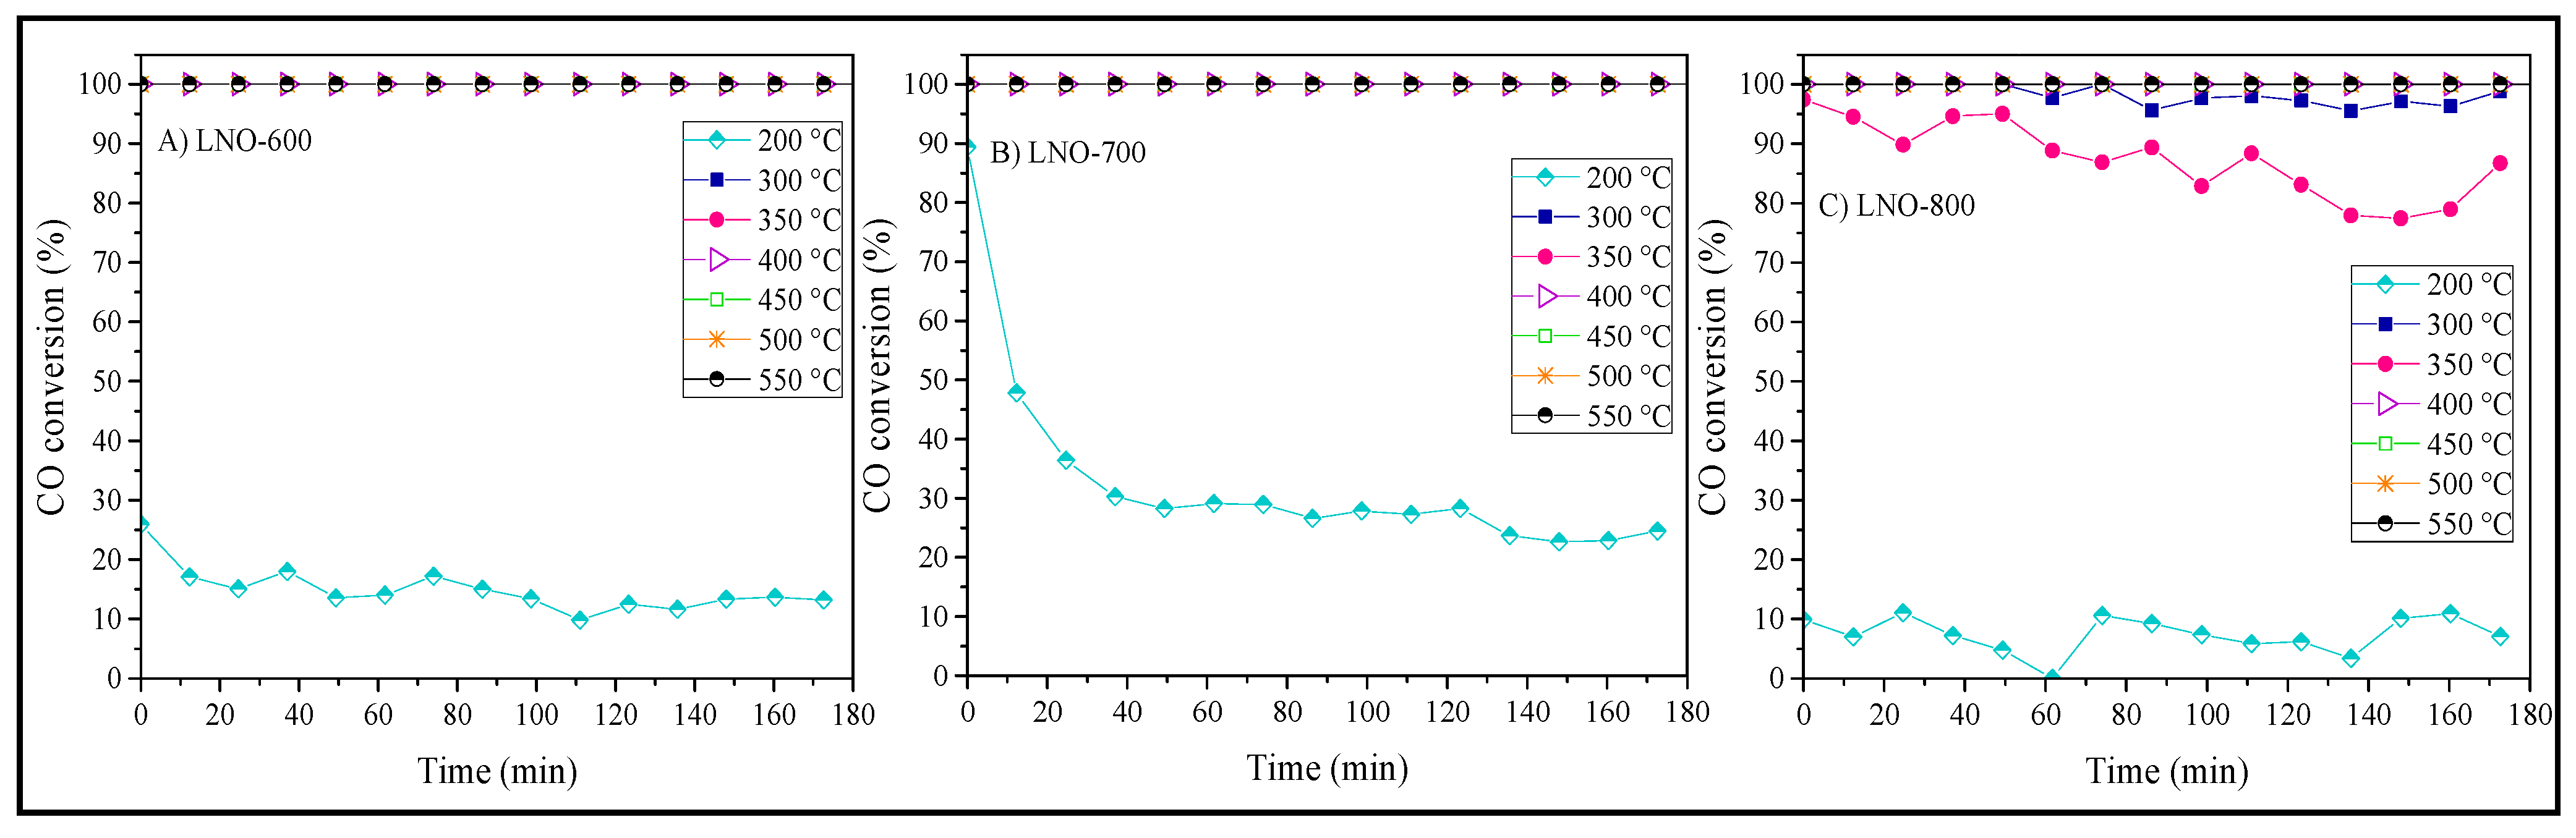
Figure 12.
XRD patterns of the LaNiO3 samples synthetized at 600 (A), 700 (B) and 800 °C (C) after their catalytic performance at different temperatures. The amorphization—mainly observed in some of the LNO-800 sample products—corresponds to the glass sample-holder diffraction produced due to the small quantity of sample recovered after the catalytic experiments.
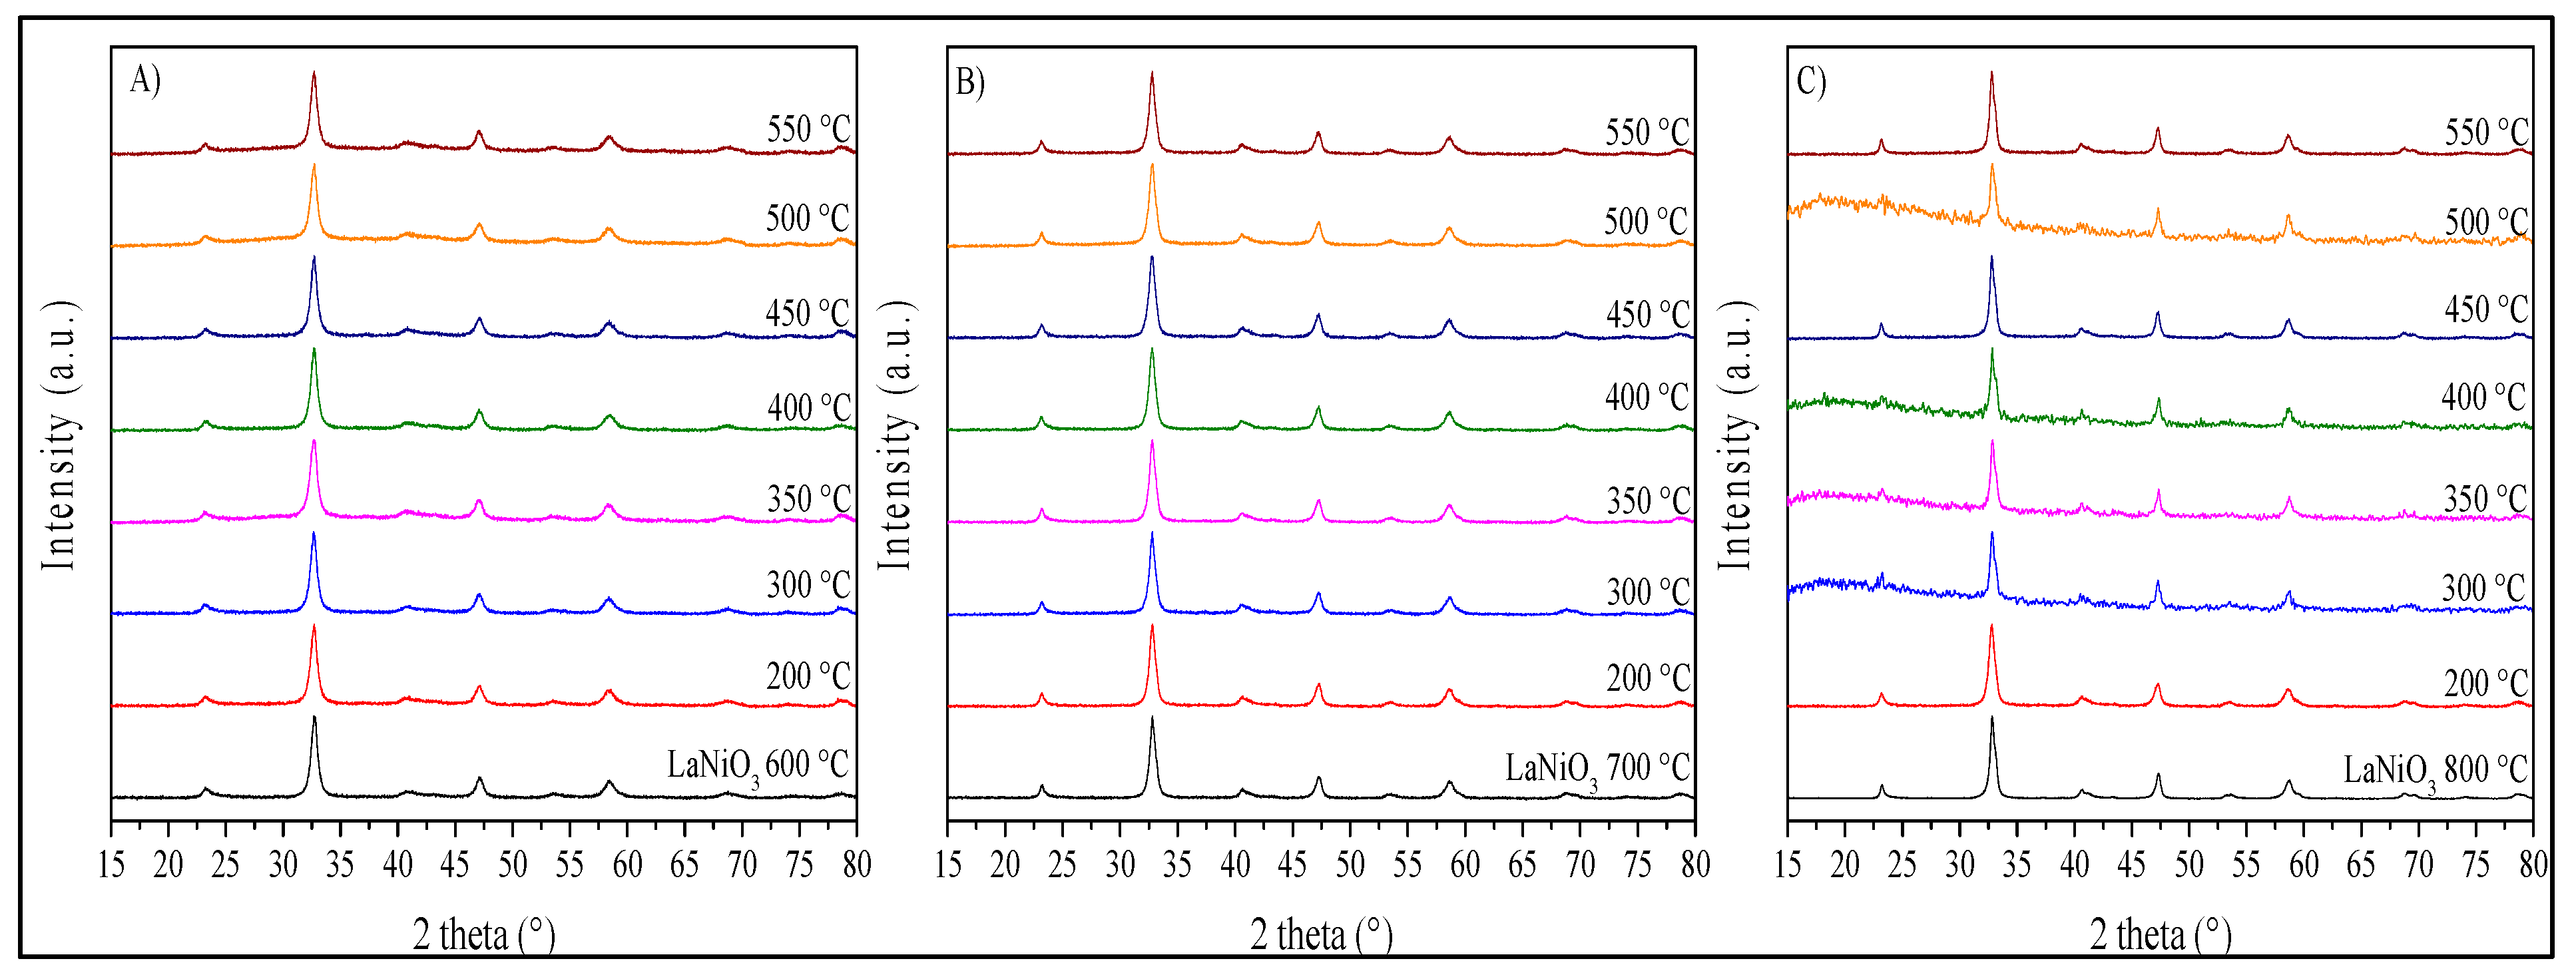
Figure 13.
DRIFTS spectra obtained between 30 and 600 °C for the CO oxidation process using the LNO-600 catalyst (A) and the corresponding amplification of the spectral region (2475 and 2000 cm−1) where the CO and CO2 vibrational modes appear (B).
Figure 13.
DRIFTS spectra obtained between 30 and 600 °C for the CO oxidation process using the LNO-600 catalyst (A) and the corresponding amplification of the spectral region (2475 and 2000 cm−1) where the CO and CO2 vibrational modes appear (B).

Figure 14.
DRIFTS spectra obtained at 194 (A), 295 (B), and 496 °C (C), using the different LaNiO3 catalysts during the CO oxidation process.
Figure 14.
DRIFTS spectra obtained at 194 (A), 295 (B), and 496 °C (C), using the different LaNiO3 catalysts during the CO oxidation process.

Table 1.
XPS fitting binding energy (BE) values and relative area (RA) results obtained from the LaNiO3 samples calcined at different temperatures.
Table 1.
XPS fitting binding energy (BE) values and relative area (RA) results obtained from the LaNiO3 samples calcined at different temperatures.
| LNO-600 | LNO-700 | LNO-800 | Peak identification | ||||||
|---|---|---|---|---|---|---|---|---|---|
| BE (eV) | RA (%) | R2 | BE (eV) | RA (%) | R2 | BE (eV) | RA (%) | R2 | Specie |
| 529.3 | 0.7 | 0.9947 | 529.2 | 0.7 | 0.998 | 529.2 | 0.6 | 0.9964 | O2− |
| 530.4 | 6.6 | 0.9947 | 530.3 | 7.1 | 0.998 | 530.2 | 7.5 | 0.9964 | O2− |
| 532.8 | 7.3 | 0.9947 | 532.6 | 4.5 | 0.998 | 532.6 | 5.5 | 0.9964 | OH1− |
| 835.2 | 24.1 | 0.9961 | 834.8 | 13.3 | 0.9981 | 834.8 | 17.8 | 0.9972 | La(OH)3 |
| 837.6 | 9.6 | 0.9961 | 836.7 | 25.6 | 0.9981 | 837.3 | 16.5 | 0.9972 | La2O3 |
| 839.6 | 16.5 | 0.9961 | 839.4 | 11.8 | 0.9981 | 839.5 | 13.6 | 0.9972 | La(OH)3 |
| 851.9 | 12.3 | 0.9961 | 851.7 | 14.9 | 0.9981 | 851.7 | 14.1 | 0.9972 | La2O3 |
| 854.1 | 8.7 | 0.9961 | 853.9 | 5.0 | 0.9981 | 854.2 | 8.2 | 0.9972 | NiO |
| 856.2 | 14.3 | 0.9961 | 855.9 | 17.2 | 0.9981 | 856.1 | 16.1 | 0.9972 | Ni2O3 |
Publisher’s Note: MDPI stays neutral with regard to jurisdictional claims in published maps and institutional affiliations. |
© 2022 by the authors. Licensee MDPI, Basel, Switzerland. This article is an open access article distributed under the terms and conditions of the Creative Commons Attribution (CC BY) license (https://creativecommons.org/licenses/by/4.0/).
Share and Cite
MDPI and ACS Style
González-Varela, D.; Araiza, D.G.; Díaz, G.; Pfeiffer, H. LaNiO3 Perovskite Synthesis through the EDTA–Citrate Complexing Method and Its Application to CO Oxidation. Catalysts 2022, 12, 57. https://doi.org/10.3390/catal12010057
AMA Style
González-Varela D, Araiza DG, Díaz G, Pfeiffer H. LaNiO3 Perovskite Synthesis through the EDTA–Citrate Complexing Method and Its Application to CO Oxidation. Catalysts. 2022; 12(1):57. https://doi.org/10.3390/catal12010057
Chicago/Turabian StyleGonzález-Varela, Daniela, Daniel G. Araiza, Gabriela Díaz, and Heriberto Pfeiffer. 2022. "LaNiO3 Perovskite Synthesis through the EDTA–Citrate Complexing Method and Its Application to CO Oxidation" Catalysts 12, no. 1: 57. https://doi.org/10.3390/catal12010057
Note that from the first issue of 2016, this journal uses article numbers instead of page numbers. See further details here.