Article

Enhanced Catalytic Performance and Sulfur Dioxide Resistance of Reduced Graphene Oxide-Promoted MnO2 Nanorods-Supported Pt Nanoparticles for Benzene Oxidation

1
Key Laboratory of Beijing on Regional Air Pollution Control, Department of Environmental Science, Faculty of Environment and Life, Beijing University of Technology, Beijing 100124, China
2
Beijing Huaneng Yangtze Environmental Technology Research Institute Co., Ltd., Beijing 102209, China
3
Beijing Key Laboratory for Green Catalysis and Separation, Key Laboratory of Beijing on Regional Air Pollution Control, Key Laboratory of Advanced Functional Materials, Education Ministry of China, and Laboratory of Catalysis Chemistry and Nanoscience, Department of Chemical Engineering, Faculty of Environment and Life, Beijing University of Technology, Beijing 100124, China
*
Authors to whom correspondence should be addressed.
Catalysts 2022, 12(11), 1426; https://doi.org/10.3390/catal12111426
Submission received: 13 October 2022 / Revised: 4 November 2022 / Accepted: 11 November 2022 / Published: 13 November 2022
(This article belongs to the Special Issue Exclusive Papers in Environmentally Friendly Catalysis in China)

Abstract

:
The reduced graphene oxide (rGO)-promoted α-MnO2 nanorods-supported Pt (xPt-yrGO/α-MnO2, x = 0.93 wt%, y = 0.5, 1.0, and 2.0 wt%) nanocatalysts were prepared using a polyvinyl alcohol (PVA)-protected reduction method. After an appropriate loading of Pt on α-MnO2, the strong metal–support interaction between Pt and α-MnO2 was beneficial for an increase in catalytic activity. The simultaneous addition of rGO to α-MnO2 not only provided a more amount of benzene adsorption sites, but also acted as an electron transfer channel to accelerate charge migration, thus further improving catalytic activity of α-MnO2. Among all of the catalyst samples, 0.94Pt-1.0rGO/α-MnO2 showed the best catalytic performance with 90% benzene conversion at 160 °C and a gas hourly space velocity (GHSV) of 60,000 mL/(g h), which was better than that over the other Pt-based catalysts. The results of in situ DRIFTS characterization revealed that phenol, benzoquinone, and carboxylate species were the intermediates and eventually oxidized to CO2 and H2O. When sulfur dioxide was present, catalytic activity of α-MnO2 decreased due to the formation of manganese sulfate that blocked the active sites, while the loading of Pt and rGO hindered the chemisorption of SO2 and prevented the active sites of the catalyst from being poisoned by SO2, thus enhancing sulfur resistance of the catalyst. The 0.94Pt-1.0rGO/α-MnO2 catalyst presented in this work can be considered as a cost-effective and promising catalyst for the oxidative removal of volatile organic compounds.

1. Introduction

Volatile organic compounds (VOCs) are involved in atmospheric photochemical reactions and are also key precursors of PM2.5 and O3, which are prone to photochemical pollution and urban haze [1]. VOCs usually include benzene, toluene, formaldehyde, and etc. These organics can enter human body through the respiratory system and skin, pose a serious threat to human health, and even induce cancer [2,3]. Currently, the main technologies of VOCs treatments include physical adsorption, catalytic oxidation, and biological treatment. Among them, catalytic oxidation is more effective in removing VOCs because of its good safety, no secondary pollution, and low reaction temperatures [4].
At present, the catalysts used for catalytic oxidation mainly include transition metal oxide catalysts and noble metal-based catalysts. Noble metal catalysts show good activity, but their disadvantages are high cost and complicated preparation processes. Although catalytic activities of transition metal oxides are worse than those of noble metals, the former is cheap and contains a large amount of oxidation state metal ions and lattice defects (oxygen vacancies) and can be used as catalytic supports [5]. Among transition metal oxides, manganese oxides have a variety of valence states, crystal phases, morphologies, and high catalytic oxidation activity, and hence are widely studied in catalytic oxidation of VOCs [6]. For example, Fan et al. [7] successfully synthesized α-, γ-, and β-MnO2, and found that α-MnO2 catalyzed toluene oxidation with the best activity due to its good redox performance and high lattice oxygen mobility. Surface metal modification of manganese oxides can improve catalytic performance. Using manganese oxides as a support and doping noble metals or transition metals in appropriate amounts can increase the oxygen vacancies and improve catalytic oxidation activity and thermal stability of the catalysts. The impact of Cu-doped MnO2 on the removal efficiency of two ketones VOCs was investigated by Zeng et al. [8] The synergistic interaction between Cu and Mn in the Cu-Mn catalysts was found to improve the catalytic activity by increasing the surface active oxygen concentration and low-temperature reducibility. Huang et al. [9] studied the formaldehyde oxidation over the Ag/MnO2 nanorods with different silver loadings, and observed that 0.1% Ag/MnO2-r could catalyze the complete conversion of HCHO at 80 °C. The increase in catalytic activity was attributed to the strong metal–support interaction (SMSI), increased surface oxygen vacancies, and improved surface lattice oxygen mobility of MnO2, and enhanced low-temperature reducibility.
Graphene oxide (GO) is widely used in heterogeneous catalysis because of its unique two-dimensional layered structure, high surface area, and powerful electron transport ability. In recent years, there have been several studies on improving the efficiency of catalysts for catalytic oxidation of CO and VOCs by doping with graphene. Reduced graphene oxide (RGO) was introduced into the Au/3DOM Co3O4 catalysts by Xie et al. [10] to obtain a series of Au/rGO/3DOM Co3O4 catalysts. It was shown that rGO acted as an electron transmission channel between Au and 3DOM Co3O4, and significantly enhanced the SMSI and the activation of oxygen molecules, hence resulting in a significant improvement in catalytic CO oxidation activity. Lu et al. [11] loaded GO on MnO2, and found that the loading of GO gave rise to a complete conversion of HCHO in HCHO oxidation at 65 °C.
In this work, we adopted the polyvinyl alcohol (PVA)-protecting reduction strategy to prepare the xPt-yrGO/α-MnO2 catalysts, employed various techniques to characterize their physicochemical properties, evaluated their catalytic activities for benzene oxidation, examined their water and sulfur dioxide resistance, and investigated their reaction mechanisms.

2. Results and Discussion

2.1. Catalyst Performance and Stability

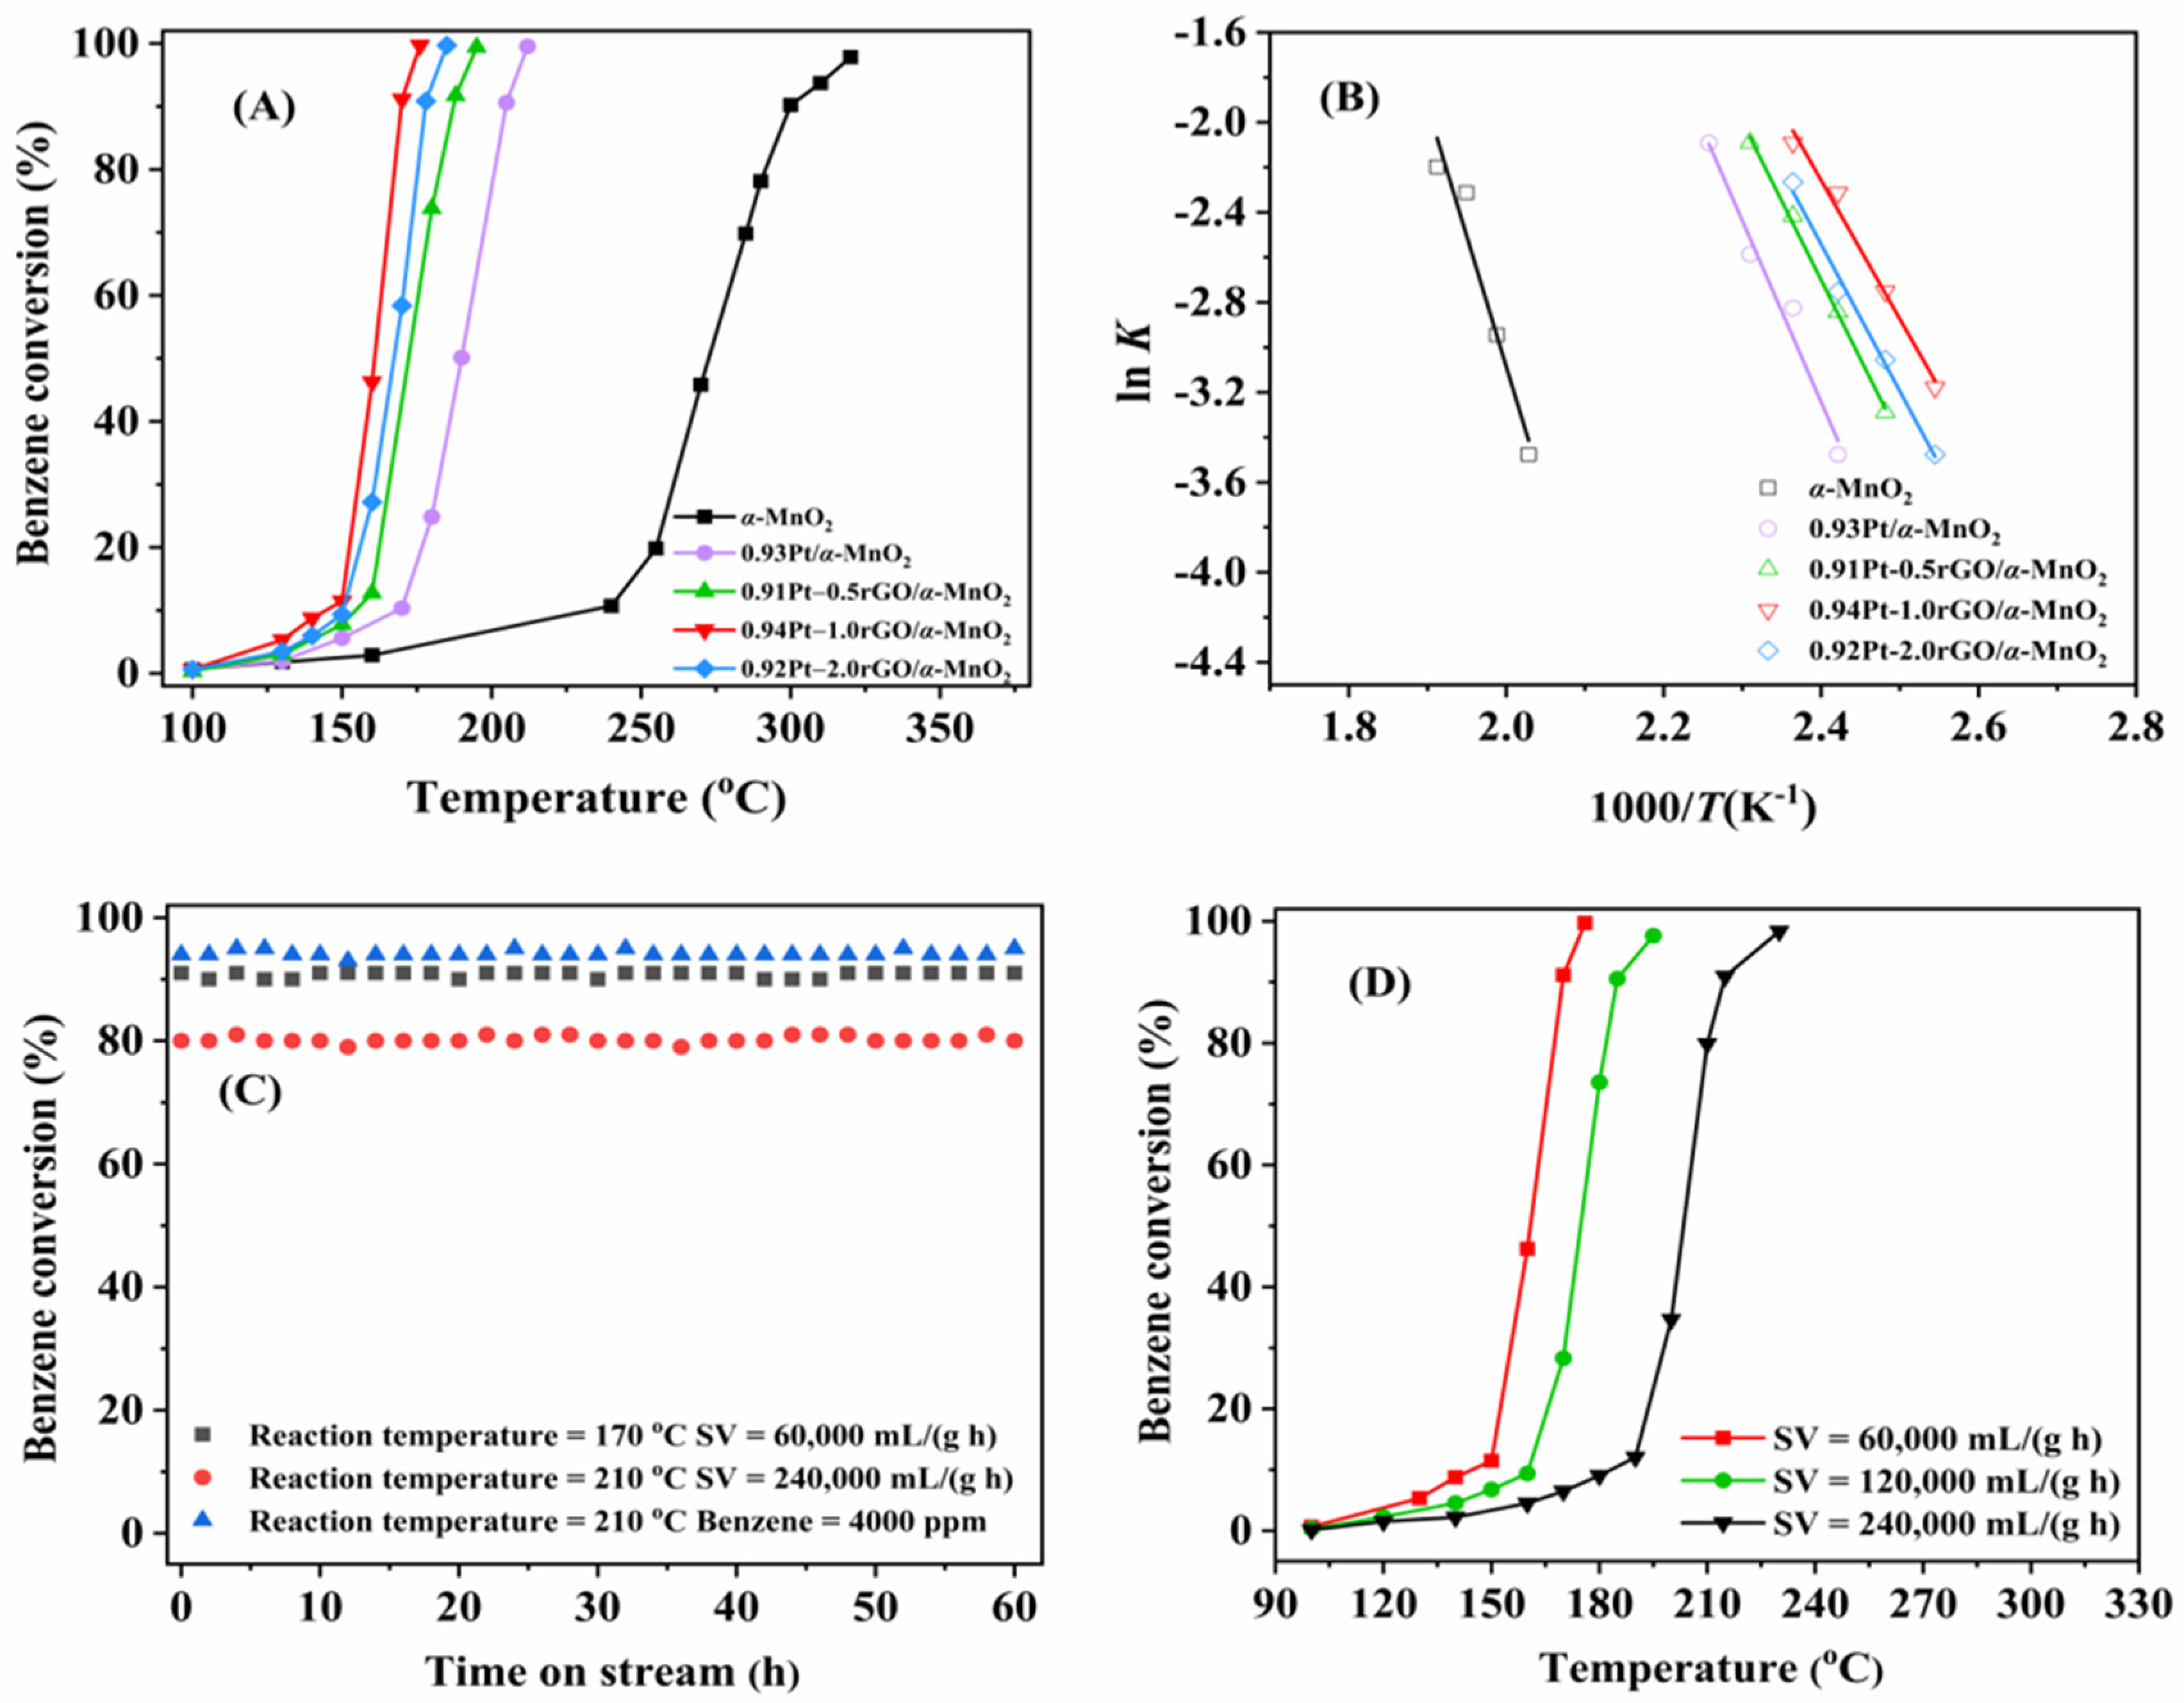
2.1.1. Catalyst Performance

Figure 1A shows the catalytic activities of xPt-yrGO/α-MnO2 (x = 0.93–0.95 wt%, y = 0.5, 1.0, and 2.0 wt%) samples for benzene oxidation, and their T10%, T50%, and T90% values are summarized in Table 1. At a GHSV of 60,000 mL/(g h), catalytic activity decreased in the order of 0.94Pt-1.0rGO/α-MnO2 (T90% = 169 °C) > 0.92Pt-2.0rGO/α-MnO2 (T90% = 178 °C) > 0.91Pt-0.5rGO/α-MnO2 (T90% = 188 °C) > 0.93Pt/α-MnO2 (T90% = 205 °C) > α-MnO2 (T90% = 300 °C). The performance of the xPt-yrGO/α-MnO2 samples was significantly higher than that of the α-MnO2 and rGO-free 0.93Pt/α-MnO2 samples. For example, the T50% and T90% over 0.94Pt-1.0rGO/α-MnO2 were 163 and 169 °C, while those over rGO-free 0.93Pt/α-MnO2 were 190 and 205 °C, respectively. In addition, different loadings of rGO led to a difference in catalytic activity. The activity of xPt-yrGO/α-MnO2 increased with the rise in rGO loading from 0.5 to 1.0 wt%, but decreased when the rGO loading rose from 1.0 to 2.0 wt%. This result might be due to the partial covering of the surface active sites on the catalyst by the excessively loaded rGO. Among all of the samples, 0.94Pt-1rGO/α-MnO2 showed the highest catalytic activity, which was associated with the loading of rGO, the promotion of the electron transfer between Pt and α-MnO2, and the enhancement of the SMSI between Pt and α-MnO2 [12].
According to the activity data and the Pt loadings in the samples, their TOFs for benzene oxidation were calculated, as listed in Table 1. The TOFs (0.47 × 10⁻²–1.54 × 10⁻² s−1) over xPt-yrGO/α-MnO2 were significantly higher than that (0.28 × 10⁻² s−1) over rGO-free 0.93Pt/α-MnO2. Among all of the samples, 0.94Pt-1.0rGO/α-MnO2 exhibited the highest TOF at 149 °C (5.73 × 10⁻² s−1). Furthermore, the rcat values (8.18 × 10⁻⁵–3.14 × 10⁻⁴ mol/(gPt s)) over xPt-yrGO/α-MnO2 were higher than that (5.11 × 10⁻⁵ mol/(gPt s)) over 0.93Pt/α-MnO2. Among all of the samples, 0.94Pt-1.0rGO/α-MnO2 showed the highest benzene oxidation rate, which was consistent with the sequence in catalytic activity. Moreover, Table S1 summarizes the reaction rates (rcat) for benzene oxidation over the different samples reported in the literature. Obviously, the rcat value at 149 °C decreased in the sequence of 0.94Pt-1.0rGO/α-MnO2 (6.35 × 10⁻⁴ mol/(gPt s)) > Pt/TMS (2.04 × 10⁻⁵ mol/(gPt s)) [13] > Pt/TS-1 (6.82 × 10⁻⁵ mol/(gPt s)) [14] > Pt/eggshell (4.08 × 10⁻⁴ mol/(gPt s)) [15] > Pt/OMS-2 (1.58 × 10⁻⁴ mol/(gPt s)) [16] > Pt1/meso-Fe2O3 (6.82 × 10⁻⁵ mol/(gPt s)) [17].
Many studies [4,5,6,7,8,9] carried out in recent years have shown that the oxidation of VOCs conforms to a first-order reaction mechanism, so that at a benzene/O2 molar ratio = 1/400 (excess O2), the oxidation of benzene would also follow the first-order reaction mechanism toward benzene concentration (c): rcat = −kc = (−Aexp(−Ea/RT)) c, where k is the rate constant (s−1), A is the pre-exponential factor, and Ea is the apparent activation energy (kJ/mol). Figure 1B shows the Arrhenius plots of benzene oxidation over α-MnO2 and xPt-yrGO/α-MnO2, and their Ea values are listed in Table 1. The order of Ea was: α-MnO2 (96.1 kJ/mol) > 0.93Pt/α-MnO2 (67.0 kJ/mol) > 0.91Pt-0.5rGO/α-MnO2 (58.4 kJ/mol) > 0.92Pt-2.0rGO/α-MnO2 (54.3 kJ/mol) > 0.94Pt-1.0rGO/α-MnO2 (51.3 kJ/mol). The decrease in Ea facilitated the oxidation of benzene. Therefore, the oxidation reaction of benzene could take place more readily over the xPt-yrGO/α-MnO2 samples, as compared with α-MnO2. These results fully indicate that loading rGO on Pt/α-MnO2 can significantly improve catalytic activity of benzene oxidation. In addition, compared with the results reported in the literature, we find that the Ea value decreases in the order of Pt-CeO2 (400) (75.6 kJ/mol) [18] > Pt-TMS (73.6 kJ/mol) [19] > Pt-WAl2O3-2 (72.0 kJ/mol) [20] > Pt-Al2O3-5 (53.7 kJ/mol) [21] > 0.94Pt-1.0rGO/α-MnO2 (51.3 kJ/mol). Obviously, our 0.94Pt-1.0rGO/α-MnO2 catalyst possessed the lowest Ea value for benzene oxidation, i.e., this catalyst performed the best among the above catalysts.

2.1.2. Catalytic Stability and Effects of GHSV and Benzene Concentration on Catalytic Activity

Catalytic stability is an important feature for evaluating catalytic performance of a sample. Under the different reaction conditions, catalytic activity of the 0.94Pt-1.0rGO/α-MnO2 sample fluctuated slightly within 60 h of reaction, but no downward trend was observed (Figure 1C), which proves that catalytic stability of 0.94Pt-1.0rGO/α-MnO2 was excellent. Figure 1D shows the effect of GHSV on catalytic activity of 0.94Pt-1.0rGO/α-MnO2. It can be seen that catalytic activity decreased with the rise in GHSV, which might result from the shortening of the contact time between benzene molecules and the catalyst. However, when the GHSV was as high as 240,000 mL/(g h), benzene conversion over 0.94Pt-1.0rGO/α-MnO2 at 215 °C still reached 90%. Figure S5 shows the effect of benzene concentration on catalytic activity of 0.94Pt-1.0rGO/α-MnO2. With the increase in benzene concentration, the activity showed a downward trend, but a benzene conversion of 90% was maintained at 205 °C in the case of a high concentration of 4000 ppm benzene, indicating that benzene concentration did not significantly influence the catalytic activity of 0.94Pt-1.0rGO/α-MnO2.

2.2. Catalyst Characterization

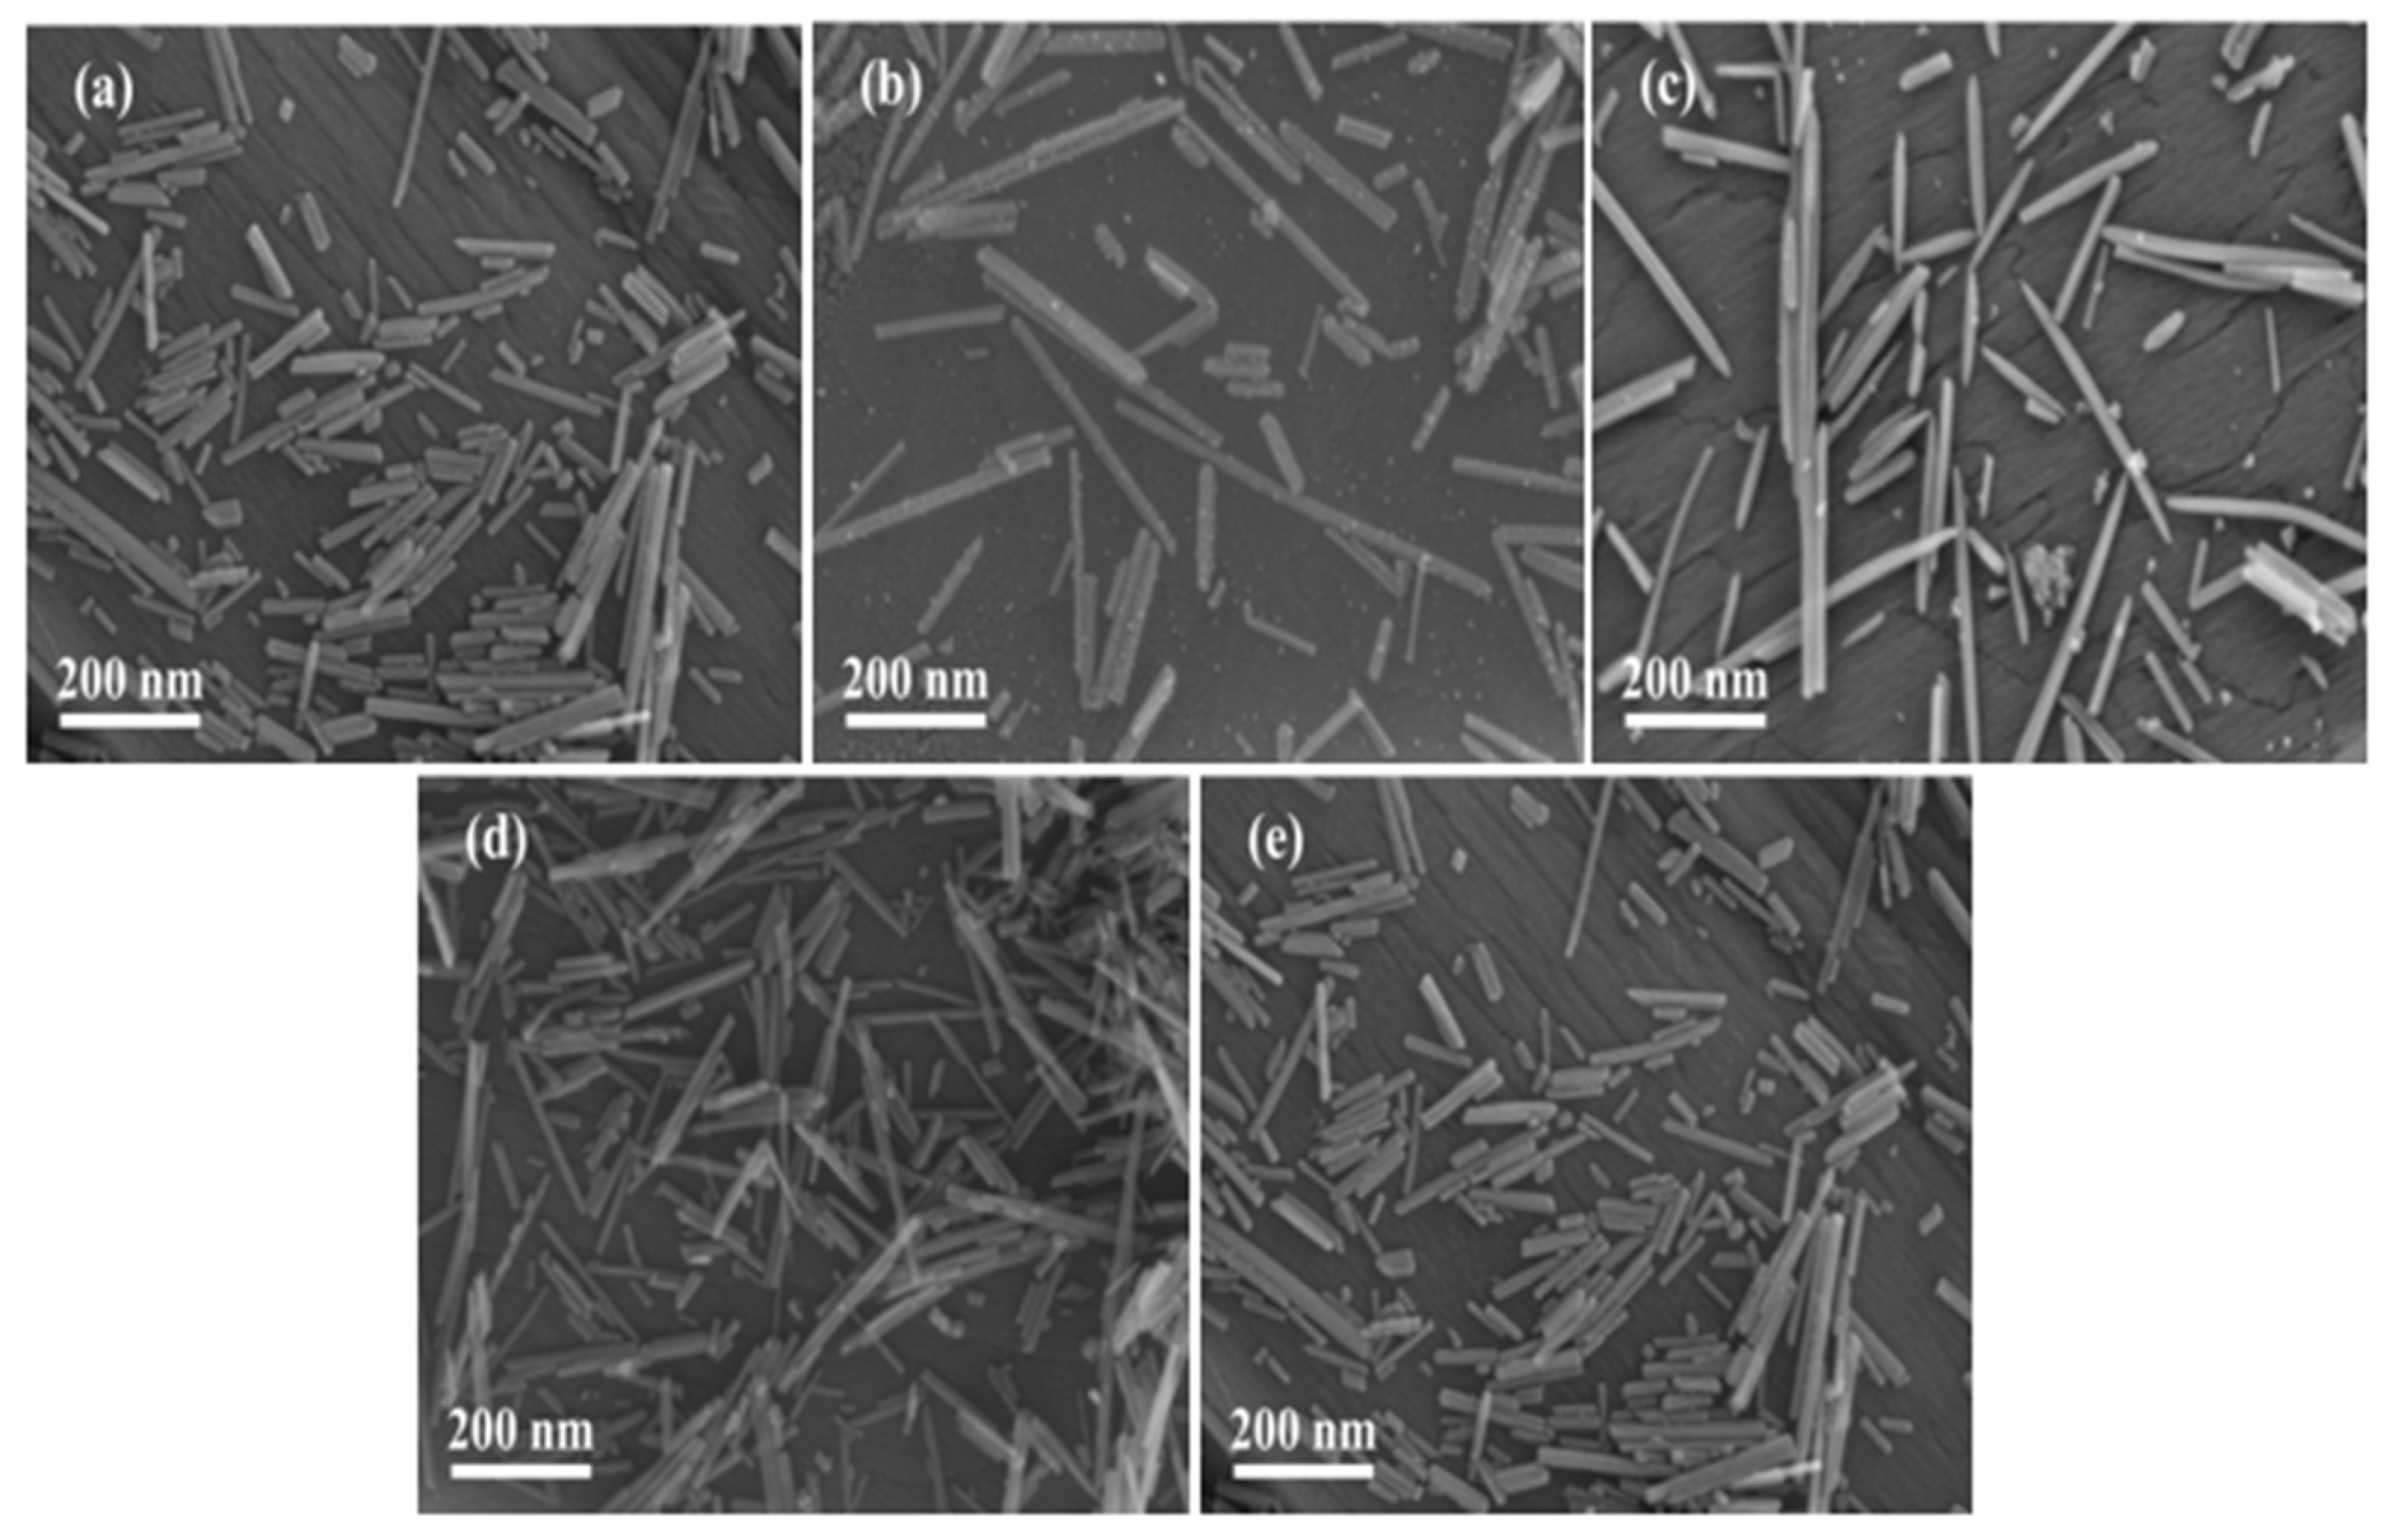
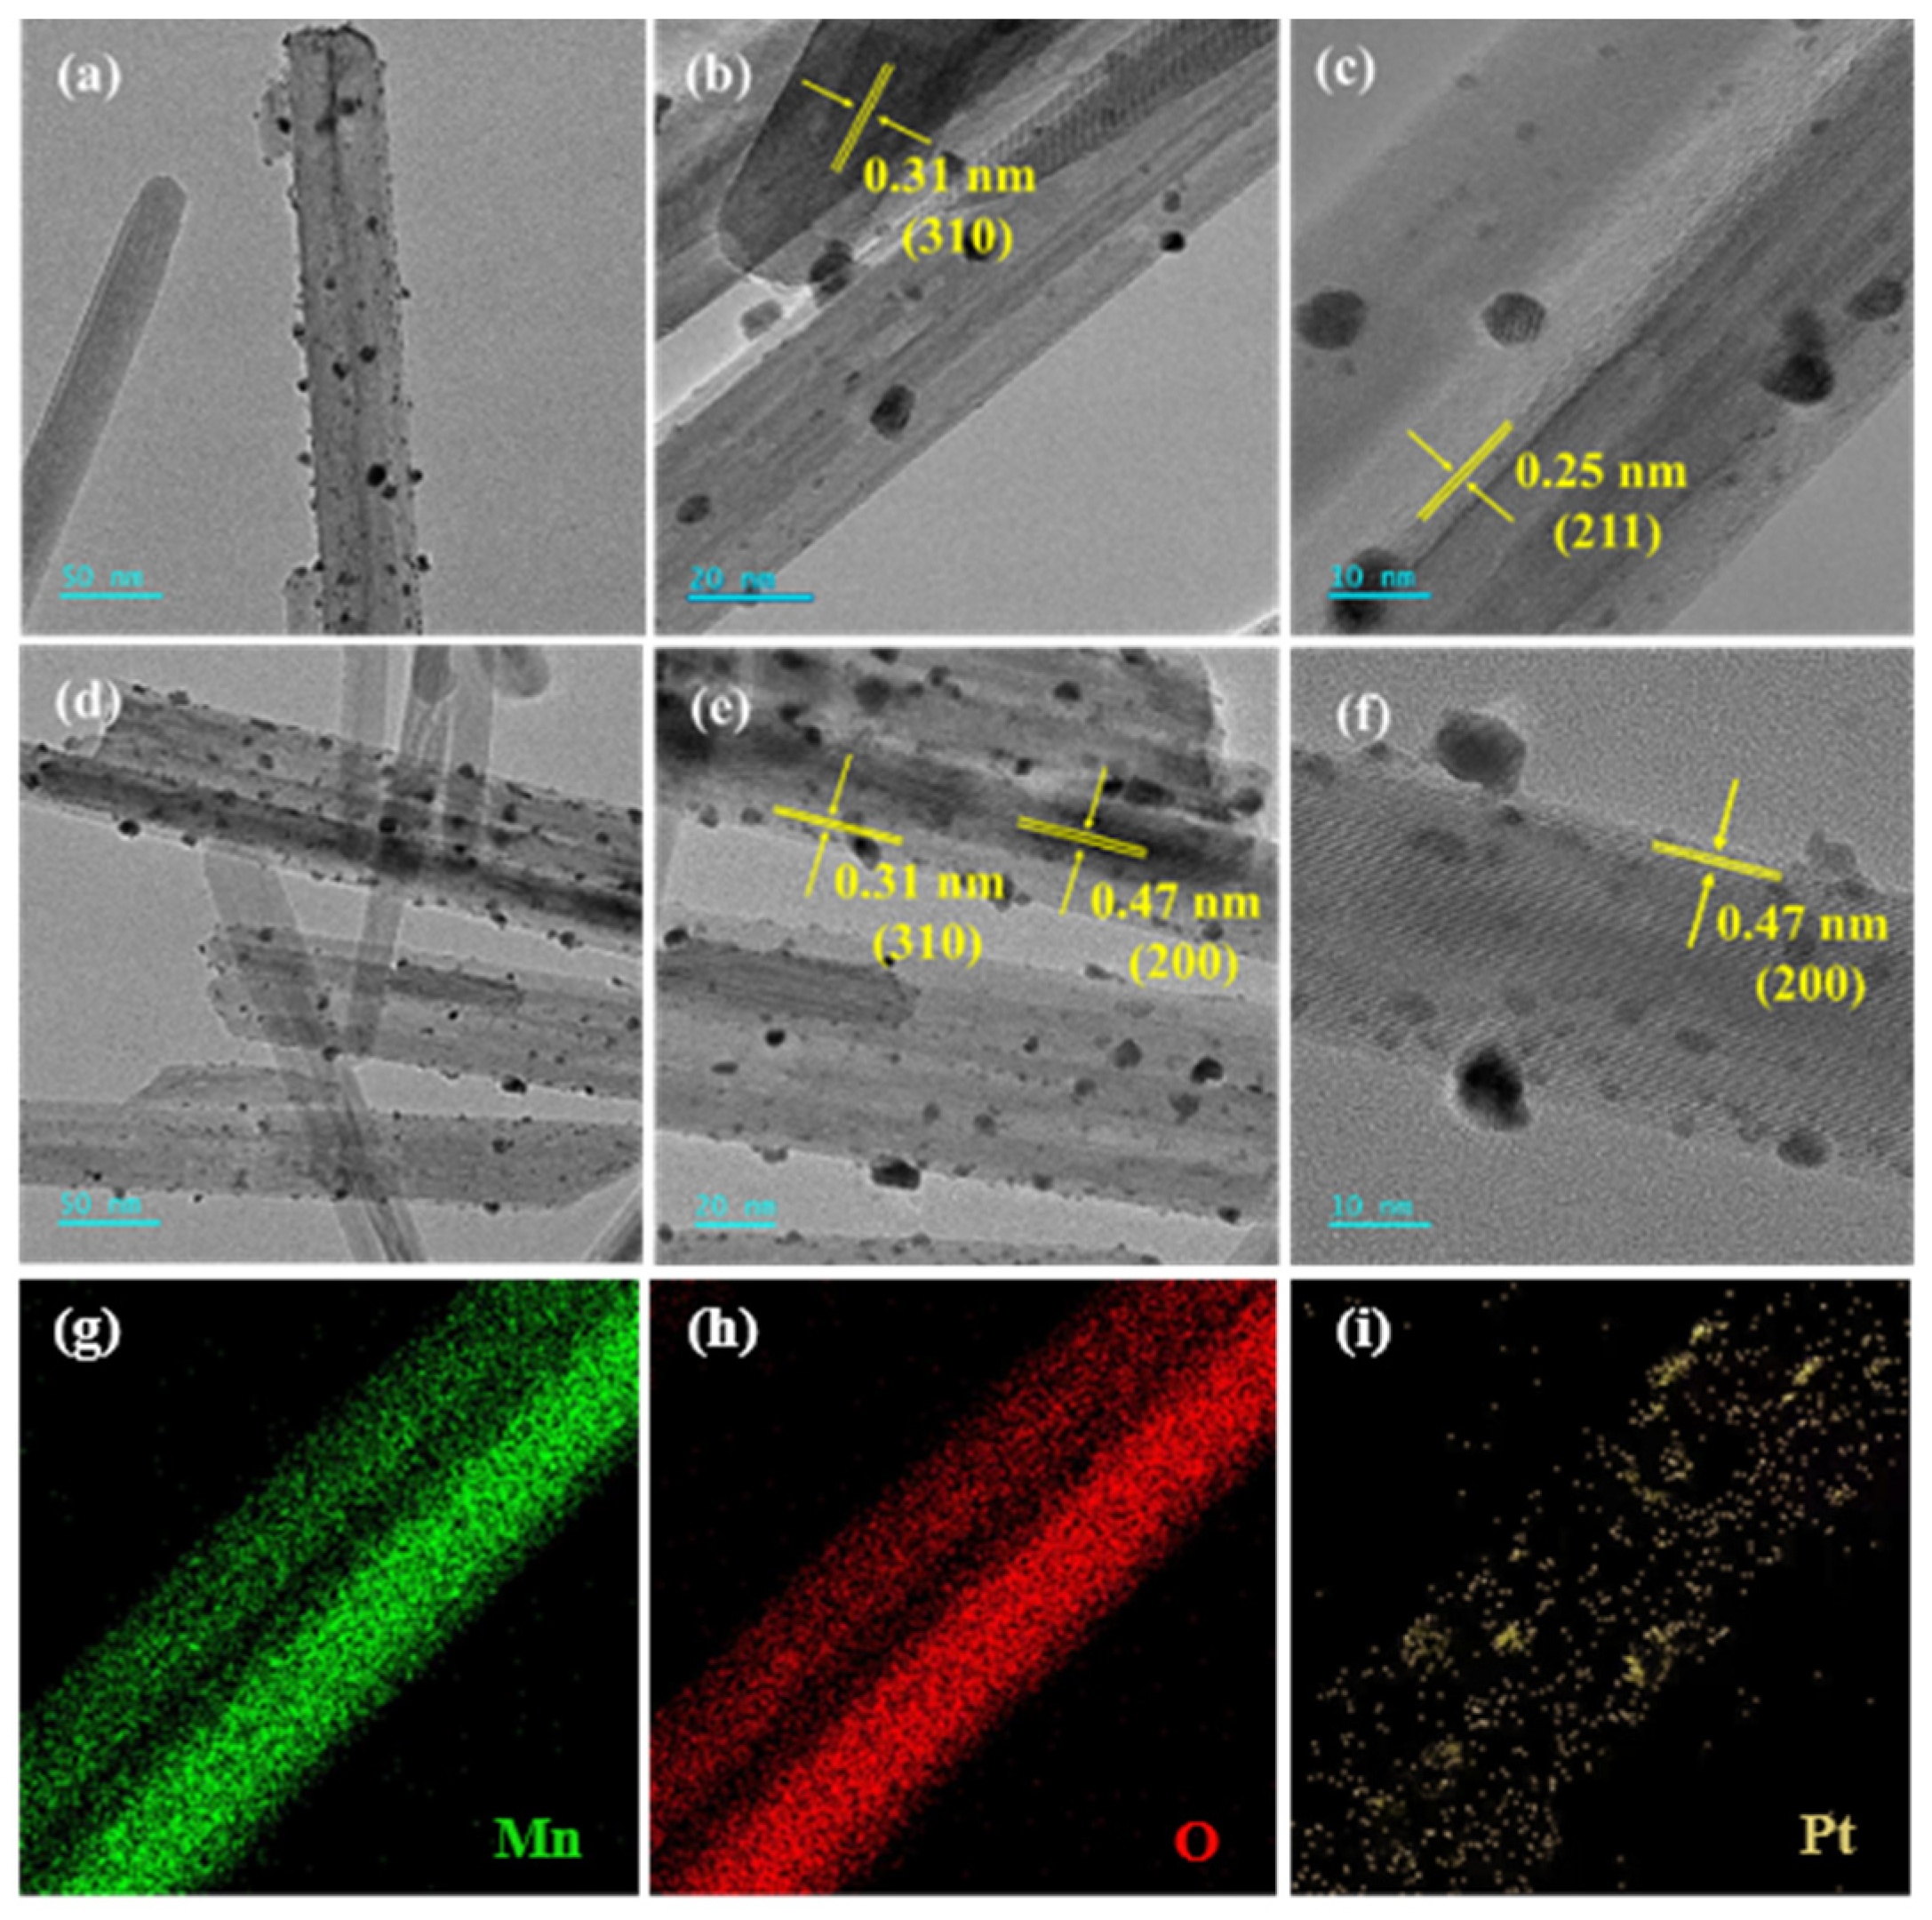
2.2.1. Structure and Morphology

Figure 2 shows XRD patterns of the samples. Diffraction peaks were observed at 2θ = 12.9°, 28.9°, 37.7°, 49.9°, 60.3°, and 69.7°, which corresponded to the (110), (200), (310), (211), (411), (521), and (541) crystal planes, respectively [22]. Obviously, the diffraction peak positions of xPt-yrGO/α-MnO2 were in good agreement with those of the standard α-MnO2 sample (JCPTS PDF# 44-0141), indicating that the crystal structure of α-MnO2 remains unchanged after loading of Pt and rGO. The absence of characteristic peaks due to the Pt and rGO phases in the XRD spectra of all of the samples might be due to the fact that Pt and monolayer rGO are uniformly loaded on the surface of α-MnO2 nanorods. According to the Scherrer equation, particle sizes of the samples can be calculated, and the results are listed in Table S2. It can be seen that after loading of Pt and/or rGO, peak intensity of α-MnO2 became weaker, diffraction peaks were broadened, and the particle size of each sample decreased, which indicates that the loading of Pt and rGO results in a decrease in crystallinity of the sample.
Figure S1 shows FTIR spectra of the samples. The absorption bands around 710 and 595 cm−1 were attributed to the Mn–O and/or Mn = O stretching vibration of the MnO6 octahedron in α-MnO2. The positions of the polymorphic vibration bands of all of the samples were almost the same, but intensity of the vibration bands was different, which indicates that all of the samples have similar structures. This outcome was in consistency with the XRD result.
Figure S2 shows the N2 adsorption–desorption isotherms and pore-size distribution curves of the samples. The N2 sorption isotherm of each sample (Figure S2A) was type IV with a H3-type hysteresis loop at a high relative pressure (p/p0 = 0.5–1.0), indicating that the presence of mesopores was caused by the layered aggregation of the nanorod-shaped α-MnO2 particles [23]. The corresponding pore-size distribution (8.1–9.0 nm) was obtained by performing BJH calculations on the adsorption data (Figure S2B), further confirming that the samples are of a mesoporous structure. The textural properties are summarized in Table 2. The surface area (37.9–40.7 m2/g) and pore volume (0.071–0.081 cm3/g) of each xPt-yrGO/α-MnO2 sample were higher than those of the rGO-free 0.93Pt/α-MnO2 sample (37.1 m2/g and 0.060 cm3/g), respectively. The results indicate that the loafing of rGO gives rise to an increase in surface area and pore volume of the sample, which was beneficial for the diffusion of benzene molecules and thus improved the catalytic activity.
The morphology of each sample was observed by the SEM technique to compare the morphological changes of α-MnO2 after loading of Pt and/or rGO. As shown in Figure 3, each sample showed a nanorod-like structure. Compared with the α-MnO2 sample, the morphology of the rGO-free 0.93Pt/α-MnO2 or xPt-yrGO/α-MnO2 sample did not change significantly. Figure 4 shows HRTEM images of the rGO-free 0.93Pt/α-MnO2 and 0.94Pt-1.0rGO/α-MnO2 samples. The high-resolution lattice spacings could be clearly observed on the nanorods. The Pt particles were highly dispersed on the surface of the α-MnO2 nanorods. Pt particle sizes and their distributions of the samples are shown in Table S2 and Figure S3, respectively. The results show that the average Pt particle sizes of rGO-free 0.93Pt/α-MnO2, 0.91Pt-0.5rGO/α-MnO2, 0.94Pt-1.0rGO/α-MnO2, and 0.92Pt-2.0rGO/α-MnO2 were 3.2 ± 0.5, 2.8 ± 0.6, 2.7 ± 0.9, and 2.9 ± 0.9 nm, respectively. The average Pt particle sizes in the xPt-yrGO/α-MnO2 samples were smaller than that in the rGO-free 0.93Pt/α-MnO2 sample. The lattice spacings in TEM images (Figure 4a–c) of rGO-free 0.93Pt/α-MnO2 were measured to be 0.31 and 0.25 nm, which were assigned to the (310) and (211) crystal planes of the standard α-MnO2 sample, respectively. The measured lattice spacings in TEM images of the 0.94Pt-1.0rGO/α-MnO2 sample (Figure 4d–f) were 0.31 and 0.47 nm, which were ascribed to the (310) and (200) crystal planes of the standard α-MnO2 sample, respectively. The results were consistent with the XRD results. In addition, no rGO morphologies were clearly observed, which might be due to its low loading or its uniformly dispersed state on the sample surface. To further investigate the distribution of Pt nanoparticles on the surface of α-MnO2 nanorods, we recorded elemental mappings of the 0.94Pt-1.0rGO/α-MnO2 sample (Figure 4g–i). It can be seen from the elemental mappings that the Pt element was evenly distributed on the surface of the 0.94Pt-1.0rGO/α-MnO2 sample.

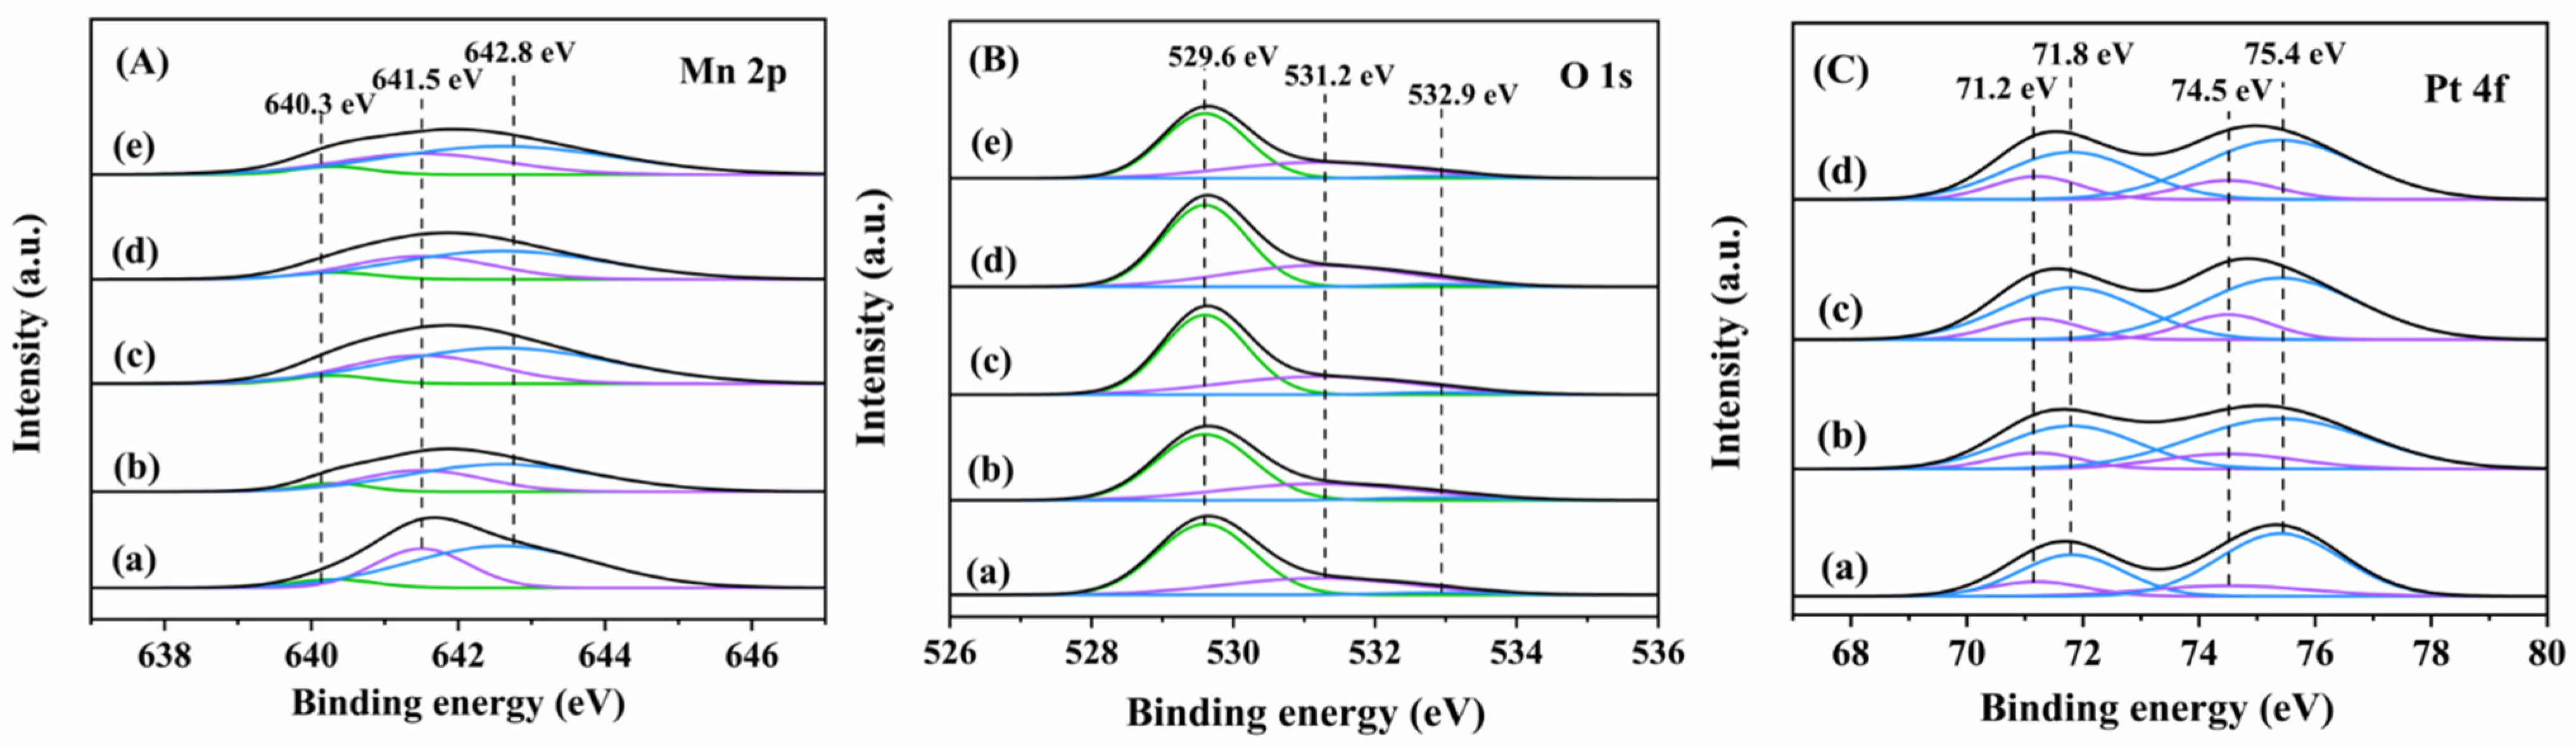
2.2.2. Surface Property

The surface elemental composition and chemical state of each sample were characterized by X-ray photoelectron spectroscopy (XPS), and their XPS spectra and quantified analysis results are shown in Figure 5 and Table 3, respectively. The XPS spectra demonstrate the presence of Mn, O, and Pt elements in the 0.94Pt-1.0rGO/α-MnO2 sample, which corresponds with the results of elemental mapping analysis (Figure 4). As can be seen from Figure 5A, the components at binding energy (BE) = 640.3, 641.5, and 642.8 eV were attributed to the surface Mn2+, Mn3+, and Mn4+ species [24], respectively. Generally speaking, the presence of Mn2+ and Mn3+ species is beneficial for the generation of oxygen vacancies on the catalyst surface, thus improving the catalytic activity. The Mn3+/Mn4+ molar ratio decreased in an order of 0.94Pt-1.0rGO/α-MnO2 (0.60) > 0.92Pt-2.0rGO/α-MnO2 (0.58) > 0.91Pt-0.5rGO/α-MnO2 (0.55) > 0.93Pt/α-MnO2 (0.50) > α-MnO2 (0.48). The Mn3+/Mn4+ molar ratio increased significantly after Pt loading, a result due to the SMSI between Pt and α-MnO2 with electron transfer from Pt to α-MnO2 (Pt0 + Mn4+ → Pt2+ + Mn3+). Furthermore, the molar ratio of Mn3+/Mn4+ was further increased with the loading of rGO, which was attributed to the ability of rGO to transfer electrons, thus promoting the SMSI between Pt and α-MnO2. The oxygens in the loaded rGO formed an effective electron transfer channel between Pt and α-MnO2, hence promoting the catalytic oxidation of benzene [25]. Among all of the samples, 0.94Pt-1.0rGO/α-MnO2 shows the highest amount of the Mn3+ species, which favors the generation of the largest oxygen vacancies and thus are beneficial for the enhancement in catalytic activity.
As shown in Figure 5B, O 1s XPS spectra of the samples were split into three components at BE = 529.6 eV, 531.2 eV, and 532.9 eV, which were due to the surface lattice oxygen (Olatt), adsorbed oxygen (Oads), and hydroxyl or adsorbed water [26], respectively. As shown in Table 3, the Oads/Olatt molar ratio decreased in the sequence of 0.94Pt-1.0rGO/α-MnO2 (0.57) > 0.92Pt-2.0rGO/α-MnO2 (0.55) > 0.91Pt −0.5rGO/α-MnO2 (0.53) > 0.93Pt/α-MnO2 (0.50) > α-MnO2 (0.45). The Oads/Olatt molar ratio increased obviously after Pt loading. Moreover, the molar ratio of Oads/Olatt further increased after loading of rGO, which exhibits the same changing trend as the Mn3+/Mn4+ molar ratio. Among all of the samples, 0.94Pt-1.0rGO/α-MnO2 possessed the highest Oads/Olatt molar ratio, therefore the highest oxygen mobility and oxidation capacity. The benzene catalytic oxidation proceeds by electron transfer between the metal oxide, reactants, and formed intermediate species, and the oxygen mobility and oxidation capacity of a catalyst played a major role in the catalytic oxidation of benzene [27]. It indicates that the loading of Pt and rGO can enhance the catalytic oxidation activity by increasing the oxygen vacancies of α-MnO2.
As shown in Figure 5C, Pt 4f could be divided into two Pt 4f7/2 and Pt 4f5/2 sub-peaks with BE = 71.2 and BE = 74.5 eV (the surface Pt0 species) and BE = 71.8 and BE = 75.4 eV (the surface Pt2+ species). Generally speaking, a higher Pt2+ content means more Pt–O bonds and higher dispersion of Pt in the catalyst. The Pt2+/Pt0 molar ratio decreased in the order of 0.94Pt-1.0rGO/α-MnO2 (0.61) > 0.92Pt-2.0rGO/α-MnO2 (0.59) > 0.91Pt −0.5rGO/α-MnO2 (0.57) > 0.93Pt/α-MnO2 (0.50), which was consistent with the order in Mn3+/Mn4+ or Oads/Olatt molar ratio, as well as with the order in catalytic activity. The molar ratios (0.57–0.61) of Pt2+/Pt0 on the xPt-yrGO/α-MnO2 samples were higher than that (0.50) of the rGO-free 0.93Pt/α-MnO2 sample, indicating that the introduction of rGO into Pt/α-MnO2 strengthened the SMSI between Pt and α-MnO2. Among all of the samples, 0.94Pt-1.0rGO/α-MnO2 showed the highest molar ratios of Pt2+/Pt0, Mn3+/Mn4+, and Oads/Olatt, indicating that this sample possessed the strongest SMSI between Pt and α-MnO2.

2.2.3. Low-Temperature Reducibility and Adsorption Ability

To investigate the reducibility of the samples, H2-TPR experiments were performed, and their H2-TPR profiles are shown in Figure 6. The H2-TPR curve of each sample could be decomposed into three peaks, defined as α, β, and γ peaks. For the α-MnO2 sample, the α peak (315 °C), β peak (371 °C), and γ peak (467 °C) were attributed to the successive reduction of α-MnO2 (i.e., MnO2 → Mn2O3 → Mn3O4 → MnO) [28]. After loading of Pt, all of the reduction peaks were significantly moved to lower temperatures (for example, the temperature of the α peak was significantly decreased from 315 to 192–196 °C), which indicates that the reducibility of the sample was much improved. Moreover, compared with α-MnO2, the new low-temperature peak of the Pt-loaded sample appeared around 120 °C, corresponding to the reduction of the oxidized Pt species [29]. The temperatures of the reduction peaks for the rGO-loaded and rGO-free samples were almost the same, but the H2 consumption of the rGO-loaded sample was significantly larger than that of the rGO-free sample (Table 3). The above results show that the loading of Pt and rGO on α-MnO2 can greatly increase the reactivity of lattice oxygen, thus improving redox ability of the sample. Among all of the samples, 0.94Pt-1.0rGO/α-MnO2 exhibited the lowest reduction temperature (192 °C) and the highest hydrogen consumption (47.3 mmol/g), thus exhibiting the best catalytic oxidation performance. Hence, we conclude that the SMSI between Pt or rGO and α-MnO2 contributed to the enhancement in catalytic performance of 0.94Pt-1.0rGO/α-MnO2.
Figure S4 shows O2-TPD profiles of the samples. The peaks in each O2-TPD curve could be divided into three parts: The low-temperature peaks at 150–200 °C were attributed to desorption of the surface chemisorbed oxygen species, the medium-temperature peaks at 550–650 °C were ascribed to desorption of the lattice oxygen (Oads) species close to the sample surface, and the high-temperature peaks at 750–850 °C were assigned to desorption of the bulk lattice oxygen (Olatt) species [30]. Areas and intensity of the medium- and high-temperature peaks of the 0.93Pt/α-MnO2 and xPt-yrGO/α-MnO2 samples were larger or higher than those of the α-MnO2 sample, indicating that the loading of Pt and rGO enhanced the amount of surface and bulk lattice oxygen species, thus improving redox ability of the catalyst. The xPt-yrGO/α-MnO2 sample showed a stronger intensity and a larger area of the medium-temperature peak than the rGO-free 0.93Pt/α-MnO2 sample, demonstrating that the loading of rGO strengthened the SMSI between Pt and α-MnO2, which enhanced the desorption amount of lattice oxygen [31]. This result was consistent with the above XPS and H2-TPR results. Among all of the samples, 0.94Pt-1.0rGO/α-MnO2 exhibited the lowest desorption temperature, indicating the easiest release of lattice oxygen and the best oxygen mobility, which was beneficial for the enhancement in catalytic activity of the sample.

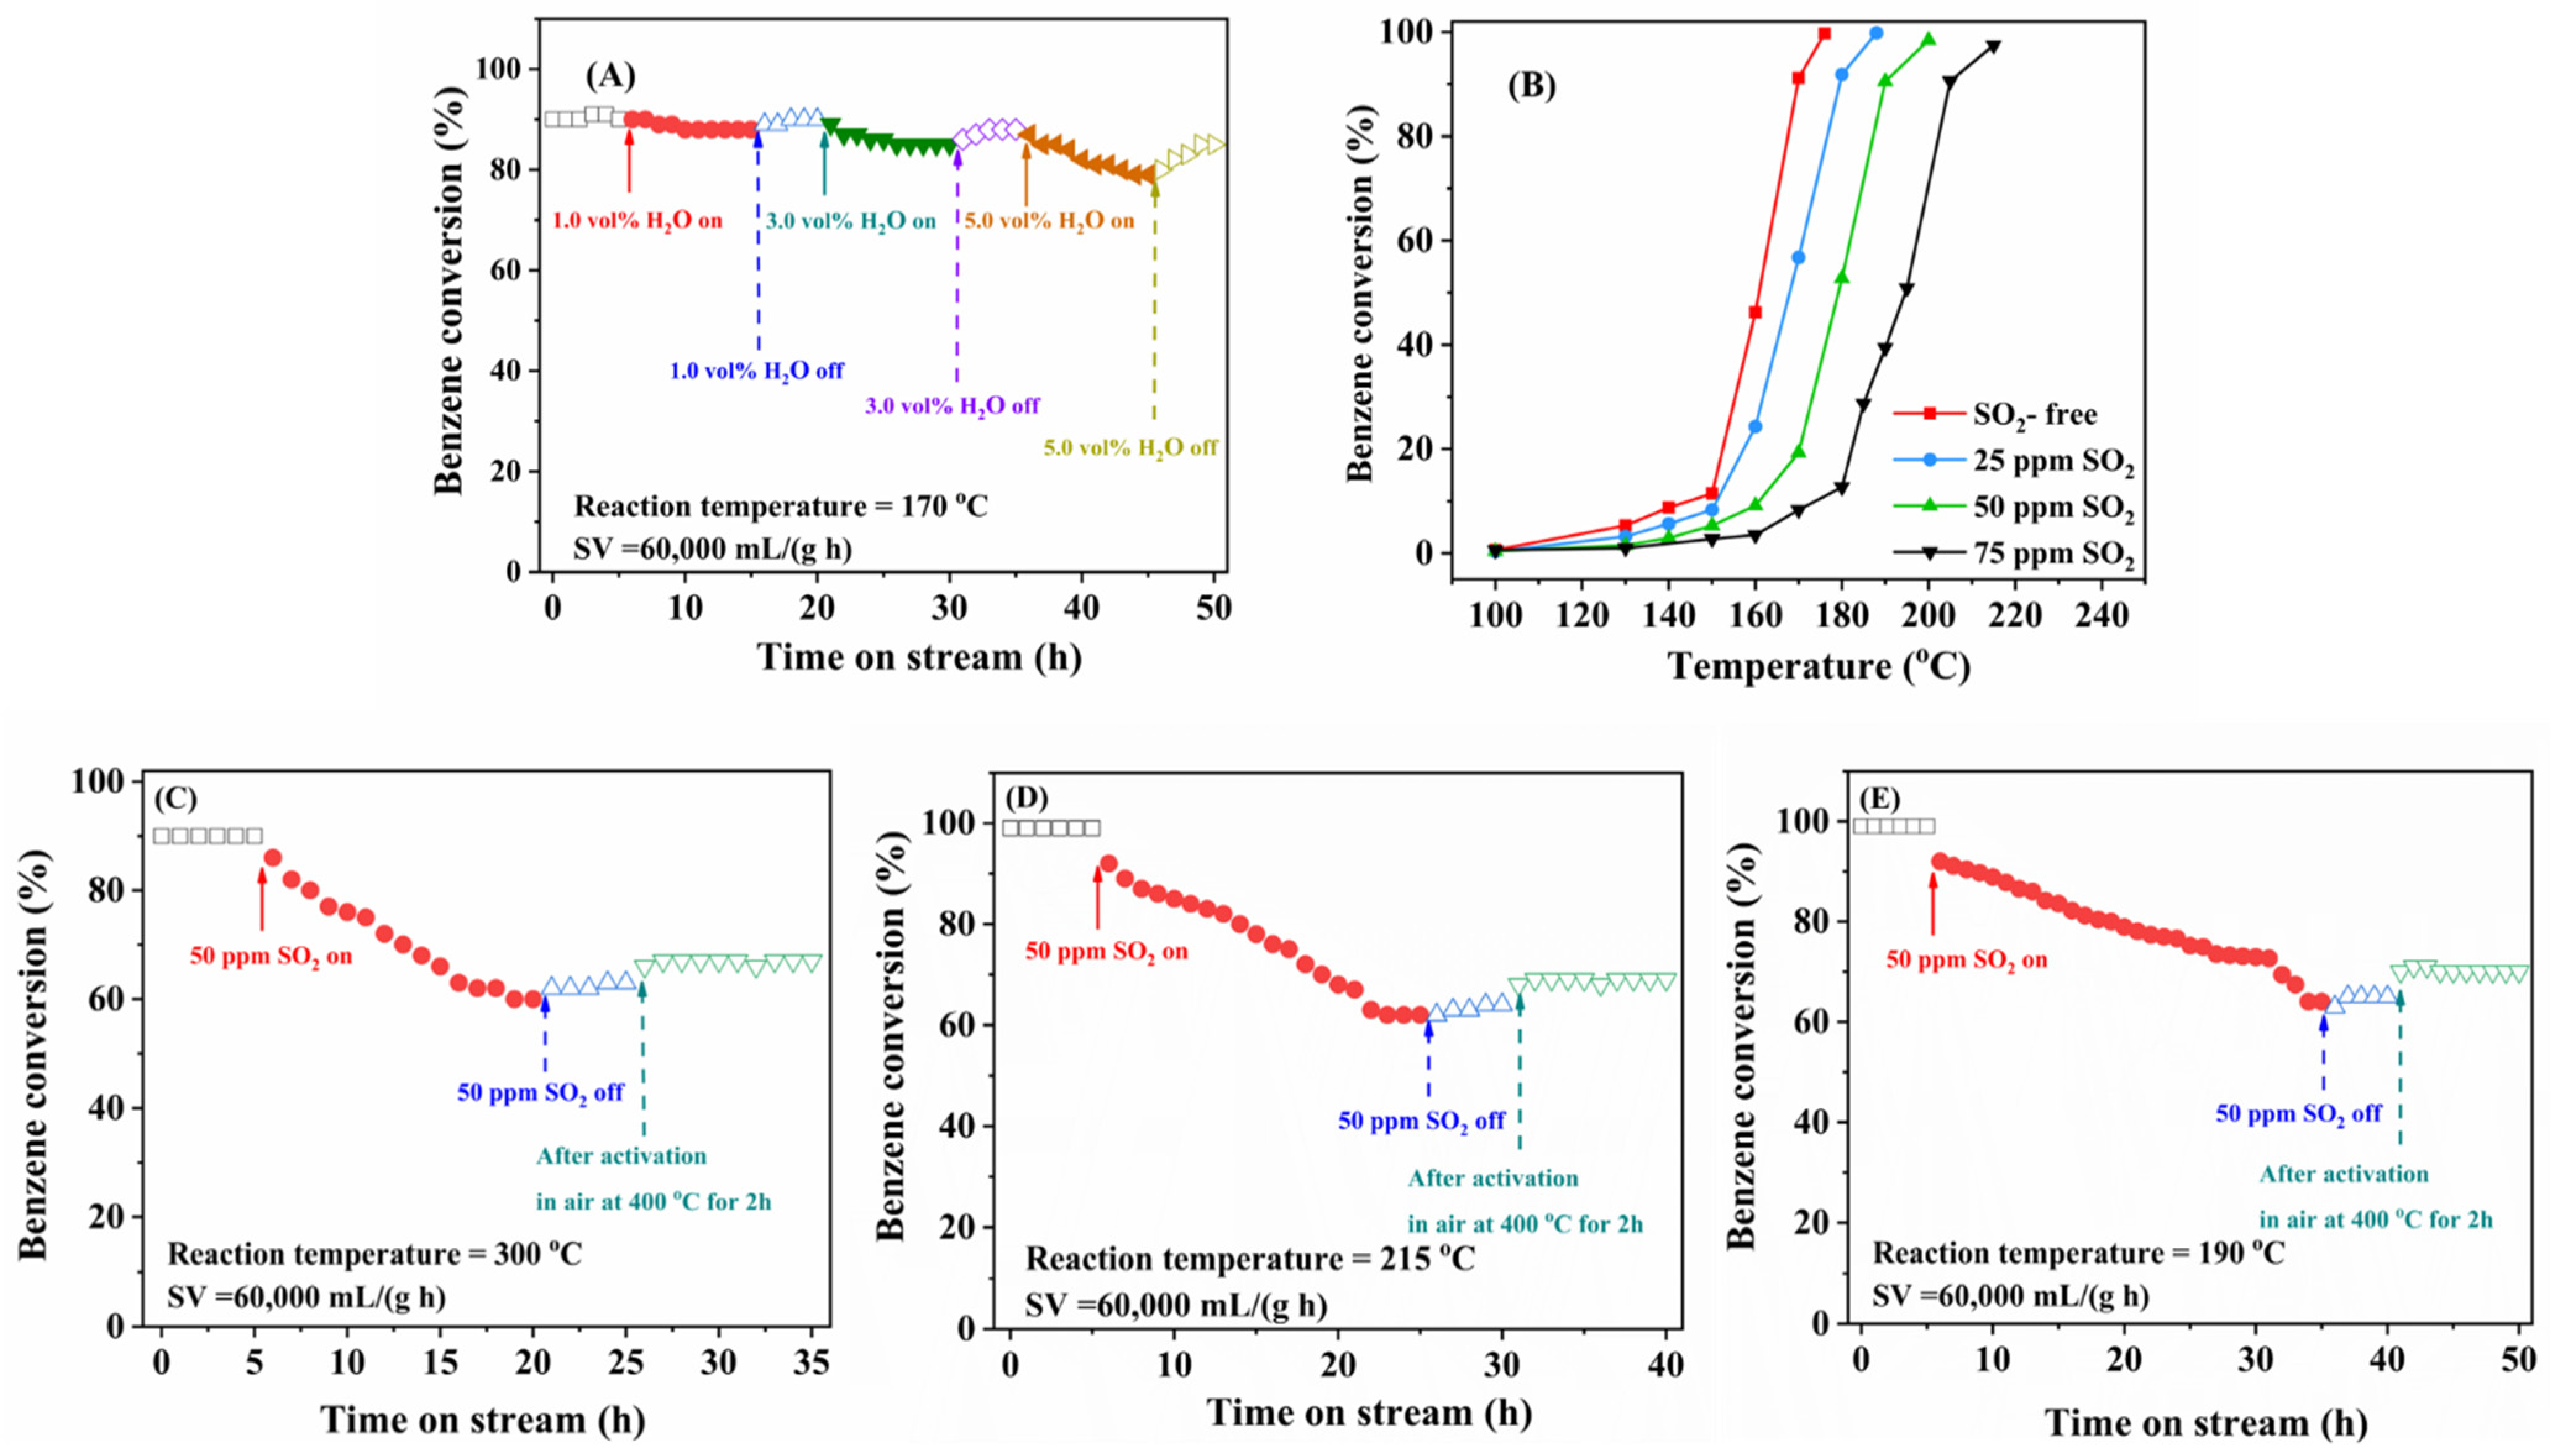
2.3. Effects of Water Vapor and SO2 on Catalytic Activity

Since the actual industrial VOCs emissions usually contain H2O, SO2, and other components, it is necessary to study the influence of these gases on catalytic performance of the typical sample. Figure 7A shows catalytic activity of the 0.94Pt-1.0rGO/α-MnO2 sample for benzene oxidation at 170 °C and GHSV = 60,000 mL/(g h) in the presence of 1.0, 3.0, and 5.0 vol% water vapor, respectively. When 1.0 vol% water vapor was introduced to the reaction system, catalytic activities were hardly changed, indicating that 1.0 vol% water vapor did not affect catalytic benzene oxidation over this sample. After 3.0 vol% water vapor was added, catalytic activity was slightly decreased. Moreover, when the water supply was cut off, catalytic activity was gradually returned to the original level. After 5.0 vol% water vapor was introduced, however, catalytic activity was significantly decreased, and benzene conversion was dropped to 75%. After cutting off water vapor, catalytic activity was gradually increased, but not restored to the original level. These results indicate that partial deactivation of the 0.94Pt-1.0rGO/α-MnO2 sample caused by the introduction of water vapor is reversible. There were the competitive adsorption of water vapor and reactant (benzene and oxygen) molecules on the sample surface [32]. When the humidity in the feed stream decreased, such a deactivation could be restored to a large extent. However, after frequent switching of the humidity conditions, benzene conversion over 0.94Pt-1.0rGO/α-MnO2 was gradually decreased with the extension of reaction time, indicating that simply cutting off the water vapor supply could not fully restore catalytic activity of the sample.
To study the effect of SO2 on catalytic activity of 0.94Pt-1.0rGO/α-MnO2, 25, 50, or 75 ppm SO2 was added to the benzene oxidation system, and their activity data are shown in Figure 7B. The introduction of SO2 exerted a negative impact on catalytic activity of 0.94Pt-1.0rGO/α-MnO2. Compared with the SO2-free case, the T90% value increased by 10, 21, and 36 °C after 25, 50, and 75 ppm SO2 were introduced, respectively. Therefore, the addition of different SO2 concentrations decreased the catalytic activity of 0.94Pt-1.0rGO/α-MnO2 to various extents. This result might result from the fact that some of the active sites in 0.94Pt-1.0rGO/α-MnO2 were covered by the generated sulfate species, which hindered the adsorption and catalytic reaction of benzene and oxygen on the sample surface, thus decreasing catalytic activity of the sample [33].
To examine the influence of SO2 introduction on catalytic activity of different samples, Figure 7C–E shows the sulfur dioxide resistance experiments of α-MnO2, 0.93Pt/α-MnO2, and 0.94Pt-1.0rGO/α-MnO2. After introducing 50 ppm SO2 to the reaction system (50 ppm is a relatively moderate concentration, so it was adopted to investigate the effect of SO2 on catalytic activity of the samples), the reaction time required for benzene conversion dropped to 70% over α-MnO2, 0.93Pt/α-MnO2, 0.94Pt-1.0rGO/α-MnO2 was 8, 14, and 27 h, respectively. Therefore, sulfur dioxide resistance decreased in the order of 0.94Pt-1.0rGO/α-MnO2 > 0.93Pt/α-MnO2 > α-MnO2. This result was associated with the loading of Pt and rGO on the surface of α-MnO2 nanorods. It was found that the loading of Pt and rGO hindered the chemisorption of SO2 and prevented the active site of the catalyst from being poisoned by SO2, thus enhancing sulfur dioxide resistance of the catalyst.

2.4. Physicochemical Characterization Analysis of the Catalyst after SO2 Poisoning

To further investigate the reason for the decrease in activity of the SO2-poisoning samples, 50 ppm SO2 was passed through the fresh 0.94Pt-1.0rGO/α-MnO2 sample for 30 h (the obtained sulfur dioxide-poisoned sample was denoted as 0.94Pt-1.0rGO/α-MnO2-S). XPS, XRD, FT-IR, H2-TPR, and TG characterization experiments of the fresh and 0.94Pt-1.0rGO/α-MnO2-S samples were carried out.
To analyze the changes in surface elements of the samples before and after sulfur dioxide-poisoning, XPS characterization was performed, and the results are shown in Figure 8. Figure 8A shows S 2p spectra of the sulfur dioxide-poisoned sample. S 2p XPS spectrum of each sample was divided by fitting into two components at BE = 168.5 and 169.9 eV, which were attributed to the different surface sulfate species. Figure 8B shows Mn2p XPS spectra of the fresh and sulfur dioxide-poisoned samples. The Mn3+/Mn4+ molar ratio (0.60) on the fresh sample decreased, as compared with that (0.47) on the sulfur dioxide-poisoned sample. Figure 8C illustrates O 1s XPS spectra of the fresh and the sulfur dioxide-poisoned samples. The Oads/Olatt molar ratio decreased from 0.57 for the fresh sample to 0.46 for the sulfur dioxide-poisoned sample, indicating that SO2 decreased the amount of the adsorbed oxygen species, which was consistent with the decrease in amount of the surface Mn3+ species. In addition, Figure 8D shows Pt 4f XPS spectra of the fresh and sulfur dioxide-poisoned samples. The molar ratio of Pt2+/Pt0 decreased slightly after sulfur dioxide-poisoning (from 0.61 for the fresh sample to 0.57 for the sulfur dioxide-poisoned sample). The Pt species was less affected by SO2 than the Mn species, indicating that Pt possesses better sulfur dioxide resistance. This result suggests that partial deactivation of the sample was mainly due to the deactivation of the α-MnO2 support.
XRD patterns of the fresh and sulfur dioxide-poisoned samples are shown in Figure 9A. It can be seen from Figure 9A that diffraction peaks of the two samples were consistent with those of the standard α-MnO2 sample (JCPDS PDF# 44-0141), indicating that sulfide generation did not affect the crystal structure of α-MnO2. Compared with XRD patterns of the fresh sample, there were no diffraction peaks of sulfide species, such as MnSO4 and other substances on the sulfur dioxide-poisoned sample, which was due to the fact that sulfate species are mainly present in amorphous form and therefore not detected. Figure 9B shows FT-IR spectra of the fresh and the sulfur dioxide-poisoned samples. The absorption bands due to the sulfate species were located in the range of 1040–1210 cm−1. The sulfur dioxide-poisoned sample exhibited an absorption band at 1130 cm−1 (functional group sulfation), indicating the formation of sulfate species on the sulfur dioxide-poisoned sample [34].
Figure 9C shows H2-TPR spectra of the fresh and sulfur dioxide-poisoned samples. Compared with the fresh sample, intensity of the reduction peak in the low-temperature region of the sulfur dioxide-poisoned sample was significantly weakened, and the reduction peak tended to shift to the high-temperature region, indicating that reducibility of the sulfur dioxide-poisoned sample was weakened, especially the low-temperature reducibility. At the same time, a strong reduction peak appeared around 509 °C for the sulfur dioxide-poisoning sample, which was attributed to the reduction of the sulfate species, as pointed out by Kijlstra et al. [35]. Combined with other characterization results, we speculate that SO2 in the mixture reacts with the metal elements in the sample and produced sulfate, which then accumulated over time, deposited on the surface of 0.94Pt-1.0rGO/α-MnO2, and blocked oxygen vacancies of the sample, thus inhibiting the catalytic reaction and leading to a decrease in catalytic activity [36].
Figure 9D shows thermogravimetric analysis (TG) curves of the fresh and sulfur dioxide-poisoned samples. In the temperature range of 80–200 °C, the weight loss of the fresh or sulfur dioxide-poisoned sample was due to the loss of adsorbed water on the sample surface. The weight loss at 200–550 °C was due to the escape of surface oxygen species and some surface lattice oxygen species on the sample [37]. The weight loss at 550–650 °C was due to the destruction of the rGO structure [38]. Wu et al. [39] pointed out that MnSO4 was decomposed at 750 °C, so the weight loss of the poisoned sample at 650–850 °C was attributed to the decomposition of MnSO4. At the same time, the weight loss of the sulfur dioxide-poisoned sample was bigger than that of the fresh sample, and the weight loss rate was higher. Combined with the H2-TPR and TG profiles, we think that during the poisoning process of the sample, a large part of the active Mn component in manganese dioxide is sulfated to form MnSO4, which leads to a significant decrease in catalytic activity of the sample.

2.5. In Situ DRIFTS Studies

The reaction mechanism of benzene oxidation over 0.94Pt-1.0rGO/α-MnO2 was investigated by the in situ DRIFTS technique to explore the intermediate species produced during benzene adsorption and oxidation, and their in situ DRIFTS spectra are shown in Figure 10A and B, respectively. Before the experiment, the sample was pretreated in a N2 flow and cooled to RT after pretreatment at 400 °C for 1 h. Figure 10A shows in situ DRIFTS spectra of the O2-free gas mixture (1000 ppm benzene + N2 (balance)) adsorption at 160 °C for 10–60 min. As shown in Figure 10A, a series of vibrational bands at 3000–3500 cm−1 were attributed to the chemisorption of benzene on the Mn4+ species in MnO2 [40]. The vibrational bands at 3088 and 3048 cm−1 were considered to be stretching vibrations of the C–H bonds in the benzene ring [41]. The vibrational bands at 1961 and 1804 cm−1 were ascribed to the out-of-plane bending mode of C–H bonds [42]. The band at 1709 cm−1 was thought to be a stretching vibration of C = O bond, presumably producing quinones or ketones [43]. The band at 1483 cm−1 was owing to be the characteristic signal of the carboxylic acid species, which was the result of the oxidative ring-opening of benzene [44]. The intensity of the band at 1483 cm−1 increased monotonically with time, indicating the accumulation of organic by-products on the sample surface. The weak vibrational band at 2353 cm−1 was the characteristic signal of CO2 [45]. The in situ DRIFTS spectra after the introduction of 20 vol% O2 in this reaction system are shown in Figure 10B. In comparison with the O2-free case, the position of each vibrational band did not change after O2 addition, but intensity and area of each characteristic band became stronger or larger in the same period. This result indicates that the intermediate species produced after benzene adsorption and oxidation are the same. In the O2-free case, the 0.94Pt-1.0rGO/α-MnO2 sample adsorbed benzene and the Oads species on the sample catalyzed the reaction with benzene.
To further explore the effect of SO2, we investigated the intermediates formed during benzene oxidation over the 0.94Pt-1.0rGO/α-MnO2 sample. Figure 10C shows in situ DRIFTS spectra of the (1000 ppm benzene + 50 ppm SO2 + 20 vol% O2 + N2 (balance)) adsorption at 160 °C for 10–60 min. In comparison with the SO2-free case, a strong vibrational band appeared at 1141 cm−1, which was considered as the characteristic peak of sulfate [34]. Intensity of the band gradually increased with the introduction of SO2, indicating a gradual accumulation of the sulfate species on the sample surface.
After analyzing the in situ DRIFTS spectra and in connection with the previously reported results [46], we propose a possible catalytic benzene oxidation mechanism as follows: First, benzene is oxidized to phenolics by the reactive oxygen species; then, the generated phenolics are converted to benzoquinone; finally, the aromatic ring is destroyed to carboxylic acids, which are further oxidized by the oxygen species to generate CO2 and H2O [47].
According to the literature [48], the surface layer of rGO is evenly distributed with a large specific surface area and an abundant pore structure. Abundant oxygen-containing functional groups exist on the surface of rGO, which favors adsorption of the pollutants. Therefore, the addition of rGO can increase the adsorption sites of benzene. According to the literature [49], as verified by the photocurrent, rGO composite can significantly enhance the intensity of electric current. This result indicates that rGO can enhance the electron interaction between Ag and ZnFe2O4 nanoparticles and accelerate the charge migration. Therefore, rGO can act as an electron transfer channel for noble metals or metal oxides, thus facilitating the electron transfer between them. Thus, rGO doping can promote the electronic transfer between Pt and α-MnO2 and increase the SMSI between Pt and α-MnO2. As shown in Figure 11, rGO not only provides more sites for benzene adsorption, but also enhances the SMSI between Pt and α-MnO2, thus increasing the content and activation of lattice oxygen on the manganese oxide surface and promoting the deep oxidation of benzene [49]. Therefore, the 0.94Pt-1.0rGO/α-MnO2 sample exhibited excellent catalytic performance for benzene oxidation. On the other hand, the loading of Pt and rGO hindered the chemisorption of SO2 on the sample and prevented the active sites from being poisoned by SO2, thus enhancing the sulfur dioxide resistance of the sample. However, the over-loading of rGO might block and inhibit the active sites of the sample and weaken the SMSI between Pt and α-MnO2, which explained why catalytic activity was decreased when the rGO content increased to 2.0 wt%.

3. Experimental Section

3.1. Preparation of Catalysts

3.1.1. Synthesis of α-MnO2 Nanorods

The α-MnO2 nanorods used in this study were synthesized by the hydrothermal method. The procedure included: dissolving the reactants in deionized water to prepare a mixed aqueous solution, then transferring it to an autoclave, and dissolving and recrystallizing the substances that are insoluble or insoluble at room temperature (RT) under high-pressure and high-temperature conditions by controlling the temperature and hydrothermal time. In a typical synthesis, 0.948 g of KMnO4 was added to 90 mL of deionized water, and 1.5 g of MnSO4⋅H2O was added to 60 mL of deionized water and continuously stirred for 30 min. Then, the aqueous solution of KMnO4 was mixed in the aqueous solution of MnSO4⋅H2O. After continuing to stir for 2 h, the mixed aqueous solution was poured into an 200-mL autoclave with a PTFE liner, placed in an oven, and hydrothermally treated at 165 °C for 24 h. After the reaction kettle was cooled to RT, the reaction kettle was opened to extract the black solid, and the oven temperature was adjusted to 100 °C for drying for 12 h. Finally, the sample was put into a muffle furnace and the heating rate was adjusted to 3 °C/min to calcine the sample from RT to 400 °C and kept at 400 °C for 2 h, thus obtaining the α-MnO2 nanorods.

3.1.2. Preparation of xPt-yrGO/α-MnO2

The xPt-yrGO/α-MnO2 (x and y are the mass loadings of Pt and rGO, respectively) catalysts were prepared using the PVA-protecting reduction strategy. Herein, we take the preparation of 1Pt-1rGO/α-MnO2 as an example. The monolayer GO powders were added to 50 mL of deionized water, and the mixture was put into an ultrasonic cleaner and treated at 53 kHz for 6 h to obtain the monolayer GO solution. 1.56 mL of Pt(NO3)2⋅2H2O aqueous solution (0.004 mol/L) and 3 mg of PVA (Pt/PVA mass ratio = 1.5:1.0) were first added to 200 mL of deionized water at 0 °C (under ice–water bath condition), then the GO solution was added and stirred vigorously for 30 min. After that, a certain amount of NaBH4 (GO/NaBH4 mass ratio = 1:400) was added to the above mixture to generate a brown suspension, followed by further stirring for 60 min to obtain the Pt-rGO composite solution. About 1.0 g of the above synthesized α-MnO2 nanorods was added to the Pt-rGO composite solution and stirred for 6 h. The doped graphene oxide was transformed into the reduced GO (rGO) due to the use of NaBH4. After that, the samples were washed with deionized water and dried in an oven at 80 °C for 12 h. Finally, the samples were placed in a muffle furnace and the heating rate was adjusted to 3 °C/min to calcine the samples from RT to 400 °C and kept at this temperature for 2 h, thus obtaining the xPt-yrGO/α-MnO2 samples. In Table S2, the results of inductively coupled plasma–atomic emission spectroscopy (ICP–AES) characterization show that the actual Pt loadings of these samples were very similar (x = 0.91–0.94 wt%) and just slightly lower than their theoretical loadings. Furthermore, the actual rGO loadings (y) were 0.5, 1.0, and 2.0 wt%, respectively.

3.2. Characterization

Physicochemical properties of the α-MnO2 and xPt-yrGO/α-MnO2 samples were determined using the techniques, such as X-ray diffraction (XRD), ICP–AES, thermogravimetry (TG) analysis, N2 adsorption–desorption (BET), Fourier transform infrared spectroscopy (FTIR), transmission electron microscopy (TEM), high-angle annular dark–field scanning transmission electron microscopy (HAADF–STEM), scanning electron microscopy (SEM), element mappings, X-ray photoelectron spectroscopy (XPS), hydrogen temperature-programmed reduction (H2-TPR), oxygen temperature-programmed desorption (O2-TPD), and in situ diffuse reflectance infrared Fourier transform spectroscopy (in situ DRIFTS). The detailed determination procedures are provided in the ESI.

3.3. Catalytic Activity Measurement

A fixed-bed quartz tube microreactor and gas chromatograph were used to measure the benzene oxidation activities over the samples. About 50 mg (40–60 mesh) of quartz sand was thoroughly mixed with 50 mg of the catalyst sample (40–60 mesh), placed into a fixed-bed quartz tube microreactor (inner diameter = 4.0 mm), and pretreated at 400 °C in a nitrogen stream of 50 mL/min for 1 h. The reactant mixture consisted of 1000 ppm benzene + 20 vol% O2 + N2 (balance). The total flow rate was 50–200 mL/min, corresponding to a gas hourly space velocity (GHSV) of 60,000–240,000 mL/(g h). The reaction products were analyzed online by gas chromatograph (GC-7900, Techcomp) equipped with a flame ion detector (FID) for the analysis of organic products. Benzene conversion (X), reaction rate (r), and turnover frequencies (TOFs) were calculated according to the following equations:
X = c inlet c outlet c inlet × 100
r = c inlet × X m cat
TOF = X × c inlet n s × D
where cinlet and coutlet are the concentration of benzene in inlet and outlet gas, respectively, mcat is the mass of the catalyst (g), ns is the number of active sites (mol), and D is the Pt dispersion on the surface of the catalyst. In addition, T10%, T50%, and T90% are used to denote the temperatures required for the conversion to reach 10, 50, and 90%, respectively.

4. Conclusions

In summary, α-MnO2 nanorods were synthesized by the hydrothermal method, and Pt/α-MnO2 and xPt-yrGO/α-MnO2 catalysts with Pt loadings of 0.91–0.95 wt% and surface areas of 37.9–40.7 m2/g were prepared using the PVA-protecting reduction method. The average particle sizes of Pt nanoparticles in Pt/α-MnO2 and xPt-yrGO/α-MnO2 were 2.7–3.2 nm. Among all of the samples, 0.94Pt-1.0rGO/α-MnO2 exhibited the highest catalytic performance, and the best sulfur dioxide resistance of 0.94Pt-1.0rGO/α-MnO2 was attributed to the fact that the loading of the appropriate amount of rGO enhances the SMSI between Pt and α-MnO2 and the Oads concentration, thus improving catalytic activity of the sample for benzene oxidation. The catalytic activity was negatively affected by water vapor, which was caused by the competitive adsorption of water vapor and benzene, and such a deactivation was reversible. A series of physicochemical characterization reveal that the decrease in catalytic activity of the 0.94Pt-1.0rGO/α-MnO2 sample in the presence of SO2 was due to the formation of sulfate on the sample surface, which covered the active sites and oxygen vacancies. In addition, a possible oxidation mechanism was proposed as follows: (i) benzene is oxidized to phenolics by the reactive oxygen species; (ii) the generated phenolics are converted to benzoquinone or cyclohexanone; and (iii) the aromatic ring is destroyed to carboxylic acids, which are further oxidized to CO2 and H2O. The strategy of enhancing the SMSI by loading of rGO is effective for designing new high-performance catalysts in the application of VOCs removal.

Supplementary Materials

The following supporting information can be downloaded at: https://www.mdpi.com/article/10.3390/catal12111426/s1. Figure S1: FTIR spectra of (a) α-MnO2, (b) 0.93Pt/α-MnO2, (c) 0.91Pt-0.5rGO/α-MnO2, (d) 0.94Pt-1.0rGO/α-MnO2, and (e) 0.92Pt-2.0rGO/α-MnO2. Figure S2: (A) Nitrogen adsorption–desorption isotherms and (B) pore-size distributions of (a) α-MnO2, (b) 0.93Pt/α-MnO2, (c) 0.91Pt-0.5rGO/α-MnO2, (d) 0.94Pt-1.0rGO/α-MnO2, and (e) 0.92Pt-2.0rGO/α-MnO2. Figure S3: Noble particle-size distributions of (a) 0.93Pt/α-MnO2, (b) 0.91Pt-0.5rGO/α-MnO2, (c) 0.94Pt-1.0rGO/α-MnO2, and (d) 0.92Pt-2.0rGO/α-MnO2. Figure S4: O2-TPD profiles of (a) α-MnO2, (b) 0.93Pt/α-MnO2, (c) 0.91Pt-0.5rGO/α-MnO2, (d) 0.94Pt-1.0rGO/α-MnO2, and (e) 0.92Pt-2.0rGO/α-MnO2. Figure S5: Effect of benzene concentration on catalytic activity of 0.94Pt-1.0rGO/α-MnO2 at GHSV = 60,000 mL/(g h). Table S1: Comparison on specific reaction rates (rcat) for benzene oxidation at 160 °C over the catalysts studied in the present work and reported in the literature. Table S2: Average Pt particle sizes and actual Pt loadings of the as-obtained samples determined by the ICP–AES technique.

Author Contributions

Conceptualization, Q.Y.; methodology, D.Z.; software, D.Z.; investigation, D.Z.; resources, Q.Y.; data curation, D.Z., N.D., W.W. and Y.X.; writing—original draft preparation, D.Z.; writing—review and editing, Q.Y. and H.D.; visualization, D.Z., N.D., W.W. and Y.X.; supervision, Q.Y. and H.D.; project administration, Q.Y.; funding acquisition, Q.Y. All authors have read and agreed to the published version of the manuscript.

Funding

This work was supported by the National Natural Science Foundation of China (No. 21277008) and the National Key Research and Development Program of China (No. 2017YFC0209905).

Data Availability Statement

All the relevant data used in this study have been provided in the form of figures and tables in the published article, and all data provided in the present manuscript are available to whom they may concern.

Conflicts of Interest

The authors declare no conflict of interest.

References

  1. Kamal, M.S.; Razzak, S.A.; Hossain, M.M. Catalytic oxidation of volatile organic compounds (VOCs)—A review. Atmos. Environ. 2016, 140, 117–134. [Google Scholar] [CrossRef]
  2. Zhao, Q.; Li, Y.; Chai, X.; Xu, L.; Zhang, L.; Ning, P.; Huang, J.; Tian, S. Interaction of inhalable volatile organic compounds and pulmonary surfactant: Potential hazards of VOCs exposure to lung. J. Hazard. Mater. 2019, 369, 512–520. [Google Scholar] [CrossRef] [PubMed]
  3. He, C.; Cheng, J.; Zhang, X.; Douthwaite, M.; Pattisson, S.; Hao, Z. Recent advances in the catalytic oxidation of volatile organic compounds: A review based on pollutant sorts and sources. Chem. Rev. 2019, 119, 4471–4568. [Google Scholar] [CrossRef] [PubMed]
  4. Guo, J.; Lin, C.; Jiang, C.; Zhang, P. Review on noble metal-based catalysts for formaldehyde oxidation at room temperature. Appl. Surf. Sci. 2019, 475, 237–255. [Google Scholar] [CrossRef]
  5. Dong, N.; Ye, Q.; Chen, M.; Cheng, S.; Kang, T.; Dai, H. Sodium-treated sepiolite-supported transition metal (Cu, Fe, Ni, Mn, or Co) catalysts for HCHO oxidation. Chin. J. Catal. 2020, 41, 1734–1744. [Google Scholar] [CrossRef]
  6. Yi, H.; Song, L.; Tang, X.; Zhao, S.; Yang, Z.; Xie, X.; Ma, C.; Zhang, Y.; Zhang, X. Effect of microwave absorption properties and morphology of manganese dioxide on catalytic oxidation of toluene under microwave irradiation. Ceram. Int. 2020, 46, 3166–3176. [Google Scholar] [CrossRef]
  7. Yang, W.; Su, Z.A.; Xu, Z.; Yang, W.; Peng, Y.; Li, J. Comparative study of α-, β-, γ- and δ-MnO2 on toluene oxidation: Oxygen vacancies and reaction intermediates. Appl. Catal. B 2020, 260, 118150. [Google Scholar] [CrossRef]
  8. Zeng, X.; Li, B.; Liu, R.; Li, X.; Zhu, T. Investigation of promotion effect of Cu doped MnO2 catalysts on ketone-type VOCs degradation in a one-stage plasma-catalysis system. Chem. Eng. J. 2020, 384, 123362. [Google Scholar] [CrossRef]
  9. Huang, F.; Wang, X.; Zhu, Q.; Li, K.; Zhou, X.; Lu, S.; Fan, Z.; He, L.; Liu, Y.; Pang, F. Efficient formaldehyde elimination over Ag/MnO2 nanorods: Influence of the Ag loading. Catal. Surv. Asia 2019, 23, 33–40. [Google Scholar] [CrossRef]
  10. Xie, S.; Liu, Y.; Deng, J.; Yang, J.; Zhao, X.; Han, Z.; Zhang, K.; Lu, Y.; Liu, F.; Dai, H. Carbon monoxide oxidation over rGO-mediated gold/cobalt oxide catalysts with strong metal–support interaction. ACS Appl. Mater. Interfaces 2020, 12, 31467–31476. [Google Scholar] [CrossRef]
  11. Lu, L.; Tian, H.; He, J.; Yang, Q. Graphene–MnO2 hybrid nanostructure as a new catalyst for formaldehyde oxidation. J. Phys. Chem. C 2016, 120, 23660–23668. [Google Scholar] [CrossRef]
  12. Wu, S.; He, Q.; Zhou, C.; Qi, X.; Huang, X.; Yin, Z.; Yang, Y.; Zhang, H. Synthesis of Fe3O4 and Pt nanoparticles on reduced graphene oxide and their use as a recyclable catalyst. Nanoscale 2012, 4, 2478. [Google Scholar] [CrossRef] [PubMed]
  13. Liu, X.; Ding, S.; Shigenobu, S.; Hojo, H.; Einaga, H. Catalyst design of Pt/TiO2 microsphere for benzene oxidation under microwave irradiation. Catal. Today 2021, 376, 285–291. [Google Scholar] [CrossRef]
  14. Wu, B.; Chen, B.; Zhu, X.; Yu, L.; Shi, C. Lower loading of Pt on hydrophobic Ts-1 zeolite: A high-efficiency catalyst for benzene oxidation at low temperature. Catal. Today 2020, 355, 512–517. [Google Scholar] [CrossRef]
  15. Guo, Y.; Sun, Y.; Yang, D.; Dai, J.; Liu, Z.; Chen, Y.; Huang, J.; Li, Q. Biogenic Pt/CaCO3 nanocomposite as a robust catalyst toward benzene oxidation. ACS Appl. Mater. Interfaces 2020, 12, 2469–2480. [Google Scholar] [CrossRef]
  16. Hao, X.; Dai, L.; Deng, J.; Liu, Y.; Jing, L.; Wang, J.; Pei, W.; Zhang, X.; Hou, Z.; Dai, H. Nanotubular OMS-2 supported single-atom platinum catalysts highly active for benzene oxidation. J. Phys. Chem. C 2021, 125, 17696–17708. [Google Scholar] [CrossRef]
  17. Yang, K.; Liu, Y.; Deng, J.; Zhao, X.; Yang, J.; Han, Z.; Hou, Z.; Dai, H. Three-dimensionally ordered mesoporous iron oxide-supported single-atom platinum: Highly active catalysts for benzene combustion. Appl. Catal. B 2019, 244, 650–659. [Google Scholar] [CrossRef]
  18. Zheng, J.; Wang, Z.; Chen, Z.; Zuo, S. Mechanism of CeO2 synthesized by thermal decomposition of Ce-MOF and its performance of benzene catalytic combustion. J. Rare Earths 2021, 39, 790–796. [Google Scholar] [CrossRef]
  19. Mori, K.; Shimada, M.; Horiuchi, Y.; Ohmichi, T.; Nishiyama, N.; Fujii, H.; Yamashita, H. Preparation of nano-sized Pt metal particles by photo-assisted deposition (PAD) on transparent Ti-containing mesoporous silica thin film. Res. Chem. Intermed. 2008, 34, 495–505. [Google Scholar] [CrossRef]
  20. Zhang, K.; Dai, L.; Liu, Y.; Deng, J.; Jing, L.; Zhang, K.; Hou, Z.; Zhang, X.; Wang, J.; Feng, Y.; et al. Insights into the active sites of chlorine-resistant Pt-based bimetallic catalysts for benzene oxidation. Appl. Catal. B 2020, 279, 119372. [Google Scholar] [CrossRef]
  21. Chen, Z.; Mao, J.; Zhou, R. Preparation of size-controlled Pt supported on Al2O3 nanocatalysts for deep catalytic oxidation of benzene at lower temperature. Appl. Surf. Sci. 2019, 465, 15–22. [Google Scholar] [CrossRef]
  22. Xia, Y.; Xia, L.; Liu, Y.; Yang, T.; Deng, J.; Dai, H. Concurrent catalytic removal of typical volatile organic compound mixtures over Au–Pd/α-MnO2 nanotubes. J. Environ. Sci. 2018, 64, 276–288. [Google Scholar] [CrossRef] [PubMed]
  23. Cheng, L.; Wang, J.; Zhang, C.; Jin, B.; Men, Y. Boosting acetone oxidation efficiency over MnO2 nanorods by tailoring crystal phases. New J. Chem. 2019, 43, 19126–19136. [Google Scholar] [CrossRef]
  24. Chen, D.; Zhang, G.; Wang, M.; Li, N.; Xu, Q.; Li, H.; He, J.; Lu, J. Pt/MnO2 nanoflowers anchored to boron nitride aerogels for highly efficient enrichment and catalytic oxidation of formaldehyde at room temperature. Angew. Chem. Int. Ed. 2021, 60, 6377–6381. [Google Scholar] [CrossRef] [PubMed]
  25. Wang, C.; Wang, H.; Zhai, C.; Ren, F.; Zhu, M.; Yang, P.; Du, Y. Three-dimensional Au0.5/reduced graphene oxide/carbon fiber electrode and its high catalytic performance toward ethanol electrooxidation in alkaline media. J. Mater. Chem. A 2015, 3, 4389–4398. [Google Scholar] [CrossRef]
  26. Qin, Y.; Wang, Y.; Li, J.; Qu, Z. Effect of Ag on toluene oxidation over Ag supported wire-like MnO2 catalysts. Surf. Interf. 2020, 21, 100657. [Google Scholar] [CrossRef]
  27. Zhang, L.; Zhu, S.; Li, R.; Deng, W.; Hong, C.; Liu, D.; Guo, L. Ag-doped δ-MnO2 nanosheets as robust catalysts for toluene combustion. ACS Appl. Nano Mater. 2020, 3, 11869–11880. [Google Scholar] [CrossRef]
  28. Lu, S.; Zhu, Q.; Dong, Y.; Zheng, Y.; Wang, X.; Li, K.; Huang, F.; Peng, B.; Chen, Y. Influence of MnO2 morphology on the catalytic performance of Ag/MnO2 for the HCHO oxidation. Catal. Surv. Asia 2019, 23, 210–218. [Google Scholar] [CrossRef]
  29. Wang, Y.; Liu, H.; Wang, S.; Luo, M.; Lu, J. Remarkable enhancement of dichloromethane oxidation over potassium-promoted Pt/Al2O3 catalysts. J. Catal. 2014, 311, 314–324. [Google Scholar] [CrossRef]
  30. Wang, Y.; Wang, G.; Deng, W.; Han, J.; Qin, L.; Zhao, B.; Guo, L.; Xing, F. Study on the structure-activity relationship of Fe-Mn oxide catalysts for chlorobenzene catalytic combustion. Chem. Eng. J. 2020, 395, 125172. [Google Scholar] [CrossRef]
  31. Yan, Z.; Xu, Z.; Yang, Z.; Yue, L.; Huang, L. Graphene oxide/Fe2O3 nanoplates supported Pt for enhanced room-temperature oxidation of formaldehyde. Appl. Surf. Sci. 2019, 467–468, 277–285. [Google Scholar] [CrossRef]
  32. Yashnik, S.A.; Chesalov, Y.A.; Ishchenko, A.V.; Kaichev, V.V.; Ismagilov, Z.R. Effect of Pt addition on sulfur dioxide and water vapor tolerance of Pd-Mn-hexaaluminate catalysts for high-temperature oxidation of methane. Appl. Catal. B 2017, 204, 89–106. [Google Scholar] [CrossRef]
  33. Sun, P.; Long, Y.; Long, Y.; Cao, S.; Weng, X.; Wu, Z. Deactivation effects of Pb(ii) and sulfur dioxide on a γ-MnO2 catalyst for combustion of chlorobenzene. J. Colloid Interf. Sci. 2020, 559, 96–104. [Google Scholar] [CrossRef] [PubMed]
  34. Chen, Y.W.; Li, B.; Niu, Q.; Li, L.; Kan, J.W.; Zhu, S.M.; Shen, S.B. Combined promoting effects of low-Pd-containing and Cu-doped LaCoO3 perovskite supported on cordierite for the catalytic combustion of benzene. Environ. Sci. Pollut. Res. 2016, 23, 15193–15201. [Google Scholar] [CrossRef] [PubMed]
  35. Wu, P.; Zhao, S.; Yu, J.; Jin, X.; Ye, D.; Yang, S.; Qiu, Y. Effect of absorbed sulfate poisoning on the performance of catalytic oxidation of VOCs over MnO2. ACS Appl. Mater. Interfaces 2020, 12, 50566–50572. [Google Scholar] [CrossRef]
  36. Wilburn, M.S.; Epling, W.S. SO2 adsorption and desorption characteristics of Pd and Pt catalysts: Precious metal crystallite size dependence. Appl. Catal. A 2017, 534, 85–93. [Google Scholar] [CrossRef]
  37. Li, J.; Cai, S.; Yu, E.; Weng, B.; Chen, X.; Chen, J.; Jia, H.; Xu, Y. Efficient infrared light promoted degradation of volatile organic compounds over photo-thermal responsive Pt-rGO-TiO2 composites. Appl. Catal. B 2018, 233, 260–271. [Google Scholar] [CrossRef]
  38. Rong, S.; Zhang, P.; Liu, F.; Yang, Y. Engineering crystal facet of α-MnO2 nanowire for highly efficient catalytic oxidation of carcinogenic airborne formaldehyde. ACS Catal. 2018, 8, 3435–3446. [Google Scholar] [CrossRef]
  39. Wu, X.; Lee, H.; Liu, S.; Weng, D. Sulfur poisoning and regeneration of MnOx-CeO2-Al2O3 catalyst for soot oxidation. J. Rare Earths 2012, 30, 659–664. [Google Scholar] [CrossRef]
  40. Wang, X.; Liu, Y.; Zhang, T.; Luo, Y.; Lan, Z.; Zhang, K.; Zuo, J.; Jiang, L.; Wang, R. Geometrical-site-dependent catalytic activity of ordered mesoporous Co-based spinel for benzene oxidation: In situ Drifts study coupled with Raman and EXAFS spectroscopy. ACS Catal. 2017, 7, 1626–1636. [Google Scholar] [CrossRef]
  41. Sivasankar, N.; Vasudevan, S. Temperature-programmed desorption and infrared spectroscopic studies of benzene adsorption in zeolite ZSM-5. J. Phys. Chem. B 2004, 108, 11585–11590. [Google Scholar] [CrossRef]
  42. Wang, X.; Zhao, W.; Wu, X.; Zhang, T.; Liu, Y.; Zhang, K.; Xiao, Y.; Jiang, L. Total oxidation of benzene over ACo2O4 (A = Cu, Ni and Mn) catalysts: In situ drifts account for understanding the reaction mechanism. Appl. Surf. Sci. 2017, 426, 1198–1205. [Google Scholar] [CrossRef]
  43. Ma, X.; Xiao, M.; Yang, X.; Yu, X.; Ge, M. Boosting benzene combustion by engineering oxygen vacancy-mediated Ag/CeO2-Co3O4 catalyst via interfacial electron transfer. J. Colloid Interf. Sci. 2021, 594, 882–890. [Google Scholar] [CrossRef]
  44. Li, Z.; Yang, D.; Chen, Y.; Du, Z.; Guo, Y.; Huang, J.; Li, Q. Waste eggshells to valuable CO3O4/CaCO3 materials as efficient catalysts for VOCs oxidation. Mol. Catal. 2020, 483, 110766. [Google Scholar] [CrossRef]
  45. Zhao, X.; Xu, D.; Wang, Y.; Zheng, Z.; Li, K.; Zhang, Y.; Zhan, R.; Lin, H. Electric field assisted benzene oxidation over Pt-Ce-Zr nano-catalysts at low temperature. J. Hazard. Mater. 2021, 407, 124349. [Google Scholar] [CrossRef]
  46. Li, L.; Yang, Q.; Wang, D.; Peng, Y.; Yan, J.; Li, J.; Crittenden, J. Facile synthesis λ-MnO2 spinel for highly effective catalytic oxidation of benzene. Chem. Eng. J. 2021, 421, 127828. [Google Scholar] [CrossRef]
  47. Wang, Z.; Yang, H.; Liu, R.; Xie, S.; Liu, Y.; Dai, H.; Huang, H.; Deng, J. Probing toluene catalytic removal mechanism over supported Pt nano- and single-atom-catalyst. J. Hazard. Mater. 2020, 392, 122258. [Google Scholar] [CrossRef] [PubMed]
  48. He, D.; Jiang, Y.; Lv, H.; Pan, M.; Mu, S. Nitrogen-doped reduced graphene oxide supports for noble metal catalysts with greatly enhanced activity and stability. Appl. Catal. B 2013, 132–133, 379–388. [Google Scholar] [CrossRef]
  49. Mady, A.H.; Baynosa, M.L.; Tuma, D.; Shim, J. Facile microwave-assisted green synthesis of Ag-ZnFe2O4@rGO nanocomposites for efficient removal of organic dyes under UV- and visible-light irradiation. Appl. Catal. B 2017, 203, 416–427. [Google Scholar] [CrossRef]
Figure 1. (A) Benzene conversion as a function of temperature, (B) Arrhenius plots for the oxidation of benzene over the α-MnO2 and xPt-yrGO/α-MnO2 samples at SV = 60,000 mL/(g h), (C) catalytic stability of 0.94Pt-1.0rGO/α-MnO2 under different conditions, and (D) effect of GHSV on catalytic activity of 0.94Pt-1.0rGO/α-MnO2 at benzene concentration = 1000 ppm.
Catalysts 12 01426 g001
Figure 2. XRD patterns of (a) α-MnO2, (b) 0.93Pt/α-MnO2, (c) 0.91Pt-0.5rGO/α-MnO2, (d) 0.94Pt-1.0rGO/α-MnO2, and (e) 0.92Pt-2.0rGO/α-MnO2.
Catalysts 12 01426 g002
Figure 3. SEM images of (a) α-MnO2, (b) 0.93Pt/α-MnO2, (c) 0.91Pt-0.5rGO/α-MnO2, (d) 0.94Pt-1.0rGO/α-MnO2, and (e) 0.92Pt-2.0rGO/α-MnO2.
Catalysts 12 01426 g003
Figure 4. (af) TEM images of (ac) 0.93Pt/α-MnO2 and (df) 0.94Pt-1.0rGO/α-MnO2, and (gi) elemental mappings of 0.94Pt-1.0rGO/α-MnO2.
Catalysts 12 01426 g004
Figure 5. (A) Mn 2p, (B) O 1s, and (C) Pt 4f XPS spectra of (a) α-MnO2, (b) 0.93Pt/α-MnO2, (c) 0.91Pt-0.5rGO/α-MnO2, (d) 0.94Pt-1.0rGO/α-MnO2, and (e) 0.92Pt-2.0rGO/α-MnO2.
Catalysts 12 01426 g005
Figure 6. H2-TPR profiles of (a) α-MnO2, (b) 0.93Pt/α-MnO2, (c) 0.91Pt-0.5rGO/α-MnO2, (d) 0.94Pt-1.0rGO/α-MnO2, and (e) 0.92Pt-2.0rGO/α-MnO2.
Catalysts 12 01426 g006
Figure 7. (A) Effect of water vapor on the conversion of benzene over the 0.94Pt-1.0rGO/α-MnO2 sample at 170 °C and SV = 60,000 mL/(g h), (B) effect of SO2 on catalytic activity of the 0.94Pt-1.0rGO/α-MnO2 sample for benzene oxidation at SV = 60,000 mL/(g h), and effect of 75 ppm SO2 on benzene conversion over (C) α-MnO2, (D) 0.93Pt/α-MnO2, and (E) 0.94Pt-1.0rGO/α-MnO2 at benzene concentration = 1000 ppm and different temperatures.
Catalysts 12 01426 g007
Figure 8. (A) S 2p, (B) Mn 2p, (C) O 1s, and (D) Pt 4f XPS spectra of (a) 0.94Pt-1.0rGO/α-MnO2 and (b) 0.94Pt-1.0rGO/α-MnO2-S.
Catalysts 12 01426 g008
Figure 9. (A) XRD patterns, (B) FTIR spectra, (C) H2-TPR profiles, and (D) TG profiles of (a) 0.94Pt-1.0rGO/α-MnO2 and (b) 0.94Pt-1.0rGO/α-MnO2-S.
Catalysts 12 01426 g009
Figure 10. In situ DRIFTS spectra of the 0.94Pt-1.0rGO/α-MnO2 samples in the presence of (A) (1000 ppm benzene + N2 (balance)), (B) (1000 ppm benzene + 20 vol% O2 + N2 (balance)), and (C) (1000 ppm benzene + 50 ppm SO2 + 20 vol% O2 + N2 (balance)) after 10–60 min of reaction at 160 °C.
Catalysts 12 01426 g010
Figure 11. Proposed catalytic mechanism of benzene oxidation over 0.94Pt-1.0rGO/α-MnO2.
Catalysts 12 01426 g011
Table 1. Catalytic activities, apparent activation energies (Ea), TOFPt at 149 °C, and specific reaction rates at 149 °C (rcat) of the α-MnO2 and xPt-yrGO/α-MnO2 samples at GHSV = 60,000 mL/(g h).
SampleBenzene Oxidation ActivityEa
(kJ/mol)
TOFPt
(×10−2 s−1)
rcat
(mol/(g s))
T10% (°C)T50% (°C)T90% (°C)
α-MnO224027530096.11.91 × 10−5
0.93Pt/α-MnO217019020567.00.285.11 × 10−5
0.91Pt-0.5rGO/α-MnO215817618858.40.478.18 × 10−5
0.94Pt-1.0rGO/α-MnO214916316951.31.543.14 × 10−4
0.92Pt-2.0rGO/α-MnO215216817854.30.851.84 × 10−4
Table 2. Surface areas, pore volumes, average pore diameter, and crystallite sizes (D) of the samples.
SampleSurface Area
(m2/g)
Pore Volume
(cm3/g)
Average Pore Diameter (nm)Da
(nm)
α-MnO236.60.0678.927.2
0.93Pt/α-MnO237.10.0608327.9
0.91Pt-0.5rGO/α-MnO237.90.0719.028.7
0.94Pt-1.0rGO/α-MnO238.70.0778.529.1
0.92Pt-2.0rGO/α-MnO240.70.0878.133.9
a Data determined based on the XRD results according to the Scherrer equation using the FWHM of the (110), (200), (310), and (211) lines of α-MnO2.
Table 3. Surface element compositions and H2 consumption of the samples.
SampleSurface Element Composition (Molar Ratio)H2 Consumption (mmol/g)
Mn3+/Mn4+Pt2+/Pt0Oads/OlattαβγTotal
α-MnO20.480.4516.318.56.741.5
0.93Pt/α-MnO20.500.500.5020.914.38.643.8
0.91Pt-0.5rGO/α-MnO20.550.570.5321.113.19.944.1
0.94Pt-1.0rGO/α-MnO20.600.610.5723.314.29.847.3
0.92Pt-2.0rGO/α-MnO20.580.590.5529.812.810.546.1
Publisher’s Note: MDPI stays neutral with regard to jurisdictional claims in published maps and institutional affiliations.

