
Adsorption of Methylene Blue on Chestnut Shell-Based Activated Carbon: Calculation of Thermodynamic Parameters for Solid–Liquid Interface Adsorption

School of Thermal Engineering, Shandong Jianzhu University, Jinan 250101, China
*
Author to whom correspondence should be addressed.
Catalysts 2022, 12(8), 813; https://doi.org/10.3390/catal12080813
Submission received: 27 June 2022
/
Revised: 19 July 2022
/
Accepted: 21 July 2022
/
Published: 24 July 2022
(This article belongs to the Section Catalytic Materials)
Abstract
:Chestnut shell-based activated carbon was prepared with chestnut shell as the raw material and ZnCl2 as the activating agent. Based on thermodynamic parameters, the adsorption behavior of methylene blue (MB) on chestnut shell-based activated carbon was studied, and the effect of temperature on the thermodynamic parameters and adsorption behavior was investigated. The Langmuir equilibrium constant (KL) and the standard equilibrium constant (K0) were used to calculate the thermodynamic parameters, respectively. Comparative analysis showed that spontaneous adsorption (ΔG0 < 0) was more compatible with the standard equilibrium constant (K0). Furthermore, the thermodynamic parameters at 30, 40 and 50 °C were measured, and the adsorption potential was investigated and calculated. Eventually, the mechanism of the adsorption process was determined. It was concluded that the adsorption process mainly involved chemical adsorption, which indicated that MB adsorption was caused by the force of the chemical bond.
1. Introduction
Printing and dyeing wastewater is discharged in large quantities, and it is characterized by a high content of organic pollutants, high chromaticity, high alkalinity and great variety of water quality, making it difficult to carry out sewage treatment. Printing and dyeing wastewater has become a major source of pollution [1,2,3]. If discharged into natural water without effective treatment, the wastewater will inflict harm on aquatic life and human beings alike [4]. At present, the treatment methods of printing and dyeing wastewater include biological treatment [5], chemical oxidation [6], flocculation-precipitation [7], electrolysis [8], photocatalytic degradation [9], etc. Each of the methods is accompanied by certain disadvantages, such as high cost, complex processes, a large amount of sludge resulting from treatment, secondary pollution, etc. [10]. Among them, adsorption has become the most widely used wastewater treatment method due to its non-pollution, low energy consumption and resource recovery by separating and enriching organic pollutants [11].
The selection of solid adsorbent holds the key to the adsorption treatment of wastewater. Commonly used solid adsorbents include silica gel [12], zeolite [13], diatomite [14], activated carbon [15], etc. Activated carbon is widely used in the advanced treatment of printing and dyeing sewage due to its well-developed pore structure, high specific surface area, strong acid and alkali corrosion resistance, high-temperature endurance, good physical and chemical adsorption performance and extensive raw materials sourcing. Moreover, activated carbon can be regenerated, which involves easy operation and management procedures [16].
The preparation method of activated carbon can be divided into two basic categories: a physical activation method with water vapor and/or CO2 as the activating agent [17], and a chemical activation method with ZnCl2, H3PO4 or KOH as the activating agent [18]. Steam activation requires high temperature, heavy investment in equipment and causes serious pollution. H3PO4 activation features massive raw material consumption and low energy efficiency, resulting in high cost and serious pollution, although the technology is relatively mature. KOH activation causes severe corrosion of equipment. Girgis et al. [19] studied peanut shell-based high-quality activated carbon with H3PO4, ZnCl2, KOH and water vapor as the activating agent, respectively. According to their study, mesoporous activated carbon was obtained through 600 °C water vapor activation, activated carbon with high specific surface area and well-developed micropores obtained with KOH as the activating agent. Microporous activated carbon was prepared by means of ZnCl2 activation. Based on this, activated carbon with abundant micropores, high specific surface area and large total pore volume was prepared by increasing the ratio of H3PO4 to raw material. ZnCl2 activation has been extensively studied at home and abroad, and about 40–50% of activated carbon produced worldwide is prepared by means of ZnCl2 activation [20]. In recent years, the production technology of activated carbon with ZnCl2 as the activating agent has witnessed great development. Due to the advantages of less severe environmental pollution and low production cost, ZnCl2 activation has gradually become one of the leading chemical activation technologies in activated carbon production worldwide.
The preparation method, surface characteristics and adsorption properties for methylene blue (MB) of chestnut shell-based activated carbon has been reported in previous studies. The results indicated that the adsorption isotherms of methylene blue dye were fitted well by the Langmuir model [21]. Therefore, in this study, the optimal chestnut shell-based activated carbon was prepared by the response surface method to investigate the effect of temperature on the thermodynamic parameters during the adsorption process. Comparisons were made between the thermodynamic parameters calculated with Langmuir adsorption equilibrium constant KL and those calculated using the standard equilibrium constant K0. Thermodynamic parameters of the solid–liquid interface during MB adsorption onto activated carbon were obtained, and adsorption spontaneity and adsorption mechanism were determined.
2. Results and Discussion
2.1. Comparative Analysis of the Calculation of Thermodynamic Parameters
2.1.1. Calculation of Thermodynamic Parameters
To effectively evaluate the adsorption performance of the adsorbent and accurately understand the adsorption process, thermodynamic parameters, including standard free energy change (ΔG0), enthalpy change (ΔH0) and entropy change (ΔS0), were measured. Those parameters could help investigate the adsorption mechanism by providing important information on adsorption feasibility, adsorption limit and adsorption type, leading to a correct understanding of the adsorption mechanism. To obtain the thermodynamic parameters, the adsorption isotherm was measured, and it was then used to perform curve fitting to obtain the adsorption constant K at different temperatures. The adsorption constant K was subsequently converted into the standard equilibrium constant K0, with which Gibbs equation [22] was used to calculate the effect of temperature on adsorption equilibrium.
where R is the gas constant (8.314 J·mol−1·k−1), T(K) is the thermodynamic temperature, ΔG0 (kJ·mol−1) is the change of adsorption free energy, ΔH0 (kJ·mol−1) is the change in enthalpy of adsorption, ΔS0 (J·mol−1k−1) is the change of adsorption entropy and K is the adsorption equilibrium constant.
When the effect of temperature on enthalpy change ΔH0 and entropy changeΔS0 were ignored, a plot of lnK versus 1/T provided a straight line based on Equation (2) and Equation (3). ΔH0 and ΔS0 at a fixed temperature were obtained using the slope (−ΔH0/R) and the intercept (ΔS0/R) of the plot.
The adsorption constant K obtained by curve fitting using the adsorption isotherm model is an empirical constant, and it is a physical quantity that can be expressed in units. The value of K is related to the unit of solution concentration used in the experiment, so it was essential to transform adsorption constant K into a dimensionless standard equilibrium constant K0 for the abovementioned calculation. In the literature available so far, the transformation mode of the standard equilibrium constant K0 is non-uniform, resulting in poor reliability of the thermodynamic data obtained. Even though correct calculation results are obtained in some literature, the dimensionless characteristics of the standard equilibrium constant are not accurately understood. In this experiment, the Langmuir adsorption model was employed. Langmuir adsorption equilibrium constant KL and the standard equilibrium constant K0 were calculated to investigate the physical significance, correlation and calculation difference between them.
2.1.2. Calculation of Thermodynamic Parameters Using the Langmuir Adsorption Equilibrium Constant KL
As mentioned above, the previous investigation of the adsorption performance showed that equilibrium data fits well for the Langmuir adsorption isotherms, with the correlation coefficient being more than 0.99 [21]. The Langmuir isotherms obtained from the equilibrium adsorption data of previous study were given in Figure 1. Based on the Langmuir adsorption model, Ka and Kd are used to represent the rate coefficient of adsorption and desorption, respectively; and the adsorption process of adsorbate B in the solution onto adsorbent A can be expressed as A(S) + B(I) ⇔ B − A(s).
Furthermore, the parameter θ was used to represent the proportion of adsorbent surface covered by adsorbate, and then the proportion of blank positions on the adsorbent surface not covered by adsorbate was (1 − θ). The adsorbate concentration of the solution was expressed as cB. According to the mass-action law of microscopic reaction, the adsorption rate (va) and the desorption rate (vd) can be calculated by Ka and Kd as follows,
In the Langmuir adsorption theory, the rate of adsorption and desorption is the same when the adsorption reaches equilibrium, i.e., va = vd. Thus, the Ka/Kd can be obtained by:
Moreover, when the adsorption reaches equilibrium, the Langmuir adsorption equilibrium constant KL can be calculated by the ratio of adsorption rate constant Ka to the desorption rate constant Kd, KL = Ka/Kd.
Therefore, θ can be obtained by,
However, θ is defined by the ratio of equilibrium adsorption capacity (qe, mg·g−1) to the maximum adsorption capacity (qm, mg·g−1). Therefore, the Langmuir adsorption isotherm equation can be expressed as,
2.1.3. Calculation of Thermodynamic Parameters Using the Adsorption Standard Equilibrium Constant K0
The adsorption equilibrium was described as A(S) + B(I) ⇔ B − A(s). The chemical potential, μ, of each substance in the adsorption system can be expressed as,
where μB, μA and μB−A represent the chemical potential at a standard state of adsorbate B, adsorbent A and adsorption product B − A, respectively. Additionally, aB, aA and aB−A are the activity of adsorbate B, adsorbent A and adsorption product B − A, respectively.
For solid adsorbent A and its adsorption product B − A, their activity depends on the number of active sites on the solid surface, which can be taken as the number of adsorption sites. The number of active sites is associated with surface coverage θ,
In the adsorption process, the relationship between Gibbs free energy change and chemical potentials can be expressed as Equation (14),
Thus, ΔG can be calculated by,
When the adsorption reaction reaches equilibrium, ΔG = 0. Thus,
Based on the definition of ΔG, the standard equilibrium constant K0 can be obtained by,
In addition, the activity mentioned above is defined as,
where b (mol·kg−1) is the molality of the adsorbate, b0 is the standard concentration (1.0 mol·kg−1) and γ is the activity factor. For neutral and dilute solutions, γ = 1.
When the water is used as the solvent, and the effect of temperature on volume is ignored, the molarity c (mol·L−1) can be used to substitute molality b (mol·kg−1), and then Equation (18) can be written as,
Therefore, the standard equilibrium constant K0 expressed by molarity c can be obtained in another form,
Using Langmuir balance constant KL obtained in Table 1, K0 can be expressed as [23],
where mB is the molecular weight of adsorbate B.
The MB solution used for the adsorption was a dilute solution; therefore, γ = 1, and Equation (21) becomes,
2.2. Adsorption Potential
The liquid phase adsorption on solid adsorbents is quite complicated, featuring an adsorption competition between the adsorbate and the solvent on the adsorbent surface. According to the Polanyi adsorption potential theory, the adsorption potential ε of adsorbate molecules in the attractive field of a solid surface refers to the work required to move a molecule to infinity from its location in the adsorption space. Therefore, chemical potential can help describe the interaction between various components and the situation of chemisorption in the solution and adsorption layer. The adsorption potential at solid–liquid interfaces can be expressed by the Polanyi equation,
where ε (KJ·mol−1) is the adsorption potential and c0 (mg·L−1) and ce (mg·L−1) represent the initial concentration and equilibrium concentration, respectively; T (K) is adsorption temperature, and R is the universal gas constant (8.314 J·mol−1k−1).
3. Materials and Methods
3.1. Materials
Chestnut shell (a chestnut orchard of Weifang city, Shandong, China), methylene blue dye (analytically pure, Tianjin Zhiyuan Chemical Reagent Co., Ltd., Tianjin city, China), zinc chloride (ZnCl2, analytically pure, Tianjin Damao Chemical Reagent, Co., Ltd., Tianjin, China) and laboratory-made deionized water were obtained from the manufacturer. A stock solution of MB (1000 mg/L) was prepared and suitably diluted to the required concentration with deionized water. The concentrations of MB solution were determined at 665 nm using a UV spectrophotometer. Moreover, the ultimate analysis of the chestnut shell was conducted using an elements analyzer (vario ELⅢ, Elementar, Hesse, Germany). Additionally, the result shows that the weight percentages of C, H, O, N and S are 52.66%, 5.13%, 40.84%, 0.58% and 0.01%, respectively.
3.2. Preparation of CnSACs
Chestnut shell-based activated carbon was prepared using the chestnut shell as the raw material and ZnCl2 as the activating agent. During the preparation of CnSAC, the parameters affecting its adsorption performance include impregnation mass ratio (25 wt% ZnCl2 aqueous solution /chestnut shell), impregnation time, activation temperature and activation time. In our previous studies, the optimum preparation conditions were found to be the impregnation mass ratio of 11.4, impregnation time of 29.2 h, activation temperature of 632.4 °C and activation time of 81.4 min [21,24]. Therefore, the activated carbon used in this paper was prepared according to the above preparation parameters. Firstly, the chestnut shell was dried for 24 h in a vacuum drying oven. Secondly, the chestnut shell powder was impregnated in 25 wt% ZnCl2 aqueous solution when the mass ratio was 11.4 for 29.2 h. After mixing with the chestnut shell, ZnCl2 infiltrated into the chestnut shell, displaying swelling, dehydration, oxidation, degradation and plasticization effects on cellulose and lignin, the main composition of the chestnut shell. Then, the mixture was carbonized in a tube furnace under a nitrogen atmosphere at 630 °C with a heating rate of 10 °C/min. The activation process lasted for 75 min. During thermal decomposition, ZnCl2 enabled the carbohydrates contained in cellulose and lignin, the main composition of chestnut shells, to decompose into hydrogen and oxygen in the form of water, resulting in the pore structure of activated carbon. This is because ZnCl2 has a strong dehydrating effect and catalytic effect of removing hydroxyl and carboxyl groups from organic compounds. In addition, ZnCl2 can erode further to form pores through oxidation, resulting in a microcrystalline structure with densely distributed micropores. Finally, the carbonation products were cooled and washed thoroughly several times with deionized water and dried in a vacuum drying oven. Thus, porous activated carbon prepared from a chestnut shell (CnSAC) was obtained. In addition, the SEM image and N2 adsorption–desorption isotherms of the CnSAC prepared by the above-mentioned preparation parameters are shown in Figure 4. The SEM image shows that the surface of CnSAC is rich in folds and porous. Moreover, the N2 adsorption–desorption isotherms indicate that CnSAC exhibits type I isotherms. Additionally, the BET surface area, total pore volume and average pore diameter are 1539.4 m2·g-1, 0.843 cm3/g and 2.19 mm, respectively [24].
3.3. Isothermal Adsorption
Nine groups of chestnut shell-based activated carbons with different masses (m) were weighed and placed in a 100 mL conical flask at each temperature. MB solution of varying concentrations ranging from 20 to 700 mg/L was added to the activated carbon. The conical flask was then placed in a water bath shaker and agitated at 180 rpm. After 24 h, the concentration of MB solution was determined, and the adsorption capacity (q) and removal efficiency (R) of MB on chestnut shell-based activated carbon were obtained. Table 5 show the relationship between the adsorption capacity and removal efficiency of the MB and the initial MB concentration at 30, 40 and 50 °C.
4. Conclusions
- (1)
- The thermodynamic parameters during the adsorption of MB on chestnut shell-based activated carbon can be calculated more correctly with the standard equilibrium constant K0. The significance of K0 lies in the fact that it enables the equilibrium to be determined by concentration rather than by adsorption rate.
- (2)
- Adsorption enthalpy change ΔH0 = 24.01 KJ mol−1, short of 40 KJ mol−1, indicating that the adsorption mainly involved physical adsorption.
- (3)
- ΔG0 < 0 and ΔS0 > 0, indicating that the adsorption of MB on chestnut shell-based activated carbon was a spontaneous process. The adsorption system was more chaotic after MB entered the activated carbon, and increasing the temperature could facilitate the spontaneous adsorption process.
- (4)
- The adsorption potential was <20 KJ mol−1, further demonstrating that the adsorption consisted mainly of physical adsorption. Increasing the temperature could improve the adsorption potential in the adsorption process, which implies that the adsorption force was affected by temperature during the process of MB molecules entering the activated carbon. The reason is that adsorption first occurred at the site with the largest adsorption force on the adsorbent surface, and the adsorption force of the adsorbent surface decreased as MB covered the surface.
Author Contributions
L.K.: investigation, data acquisition, writing—original draft preparation, funding acquisition. M.Z.: methodology, writing—review and editing, funding acquisition. All authors have read and agreed to the published version of the manuscript.
Funding
This research was funded by the Natural Science Foundation of Shandong Province for Youth Fund (No. ZR2020QE204) and the Doctoral Fund Research Project of Shandong Jianzhu University (Nos. X18068Z and X20034Z). This work was also supported by the Plan of Introduction and Cultivation for Young Innovative Talents in Colleges and Universities of Shandong Province.
Data Availability Statement
All relevant data are available from the corresponding author on request.
Conflicts of Interest
The authors declare no conflict of interest.
References
- Tatyana, P.; Pablo, C.; Isaac, C. Treatment of textile industrial dyes by simple ozonation with water recirculation. J. Mex. Chem. Soc. 2007, 51, 81–86. [Google Scholar]
- Mittersteiner, M.; Schmitz, F.; Barcellos, I.O. Reuse of dye-colored water post-treated with industrial waste: Its adsorption kinetics and evaluation of method efficiency in cotton fabric dyeing. J. Water Process Eng. 2017, 17, 181–187. [Google Scholar] [CrossRef]
- Kraan, M.V.D.; Cid, M.V.F.; Woerlee, G.F.; Veugelers, W.J.T.; Witkamp, G.J. Dyeing of natural and synthetic textiles in supercritical carbon dioxide with disperse reactive dyes. J. Supercrit. Fluids 2007, 40, 470–476. [Google Scholar] [CrossRef]
- Aparicio, A.C.C.; Oliveira, L.H.S.D.; Silva, J.S.; Coelho, C.P.; Pinheiro, S.R.; Souza, M.F.; Suffredini, I.B.; Cartwright, S.J.; Bonamin, L.V. Interaction between solvatochromic dyes and water sampled from a natural source treated with high dilutions of phosphorus. Homeopathy 2020, 109, 126–132. [Google Scholar] [CrossRef]
- Nguyen, T.A.; Juang, R.S. Treatment of waters and wastewaters containing sulfur dyes: A review. Chem. Eng. J. 2013, 219, 109–117. [Google Scholar] [CrossRef]
- Laghrib, F.; Bakasse, M.; Lahrich, S.; Mhammedi, M.A.E. Advanced oxidation processes: Photo-electro-fenton remediation process for wastewater contaminated by organic azo dyes. Int. J. Environ. Anal. Chem. 2021, 101, 2947–2962. [Google Scholar] [CrossRef]
- Oladoja, N.A.; Aliu, Y.D.; Ofomaja, A.E. Evaluation of snail shell as a coagulant aid in the alum precipitation of aniline blue from aqueous solution. Environ. Technol. 2011, 32, 639–652. [Google Scholar] [CrossRef]
- Nippatla, N.; Philip, L. Performance evaluation of a novel electrolytic reactor with rotating and non rotating bipolar disc electrodes for synthetic textile wastewater treatment. J. Environ. Chem. Eng. 2020, 8, 103462. [Google Scholar] [CrossRef]
- Rafiq, A.; Ikram, M.; Ali, S.; Niaz, F.; Khand, M.; Khan, Q.; Maqbool, M. Photocatalytic degradation of dyes using semiconductor photocatalysts to clean industrial water pollution. J. Ind. Eng. Chem. 2021, 97, 111–128. [Google Scholar] [CrossRef]
- Nasar, A.; Mashkoor, F. Application of polyaniline-based adsorbents for dye removal from water and wastewater-a review. Environ. Sci. Pollut. Res. 2019, 26, 5333–5356. [Google Scholar] [CrossRef]
- Wang, X.; Jiang, C.; Hou, B.; Wang, Y.; Hao, C.; Wu, J. Carbon composite lignin-based adsorbents for the adsorption of dyes. Chemosphere 2018, 206, 587–596. [Google Scholar] [CrossRef] [PubMed]
- Wang, J.P.; Gao, Y.Y.; Zhu, L.; Gu, X.M.; Dou, H.S.; Pei, L.J. Dyeing property and adsorption kinetics of reactive dyes for cotton textiles in salt-free non-aqueous dyeing systems. Polymers 2018, 10, 1030. [Google Scholar] [CrossRef] [Green Version]
- Filipkowska, U.; Rodziewicz, J.; Moczkowska, I. Basic violet 10 dye removal from water solutions onto zeolite. Rocz. Ochr. Sr. 2010, 12, 747–760. [Google Scholar]
- Zhang, H.; Shi, B.L.; Jia, L.N. Preparation of adsorption material through calcining waste diatomite for treatment of dye water. Desalin. Water Treat. 2018, 113, 281–287. [Google Scholar] [CrossRef]
- Chan, L.S.; Cheung, W.H.; Mckay, G. Adsorption of acid dyes by bamboo derived activated carbon. Desalination 2008, 218, 304–312. [Google Scholar] [CrossRef]
- Mezohegyi, G.; Zee, F.P.V.D.; Font, J.; Fortuny, A.; Fabregat, A. Towards advanced aqueous dye removal processes: A short review on the versatile role of activated carbon. J. Environ. Manag. 2012, 102, 148–164. [Google Scholar] [CrossRef]
- Asadullah, M.; Kabir, M.S.; Ahmed, M.B.; Razak, N.A.; Rasid, N.; Aezzira, A. Role of microporosity and surface functionality of activated carbon in methylene blue dye removal from water. Korean J. Chem. Eng. 2013, 30, 2228–2234. [Google Scholar] [CrossRef]
- Daoud, M.; Benturki, O.; Kecira, Z.; Girods, P.; Donnot, A. Removal of reactive dye (BEZAKTIV Red S-MAX) from aqueous solution by adsorption onto activated carbons prepared from date palm rachis and jujube stones. J. Mol. Liq. 2017, 243, 799–809. [Google Scholar] [CrossRef]
- Girgis, B.S.; Yunis, S.S.; Soliman, A.M. Characteristics of activated carbon from peanut hulls in relation to conditions of preparation. Mater. Lett. 2002, 57, 164–172. [Google Scholar] [CrossRef]
- Li, H.Y.; Liu, L.X.; Cui, J.G.; Cui, J.L.; Wang, F.; Zhang, F. High-efficiency adsorption and regeneration of methylene blue and aniline onto activated carbon from waste edible fungus residue and its possible mechanism. RSC Adv. 2020, 10, 14262–14273. [Google Scholar] [CrossRef] [Green Version]
- Zhang, M.Y.; Liu, X.Z.; Li, W.D.; Tan, Z.W.; Wang, Q.; Zhang, L.H. Removal of toxic dyes from aqueous solutions by adsorption onto a novel activated carbon prepared from chestnut shell. Desalin. Water Treat. 2021, 222, 246–258. [Google Scholar] [CrossRef]
- Gerstner, J.A.; Bell, J.A.; Cramer, S.M. Gibbs free energy of adsorption for biomolecules in ion-exchange systems. Biophys. Chem. 1994, 52, 97–106. [Google Scholar] [CrossRef]
- Na, L.Y.; Zhang, L.Y.; Zhang, F.J.; Hua, R.N. Calculation of Adsorption Thermodynamic Parameters at Solid-liquid Interfaces. Mater. Rep. 2020, 34, 22030–22035. [Google Scholar]
- Zhang, M.Y.; Liu, X.Z.; Li, W.D.; Guo, L.L.; Tan, Z.W.; Wang, Q.; Zhang, L.H. Application of response surface methodology for optimization of methylene blue adsorption onto activated carbons prepared from chestnut shell. Desalin. Water Treat. 2021, 226, 441–451. [Google Scholar] [CrossRef]
Figure 1.
Langmuir isotherms for adsorption of MB onto CnSAC.
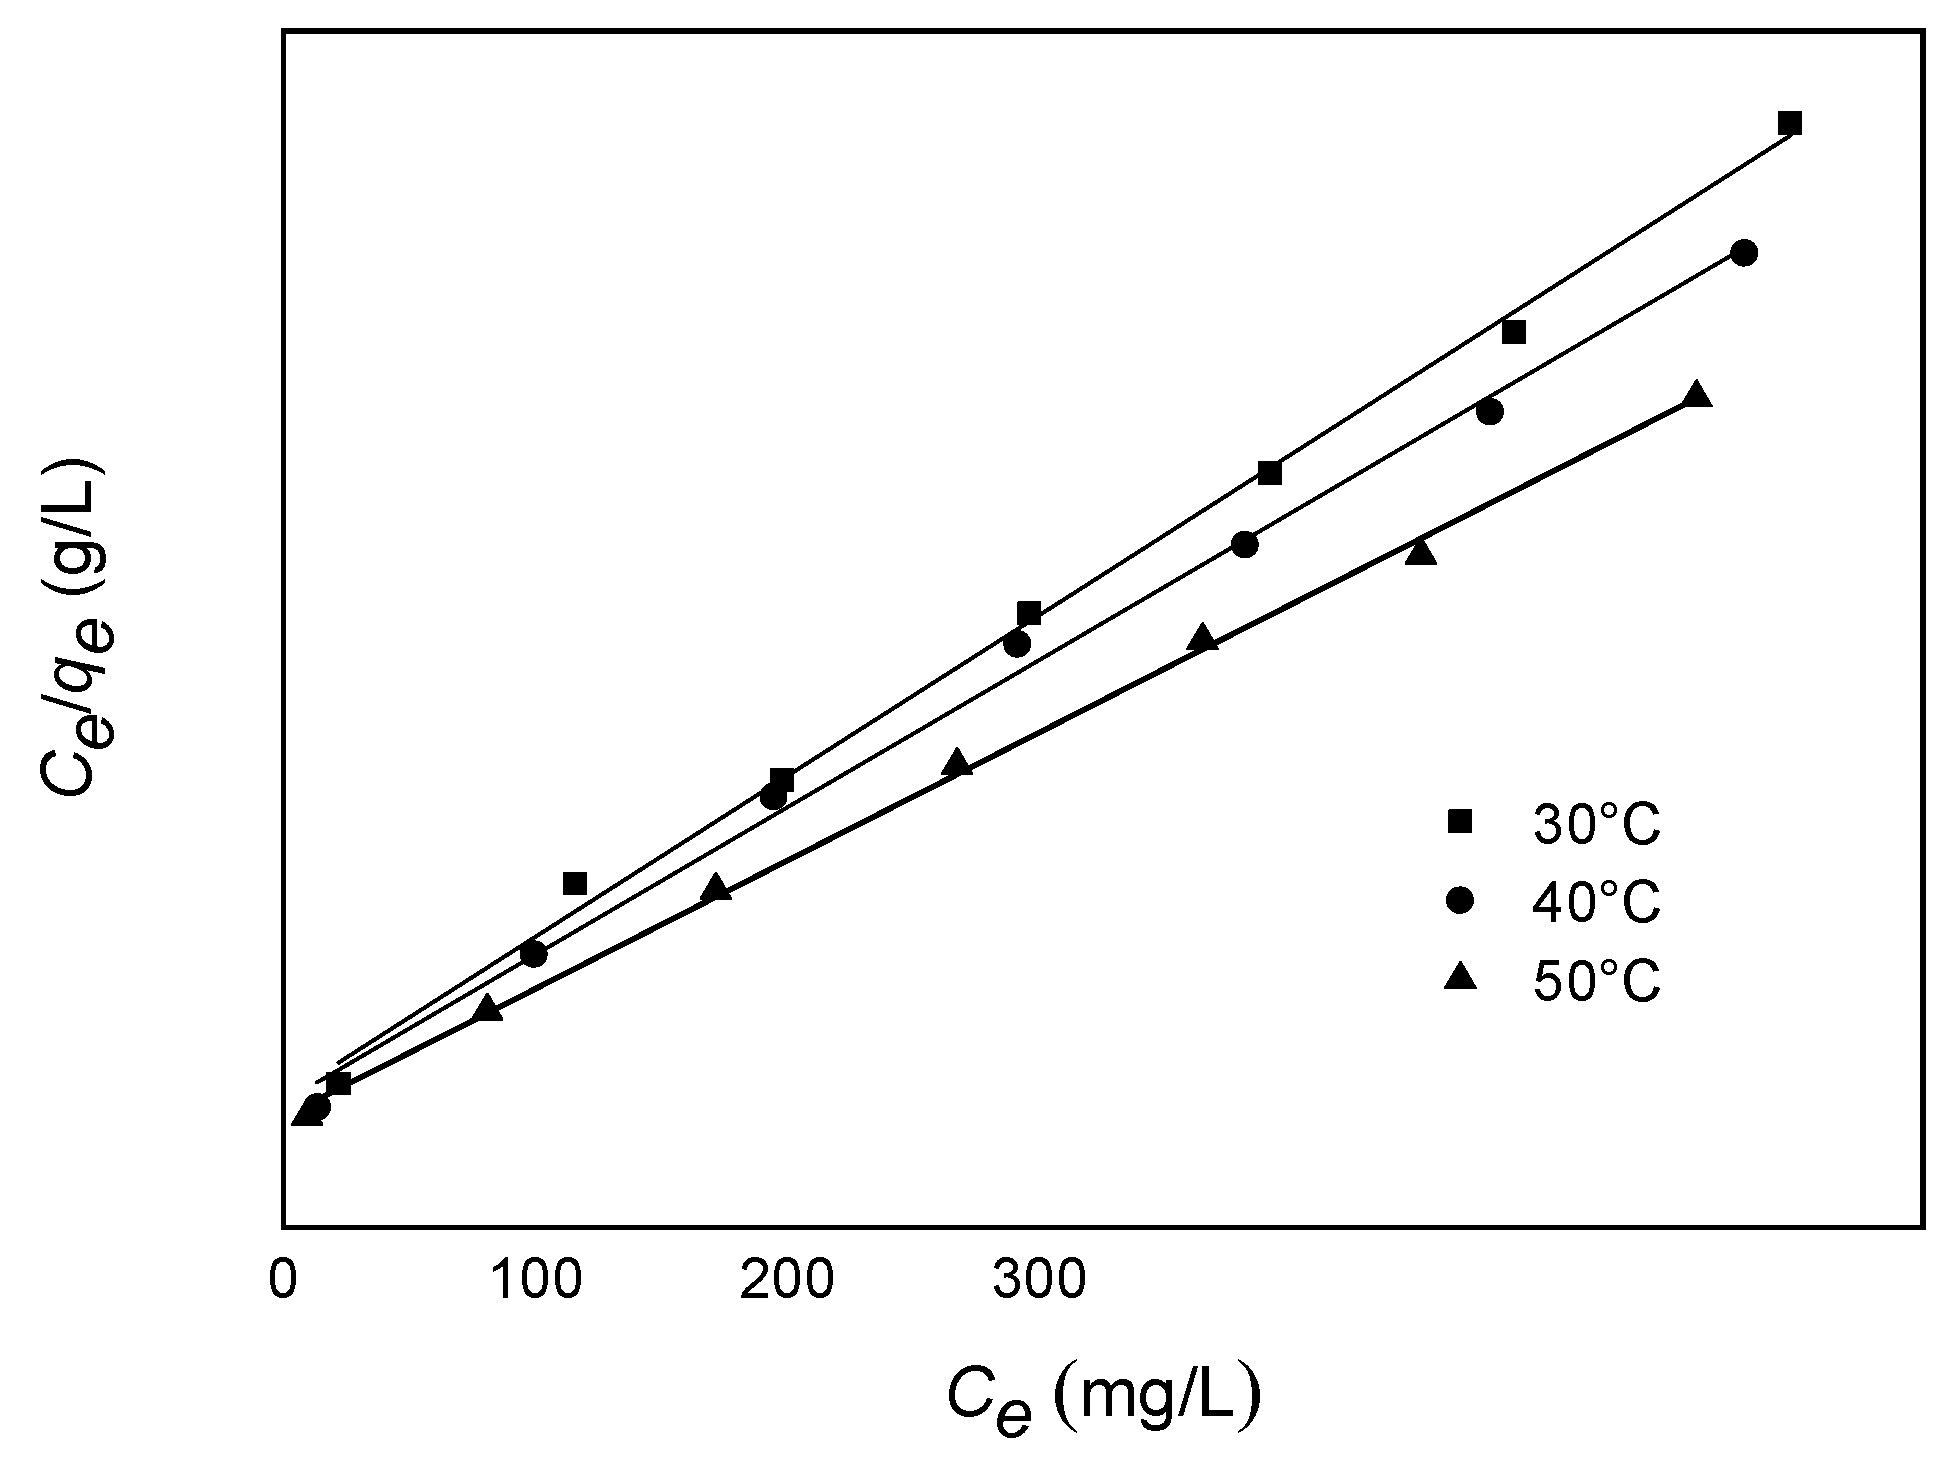
Figure 2.
The relationship between lnKL and 1/T.

Figure 3.
The relationship between lnK0 and 1/T.
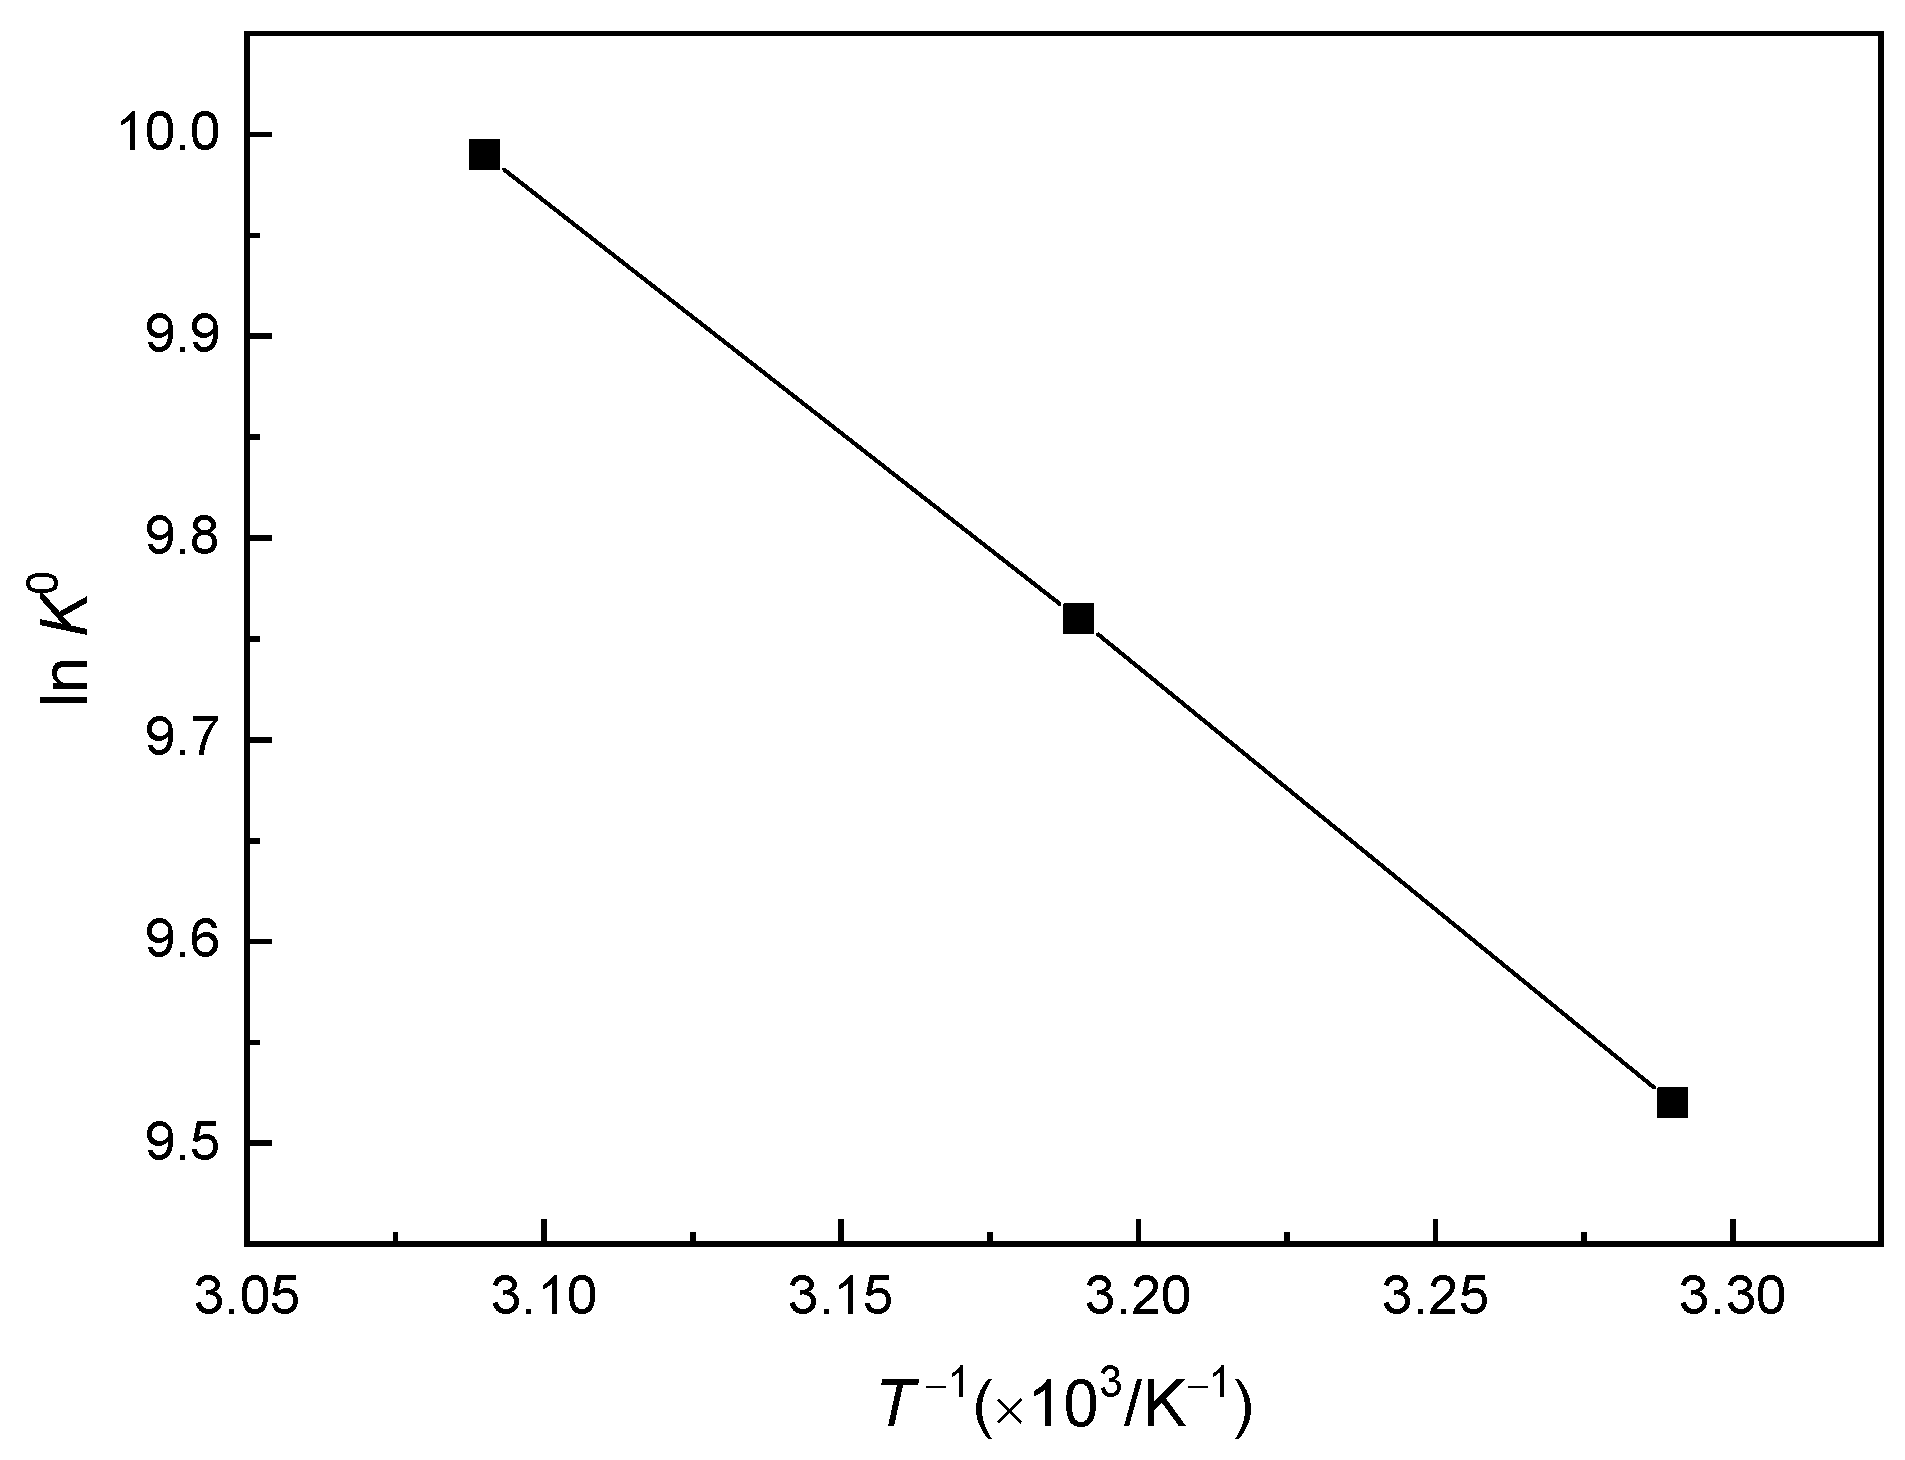
Figure 4.
Surface morphology characterization of the CnSAC.


Table 1.
Fitting parameters calculated using the Langmuir isotherm model.
| Langmuir Parameter | 303.15 K | 313.15 K | 323.15 K |
|---|---|---|---|
| qe (mg·g−1) | 1119.12 | 1226.64 | 1429.88 |
| qm (mg·g−1) | 1143.22 | 1248.33 | 1435.87 |
| ce (mg·L−1) | 488.09 | 478.34 | 451.01 |
| θ | 0.979 | 0.982 | 0.996 |
| KL (L·mg−1) | 0.0426 | 0.0442 | 0.0683 |
Table 2.
Thermodynamic parameters calculated using KL.
| Temperature (K) | Δ H0 (kJ·mol−1) | Δ G0 (kJ·mol−1) | Δ S0 (kJ·mol−1·K−1) |
|---|---|---|---|
| 303.15 | 19.62 | 95.99 | 381.37 |
| 313.15 | 19.62 | 95.76 | 381.37 |
| 323.15 | 19.62 | 94.86 | 381.37 |
Table 3.
Thermodynamic parameters calculated using K0.
| Temperature (K) | KL (L·mg−1) | K0 | Δ H0 (kJ·mol−1) | Δ G0 (kJ·mol−1) | Δ S0 (kJ·mol−1·K−1) |
|---|---|---|---|---|---|
| 303.15 | 0.0426 | 13,632 | 24.01 | 23.99 | 76.58 |
| 313.15 | 0.0442 | 14,144 | 24.01 | 24.88 | 76.58 |
| 323.15 | 0.0683 | 21,853 | 24.01 | 26.85 | 76.58 |
Table 4.
Change of adsorption potential of MB on chestnut shell-based activated carbon.
| Adsorption Temperature, K | 303.15 | 313.15 | 323.15 |
|---|---|---|---|
| Initial concentration, (mg·L−1) | Adsorption potential ε, (KJ·mol−1) | Adsorption potential ε, (KJ·mol−1) | Adsorption potential ε, (KJ·mol−1) |
| 20 | 3.68 | 5.23 | 6.84 |
| 50 | 3.61 | 5.19 | 6.76 |
| 100 | 3.52 | 5.07 | 6.68 |
| 200 | 3.47 | 5.03 | 6.65 |
| 300 | 3.44 | 4.99 | 6.59 |
| 400 | 3.42 | 4.89 | 6.52 |
| 500 | 3.41 | 4.88 | 6.49 |
| 600 | 3.41 | 4.87 | 6.47 |
| 700 | 3.42 | 4.89 | 6.48 |
Table 5.
The relationship between the adsorption capacity and removal efficiency of chestnut shell-based activated carbon and the initial MB concentration MB at different temperatures.
Table 5.
The relationship between the adsorption capacity and removal efficiency of chestnut shell-based activated carbon and the initial MB concentration MB at different temperatures.
| Initial Concentration (mg·L−1) | 20 | 50 | 100 | 200 | 300 | 400 | 500 | 600 | 700 | |
|---|---|---|---|---|---|---|---|---|---|---|
| 303.15 K | m (mg) | 1.7 | 2.1 | 6.4 | 7.1 | 8.0 | 10.2 | 11.9 | 14.0 | 16.3 |
| q (mg·g−1) | 352.9 | 714.3 | 781.3 | 844.5 | 1023.4 | 1040.3 | 1087.4 | 1119.1 | 1086.8 | |
| R | 0.99 | 0.99 | 0.99 | 0.99 | 0.91 | 0.88 | 0.86 | 0.88 | 0.83 | |
| 313.15 K | m (mg) | 1.6 | 1.9 | 6.8 | 7.4 | 8.0 | 9.7 | 11.1 | 12.9 | 13.8 |
| q (mg·g−1) | 375.0 | 789.5 | 865.8 | 1007.8 | 1055.6 | 1090.4 | 1187.1 | 1226.6 | 1208.3 | |
| R | 0.99 | 0.99 | 0.98 | 0.93 | 0.93 | 0.88 | 0.88 | 0.87 | 0.82 | |
| 323.15 K | m (mg) | 1.5 | 1.7 | 5.5 | 7.9 | 6.6 | 8.1 | 9.5 | 10.4 | 12.8 |
| q (mg·g−1) | 400.0 | 882.4 | 904.9 | 1192.1 | 1281.6 | 1328.6 | 1355.3 | 1429.9 | 1397.7 | |
| R | 0.99 | 0.99 | 0.99 | 0.94 | 0.94 | 0.90 | 0.86 | 0.86 | 0.85 | |
Publisher’s Note: MDPI stays neutral with regard to jurisdictional claims in published maps and institutional affiliations. |
© 2022 by the authors. Licensee MDPI, Basel, Switzerland. This article is an open access article distributed under the terms and conditions of the Creative Commons Attribution (CC BY) license (https://creativecommons.org/licenses/by/4.0/).
Share and Cite
MDPI and ACS Style
Kong, L.; Zhang, M. Adsorption of Methylene Blue on Chestnut Shell-Based Activated Carbon: Calculation of Thermodynamic Parameters for Solid–Liquid Interface Adsorption. Catalysts 2022, 12, 813. https://doi.org/10.3390/catal12080813
AMA Style
Kong L, Zhang M. Adsorption of Methylene Blue on Chestnut Shell-Based Activated Carbon: Calculation of Thermodynamic Parameters for Solid–Liquid Interface Adsorption. Catalysts. 2022; 12(8):813. https://doi.org/10.3390/catal12080813
Chicago/Turabian StyleKong, Lingjian, and Mingyang Zhang. 2022. "Adsorption of Methylene Blue on Chestnut Shell-Based Activated Carbon: Calculation of Thermodynamic Parameters for Solid–Liquid Interface Adsorption" Catalysts 12, no. 8: 813. https://doi.org/10.3390/catal12080813
Note that from the first issue of 2016, this journal uses article numbers instead of page numbers. See further details here.