
Construction of Spinel/Perovskite Heterojunction for Boosting Photocatalytic Performance for Polyacrylamide

1
Key Laboratory of Dielectric and Electrolyte Functional Material Hebei Province, Northeastern University at Qinhuangdao, Qinhuangdao 066004, China
2
College of Chemistry, Baicheng Normal University, Baicheng 137000, China
3
State Key Laboratory of Biochemical Engineering, Institute of Process Engineering, Chinese Academy of Sciences, Beijing 100190, China
4
School of Chemical Engineering, University of Chinese Academy of Sciences, Beijing 100049, China
*
Authors to whom correspondence should be addressed.
Catalysts 2023, 13(11), 1424; https://doi.org/10.3390/catal13111424
Submission received: 11 September 2023
/
Revised: 30 October 2023
/
Accepted: 3 November 2023
/
Published: 8 November 2023
(This article belongs to the Special Issue Exclusive Papers of the Editorial Board Members and Topical Advisory Panel Members of Catalysts in Section "Catalytic Materials")
Abstract
:The use of photocatalytic technology to degrade polyacrylamide in crude oil extraction wastewater is a promising approach, but there have been few reports so far. In this study, ZnFe2O4/Ba0.7Sr0.3TiO3 heterogeneous composite materials of a spinel/perovskite type with different proportions were synthesized. The composite materials with 31% ZnFe2O4 content exhibited a maximum polyacrylamide degradation efficiency of 46.54%, which demonstrated the unique role of the spinel/perovskite heterogeneous structure. When Ag nanoparticles were grown in situ on the surface of ZnFe2O4/Ba0.7Sr0.3TiO3, the photocatalytic degradation efficiency reached 81.28%. The main reason was that the introduction of Ag nanoparticles not only increased the active sites and enhanced light absorption capacity but also accelerated the separation of photo-generated charges. This work provides new ideas for the construction of spinel/perovskite heterogeneous composite materials and has reference significance for the application of photocatalytic degradation in the treatment of wastewater-containing polymers.
1. Introduction
In oil recovery techniques, polyacrylamide (PAM) can be dissolved in water in any proportion. Due to its good thickening, flocculation, and rheological adjustment properties, its aqueous solution can significantly improve the oil recovery rate and is widely used in petroleum extraction. However, while PAM enhances the oil recovery rate, it also generates high-viscosity wastewater-containing polymers, which can be harmful to the environment when discharged. Through migration, adsorption in formations, and other processes, PAM can pose long-term hazards to soil and water bodies. In addition, PAM can spontaneously degrade into acrylamide, and the monomer acrylamide is toxic and harmful to the human nervous system. Direct contact can cause symptoms such as eye inflammation, dizziness, and headaches, and it can also affect lung function [1]. Therefore, the effective degradation of PAM has important practical significance.
Currently, there are mainly physical degradation methods for the degradation of PAM [2] (mechanical degradation [3], ultrasonic degradation [4,5,6], thermal degradation [7,8], photodegradation [9,10], laser pulse degradation [11], low-temperature plasma degradation [12,13]) and chemical degradation methods (oxidative degradation [14], photocatalytic degradation [15]). Physical degradation methods often require the application of energy such as light and heat, which increases energy consumption and does not fully degrade PAM. Chemical degradation methods include oxidative degradation and photocatalytic degradation. Oxidative degradation requires the addition of oxidants, which can achieve complete degradation but may result in secondary pollution. Photocatalytic degradation, on the other hand, is an environmentally friendly water treatment technology that does not cause secondary pollution and can completely degrade pollutants such as PAM [15]. However, there are fewer reports on this topic. For example, Zhu et al. [16] synthesized Cu2O@ZnO using the immersion-reduction air oxidation method and prepared rGO@Fe3O4/Cu2O@ZnO magnetic recyclable composite material via a hydrothermal method with GO@Fe3O4 prepared using a chemical co-precipitation method. The composite of Cu2O and ZnO can improve the range of light response and solar energy utilization and form a heterogeneous (p-n type) structure with ZnO, further promoting the separation of light-induced charge carriers, thereby improving the catalytic performance. The high conductivity of rGO further enhances the catalytic activity of Cu2O/ZnO. Rong et al. [17] prepared an Ag-AgBr/TiO2-graphene (AATG) composite photocatalyst by modifying TiO2 with an Ag/AgBr semiconductor and graphene using the deposition–precipitation method. The Ag-AgBr and graphene reduce the bandgap of AATG, thereby enhancing the visible light utilization and widening the light-response range of the composite material. Simultaneously, the addition of graphene enhances the surface adsorption effect [18], as well as the effective separation of photoelectrons and holes, leading to a significant enhancement of the photocatalytic activity of TiO2.
As is well-known, the construction of heterogeneous junctions can effectively promote the transfer of photo-generated charges and suppress the recombination of photo-generated electrons and holes in photocatalytic reactions [19,20,21]. Currently, there are many reports on the construction of noble metal/spinel heterojunctions [22] and noble metal/perovskite heterojunctions. For example, Wang et al. [23] constructed noble metal/spinel heterojunctions with Au and Co3O4, which have multiple bandgaps, expanding the light-response range and exhibiting a clear surface plasmon resonance (SPR) peak. SPR generates additional photo-generated electrons, thereby hindering the recombination rate of electron–hole pairs and improving photocatalytic performance. Cho et al. [24] synthesized the noble metal/perovskite heterojunction of Rh and SrTiO3, reducing the consumption of CB electrons by protons and other intermediate products, and improving the overall dual photocatalytic activity. However, there are few reports on spinel/perovskite heterojunctions.
In this study, we used zinc ferrite with a spinel structure and strontium barium titanate with a perovskite structure to form heterojunctions. By regulating the ratio of the two to form a good, solid solution structure, the efficiency of electron–hole separation was enhanced, and the photocatalytic activity of PAM degradation was increased. Furthermore, Ag nanoparticles with a better ability to transfer electrons were introduced on the surface of the composite material. The loading of Ag nanoparticles improves the efficiency of electron–hole separation, reduces the bandgap width, and the energy required for electron transition reactions, and further enhances photocatalytic activity.
2. Results
2.1. Phase Structure Analysis of ZnFe2O4/Ba0.7Sr0.3TiO3
Figure 1 shows the XRD diffraction patterns of ZnFe2O4, Ba0.7Sr0.3TiO3, and ZnFe2O4/Ba0.7Sr0.3TiO3 with different component contents (ZFO and BST are abbreviations for ZnFe2O4 and Ba0.7Sr0.3TiO3, respectively). Characteristic diffraction peaks of Ba0.7Sr0.3TiO3 appear at 22.4°, 31.9°, 39.3°, 45.6°, 51.4°, 56.7°, 66.4°, and 75.4°, corresponding to crystal planes (100), (110), (111), (200), (210), (211), (220), and (310), respectively. Characteristic diffraction peaks of ZnFe2O4 were observed at 30°, 35.2°, 42.8°, 56.7°, and 62.2°, corresponding to crystal planes of (220), (311), (400), (511), and (440), respectively. This indicates the successful combination of ZnFe2O4 and Ba0.7Sr0.3TiO3. The characteristic peaks of ZnFe2O4/Ba0.7Sr0.3TiO3 are obvious and no impurity peaks appear, and their diffraction peaks are completely consistent with the standard XRD pattern in the standard card (card numbers ZFO PDF # 22-1012, BST PDF # 44-0093), indicating that the synthesized ZnFe2O4/Ba0.7Sr0.3TiO3 composite material has high purity. As the proportion of the ZnFe2O4 component increases, the positions and configurations of each diffraction peak on the XRD spectrum are consistent, indicating that changes in the composition of the composite material will not affect its crystal structure. Meanwhile, comparing the XRD diffraction patterns of ZnFe2O4, Ba0.7Sr0.3TiO3, and ZnFe2O4/Ba0.7Sr0.3TiO3 samples, it was found that the XRD diffraction peak widths of the samples after the composition with Ba0.7Sr0.3TiO3 narrowed, indicating that the grain size of the samples after the composition was larger than before the composition. In addition, Figures S1 and S2 show the physical and chemical properties of pure ZnFe2O4 and Ba0.7Sr0.3TiO3, respectively. From Figure S1a, it can be observed that the morphology of the ZnFe2O4 sample exhibits an irregular layered shape, with an unsmooth surface and particle sizes ranging from 10 to 30 μm, and Figure S1b further demonstrates the obvious pore structure inside the material, which is conducive to the increase of active sites. The average grain size of pure-phase ZnFe2O4 particles calculated by combining Figure S1c and Scheler’s formula is 19.9 nm, with a lattice constant of 8.440 Å, which is slightly smaller than the standard 8.443 Å [25]; this is due to the redistribution of Zn2+ and Fe3+ at tetrahedral and octahedral positions when the particle size decreases to the nanoscale. The infrared spectrum (Figure S1d) shows that the absorption peaks at 3452.34 cm−1 and 1635.52 cm−1 belong to the O–H stretching and bending vibration peaks in the surface water of ZnFe2O4, while 541.96 cm−1 and 420.45 cm−1 represent the stretching vibration of Zn–O bonds in tetrahedral positions and Fe–O bonds in octahedral positions in ZnFe2O4 [25]. In addition, the photoluminescence spectrum (PL spectrum) of ZnFe2O4 was tested using an excitation wavelength of 259 nm (Figure S1e), and it was found that the emission center of the ZnFe2O4 sample was concentrated around 468 nm, indicating a high PL intensity of ZnFe2O4, and the electron–hole pair recombination efficiency of the ZnFe2O4 sample is high, which is not conducive to the separation of electron–hole pairs. Figure S1f shows that the nitrogen adsorption–desorption isotherm type of ZnFe2O4 is type IV, with an H3-type hysteresis loop, originating from the mesoporous structure of material stacking [26]. Its pore size is concentrated at 13.52 nm (Figure S1g), and its specific surface area is 17.97 m2·g−1. From Figure S2a,b, it can be observed that the morphology of Ba0.7Sr0.3TiO3 consists of spherical nanoparticles, with an obvious agglomeration phenomenon. Small grains easily adhere to each other to form larger particles, which may affect photocatalytic activity. The average grain size of pure-phase Ba0.7Sr0.3TiO3 particles was calculated to be 6.3 nm, based on Figure S2c and Scheler’s formula. The infrared spectrum (Figure S2d) shows that 547.74 cm−1 and 435.88 cm−1 are the tensile vibrations of the Ti–O and Ba–O bonds [27], respectively. The photoluminescence spectrum (Figure S2e) shows that the emission center of the Ba0.7Sr0.3TiO3 sample is concentrated at around 470 nm. The Ba0.7Sr0.3TiO3 sample exhibited a lower PL intensity compared with ZnFe2O4, indicating a lower recombination efficiency of electron–hole pairs. This suggests that the separation of electron–hole pairs will be facilitated in the Ba0.7Sr0.3TiO3 sample.
The ZnFe2O4/Ba0.7Sr0.3TiO3 composite material prepared by the sol–gel method was analyzed for functional group changes before and after calcination at 1100 °C using infrared absorption spectroscopy, as shown in Figure 2. After the calcination treatment, the C-H, C=O, and C–O–Ti bonds in the dried gel disappeared, indicating the decomposition of carbonates after the heat treatment. Figure S3 shows the infrared spectra of ZnFe2O4/Ba0.7Sr0.3TiO3 with different compositions of ZnFe2O4. By comparison, there is no significant difference in the infrared spectra of ZnFe2O4/Ba0.7Sr0.3TiO3 with different compositions. Figure S4 displays the TEM image of ZnFe2O4/Ba0.7Sr0.3TiO3 (ZFO wt% = 31), where the interplanar spacing corresponding to the (220) crystal plane of ZnFe2O4 is 0.168 nm, and the interplanar spacing corresponding to the (210) crystal plane of Ba0.7Sr0.3TiO3 is 0.285 nm.
Figure 3 shows the EDS spectra of ZnFe2O4/Ba0.7Sr0.3TiO3 (ZFO wt% = 31), indicating the presence of Ti, Fe, Zn, Sr, Ba, and O elements in the sample. Ba has the highest elemental concentration, followed by Fe and Ti elements, and the distribution of elements in the grains is relatively uniform [28].
The heat treatment process of ZnFe2O4/Ba0.7Sr0.3TiO3 (ZFO wt% = 31) dry gel involves the volatilization of crystal water, the combustion of organic matter, the decomposition of chelates, the crystallization of perovskite-phase BST, and the growth of grains, which are accompanied by endothermic and exothermic phenomena. In order to further investigate the reaction mechanism of the ZnFe2O4/Ba0.7Sr0.3TiO3 composite material during the heating process, a TG-DSC analysis was conducted [29], as shown in Figure S5. The weight loss of the dried gel can be divided into three stages in the temperature range from 90 °C to 1100 °C. The first stage occurs before 200 °C and is mainly attributed to the volatilization of absorbed water and ethanol solvents. An endothermic peak is observed around 192 °C on the DSC curve, with a weight loss of approximately 3.5%. The second stage takes place between 200 °C and 500 °C, during which the organic functional groups, such as the butoxy groups in tetra-n-butyl titanate, undergo combustion, decomposition, and hydrogen bond cleavage, resulting in the evaporation of H2O and CO2 gases from the system. A significant exothermic peak occurs at around 270 °C on the DSC curve, with a weight loss of approximately 6%. The third stage occurs from 500 °C to 900 °C. In this stage, the weight of the material rapidly decreases due to the burning of organic residues in the powder of the dried gel, as well as the reaction between SrCO3 and BaCO3 with TiO2, leading to the formation of SrTiO3 and BaTiO3 and the release of CO2. The characteristics of this stage are the endothermic peaks at around 771 °C and 842 °C on the DSC curve, as well as the exothermic peak at around 860 °C, with a weight loss of approximately 7.5%.
2.2. Composition Structure and Surface State of ZnFe2O4/Ba0.7Sr0.3TiO3
Qualitative and semi-quantitative analysis of the ZnFe2O4/Ba0.7Sr0.3TiO3 with different composition ratios was performed using X-ray fluorescence spectroscopy (XRF), and the results are shown in Table S1. It can be observed that the composition ratios of ZnFe2O4/Ba0.7Sr0.3TiO3 are close to the theoretical values, which is further confirmed by X-ray diffraction (XRD) characterization, indicating the successful preparation of ZnFe2O4/Ba0.7Sr0.3TiO3 with different composition ratios.
Elemental and valence state information of ZnFe2O4/Ba0.7Sr0.3TiO3 was analyzed using X-ray photoelectron spectroscopy (XPS) [25,30]. As shown in Figure 4a, the high-resolution spectrum of Ba 3d exhibits two peaks at 794.21 eV and 779.21 eV, corresponding to the Ba 3d3/2 and Ba 3d5/2 electrons, respectively. In Figure 4b, the high-resolution spectrum of Fe 2p shows peaks at binding energies of 725.21 eV and 711.21 eV, corresponding to the Fe 2p1/2 and Fe 2p3/2 electrons, respectively. Additionally, a satellite peak of Fe 2p3/2 is observed at 720.21 eV, indicating the presence of Fe3+. In Figure 4c, the O 1s spectrum of ZnFe2O4/Ba0.7Sr0.3TiO3 consists of three oxygen components, with a peak at approximately 530.11 eV attributed to lattice oxygen, a peak at approximately 530.21 eV corresponding to oxygen vacancies, and a peak at approximately 532.45 eV corresponding to adsorbed H2O. In Figure 4d, the high-resolution spectrum of Sr 3d exhibits two peaks at 134.01 eV and 132.11 eV, corresponding to Sr 3d3/2 and Sr 3d5/2 electrons, respectively. The Ti 2p spectrum in Figure 4e consists of peaks from the Ti 2p1/2 and Ti 2p3/2 electrons, with binding energies of 463.21 eV and 457.21 eV, respectively, which are close to the reported binding energies of α-Ti in the BST perovskite structure, indicating the presence of a Ti4+ oxidation state. In Figure 4f, the peaks of Zn 2p appear at 1044.21 eV and 1021.21 eV, corresponding to the Zn 2p1/2 and Zn 2p3/2 electrons, respectively. From Figure S6, it can be observed that the Zn, Ba, Fe, Ti, Sr, and O elements are present, while the presence of carbon may be attributed to equipment contamination during the measurement.
SEM images of ZnFe2O4/Ba0.7Sr0.3TiO3 with ZFO wt% of 31 and 35 are shown in Figure 5, with the magnification indicated at the bottom of each image. Figure 5a–d represent the SEM images of ZnFe2O4/Ba0.7Sr0.3TiO3 with ZFO wt% of 31, and with ZFO wt% of 35, respectively. It can be observed that the ZnFe2O4/Ba0.7Sr0.3TiO3 samples present a flat and irregular particle shape, with a particle size ranging from 20 to 200 nm. The particle size is uneven, and some particles show an agglomeration phenomenon. The change in the proportion of ZnFe2O4 and Ba0.7Sr0.3TiO3 components has little effect on the morphology of the ZnFe2O4/Ba0.7Sr0.3TiO3 samples.
2.3. Analysis of Specific Surface Area of ZnFe2O4/Ba0.7Sr0.3TiO3
According to Table S2, the specific surface area of ZnFe2O4/Ba0.7Sr0.3TiO3 (ZFO wt% = 31) is 1.85 m2·g−1, with an average pore size of 14.55 nm. In Figure S7a, based on the IUPAC definition, the nitrogen adsorption–desorption isotherm of ZnFe2O4/Ba0.7Sr0.3TiO3 is of type IV, exhibiting a hysteresis loop of type H3, indicating that the material contains a mesoporous structure. Figure S7b represents the pore-size distribution of the sample, showing that the pore sizes mainly range from 9.45 nm to 26.72 nm, with the peak at 12.27 nm. The pore-size distribution of the sample is moderately uniform. Compared to pure ZnFe2O4, the specific surface area of the ZnFe2O4/Ba0.7Sr0.3TiO3 composite sample is reduced, primarily due to the higher sintering temperature, resulting in decreased surface roughness, which has a certain influence on the transfer efficiency of the photo-generated electron to the surface.
2.4. Analysis of Electron–Hole Pair Separation Efficiency in ZnFe2O4/Ba0.7Sr0.3TiO3
The photoluminescence (PL) spectra of ZnFe2O4/Ba0.7Sr0.3TiO3 samples can be used to qualitatively analyze the photo-generated electron and hole recombination probabilities in samples of different components [17], as shown in Figure 6. It is observed that the emission centers of different component samples are concentrated around 390 nm. With an increase in the ZFO component content, the peak of the PL spectra initially increases, then decreases, and finally increases again. Therefore, the result within this range of ZFO content is that, as the ZFO content increases, the recombination probability of electrons and holes first increases, then decreases, and finally increases again. When the ZFO wt% is 31, the recombination probability of electrons and holes is the lowest, and the separation efficiency is the highest, which is beneficial for improving photocatalytic performance. In addition, the UV-visible absorption spectrum of ZnFe2O4/Ba0.7Sr0.3TiO3 (ZFO wt% = 31) exhibits strong absorption in the visible light range [31], with the maximum absorbance occurring at a wavelength of approximately 420 nm (Figure S8a). The bandgap width of the sample is estimated to be 1.62 eV based on the Kubelka–Munk equation plot (αhv)2 -hv curve shown in Figure S8b [32].
2.5. Degradation Mechanism and Products of PAM
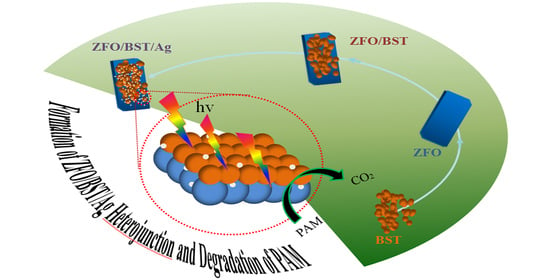
The degradation mechanism of PAM can be described as follows: •OH is the main active species for oxidative degradation of PAM. Under light conditions, the photo-generated electrons generated by ZFO-BST migrate to the surface, while Ag nanoparticles can accelerate their migration and leave photo-generated holes. This process is accompanied by the formation of •O2− and further forms •OH, which is then quickly transferred to the PAM adsorbed on the catalyst surface and destroys its chain structure and decomposes it into acrylic acid and acrylamide, which in turn degrade into CO2 and H2O [17]. The degradation product process is shown in Figure S9, and the degradation mechanism is similar to that reported in the literature [33].
3. Discussion
3.1. Study on the Photocatalytic Performance of ZnFe2O4/Ba0.7Sr0.3TiO3
ZFO exhibits a narrow bandgap (about 1.9 eV), more pores, and a larger specific surface area, making it easily excited by visible light, and a large number of photo-generated electrons and holes can be generated, while it also possesses good optical stability. However, its valence band potential is low, resulting in a poor photoelectric conversion performance [34]. The built-in electric field generated by the spontaneous polarization of BST in composite materials helps to promote the separation of photo-generated electron–hole pairs at the interface and improve visible light catalytic performance, but particles are prone to aggregation [35]. Therefore, when these two materials are used as photocatalysts alone, the improvement in their photocatalytic performance is limited.
This is the equation for degradation efficiency:
Degradation efficiency = (C0 − Ct)/C0 × 100%,
C0 and Ct are the initial concentration of PAM solution and the concentration after irradiation time, respectively.
Figure S10 shows the degradation efficiencies of pure ZFO and pure BST in the photocatalytic degradation of PAM, which is 43.67% and 33.49%, respectively. Subsequently, the degradation efficiency of ZnFe2O4/Ba0.7Sr0.3TiO3 was studied, as shown in Figure 7a. When the proportion of ZFO in the ZnFe2O4/Ba0.7Sr0.3TiO3 composite catalyst is different, the photocatalytic degradation performance of the PAM solution shows an initial increase, followed by a decrease. The photocatalytic performance of ZnFe2O4/Ba0.7Sr0.3TiO3 is best when the ZFO wt% is 31, with a degradation efficiency of 46.54% after 7 h of irradiation (Figure 7b). After being reused five times, the PAM degradation efficiency of the ZnFe2O4/Ba0.7Sr0.3TiO3 (ZFO wt% = 31) composite material can still be maintained at around 46%, which means that the composite material has a good photocatalytic cycling stability and can be reused multiple times, as shown in Figure S11. When the proportion of ZFO in the composite catalyst is low, the sample shows a slight inhibition in the photocatalytic degradation of the PAM solution. This may be due to the low ZFO content in the sample, where BST plays the dominant role. However, BST is prone to aggregation, which reduces the contact area and blocks the light source, leading to the inhibition of PAM photocatalytic degradation. When the proportion of ZFO is too high, the electron–hole recombination probability of the composite catalyst will increase, resulting in a decrease in the separation efficiency and affecting the photocatalytic activity.
3.2. Study on the Photocatalytic Performance of ZnFe2O4/Ba0.7Sr0.3TiO3/Ag
It is well-known that Ag nanoparticles have excellent electron transfer abilities, facilitating the effective separation of electrons and holes and improving the absorption and utilization of visible light by the catalyst [17,36]. Here, Ag nanoparticles are loaded onto the surface of ZnFe2O4/Ba0.7Sr0.3TiO3 (ZFO wt% = 31) by a chemical reduction method. And its crystal phase, microstructure, surface state, specific surface area, element distribution, electron hole recombination probability, and light absorption performance were characterized (Figures S12–S17). The photocatalytic performance of ZnFe2O4/Ba0.7Sr0.3TiO3/Ag in the treatment of PAM wastewater was studied, and the influencing factors of photocatalytic degradation of PAM were explored. Figure S12 shows the XRD patterns of ZnFe2O4/Ba0.7Sr0.3TiO3/Ag with different Ag content. The characteristic peaks of Ag appear in all the samples, and the corresponding crystal plane is (008). Figure S13 shows the TEM images of ZnFe2O4/Ba0.7Sr0.3TiO3/Ag (Ag wt% = 4). The nanoparticles inside the dashed line are Ag nanoparticles attached to the crystal surface. The interplanar spacing corresponding to the (100) plane of Ba0.7Sr0.3TiO3 is 0.110 nm, and that of the (400) plane of ZnFe2O4 is 0.222 nm. Figure S14 shows the XPS spectrum of ZnFe2O4/Ba0.7Sr0.3TiO3/Ag, where Figure S14a–g are similar to the XPS spectrum of ZnFe2O4/Ba0.7Sr0.3TiO3, and Figure S14h is the high-resolution spectrum of Ag 3d, showing two peaks at 373.12 eV and 367.12 eV, respectively corresponding to Ag 3d3/2 and Ag 3d5/2 electrons. Table S3 shows that the specific surface area of ZnFe2O4/Ba0.7Sr0.3TiO3/Ag is 2.59 m2·g−1, and the average pore size is 14.65 nm, which is higher than that before loading Ag, resulting in an increase in the active sites of the composite material, which will help enhance photocatalytic activity. Figure S15 shows the EDS spectrum of ZnFe2O4/Ba0.7Sr0.3TiO3/Ag (Ag wt% = 4), confirming the presence of Ag in the sample. As shown in Figure S16, the emission centers of different component samples are concentrated around 470 nm. When the Ag content changes, the efficiency of electron and hole separation will be inhibited if the Ag content is too low or too high. However, when the Ag content is between 2% and 6%, the variation in Ag content has little effect on the efficiency of electron and hole separation. Figure S17 shows that the bandgap width of ZnFe2O4/Ba0.7Sr0.3TiO3/Ag (Ag wt% = 4) is 1.60 eV, which is narrower than that of ZnFe2O4/Ba0.7Sr0.3TiO3 (1.62 eV). This means that less energy is required for electron transition, which will be beneficial for improving catalytic activity. By comparing Figures S17 and S18, it was found that the two catalysts mainly absorb light with wavelengths above 350 nm, thereby achieving photocatalytic degradation.
Next, the photocatalytic performance of ZnFe2O4/Ba0.7Sr0.3TiO3/Ag and influencing factors were systematically studied. As shown in Figure 8a, the photocatalytic performance of the catalysts first increases and then decreases with the increase of Ag content. When the content of Ag is 4%, the highest degradation efficiency of photocatalytic degradation of PAM can reach 76.67% (Figure 8b). This is because, when the Ag content is too high, the excess Ag in the sample covers the active sites on the surface of ZnFe2O4/Ba0.7Sr0.3TiO3, resulting in reducing photocatalytic activity. However, when the Ag content is too low, the formation of heterojunctions between Ag and ZnFe2O4/Ba0.7Sr0.3TiO3 is limited, which is not conducive to the transfer of electrons and the separation of electron–hole pairs, resulting in low photocatalytic activity. In Figure 8c,d, the best photocatalytic degradation performance is achieved when the catalyst dosage is 50 mg. This is because the increase of the catalyst dosage accelerates the photocatalytic degradation efficiency, thereby improving the photocatalytic efficiency. However, when the catalyst dosage is too high, the transmittance of the solution decreases, leading to a decrease in photocatalytic efficiency. From Figure 8e,f, it can be observed that the initial concentration of the reaction system has a certain influence on the photocatalytic degradation performance. The best degradation efficiency (80.97%) for the photocatalytic degradation of PAM is observed when the initial mass concentration of the PAM solution is 75 mg/L. This may be due to the lower viscosity of the solution at lower concentrations, which can cause some catalysts to precipitate and weaken the degradation performance. On the other hand, when the initial concentration is higher, the overall catalytic degradation capacity is limited, resulting in a less pronounced photocatalytic degradation effect.
Figure 8g,h shows the degradation performance under different pH values. As the pH value of the PAM solution increases from acidic to alkaline, the performance of the catalyst in the photocatalytic degradation of PAM initially increases and then decreases. The catalyst exhibits a better degradation performance under acidic and neutral conditions, with optimal performance at pH 6. This is because when the pH value is low, protonation occurs on the surface of the sample and positive charges are generated on its surface, resulting in enhancing the transfer of photo-generated electrons to the sample surface. When the solution is neutral, the water molecules react with photo-generated holes to form •OH and protons. When the pH is high, OH− adsorbs on the surface of the sample and forms a negative charge, thereby increasing the efficiency of hole transfer from the inside of the particle to the surface of the particle [37]. Zete potential testing was conducted on the catalysts, and the results showed that both ZnFe2O4/Ba0.7Sr0.3TiO3 and ZnFe2O4/Ba0.7Sr0.3TiO3/Ag displayed negative surface charges, and their values were −7.22 mV and −18.29 mV, respectively. In the reaction system with the solution pH value of 6, PAM has a positive charge on its surface. Due to electrostatic attraction, PAM is more conducive to being adsorbed on the catalyst surface and accelerating the catalytic reaction process. Therefore, the optimal experimental conditions for the reaction are as follows: selecting a catalyst sample with 4 wt% Ag content, taking 50 mg of the catalyst, preparing a PAM solution with a mass concentration of 75 mg/L, and adjusting the solution pH value to 6. Under these conditions, the photocatalytic degradation performance is the best, with a degradation efficiency of 81.28%. The photocatalytic degradation scheme of ZnFe2O4/Ba0.7Sr0.3TiO3/Ag is shown in Figure S19.
4. Materials and Methods
4.1. Preparation of ZnFe2O4
Reagent A was prepared by adding 3.15 g of citric acid to 100 mL of deionized water. The solution was stirred with a magnetic stirrer until complete dissolution. Similarly, reagent B was prepared by dissolving 4.04 g of iron nitrate dihydrate and 1.48 g of zinc nitrate dihydrate in 100 mL of deionized water. The mixture was stirred with a magnetic stirrer until complete dissolution. Subsequently, reagent B was added dropwise to reagent A, with A serving as the complexing agent, while continuously stirring. The pH was then adjusted to 8 by the addition of ammonia solution. Upon heating and stirring the solution, it transformed into a viscous gel which was later removed from the drying oven after 12 h of drying at 90 °C. The resulting gel was ground into a powder. Next, the solid powder was calcined at 500 °C for 2 h, cooled to room temperature and ground to obtain ZnFe2O4 (ZFO) sample.
4.2. Preparation of Ba0.7Sr0.3TiO3
Dissolve 6.5 mL of hydrochloric acid and 150 mL of anhydrous ethanol in 30 mL of deionized water with magnetic stirring to obtain a uniform solution, designated as reagent A. Reagent B was comprised of 1.7 g of tetra-n-butyl titanate and 5 mL of anhydrous ethanol, which were mixed evenly by stirring with a magnetic stirrer. A solution containing 0.7 g of barium carbonate and 0.225 g of strontium carbonate was added to reagent B and stirred with a magnetic stirrer until a uniform mixture was obtained. The resulting mixture was subjected to 540 W ultrasonic treatment for 90 min. Reagent A was then added dropwise to the well-sonicated reagent B and stirred until a sol was formed. The addition of reagent A was stopped at this point. The sol was placed in a dark environment for 3 h to promote aging and the formation of BST gel precursors. Remove the gel precursor from the drying oven after drying at 70 °C for 9 h and grind it into a powder. Take out the sample from the muffle furnace after calcining at 1100 °C for 3 h and cooling to room temperature and grind the sample to obtain a solid powder sample of Ba0.7Sr0.3TiO3 (BST).
4.3. Preparation of ZnFe2O4/Ba0.7Sr0.3TiO3
As shown in Figure S20, the preparation process of ZnFe2O4/Ba0.7Sr0.3TiO3 composite material is as follows: A certain proportion of barium carbonate, strontium carbonate, and previously prepared different masses of zinc ferrite were added to reagent B. The mixture was stirred with a magnetic stirrer until it was thoroughly mixed. It was then subjected to 540 W ultrasonic treatment for 90 min. Reagent A was added dropwise to the well-sonicated reagent B and stirred until a sol was formed. The addition of reagent A was then stopped. The sol was placed in a dark environment for 3 h to promote aging and the formation of BST gel precursors. Remove the gel precursor from the drying oven after drying at 70 °C for 9 h and grind it into a powder. Take out the sample from the muffle furnace after calcining at 1100 °C for 3 h and cooling to room temperature and grind the sample to obtain solid powder samples of ZnFe2O4/Ba0.7Sr0.3TiO3 (ZFO-BST) with different component content ratios.
4.4. Preparation of ZnFe2O4/Ba0.7Sr0.3TiO3/Ag
Perform photocatalytic performance testing on the samples obtained in the previous step to select the sample with the best photocatalytic performance, namely (ZFO wt% = 31), and further carry out the loading of silver nanoparticles. The detailed steps are as follows: A certain amount of ZnFe2O4/Ba0.7Sr0.3TiO3 sample was dispersed in deionized water and subjected to ultrasonic treatment using 540 W for 30 min. It was then stirred with a magnetic stirrer for 25 min. A certain amount of sodium borohydride was weighed and added to deionized water. The mixture was then stirred with a magnetic stirrer until it was completely dissolved to obtain a uniform solution. Polyvinylpyrrolidone (PVP), with an average molecular weight of 1,300,000, was used as a dispersant. PVP was weighed in a ratio of mPVP/mAgNO3 = 0.5 and added to the sample solution. The mixture was stirred until it was completely dissolved. Different masses of silver nitrate were weighed and added to the sample solution, which was stirred until it was completely dissolved. The prepared sodium borohydride solution was added dropwise, and the mixture was stirred for 30 min to complete the reaction. The sample was washed three times with water using a high-speed centrifuge, dried in a drying oven at 90 °C for 12 h, and ground to obtain a solid powder sample of ZnFe2O4/Ba0.7Sr0.3TiO3/Ag.
4.5. Performance Testing of Photocatalytic Degradation of PAM
4.5.1. Evaluation of Catalytic Performance of ZnFe2O4/Ba0.7Sr0.3TiO3
For the photocatalytic performance study of ZnFe2O4/Ba0.7Sr0.3TiO3 with different component contents, use PAM as the target degradation substance. Prepare a 100 mg/L PAM aqueous solution one day in advance to simulate aged wastewater. Take 50 mg of ZnFe2O4/Ba0.7Sr0.3TiO3 samples with ZFO wt% of 15, 21, 27, 31, 35, and 39, and add them to transparent crucibles containing the PAM aqueous solution, and label them accordingly. Stir the sample solution in the dark for 30 min to mix the sample and PAM aqueous solution uniformly and reach the adsorption–desorption equilibrium state. A 300 W xenon lamp was used as the light source, and samples were taken at regular intervals of 1 h for absorbance detection through centrifugation. The solution concentration was calculated using the standard curve fitting formula, and the degradation efficiency was calculated based on the difference in concentration before and after. The total duration of the experiment was set to 7 h.
4.5.2. Evaluation of Catalytic Performance of ZnFe2O4/Ba0.7Sr0.3TiO3/Ag
The photodegradation performance of ZnFe2O4/Ba0.7Sr0.3TiO3/Ag with PAM as the target degradable substance was studied. A 100 mg/L PAM aqueous solution was prepared one day in advance for simulated wastewater aging under dark conditions. Weigh 50 mg (Ag wt% of 0.5, 2, 4, 6, 8, 10, 11) of ZnFe2O4/Ba0.7Sr0.3TiO3/Ag sample and add to the transparent crucible containing the PAM solution. The sample solution was stirred in the dark for 30 min to achieve an adsorption–desorption equilibrium state. A 300 W xenon lamp was used as the light source, and samples were taken and centrifuged every 1 h. The absorbance was measured using the turbidity method, and the concentration values were calculated using a fitted formula based on a standard curve. The degradation efficiency was calculated based on the difference in concentration before and after treatment. The total experimental duration was set to 7 h, and the results are shown in Figure 8a,b. Under the same experimental conditions (100 mg/L PAM solution, Ag wt% = 4%), samples of ZnFe2O4/Ba0.7Sr0.3TiO3/Ag with masses of 25 mg, 50 mg, 75 mg, and 100 mg were tested as catalysts, and the results are shown in Figure 8c,d. Similarly, using PAM aqueous solutions with mass concentrations of 25 mg/L, 50 mg/L, 75 mg/L, and 100 mg/L as the target degradable substances, ZnFe2O4/Ba0.7Sr0.3TiO3/Ag samples with 50 mg Ag wt% = 4% were tested as catalysts, and the results are shown in Figure 8e,f. A 75 mg/L PAM aqueous solution was selected, and 50 mg of ZnFe2O4/Ba0.7Sr0.3TiO3/Ag sample with Ag wt% = 4 was used as the catalyst. Dilute hydrochloric acid and 0.1 mol/L sodium hydroxide solution were used to adjust the pH value to 4, 5, 6, 7, 8, 9, and 10 for testing; the results are shown in Figure 8g,h.
4.6. Sample Characterization
The characterization instruments of this article are as follows: The vertical X-ray diffractometer model TD-3500 produced by Dandong Tongda Science Technology Co., Ltd., Dandong, China, the test current is 25 mA, the voltage is 35 kV, and the scanning angle ranges from 10° to 90°; model S8 TIGER X-ray fluorescence spectrometer produced by Bruker Corporation, Bremen, Germany; the FTIR-8400S Fourier transform infrared spectrometer produced by SHIMADZU, Kyoto, Japan, tested using potassium bromide (KBr) pressure plates in the wavelength range of 4000 to 400 cm−1, with a resolution of 0.85 cm−1, a coaddition number of 16, and a detector of DLATGS; the fluorescence spectrophotometer model RF-5301PC produced by SHIMADZU, Kyoto, Japan; the SUPRA55 SAPPHIRE model field-emission scanning electron microscope energy spectrometer produced by Carl Zeiss AG using surface scanning, Shanghai, China; synchronous thermal analyzer with the model of Setsy Evolution produced by Setaram, Caluire, France; KuboX1000 specific surface area and pore size analyzer produced by Beijing Bi’aode Electronic Technology Co., Ltd., Beijing, China; Thermo Fisher ESCALAB XI + X-ray photoelectron spectrometer produced by Thermo Fisher Scientific, Waltham, MA, USA, the JEM2100F transmission electron microscope produced by JEOL, Tokyo, Japan; Shimadzu 3600 model UV visible spectrophotometer produced by SHIMADZU, Kyoto, Japan.
5. Conclusions
In this study, ZnFe2O4/Ba0.7Sr0.3TiO3 heterostructures composites with different ratios were prepared using the sol–gel method, combined with a process of water bath heating, drying, and calcination. The crystal structure, morphology, surface state, photoelectric properties, and photocatalytic degradation performance of this series of heterostructure composites were systematically characterized and evaluated. It was found that the specific surface area of the ZnFe2O4/Ba0.7Sr0.3TiO3 composite material was relatively small, but it exhibited a high efficiency in electron–hole separation, a narrow bandgap, and strong absorption of visible light. When the content of ZnFe2O4 was 31%, the ZnFe2O4/Ba0.7Sr0.3TiO3 composite exhibited the lowest efficiency in electron–hole recombination, the highest separation efficiency, and achieved the highest degradation efficiency of PAM (46.54%). Subsequently, the introduction of Ag nanoparticles onto the surface of the ZnFe2O4/Ba0.7Sr0.3TiO3 composite increased the specific surface area of the sample. Subsequently, Ag was loaded onto the surface of ZnFe2O4/Ba0.7Sr0.3TiO3 and improved the experimental conditions, resulting in an increase in the specific surface area of the sample and an improvement in the efficiency of photo-generated electron migration to the surface. This led to an increase in the efficiency of electron–hole separation, a narrowing of the bandgap width, a stronger absorption of visible light, and an increase in photocatalytic activity to 81.28%. The main reason behind this improvement is that the introduction of Ag nanoparticles not only increased the number of active sites and enhanced light-absorption capacity, but also accelerated the separation of photo-generated charges. This work provides a new approach for the construction of spinel/perovskite heterogeneous composite materials and has reference significance for the application of photocatalytic degradation in the treatment of wastewater-containing polymers.
Supplementary Materials
The following supporting information can be downloaded at: https://www.mdpi.com/article/10.3390/catal13111424/s1. Figure S1. (a,b) SEM images of ZnFe2O4 samples, (c) XRD diffraction pattern, (d) FT-IR spectrum, (e) PL spectrum, (f) Nitrogen adsorption–desorption isotherm, (g) Pore-size distribution; Figure S2. (a,b) SEM images of Ba0.7Sr0.3TiO3, (c) XRD diffraction pattern, (d) FT-IR spectrum, (e) PL spectrum; Figure S3. FT-IR spectra of ZnFe2O4/Ba0.7Sr0.3TiO3 samples with different components; Figure S4. (a) TEM image and (b,c) HRTEM of ZnFe2O4/Ba0.7Sr0.3TiO3 (ZFO wt% = 31); Figure S5. TG-DSC curve of ZnFe2O4/Ba0.7Sr0.3TiO3 gel precursor (ZFO wt% = 31); Figure S6. Full XPS spectrum of ZnFe2O4/Ba0.7Sr0.3TiO3 sample (ZFO wt% = 31); Figure S7. (a) Nitrogen adsorption–desorption isotherm and (b) Pore-size distribution of ZnFe2O4/Ba0.7Sr0.3TiO3 (ZFO wt% = 31); Figure S8. (a) UV-visible absorption spectrum of ZnFe2O4/Ba0.7Sr0.3TiO3 (ZFO wt% = 31), (b) corresponding Tauc plot curve of (a); Figure S9. Speculative pathways for photocatalytic degradation of PAM; Figure S10. Photodegradation of PAM aqueous solution by ZnFe2O4 (ZFO) and Ba0.7Sr0.3TiO3 (BST); Figure S11. The recycling performance of ZnFe2O4/Ba0.7Sr0.3TiO3 (ZFO wt% = 31); Figure S12. XRD patterns of ZnFe2O4/Ba0.7Sr0.3TiO3/Ag with different Ag contents; Figure S13. (a) TEM image and (b,c) HRTEM of ZnFe2O4/Ba0.7Sr0.3TiO3/Ag (Ag wt% = 4); Figure S14. XPS spectra of ZnFe2O4/Ba0.7Sr0.3TiO3/Ag: (a) full spectrum, (b) Ba 3d, (c) O 1s, (d) Fe 2p, (e) Sr 3d, (f) Ti 2p, (g) Zn 2p and (h)Ag 3d; Figure S15. EDS spectra of ZnFe2O4/Ba0.7Sr0.3TiO3/Ag (Ag wt% = 4); Figure S16. (a) PL spectra of ZnFe2O4/Ba0.7Sr0.3TiO3/Ag with different Ag content and (b) Partial enlarged view of (a); Figure S17. (a) UV-visible absorption spectra of ZnFe2O4/Ba0.7Sr0.3TiO3 (ZFO-BST) and ZnFe2O4/Ba0.7Sr0.3TiO3/Ag (ZFO-BST-Ag, Ag wt% = 4), (b) Corresponding Tauc plot curves of (a); Figure S18. The irradiation spectrum of the xenon lamp; Figure S19. The photocatalytic degradation scheme of ZnFe2O4/Ba0.7Sr0.3TiO3/Ag; Figure S20. Preparation process diagram of ZnFe2O4/Ba0.7Sr0.3TiO3; Table S1. Comparison between XRF analysis results and theoretical values of ZnFe2O4/Ba0.7Sr0.3TiO3; Table S2. Specific surface area, pore size, and pore volume of ZnFe2O4/Ba0.7Sr0.3TiO3 (ZFO wt% = 31); Table S3. Specific surface area, pore size, and pore volume of ZnFe2O4/Ba0.7Sr0.3TiO3/Ag (Ag wt% = 4).
Author Contributions
Conceptualization: J.Q., H.W. and G.C.; methodology, validation, formal analysis and investigation: Q.Z., Y.L. and K.Y.; resources: H.W.; data curation: H.W.; writing—original draft preparation: Q.Z. and J.Q.; writing—review and editing: J.Q., H.W. and G.C.; visualization: H.W.; supervision: J.Q. and H.W.; project administration: J.Q. and H.W.; funding acquisition: J.Q. and H.W. All authors have read and agreed to the published version of the manuscript.
Funding
This work was supported by the Natural Science Foundation of China under Grant (Nos. 51972306, 21604007).
Data Availability Statement
Data is contained within the article or Supplementary Material.
Conflicts of Interest
The authors declare no conflict of interest.
References
- Hu, H.; Liu, J.F.; Li, C.Y.; Yang, S.Z.; Gu, J.D.; Mu, B.Z. Anaerobic biodegradation of partially hydrolyzed polyacrylamide in long-term methanogenic enrichment cultures from production water of oil reservoirs. Biodegradation 2018, 29, 233–243. [Google Scholar] [CrossRef]
- Zhang, D.; Wang, F.; Wang, T. Progress of research work on physical and chemical degradation of polyacrylamide. Coal Prep. Technol. 2020, 2, 1–5. [Google Scholar] [CrossRef]
- Moussa, T.; Tiu, C. Factors affecting polymer degradation in turbulent pipe flow. Chem. Eng. Sci. 1994, 49, 1681–1692. [Google Scholar] [CrossRef]
- van Wijngaarden, L. Mechanics of collapsing cavitation bubbles. Ultrason. Sonochem. 2016, 29, 524–527. [Google Scholar] [CrossRef] [PubMed]
- Vijayalakshmi, S.P.; Madras, G. Effect of temperature on the ultrasonic degradation of polyacrylamide and poly(ethylene oxide). Polym. Degrad. Stab. 2004, 84, 341–344. [Google Scholar] [CrossRef]
- Yen, H.Y.; Yang, M.H. The ultrasonic degradation of polyacrylamide solution. Polym. Test. 2003, 22, 129–131. [Google Scholar] [CrossRef]
- Tsay, D.K.; Yang, M.H.; Wang, J.H. On the thermal degradation of polysulfones IX. The early stages of thermal degradation of poly(1-butene sulfone) and poly(2-methyl-1-pentene sulfone). Polym. Degrad. Stab. 2002, 76, 251–257. [Google Scholar] [CrossRef]
- Silva, M.; Dutra, E.R.; Mano, V.; Machado, J.C. Preparation and thermal study of polymers derived from acrylamide. Polym. Degrad. Stab. 2000, 67, 491–495. [Google Scholar] [CrossRef]
- Smith, E.A.; Prues, S.L.; Oehme, F.W. Environmental degradation of polyacrylamides.1. Effects of artificial environmental conditions: Temperature, light, and pH. Ecotoxicol. Environ. Saf. 1996, 35, 121–135. [Google Scholar] [CrossRef]
- Keshipour, S.; Hadidi, M.; Gholipour, O. A Review on Hydrogen Generation by Photo-, Electro-, and Photoelectro-Catalysts Based on Chitosan, Chitin, Cellulose, and Carbon Materials Obtained from These Biopolymers. Adv. Polym. Technol. 2023, 2023, 8835940. [Google Scholar] [CrossRef]
- Vijayalakshmi, S.P.; Senapati, D.; Madras, G. Pulsed laser degradation of polyethylene oxide and polyacrylamide in aqueous solution. Polym. Degrad. Stab. 2005, 87, 521–526. [Google Scholar] [CrossRef]
- Wang, X.B.; Guan, F.W.; Huang, Z.G.; He, H.; Wang, L.; Li, K.F. Study on low temperature plasma combined with AC/Mn + TiO2-Al2O3 catalytic treatment of sewage-containing polyacrylamide. Water Sci. Technol. 2023, 87, 879–891. [Google Scholar] [CrossRef] [PubMed]
- Wang, X.B.; Feng, C.; Wang, L.; Liu, J.Q.; Jin, A.; Zhu, C.Y.; Guan, F.W.; Huang, Z.G.; He, H. Experimental study on reducing the viscosity of sewage containing PAM catalyzed by low temperature plasma synergistic AC/Mn + TiO2. Environ. Technol. 2022, 1–15. [Google Scholar] [CrossRef]
- Xiong, B.Y.; Loss, R.D.; Shields, D.; Pawlik, T.; Hochreiter, R.; Zydney, A.L.; Kumar, M. Polyacrylamide degradation and its implications in environmental systems. Npj Clean Water 2018, 1, 17. [Google Scholar] [CrossRef]
- Du, J.; Lv, C.H.; Lan, X.T.; Song, J.F.; Liu, P.L.; Chen, X.; Wang, Q.; Liu, J.M.; Guo, G.X. A review on viscosity retention of PAM solution for polymer flooding technology. Pet. Sci. Technol. 2022, 1–34. [Google Scholar] [CrossRef]
- Zhu, B.J.; Jiang, G.F.; Lv, Y.; Liu, F.; Sun, J. Photocatalytic degradation of polyacrylamide by rGO@Fe3O4/Cu2O@ZnO magnetic recyclable composites. Mater. Sci. Semicond. Process. 2021, 131, 105841. [Google Scholar] [CrossRef]
- Rong, X.S.; Qiu, F.X.; Zhang, C.; Fu, L.; Wang, Y.Y.; Yang, D.Y. Preparation of Ag-AgBr/TiO2-graphene and its visible light photocatalytic activity enhancement for the degradation of polyacrylamide. J. Alloys Compd. 2015, 639, 153–161. [Google Scholar] [CrossRef]
- Khordadpour Siahkal Mahalleh, M.; Ahour, F.; Keshipour, S. Development of copper electrochemical sensor using D-penicillamine functionalized graphene oxide modified electrode. Appl. Chem. 2023, 18, 71–90. [Google Scholar] [CrossRef]
- Jabbar, Z.H.; Graimed, B.H. Recent developments in industrial organic degradation via semiconductor heterojunctions and the parameters affecting the photocatalytic process: A review study. J. Water Process Eng. 2022, 47, 102671. [Google Scholar] [CrossRef]
- Wang, H.; Zhang, L.; Chen, Z.; Hu, J.; Li, S.; Wang, Z.; Liu, J.; Wang, X. Semiconductor heterojunction photocatalysts: Design, construction, and photocatalytic performances. Chem. Soc. Rev. 2014, 43, 5234–5244. [Google Scholar] [CrossRef]
- Naiyun, L.; Yixian, L.; Yunliang, L.; Yaxi, L.; Yuanyuan, C.; Haitao, L. Modulation of photogenerated holes for enhanced photoelectrocatalytic performance. Microstructures 2023, 3, 2023001. [Google Scholar] [CrossRef]
- Peng, C.; Jingwei, H.; Lianzhou, W. Metal-organic framework-tailored perovskite solar cells. Microstructures 2022, 2, 2022014. [Google Scholar] [CrossRef]
- Wang, S.J.; Zhang, B.P. SPR propelled visible-active photocatalysis on Au-dispersed Co3O4 films. Appl. Catal. A Gen. 2013, 467, 585–592. [Google Scholar] [CrossRef]
- Cho, Y.J.; Moon, G.H.; Kanazawa, T.; Maeda, K.; Choi, W. Selective dual-purpose photocatalysis for simultaneous H-2 evolution and mineralization of organic compounds enabled by a Cr2O3 barrier layer coated on Rh/SrTiO3. Chem. Commun. 2016, 52, 9636–9639. [Google Scholar] [CrossRef]
- Chandel, N.; Sharma, K.; Sudhaik, A.; Raizada, P.; Hosseini-Bandegharaei, A.; Thakur, V.K.; Singh, P. Magnetically separable ZnO/ZnFe2O4 and ZnO/CoFe2O4 photocatalysts supported onto nitrogen doped graphene for photocatalytic degradation of toxic dyes. Arab. J. Chem. 2020, 13, 4324–4340. [Google Scholar] [CrossRef]
- Mousavi-Salehi, S.; Keshipour, S.; Ahour, F. Gold supported on graphene oxide/silica photocatalyst for hydrogen generation from formic acid. J. Phys. Chem. Solids 2023, 176, 111239. [Google Scholar] [CrossRef]
- Tang, H.X.; Sodano, H.A. Ultra High Energy Density Nanocomposite Capacitors with Fast Discharge Using Ba0.2Sr0.8TiO3 Nanowires. Nano Lett. 2013, 13, 1373–1379. [Google Scholar] [CrossRef]
- Asghari, A.; Keshipour, S. Green and one-pot synthesis of Co(II) citrate complex nanoparticles/graphene oxide nanocomposites towards photocatalytic hydrogen evolution. Int. J. Hydrogen Energy 2023, 48, 34750–34765. [Google Scholar] [CrossRef]
- Li, M.X.; Li, B.C.; Chen, J.S.; Shen, X.Y.; Cui, S.; He, X.C.; Liu, K.R.; Han, Q. Analysis of thermal decomposition of acidified sediments in gold plants and harmless disposal of it. J. Hazard. Mater. 2022, 431, 128472. [Google Scholar] [CrossRef]
- Cigeroglu, Z.; Kazan-Kaya, E.S.; El Messaoudi, N.; Fernine, Y.; Americo-Pinheiro, J.H.P.; Jada, A. Remediation of tetracycline from aqueous solution through adsorption on g-C3N4-ZnO-BaTiO3 nanocomposite: Optimization, modeling, and theoretical calculation. J. Mol. Liq. 2023, 369, 120866. [Google Scholar] [CrossRef]
- Kar, P.; Shukla, K.; Jain, P.; Sathiyan, G.; Gupta, R.K. Semiconductor based photocatalysts for detoxification of emerging pharmaceutical pollutants from aquatic systems: A critical review. Nano Mater. Sci. 2021, 3, 25–46. [Google Scholar] [CrossRef]
- Ghorpade, S.P.; Krishna, R.H.; Melavanki, R.M.; Dubey, V.; Patil, N. Effect of Eu3+ on optical and energy bandgap of SrY2O4 nanophosphors for FED applications. Optik 2020, 208, 164533. [Google Scholar] [CrossRef]
- Zhang, L.; Liu, H.; Zhang, B. Mechanism of Enhancement Ozonation by Ultrasound for Degradation of Polyacrylamide in ASP Produced. CIESC J. 2015, 6, 2242–2247. [Google Scholar]
- Su, J.; Shang, Q.K.; Guo, T.T.; Yang, S.; Wang, X.Y.; Ma, Q.; Guan, H.Y.; Xu, F.; Tsang, S.C. Construction of heterojunction ZnFe2O4/ZnO/Ag by using ZnO and Ag nanoparticles to modify ZnFe2O4 and its photocatalytic properties under visible light. Mater. Chem. Phys. 2018, 219, 22–29. [Google Scholar] [CrossRef]
- Xu, X.; Chen, S.; Wu, Z.; Jia, Y.; Xiao, L.; Liu, Y. Strong pyro-electro-chemical coupling of Ba0.7Sr0.3TiO3@Ag pyroelectric nanoparticles for room-temperature pyrocatalysis. Nano Energy 2018, 50, 581–588. [Google Scholar] [CrossRef]
- Chen, P.; Zhang, Y.; Zhou, Y.; Dong, F. Photoelectrocatalytic carbon dioxide reduction: Fundamental, advances and challenges. Nano Mater. Sci. 2021, 3, 344–367. [Google Scholar] [CrossRef]
- Abu Tariq, M.; Faisal, M.; Saquib, M.; Muneer, M. Heterogeneous photocatalytic degradation of an anthraquinone and a triphenylmethane dye derivative in aqueous suspensions of semiconductor. Dye. Pigment. 2008, 76, 358–365. [Google Scholar] [CrossRef]
Figure 1.
XRD patterns of ZnFe2O4, Ba0.7Sr0.3TiO3, and ZnFe2O4/Ba0.7Sr0.3TiO3 with different components.
Figure 1.
XRD patterns of ZnFe2O4, Ba0.7Sr0.3TiO3, and ZnFe2O4/Ba0.7Sr0.3TiO3 with different components.

Figure 2.
FT-IR spectra of ZnFe2O4/Ba0.7Sr0.3TiO3 (ZFO wt% = 31) sample, (a) before calcination and (b) after calcinations at 1100 °C.
Figure 2.
FT-IR spectra of ZnFe2O4/Ba0.7Sr0.3TiO3 (ZFO wt% = 31) sample, (a) before calcination and (b) after calcinations at 1100 °C.

Figure 3.
EDS spectra of ZnFe2O4/Ba0.7Sr0.3TiO3 (ZFO wt% = 31).

Figure 4.
XPS spectra of ZnFe2O4/Ba0.7Sr0.3TiO3 (ZFO wt% = 31), (a) Ba 3d, (b) Fe 2p, (c) O 1s, (d) Sr 3d, (e) Ti 2p and (f) Zn 2p.
Figure 4.
XPS spectra of ZnFe2O4/Ba0.7Sr0.3TiO3 (ZFO wt% = 31), (a) Ba 3d, (b) Fe 2p, (c) O 1s, (d) Sr 3d, (e) Ti 2p and (f) Zn 2p.

Figure 5.
SEM images of ZnFe2O4/Ba0.7Sr0.3TiO3 with different compositions, (a,b) ZFO wt% = 31 and (c,d) ZFO wt% = 35.
Figure 5.
SEM images of ZnFe2O4/Ba0.7Sr0.3TiO3 with different compositions, (a,b) ZFO wt% = 31 and (c,d) ZFO wt% = 35.

Figure 6.
PL spectra of ZnFe2O4/Ba0.7Sr0.3TiO3 with different ZFO/BST ratios, (a) photoluminescence spectra; (b) partial enlarged view of (a).
Figure 6.
PL spectra of ZnFe2O4/Ba0.7Sr0.3TiO3 with different ZFO/BST ratios, (a) photoluminescence spectra; (b) partial enlarged view of (a).

Figure 7.
(a) Photodegradation of PAM aqueous solution with different components of ZnFe2O4/Ba0.7Sr0.3TiO3; (b) total degradation efficiency of different components.
Figure 7.
(a) Photodegradation of PAM aqueous solution with different components of ZnFe2O4/Ba0.7Sr0.3TiO3; (b) total degradation efficiency of different components.

Figure 8.
(a) The photocatalytic degradation performance of ZnFe2O4/Ba0.7Sr0.3TiO3/Ag catalyst with different Ag contents for PAM and (b) comparison of corresponding degradation efficiencies. (c) The photocatalytic degradation performance of ZnFe2O4/Ba0.7Sr0.3TiO3/Ag under different catalyst dosage for PAM and (d) comparison of corresponding degradation efficiencies. (e) The photocatalytic degradation performance of ZnFe2O4/Ba0.7Sr0.3TiO3/Ag catalyst under different initial concentration of PAM and (f) comparison of corresponding degradation efficiencies. (g) The photocatalytic degradation performance of ZnFe2O4/Ba0.7Sr0.3TiO3/Ag catalyst under different pH values and (h) comparison of corresponding degradation efficiencies.

Disclaimer/Publisher’s Note: The statements, opinions and data contained in all publications are solely those of the individual author(s) and contributor(s) and not of MDPI and/or the editor(s). MDPI and/or the editor(s) disclaim responsibility for any injury to people or property resulting from any ideas, methods, instructions or products referred to in the content. |
© 2023 by the authors. Licensee MDPI, Basel, Switzerland. This article is an open access article distributed under the terms and conditions of the Creative Commons Attribution (CC BY) license (https://creativecommons.org/licenses/by/4.0/).
Share and Cite
MDPI and ACS Style
Zhu, Q.; Luo, Y.; Yang, K.; Che, G.; Wang, H.; Qi, J. Construction of Spinel/Perovskite Heterojunction for Boosting Photocatalytic Performance for Polyacrylamide. Catalysts 2023, 13, 1424. https://doi.org/10.3390/catal13111424
AMA Style
Zhu Q, Luo Y, Yang K, Che G, Wang H, Qi J. Construction of Spinel/Perovskite Heterojunction for Boosting Photocatalytic Performance for Polyacrylamide. Catalysts. 2023; 13(11):1424. https://doi.org/10.3390/catal13111424
Chicago/Turabian StyleZhu, Qinghan, Yuxue Luo, Ke Yang, Guangbo Che, Haiwang Wang, and Jian Qi. 2023. "Construction of Spinel/Perovskite Heterojunction for Boosting Photocatalytic Performance for Polyacrylamide" Catalysts 13, no. 11: 1424. https://doi.org/10.3390/catal13111424
Note that from the first issue of 2016, this journal uses article numbers instead of page numbers. See further details here.