Article

PGM-Free Electrocatalytic Layer Characterization by Electrochemical Impedance Spectroscopy of an Anion Exchange Membrane Water Electrolyzer with Nafion Ionomer as the Bonding Agent

by
Artem S. Pushkarev
1,2,3,*,
Irina V. Pushkareva
1,2,3,
Stephanus P. du Preez
1 and
Dmitri G. Bessarabov
1
1
HySA Infrastructure Center of Competence, Faculty of Engineering, North-West University, Private Bag X6001, Potchefstroom Campus 2531, South Africa
2
National Research Center “Kurchatov Institute” 1, Kurchatov sq., Moscow 123182, Russia
3
National Research University “Moscow Power Engineering Institute”, 14, Krasnokazarmennaya Str., Moscow 111250, Russia
*
Author to whom correspondence should be addressed.
Catalysts 2023, 13(3), 554; https://doi.org/10.3390/catal13030554
Submission received: 24 December 2022 / Revised: 28 February 2023 / Accepted: 3 March 2023 / Published: 9 March 2023
(This article belongs to the Special Issue Electrocatalytic Hydrogen Evolution Reaction through Water Splitting)

Abstract

:
Low-cost anion exchange membrane (AEM) water electrolysis is a promising technology for producing “green” high-purity hydrogen using platinum group metal (PGM)-free catalysts. The performance of AEM electrolysis depends on the overall overvoltage, e.g., voltage losses coming from different processes in the water electrolyzer including hydrogen and oxygen evolution, non-faradaic charge transfer resistance, mass transfer limitations, and others. Due to the different relaxation times of these processes, it is possible to unravel them in the frequency domain by electrochemical impedance spectroscopy. This study relates to solving and quantifying contributions to the total polarization resistance of the AEM water electrolyzer, including ohmic and charge transfer resistances in the kinetically controlled mode. The high-frequency contribution is proposed to have non-faradaic nature, and its conceivable nature and mechanism are discussed. The characteristic frequencies of unraveled contributions are provided to be used as benchmark data for commercially available membranes and electrodes.

1. Introduction

Low-cost anion exchange membrane (AEM) water electrolysis is a rather new but promising technology for the production of high-purity hydrogen [1,2,3] using platinum group metal free (PGM-free) catalysts. It integrates the benefits of both acidic polymer electrolyte membrane (PEM) and classic alkaline electrolysis: inexpensive stack materials and platinum group metal (PGM)-free catalysts [4,5,6] and a zero-gap cell architecture, typical for PEM electrolysis [7]. The usage of alkaline solution with lower concentration (as low as 1 M KOH) could provide excellent AEM water electrolyzer performance, and KOH solution could be replaced with K2CO3 solution, allowing higher durability and lower performance [8]. Even pure water could be used to feed AEM water electrolyzer, but conductive and durable anion-exchange polymers are necessary to be used as a binder (similar to PEM water electrolysis) [9].
Although many advances have been made in the development of AEM water electrolyzer components [10], which greatly improved cell/stack performance, AEM electrolysis technology is still undergoing an initial stage of development [2]. Some advanced AEMs have already been suggested, such as AEMION™ [11], Sustanion® [12], A-201 [13], and Orion TM1 [14]. However, their performance during prolonged usage is not ensured yet, and many aspects of their operation modes (i.e., with concentrated KOH, K2CO3, or even pure water) should still be addressed [8].
The electrochemical impedance spectroscopy (EIS) approach proves to be a very effective tool that provides a non-invasive in situ measurement of the electrochemical system’s impedance [15], which is widely applied in Li-ion battery research and development [16], PEM fuel cells [17], and other uses. For instance, such general parameters of the system under study as so-called “high-frequency resistance” (HFR) and “low-frequency resistance” (LFR) [18] could be simply extracted from the EIS spectra. Together with in situ studies (e.g., polarization curves), EIS allows for unraveling processes occurring in the MEA and evaluating their yield to the overall voltage losses.
However, without further analysis, EIS shows only qualitative information about the contribution of the individual cell components to the total cell impedance [19,20]. As such, to quantify each component of the spectrum, the measured EIS spectra need to be further processed. The most common approach is a complex nonlinear least-square fit approximation to a model function represented by an equivalent circuit model (ECM) [15], which consists of electrical components, such as resistors, inductors, and capacitors, as well as generalized elements, e.g., constant phase element (CPE), Warburg, and others [21]. Faradaic reactions are described as connected in parallel combination of R/C (or R/CPE), whereas non-faradaic features, such as gas/liquid transport [22,23], catalytic layer ion conductivity [24], plasma-sprayed electrode/electrolyte feature [25], electrode–electrolyte interface resistance [26], and others could be described differently using aforementioned generalized elements. Considering two half-reactions, i.e., HER and OER, even they could be ascribed to one [22,27] or two [28,29] R/CPE elements (suggesting HER and OER separately, or fast and slow OER steps if HER contribution is negligible). More in-depth understanding of water electrolyzer EIS description is necessary.
This study involves detailed EIS study of AEM water electrolysis cells based on commercially available non-noble metal catalysts and AEMION™ (Ionomr, Vancouver, BC, Canada) membrane, fed with 0.1–1.0 M KOH supporting electrolyte solution. The effect of the operational voltage, temperature, and supporting electrolyte concentration on the AEM water electrolysis in the kinetically controlled mode was evaluated using the ECM based on three R/CPE components: high-, mid-, and low-frequency arcs. Specific attention is paid to the unusual EIS feature observed in the high-frequency region. Characteristic frequencies of main EIS contributions are provided for AEM water electrolyzer based on commercially available membranes and electrodes as a benchmark.

2. Results and Discussion

2.1. MEA Characterization and Analysis

The equivalent circuit displayed in Figure 1 was used to process the EIS data to perform complex nonlinear least-square (CNLS) fitting. The circuit includes three R-CPE pairs for high-, mid-, and low-frequency range as three semicircle loops (or arcs) are basically observed in the Nyquist plots (given below). R2–R4 describes charge transfer resistance and the CPEs describe the non-ideal capacitive behavior of the respective interfaces as well as the non-uniform distribution of the catalyst’s active sites [30]. Besides these, the resistor R1 and inductor L1 are given, representing the total MEA ohmic resistance and stray inductivity [31], respectively. Important to note is that the R1 includes ohmic and ionic resistance of AEM water electrolysis cell and MEA components. The high accuracy of the fitting is proved by rather low values of reduced chi-square factor (provided by pyZw after fitting): 10−4–10−5.
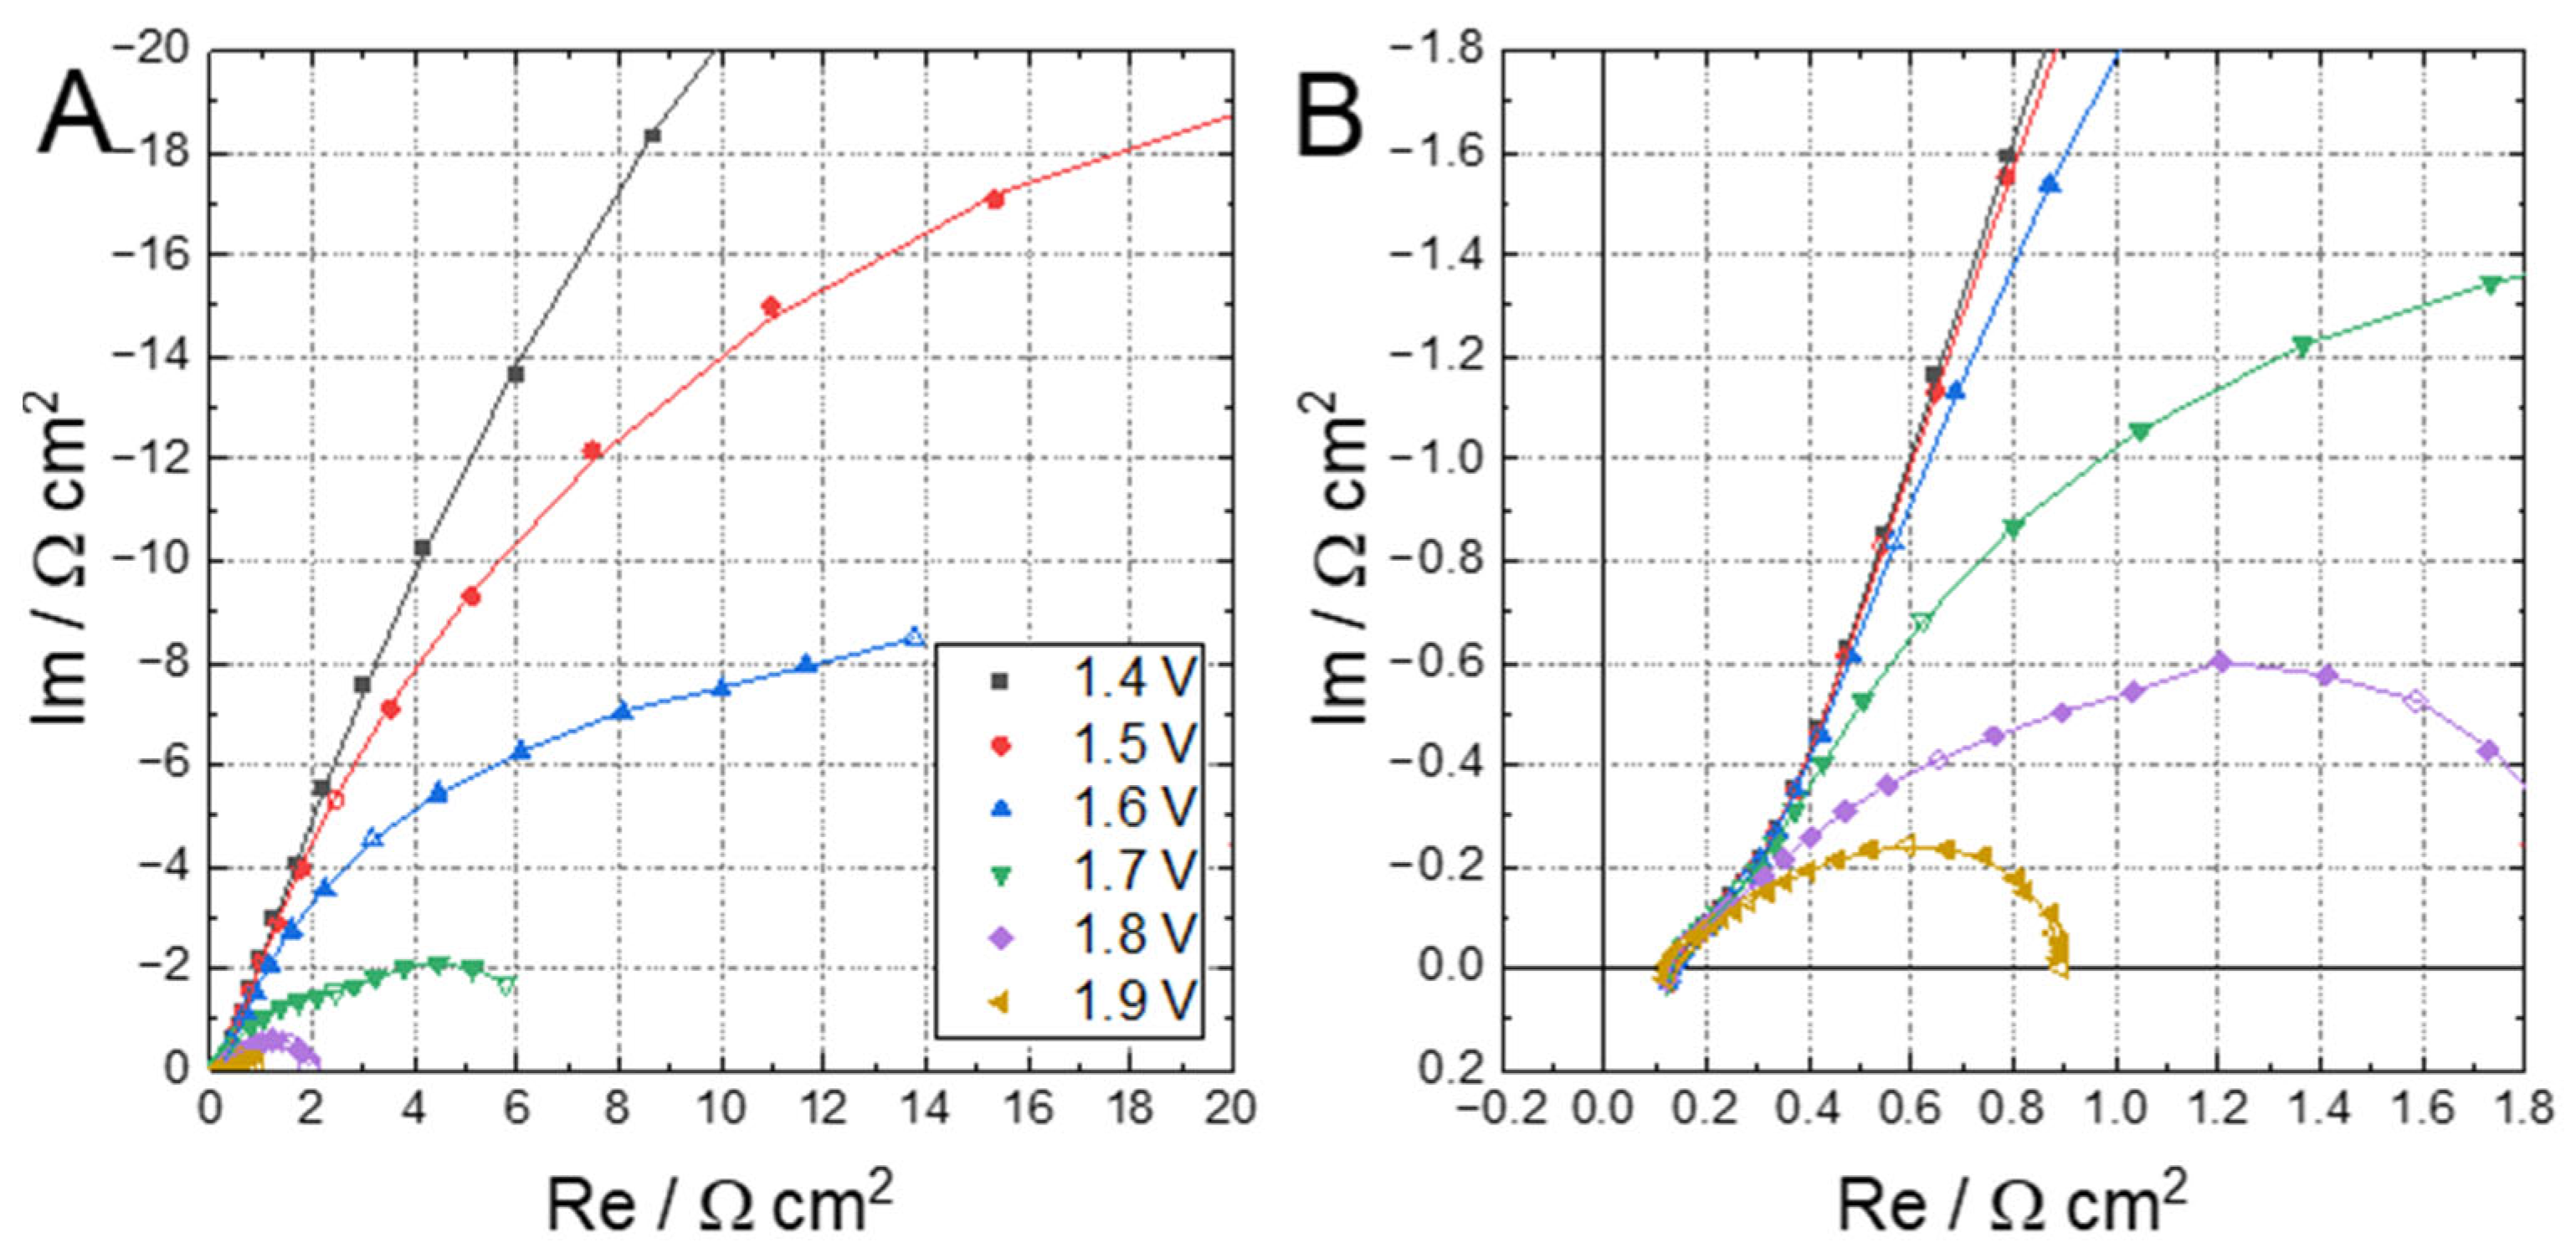
Figure 2 shows the Nyquist (or Cole–Cole) curves (Bode plots are given in Supplementary Materials in Figure S1) obtained at 50 °C and different voltage values using 1 M KOH supporting solution.
The structure of the curve and arcs in the Nyquist plot shown in Figure 2A provides insight into the MEA behavior and dominant phenomena [20,28]. The part of the curve with negative imaginary impedance consists of a few arcs, which could be related to different processes inducing the overvoltage. According to the typical water electrolyzer polarization curve [20], with the increase in current density the cell voltage increases (because of the HER and OER overvoltage increasing), suggesting a decrease in total MEA resistance. The curve intercept of the axis at high frequencies is often suggested as MEA ohmic resistance (high-frequency resistance, HFR [18,32]), though any stray impedance leads to some discrepancy in the ohmic resistance value [31].
The stray impedance appeared as a part of the curve with a positive imaginary part in the high-frequency range (~10 kHz), which is considered in the model (Figure 1) as an inductor L1 [31]. Total MEA polarization resistance is usually defined as the difference between the HFR and EIS curve axis interception at low frequencies; so-called “low-frequency resistance” [18]. However, when strong pseudo-inductive behavior [33] exists or non-faradaic processes (i.e., slow mass transfer [23]) limit the overall process, low-frequency resistance might not be determined straightforwardly. As such, the CNLS fitting with the pre-chosen model provides a more reasonable and precise value of the MEA polarization resistance as well as its ohmic resistance. According to ECM (Figure 1), the MEA ohmic resistance is denoted as R1, whereas polarization resistance components (giving the arc in total) are denoted as R2–R4 and their summary provides the overall polarization resistance. Here and below, R2–R4 will be referred to as high-, medium-, and low-frequency resistance, respectively.
In this study, the effect of current density on the MEA resistance components was studied in the kinetically controlled mode at current densities less than 0.15 A·cm−2. It is important to note that measurements were performed in potentiostatic mode at certain values of the cell voltage: 1.4–1.9 V. The polarization curve plotted with the pre-EIS stabilized currents is given in Figure S2 (Supplementary Materials), showing that even at 1.9 V the AEM electrolysis cell still operates in the kinetically controlled mode because non-noble metal catalysts with high activation energy are used. Figure 2A further shows that with an increase in voltage (current density), the polarization resistance of the MEA decreases, suggesting the arc relation to electrochemical reactions [28]. EIS curves measured at 1.4–1.9 V are strongly superimposed at high frequencies of 104–200 Hz, obviously suggesting low variation in stray impedance (cables inductivity), MEA ohmic resistance, and high-frequency arc R2/CPE2, which also fell into the same frequency range.
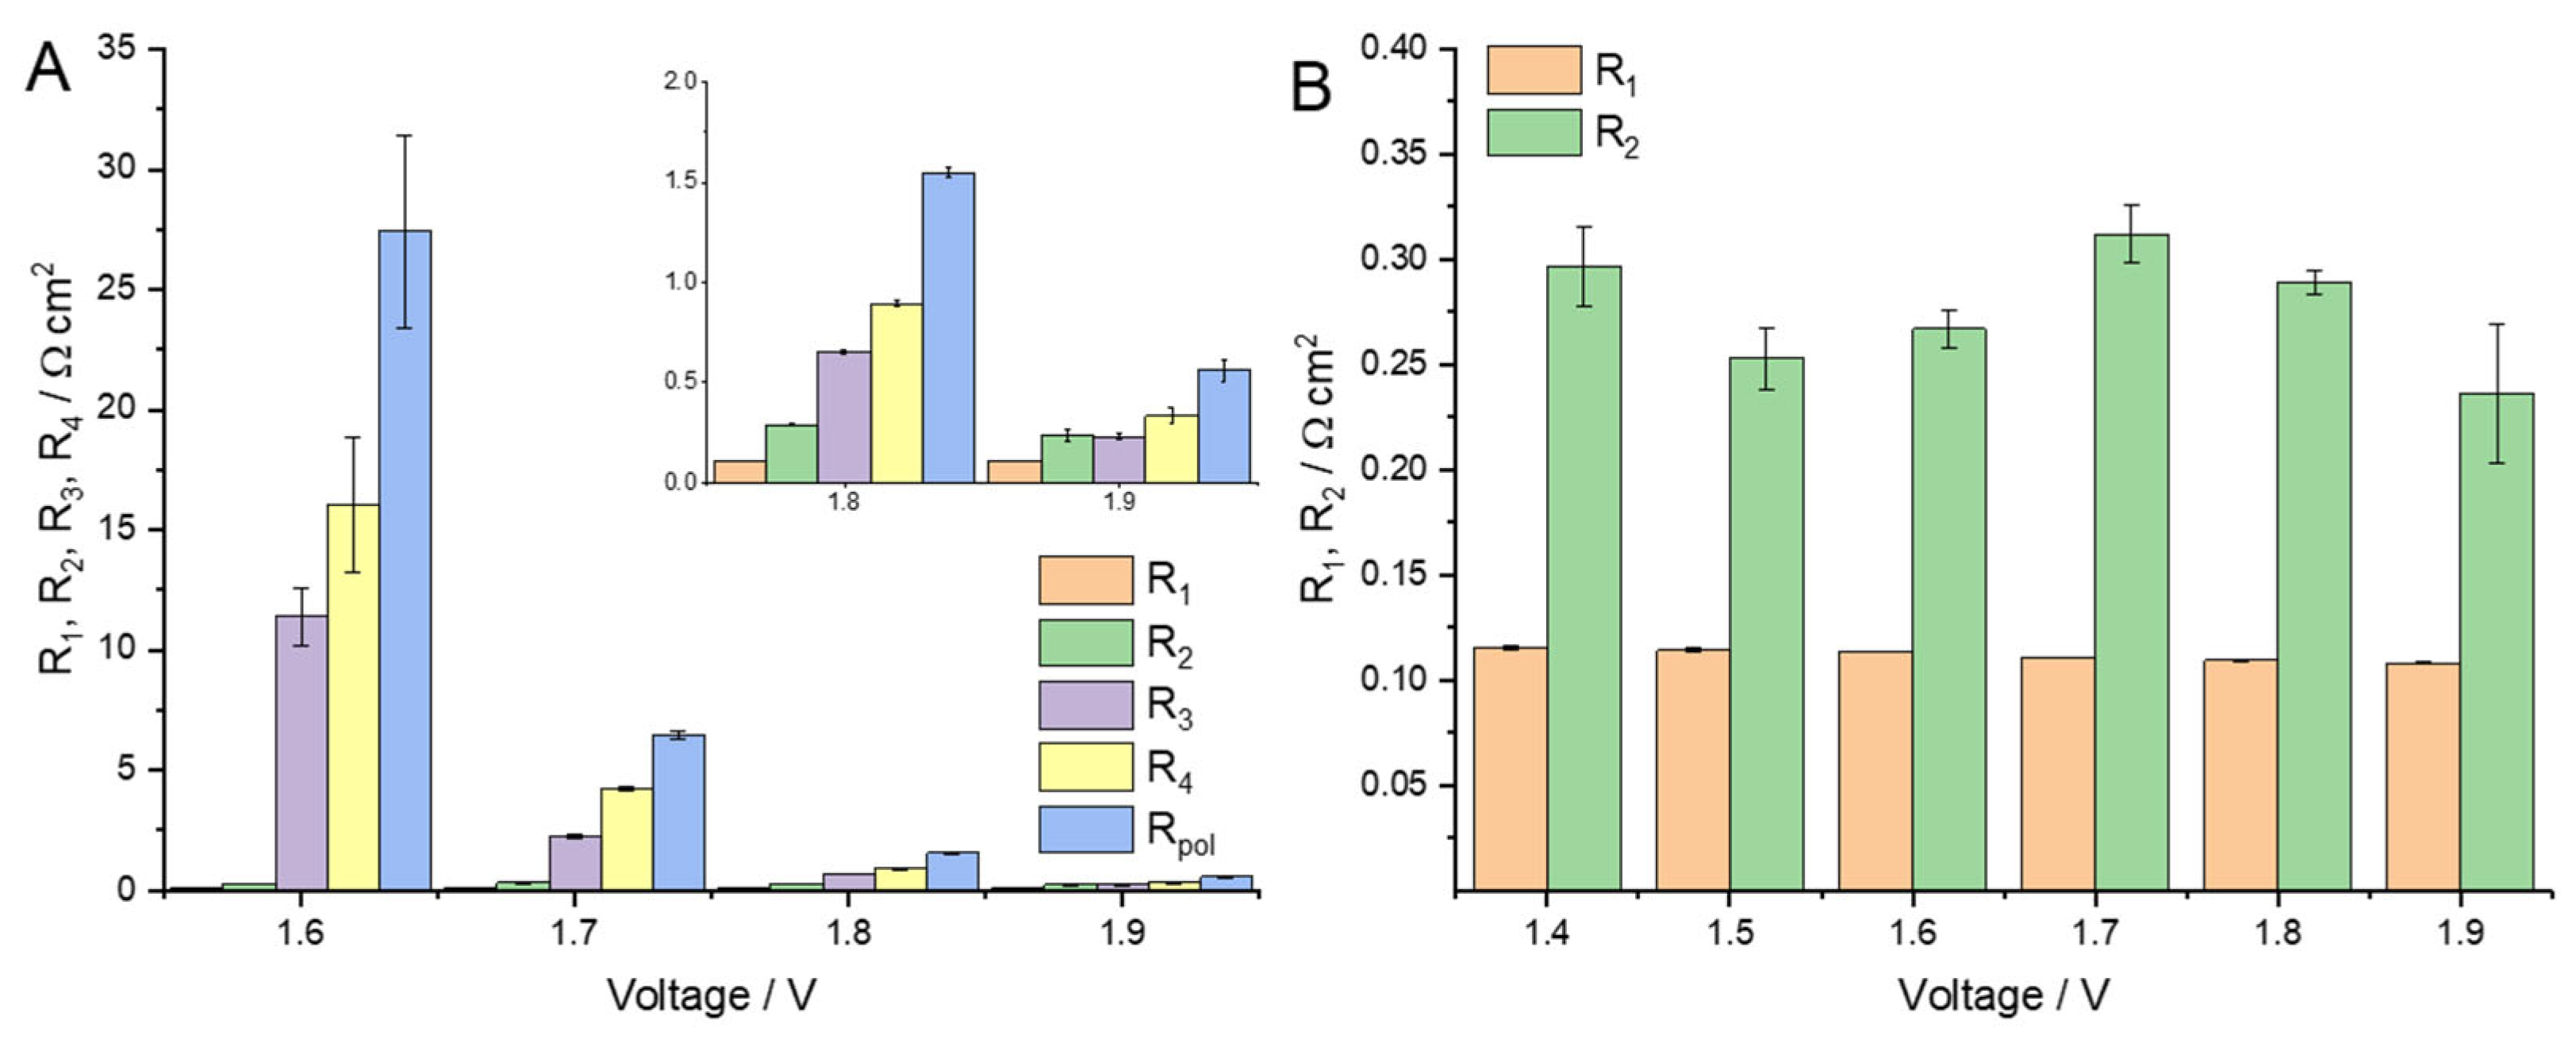
A better understanding of the MEA resistance breakdown could be obtained by comparing the R1–R4 values. The fitted values for R1–R4 are given in Figure 3A to show their change with the voltage (current density) increase. The R3 and R4 values depend mainly on the voltage, suggesting that R3/CPE3 and R4/CPE4 circuit elements are related to faradaic processes—HER and OER. Thus, CPE3 and CPE4 are related to the double-layer capacitance, whereas R3 and R4 are identified with the overall rate of the respective electrochemical reactions and incorporate the charge transfer resistances of different reaction steps [34]. It is important to note that the full MEA resistance breakdown is given only for voltages ≥1.6 V as the R3 and R4 fitting provides extremely high variation, i.e., R4/CPE4 arc is located mainly outside the chosen frequency range at voltages as low as 1.4–1.5 V.
The MEA ohmic resistance R1 is rather independent of the cell voltage, which is mainly described by the usage of 1 M KOH supporting electrolyte with a constant flow rate which ensures full humidification [35] and high conductivity of the membrane—the main contributor to the MEA ohmic resistance [32]. Relatively low current density prevents the test cell from overheating significantly and subsequent decrease in ohmic resistance, which usually causes the ohmic resistance to decrease with a current density increase in PEM water electrolyzers [36]. R1 varies in the range of 0.108–0.115 Ω cm−2, which is in line with other reports for MEAs equipped with AEMION membrane [26,31].
The process with the lowest characteristic frequency (highest time constant, R4/CPE4) is usually suggested to be the OER [20,37]. Transport limitations occurring in porous electrodes due to the trapped bubbles [23,38] are often suggested as the slowest process. However, the chosen voltage range is within the Tafel region with low current densities at which transport losses could be assumed as negligible [39]. Though HER is much faster than OER (up to three orders of magnitude [40]) and is normally invisible in the EIS spectrum of PEM water electrolyzer, the HER reaction has a significant contribution to the charge transfer resistance in alkaline systems [25,41]. Moreover, in this study, HER and OER rates might not differ significantly as the non-noble NiFe-based catalysts are used in this study [22], and the individual performance of purchased electrodes has not been evaluated. NiFe-based catalysts have demonstrated quite close values of overvoltage in HER and OER at 10 mA cm−2 [42], suggesting comparable values of charge transfer. It is important to note that similar anode and cathode catalysts (NiFeOx and NiFeCo, respectively) have been used in [28], and the difference in the obtained values of HER and OER charge transfer resistance is minor.
The origin of high-frequency resistance is not clear, though its low dependence on voltage (current density) suggests non-faradaic nature. The temperature effect on the MEA resistance components could be evaluated using the Arrhenius plots using the EIS data. The activation energies of certain processes could be calculated by the following Equation (1) [43]:
log ( 1 R i ) = ( E a , i 2.303   R g ) ( 1 T ) + log A
where Ri is the MEA resistance component, Ω; Rg is gas constant, 8.31 J mol−1 K−1; T is temperature, K; and A is frequency factor. The activation energy (J mol−1) corresponds to the slope of the linear fitting line multiplied by 2.303 Rg. The change in R1–R4 with temperature is shown in Figure 4A, whereas the calculated Arrhenius plots are given in Figure 4B.
Figure 4A shows that the ohmic resistance R1 and faradaic components R3–R4 show typical Arrhenius-like behavior. R1 decreases with increasing temperature, which is associated with an increase in the conductivity of the KOH solution and AEM [44], so R1 gradually decreases with the apparent activation energy value of 9.42 ± 0.04 kJ mol−1. The obtained value is close to those of different AEMs measured in fully hydroxide-exchanged state [45] and almost similar to the fully hydrated Nafion 212 protonic conductivity [45]. Higher apparent OH transport activation energy (~15 kJ mol−1) could be obtained using the data from [25], related to the MEA based on AF1-HNN8-50 Aemion™ (50 μm in a dry state) AEM and FAA-3 Fumion™ ionomer in catalytic layers. Measurements were performed in 1 M KOH; however, the HFR value is taken as MEA ohmic resistance without any stray impedance corrections. The MEA ohmic resistance values from [25] are ca. 0.095, 0.112, and 0.135 Ω cm2 measured at 60, 50, and 40 °C, respectively, and are in good agreement with the values obtained in this work (Figure 4A).
The R3–R4 components show rather similar values of Ea of ca. 45 kJ mol−1, which is in good agreement with data provided in [46] (ca. 50.2 kJ mol−1) for the full MEA and measured using 1 M KOH supporting electrolyte at 1.6 V in the absence of transport limitations. The comparison is rather reasonable, as we consider that the overall water-splitting process is governed by the slowest reaction, either HER or OER. On the other hand, in [47], the activation energy of the MEA equipped with Fumapem® FAA-3–50, NiFe cathode, and Ni anode was ca. 19–21 kJ mol−1 for operating potentials of 1.9–2.1 V.
The high-frequency component R2 behaves unusually, giving the negative activation energy value (Figure 4B). Considering the high variation of R2 values and relatively thin voltage range, getting an accurate activation energy value is not straightforward. Rather weak dependence of the high-frequency impedance on the temperature is suggested.
The effect of the KOH supporting solution concentration on the AEM water electrolyzer EIS spectra was studied as well. A relatively high KOH concentration (up to 1 M KOH) is preferable for AEM water electrolysis due to significant improvement in HER and OER kinetics [48], higher OH ion mobility, and membrane conductivity [49]. The EIS curves measured at 1.4 V and 60 °C for 0.1 M, 0.5 M, and 1 M KOH supporting solutions and comparison of R1 and R2 values are given in Figure 5. Both R1 and R2 increased to 0.216 and 2.25 Ω cm2 as the supporting electrolyte concentration decreased. For the observed increase in the R1 value, lower OH ion mobility in catalytic layers and the membrane is suggested [44,49]. Regarding the R2, its strong dependency on the supporting electrolyte is reported, so its relation to the OH transfer is proposed.
After the EIS fitting, the time constants (τi) and characteristic frequencies (fi) values for each R/CPE component could be calculated. First, as the CPE elements are used instead of capacitors, the capacitance values should be obtained by Equation (2) [50]:
C i = [ Q i · R i 1 α ] 1 / α
The single RC(RQ)-element is designated by a time constant and can be obtained according to Equation (3):
τ i = R i · C i
The time constant could be converted to the characteristic frequency Equation (4):
f i = 1 2 · π · τ i
Therefore, arcs observed in the Nyquist plots (Figure 5A) could be described by a time constant/characteristic frequency, providing the possibility to identify certain arcs in the EIS data and to compare the AEMWE performance evaluated in different laboratories.
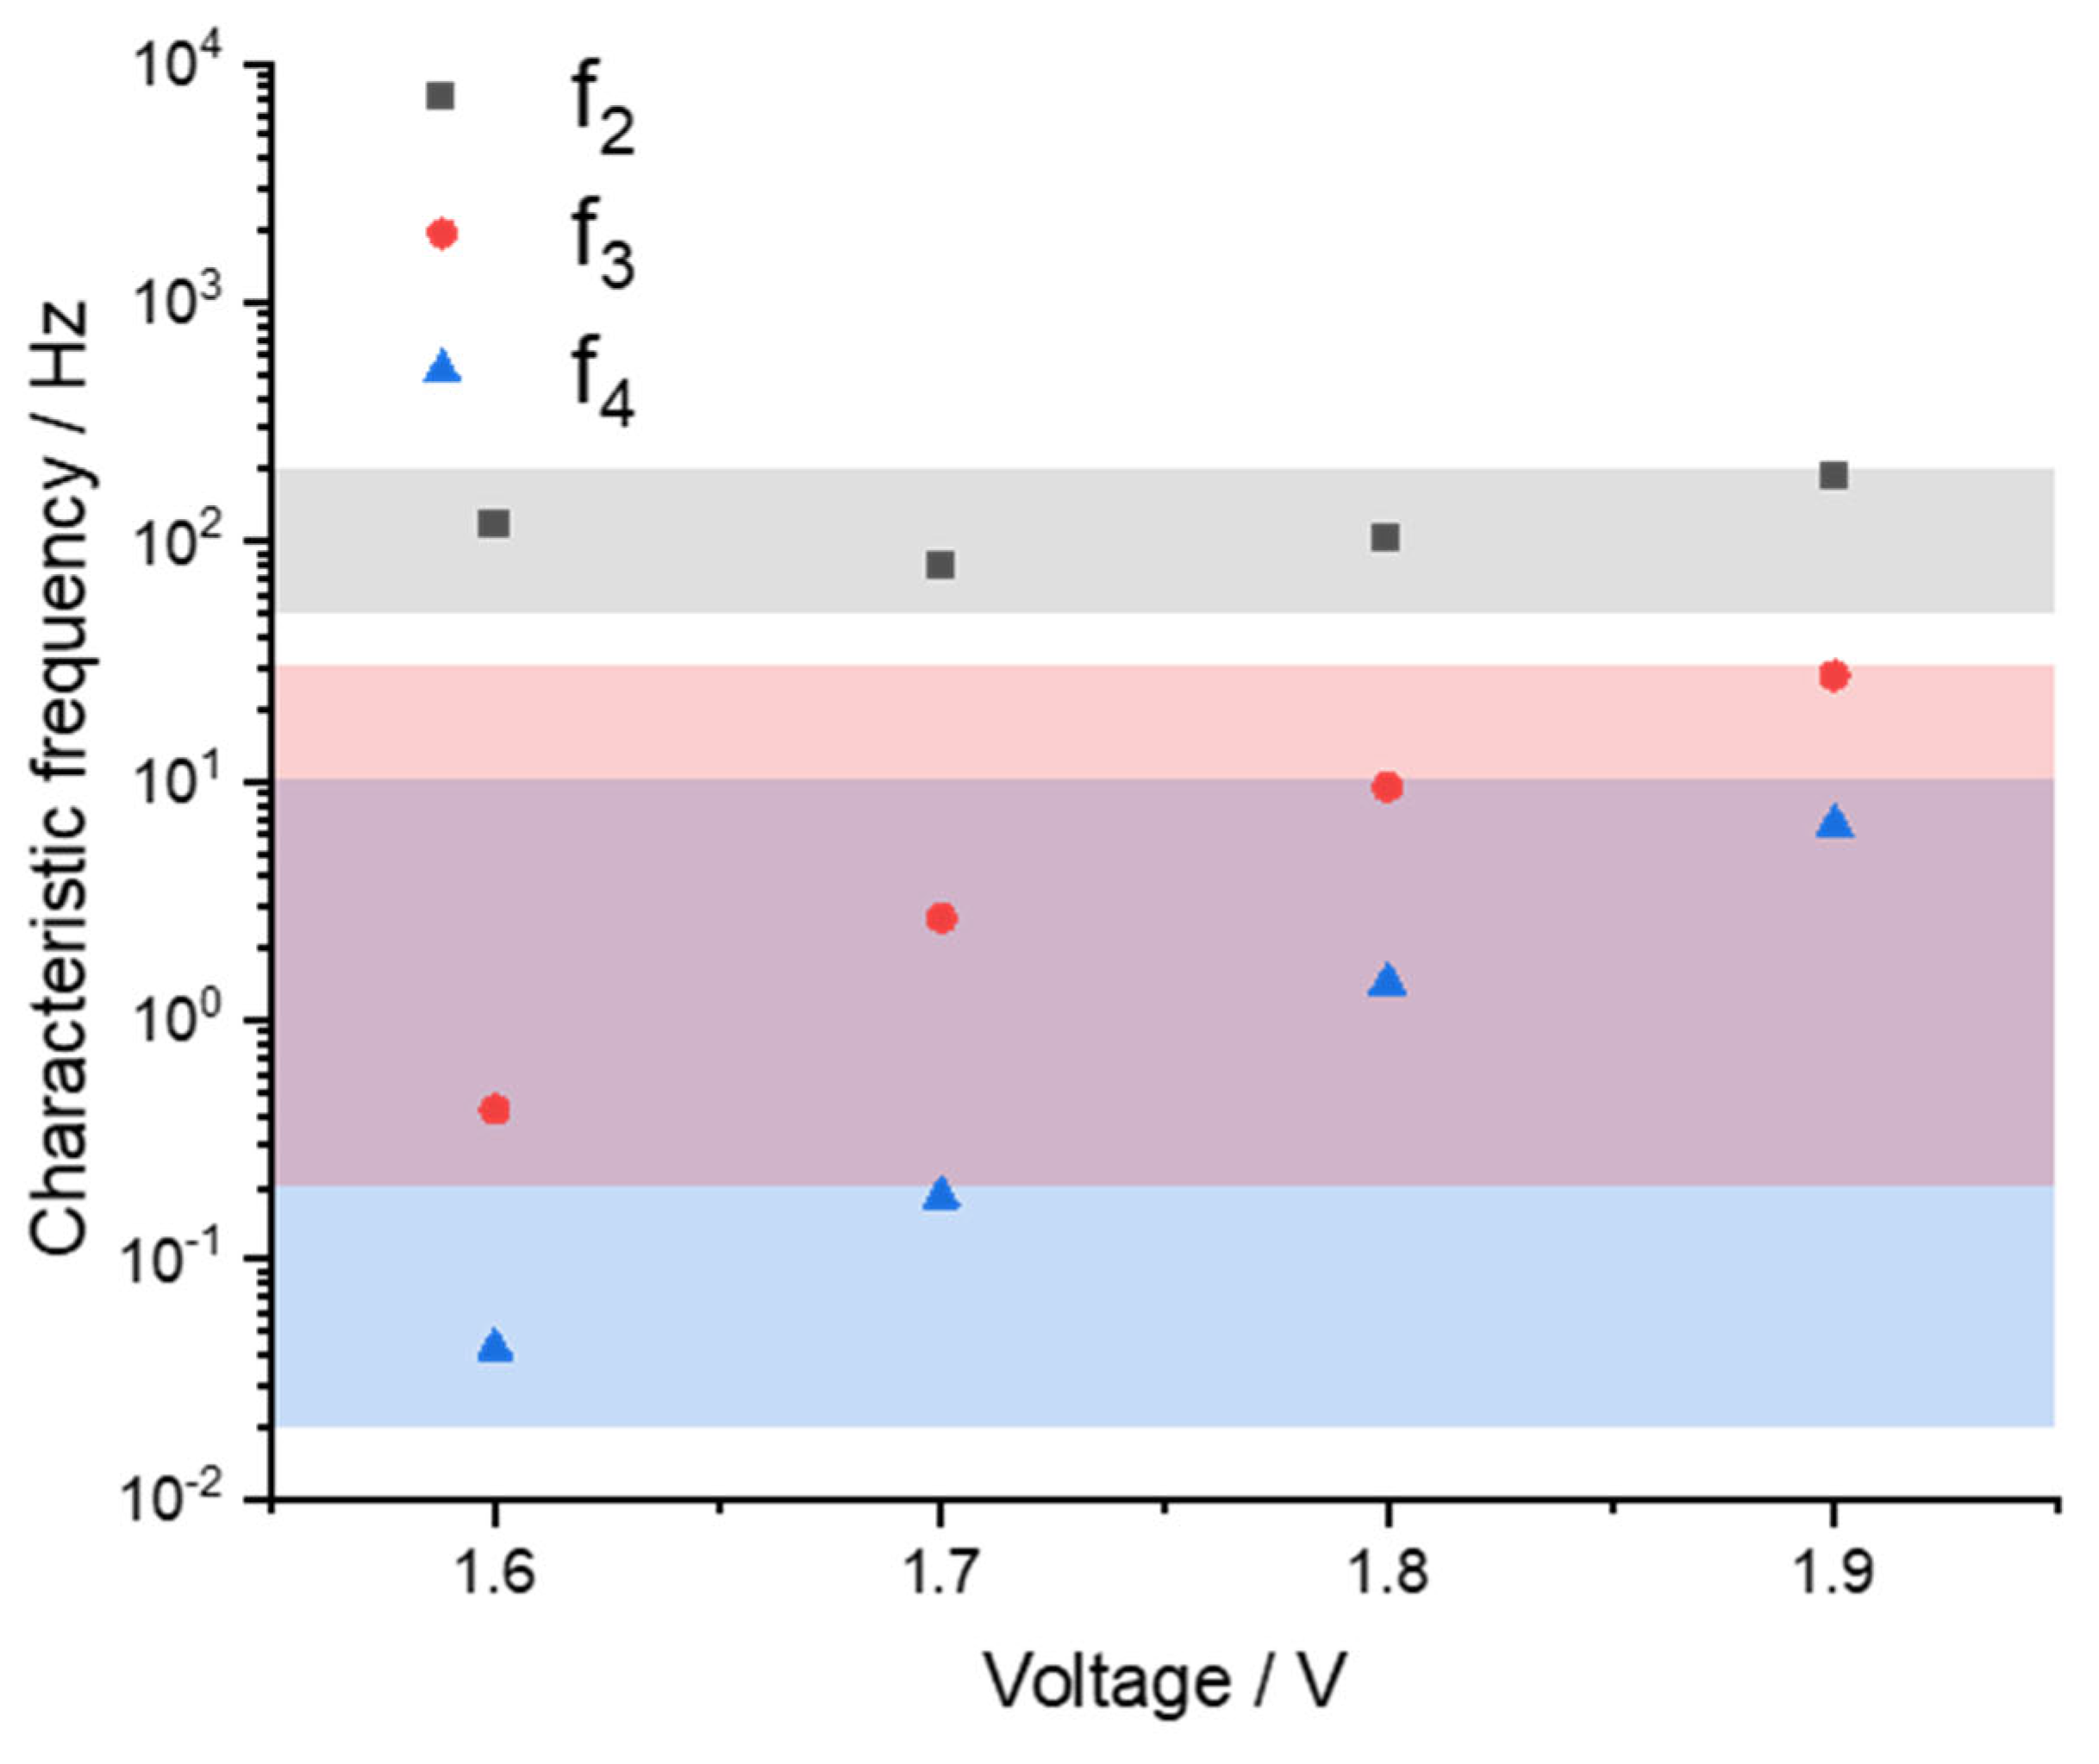
Characteristic frequencies related to the high-, mid-, and low-frequency arcs were calculated for a voltage range of 1.6–1.9 V (50 °C, 1 M KOH). The characteristic frequency values of each arc (represented as an RQ-element) fall within a certain frequency range, i.e., 50–200, 0.2–30, 0.02–10 Hz for the high–, mid–, and low–frequency processes. According to Figure 6, the characteristic frequencies of mid– and low–frequency arc increase with increasing the cell voltage (current density), agreeing with the HER and OER rates increase. The temperature variation induces a relatively small variation of fi values, so this variation is considered in Figure 6 (filled areas). On the contrary, the f2 is almost independent of the cell voltage, which is in good agreement with the data shown in Figure 3. The concept of characteristic frequencies is widely used to analyze and describe the EIS data in PEM fuel cells [51], PEM water electrolysis [34] (time constants are provided instead of characteristic frequencies), batteries [52,53], and others, whereas very limited data on AEM water electrolyzers are available. For instance, Fortin et al. [54] suggested from one to two arcs in their Nyquist plot measured for AEMWE at 0.72 A cm−2 (1.7–1.8 V) with the apex frequencies of ca. 100 and 5–7 Hz (these values were obtained not as a result of modelling but as top frequencies on the graph, which may be inaccurate). Such a high characteristic frequency value could be ascribed to the rather high performance due to the usage of noble HER and OER catalysts.
It is important to note that certain values of time constants and characteristic frequencies strongly depend on the MEA components and operational conditions (e.g., supporting electrolyte type/concentration/flow rate, current density, and temperature). If comparable operational conditions are repeated, the data presented here could assist to identify the EIS arc origins. The characteristic frequency ranges obtained in the current study (shown in Figure 6) for high-, mid-, and low-frequency arcs are related to the MEA based on commercially available materials and could be used further as a benchmark.

2.2. Discussion of the High-Frequency Arc Origin

The description of high-frequency arcs in PEM water electrolysis is controversial. It is attributed to HER kinetics [34], charge transfer processes combined with the charging of the double layer capacitance of the ionomer and oxides in the active layer (small impact of the current density on the high-frequency arc and the linear resistance behavior was observed) [55], or the first charge transfer of the two-electron process of the OER [56]. Khataee et al. [26], in their study of AEMION-based water electrolyzer with nickel-felt electrodes (without any additional catalysts), suggested the electrode–electrolyte interface, resistance which originates from the formation of a Ni (hydr)oxide layer on the anode side, observed as the high-frequency arc. Wang et al. [25] proposed the ECM with four R/CPE elements, where the high-frequency one is attributed to the roughness of the plasma-sprayed electrode. Such a high-frequency phenomenon was ascribed to the pear-shaped pore structure of obtained plasma sprayed [57] and mixed Ni-Zn powder pressed electrodes [58].
It is worth noting that the Nafion was used as the catalytic layers’ binder in our study. Recently, the usage of PFSA-based ionomers was found to be favorable for the performance of AEMWE cells due to their stability, whereas the hydroxide supply is established by the supporting electrolyte base [59,60]. The HFR values reported in [35] for AEMION-based MEAs with the binder made of similar ionomer are at least 2.5 times higher than those obtained in this study for a wide supporting electrolyte concentration range of 0.1–1.0 M KOH. As such, the Nafion is not likely to deteriorate the MEA ion conductivity due to the KOH solution circulation. Moreover, the literature reports that anion exchange ionomers lead to lower HER [61] and OER [62] performance when compared to when a Nafion ionomer binder is used.
Considering the independence of R2/CPE2 of the cell voltage, and its strong correlation with the supporting electrolyte concentration (OH– activity), we suggest the complex nature of the high-frequency arc could be related to the charge transfer on the electrode/electrolyte interface, considering its pore structure, and complicated with possible catalyst/electrode material oxidation. Moreover, the possible contribution from the Nafion-related processes is still unclear.

3. Experimental

Similar test bench and zero-gap water electrolysis cell hardware (Dioxide Materials, Boca Raton, FL, USA) as described in [44] were used in this study. Catalyst-coated porous transport layers (PTLs), namely stainless-steel fiber paper with NiFe2O4 (2 mg·cm−2) and nickel fiber paper with NiFeCo (2 mg·cm−2) as anode and cathode, respectively, were used to prepare MEA [12]. Commercially available AEMION™ (Ionomr, Vancouver, BC, Canada) membrane [44,54] was used to prepare MEAs being sandwiched between catalyst-coated PTLs during the test cell assembling. Nafion was used to stabilize catalysts on the PTLs’ surface.
Experiments were carried out at various temperatures (40, 50, and 60 °C) and concentrations of electrolyte (0.1, 0.5, and 1.0 M KOH). The electrolyte was pumped through both the anode and cathode chambers (flow rate ca. 3–5 mL·min−1) with a closed loop system. The anode and cathode output solutions of equal KOH concentration were mixed in a sealed holding tank to minimize carbonate buildup and keep constant electrolyte concentration. Two-phase flows of liquid solution and gases (O2 or H2) were released from the anode and cathode cell outlets, followed by gas separation before the solution reached the tank.
Electrochemical measurements of AEMWE MEAs including EIS were performed using an SP-150 potentiostat (BioLogic, Seyssinet-Pariset, France) in potentiostatic mode. Before recording any measurements, MEA pretreatment at a constant voltage of 2 V for a few hours was performed to ensure membrane humidification and uniform initial conditions [28,44]. To obtain the steady state conditions of the MEA at certain voltage values, the cell equilibration period of at least 900 s was included before the EIS measurement. The AC-signal amplitude of 10 mV was used in all measurements to keep the system stable and linear [15,63]. The EIS was performed in the frequency range of 20 kHz to 0.1 Hz, which covers the whole range of interest relevant to water electrolysis. EIS data were mainly processed using the open-access software pyZwx 1.0.3 [64], and LinKK [65] software was used to evaluate the quality of measured EIS data. The results of the Kramers–Kronig validity testing are in the form of the residuals between the fitting and raw data. These residuals are consistently low (less than 2%) and thus indicate valid impedance spectra in compliance with the linearity and time invariance criteria [66].

4. Conclusions

A detailed EIS study of AEM water electrolyzer based on commercially available AEMION™ membrane and non-noble catalysts was performed. This study was focused on the kinetically controlled mode at which the transport limitations are considered negligible. The effect of the operational voltage, temperature, and supporting electrolyte (KOH) concentration on the AEMWE EIS footprint was evaluated using the ECM based on three R/CPE components: high-, mid-, and low-frequency arcs. The consideration of stray inductivity L (instead of the typical approach to ignore the impedance data with a positive imaginary part) allows for accurate definition of the MEA ohmic resistance—an important contributor to MEA overvoltage, especially at high current densities. The mid- and low-frequency arcs were proved to be assigned to faradaic reactions HER and OER, though particular reactions and arcs correspondence could not be established because of the strong overlapping of their impedance footprint. The high-frequency arc is proposed to have non-faradaic nature, and some possible processes and mechanisms for this were discussed. Its origins are, however, not yet clear, and further studies are necessary. The concept of time constants/characteristic frequencies is proposed for AEM water electrolysis to provide a reasonable comparison of EIS data reported by different researchers. Moreover, some valuable reference data related to the MEA based on commercially available membranes and electrodes are provided as a benchmark.

Supplementary Materials

The supporting information can be downloaded at: https://www.mdpi.com/article/10.3390/catal13030554/s1, Figure S1: The Bode plots of AEM water electrolyzer EIS; Figure S2: Polarization curves plotted with the pre-EIS stabilized currents at different operational conditions.

Author Contributions

Conceptualization, A.S.P. and D.G.B.; methodology, A.S.P. and I.V.P.; software, A.S.P. and I.V.P.; validation, A.S.P., I.V.P., S.P.d.P. and D.G.B.; formal analysis, A.S.P., I.V.P. and S.P.d.P.; investigation, A.S.P.; resources, D.G.B.; data curation, A.S.P. and I.V.P.; writing—original draft preparation, A.S.P. and I.V.P.; writing—review and editing, A.S.P., I.V.P., D.G.B. and S.P.d.P.; visualization, A.S.P.; supervision, D.G.B.; project administration, D.G.B.; funding acquisition, A.S.P., I.V.P. and D.G.B. All authors have read and agreed to the published version of the manuscript.

Funding

This study was funded by the Department of Science and Innovation (DSI), South Africa, and HySA Infrastructure Centre of Competence, South Africa, are also gratefully acknowledged for their financial support through the KP5 program. A.S.P. and I.V.P. were financially supported by the Grant of the President of the Russian Federation (project MK-407.2021.1.3).

Data Availability Statement

Not applicable.

Conflicts of Interest

The authors declare no conflict of interest.

References

  1. Vincent, I.; Bessarabov, D. Low Cost Hydrogen Production by Anion Exchange Membrane Electrolysis: A Review. Renew. Sustain. Energy Rev. 2018, 81, 1690–1704. [Google Scholar] [CrossRef]
  2. Li, C.; Baek, J.-B. The Promise of Hydrogen Production from Alkaline Anion Exchange Membrane Electrolyzers. Nano Energy 2021, 87, 106162. [Google Scholar] [CrossRef]
  3. Miller, H.A.; Bouzek, K.; Hnat, J.; Loos, S.; Bernäcker, C.I.; Weißgärber, T.; Röntzsch, L.; Meier-Haack, J. Green Hydrogen from Anion Exchange Membrane Water Electrolysis: A Review of Recent Developments in Critical Materials and Operating Conditions. Sustain. Energy Fuels 2020, 4, 2114–2133. [Google Scholar] [CrossRef]
  4. Yang, J.; Jang, M.J.; Zeng, X.; Park, Y.S.; Lee, J.; Choi, S.M.; Yin, Y. Non-Precious Electrocatalysts for Oxygen Evolution Reaction in Anion Exchange Membrane Water Electrolysis: A Mini Review. Electrochem. Commun. 2021, 131, 107118. [Google Scholar] [CrossRef]
  5. Yu, Y.; Li, J.; Luo, J.; Kang, Z.; Jia, C.; Liu, Z.; Huang, W.; Chen, Q.; Deng, P.; Shen, Y.; et al. Mo-Decorated Cobalt Phosphide Nanoarrays as Bifunctional Electrocatalysts for Efficient Overall Water/Seawater Splitting. Mater. Today Nano 2022, 18, 100216. [Google Scholar] [CrossRef]
  6. Yu, Y.; Chen, Q.; Li, J.; Rao, P.; Li, R.; Du, Y.; Jia, C.; Huang, W.; Luo, J.; Deng, P.; et al. Progress in the Development of Heteroatom-Doped Nickel Phosphates for Electrocatalytic Water Splitting. J. Colloid Interface Sci. 2022, 607, 1091–1102. [Google Scholar] [CrossRef]
  7. Carmo, M.; Fritz, D.L.; Mergel, J.; Stolten, D. A Comprehensive Review on PEM Water Electrolysis. Int. J. Hydrogen Energy 2013, 38, 4901–4934. [Google Scholar] [CrossRef]
  8. Li, D.; Motz, A.R.; Bae, C.; Fujimoto, C.; Yang, G.; Zhang, F.-Y.; Ayers, K.E.; Kim, Y.S. Durability of Anion Exchange Membrane Water Electrolyzers. Energy Environ. Sci. 2021, 14, 3393–3419. [Google Scholar] [CrossRef]
  9. Lindquist, G.A.; Oener, S.Z.; Krivina, R.; Motz, A.R.; Keane, A.; Capuano, C.; Ayers, K.E.; Boettcher, S.W. Performance and Durability of Pure-Water-Fed Anion Exchange Membrane Electrolyzers Using Baseline Materials and Operation. ACS Appl. Mater. Interfaces 2021, 13, 51917–51924. [Google Scholar] [CrossRef]
  10. Shirvanian, P.; Loh, A.; Sluijter, S.; Li, X. Novel Components in Anion Exchange Membrane Water Electrolyzers (AEMWE’s): Status, Challenges and Future Needs. A Mini Review. Electrochem. Commun. 2021, 132, 107140. [Google Scholar] [CrossRef]
  11. Wright, A.G.; Fan, J.; Britton, B.; Weissbach, T.; Lee, H.-F.; Kitching, E.A.; Peckham, T.J.; Holdcroft, S. Hexamethyl-p-Terphenyl Poly(Benzimidazolium): A Universal Hydroxide-Conducting Polymer for Energy Conversion Devices. Energy Environ. Sci. 2016, 9, 2130–2142. [Google Scholar] [CrossRef]
  12. Liu, Z.; Sajjad, S.D.; Gao, Y.; Yang, H.; Kaczur, J.J.; Masel, R.I. The Effect of Membrane on an Alkaline Water Electrolyzer. Int. J. Hydrogen Energy 2017, 42, 29661–29665. [Google Scholar] [CrossRef]
  13. Pavel, C.C.; Cecconi, F.; Emiliani, C.; Santiccioli, S.; Scaffidi, A.; Catanorchi, S.; Comotti, M. Highly Efficient Platinum Group Metal Free Based Membrane-Electrode Assembly for Anion Exchange Membrane Water Electrolysis. Angew. Chem. Int. Ed. 2014, 53, 1378–1381. [Google Scholar] [CrossRef]
  14. Lee, W.-H.; Park, E.J.; Han, J.; Shin, D.W.; Kim, Y.S.; Bae, C. Poly(Terphenylene) Anion Exchange Membranes: The Effect of Backbone Structure on Morphology and Membrane Property. ACS Macro Lett. 2017, 6, 566–570. [Google Scholar] [CrossRef]
  15. Wang, S.; Zhang, J.; Gharbi, O.; Vivier, V.; Gao, M.; Orazem, M.E. Electrochemical Impedance Spectroscopy. Nat. Rev. Methods Prim. 2021, 1, 41. [Google Scholar] [CrossRef]
  16. Meddings, N.; Heinrich, M.; Overney, F.; Lee, J.-S.; Ruiz, V.; Napolitano, E.; Seitz, S.; Hinds, G.; Raccichini, R.; Gaberšček, M.; et al. Application of Electrochemical Impedance Spectroscopy to Commercial Li-Ion Cells: A Review. J. Power Sources 2020, 480, 228742. [Google Scholar] [CrossRef]
  17. Tang, Z.; Huang, Q.-A.; Wang, Y.-J.; Zhang, F.; Li, W.; Li, A.; Zhang, L.; Zhang, J. Recent Progress in the Use of Electrochemical Impedance Spectroscopy for the Measurement, Monitoring, Diagnosis and Optimization of Proton Exchange Membrane Fuel Cell Performance. J. Power Sources 2020, 468, 228361. [Google Scholar] [CrossRef]
  18. Suermann, M.; Bensmann, B.; Hanke-Rauschenbach, R. Degradation of Proton Exchange Membrane (PEM) Water Electrolysis Cells: Looking Beyond the Cell Voltage Increase. J. Electrochem. Soc. 2019, 166, F645–F652. [Google Scholar] [CrossRef]
  19. Ciucci, F. Modeling Electrochemical Impedance Spectroscopy. Curr. Opin. Electrochem. 2019, 13, 132–139. [Google Scholar] [CrossRef]
  20. Rozain, C.; Millet, P. Electrochemical Characterization of Polymer Electrolyte Membrane Water Electrolysis Cells. Electrochim. Acta 2014, 131, 160–167. [Google Scholar] [CrossRef]
  21. Lasia, A. Electrochemical Impedance Spectroscopy and Its Applications; Springer: New York, NY, USA, 2014. [Google Scholar] [CrossRef]
  22. Razmjooei, F.; Morawietz, T.; Taghizadeh, E.; Hadjixenophontos, E.; Mues, L.; Gerle, M.; Wood, B.D.; Harms, C.; Gago, A.S.; Ansar, S.A.; et al. Increasing the Performance of an Anion-Exchange Membrane Electrolyzer Operating in Pure Water with a Nickel-Based Microporous Layer. Joule 2021, 5, 1776–1799. [Google Scholar] [CrossRef]
  23. Dedigama, I.; Angeli, P.; Ayers, K.; Robinson, J.B.; Shearing, P.R.; Tsaoulidis, D.; Brett, D.J.L. In Situ Diagnostic Techniques for Characterisation of Polymer Electrolyte Membrane Water Electrolysers—Flow Visualisation and Electrochemical Impedance Spectroscopy. Int. J. Hydrogen Energy 2014, 39, 4468–4482. [Google Scholar] [CrossRef]
  24. Kosakian, A.; Secanell, M. Estimating Charge-Transport Properties of Fuel-Cell and Electrolyzer Catalyst Layers via Electrochemical Impedance Spectroscopy. Electrochim. Acta 2021, 367, 137521. [Google Scholar] [CrossRef]
  25. Wang, L.; Weissbach, T.; Reissner, R.; Ansar, A.; Gago, A.S.; Holdcroft, S.; Friedrich, K.A. High Performance Anion Exchange Membrane Electrolysis Using Plasma-Sprayed, Non-Precious-Metal Electrodes. ACS Appl. Energy Mater. 2019, 2, 7903–7912. [Google Scholar] [CrossRef]
  26. Khataee, A.; Shirole, A.; Jannasch, P.; Krüger, A.; Cornell, A. Anion Exchange Membrane Water Electrolysis Using AemionTM Membranes and Nickel Electrodes. J. Mater. Chem. A 2022, 10, 16061–16070. [Google Scholar] [CrossRef]
  27. Cossar, E.; Barnett, A.O.; Seland, F.; Safari, R.; Botton, G.A.; Baranova, E.A. Ionomer Content Optimization in Nickel-Iron-Based Anodes with and without Ceria for Anion Exchange Membrane Water Electrolysis. J. Power Sources 2021, 514, 230563. [Google Scholar] [CrossRef]
  28. Vincent, I.; Lee, E.-C.; Kim, H.-M. Comprehensive Impedance Investigation of Low-Cost Anion Exchange Membrane Electrolysis for Large-Scale Hydrogen Production. Sci. Rep. 2021, 11, 293. [Google Scholar] [CrossRef]
  29. Siracusano, S.; Baglio, V.; Grigoriev, S.A.A.; Merlo, L.; Fateev, V.N.N.; Aricò, A.S.S. The Influence of Iridium Chemical Oxidation State on the Performance and Durability of Oxygen Evolution Catalysts in PEM Electrolysis. J. Power Sources 2017, 366, 105–114. [Google Scholar] [CrossRef]
  30. Córdoba-Torres, P.; Mesquita, T.J.; Devos, O.; Tribollet, B.; Roche, V.; Nogueira, R.P. On the Intrinsic Coupling between Constant-Phase Element Parameters α and Q in Electrochemical Impedance Spectroscopy. Electrochim. Acta 2012, 72, 172–178. [Google Scholar] [CrossRef]
  31. Shin, E.-C.; Ahn, P.-A.; Seo, H.-H.; Jo, J.-M.; Kim, S.-D.; Woo, S.-K.; Yu, J.H.; Mizusaki, J.; Lee, J.-S. Polarization Mechanism of High Temperature Electrolysis in a Ni–YSZ/YSZ/LSM Solid Oxide Cell by Parametric Impedance Analysis. Solid State Ionics 2013, 232, 80–96. [Google Scholar] [CrossRef]
  32. Pushkarev, A.S.; Pushkareva, I.V.; Solovyev, M.A.; Prokop, M.; Bystron, T.; Rajagopalan, S.K.; Bouzek, K.; Grigoriev, S.A. On the Influence of Porous Transport Layers Parameters on the Performances of Polymer Electrolyte Membrane Water Electrolysis Cells. Electrochim. Acta 2021, 399, 139436. [Google Scholar] [CrossRef]
  33. Schiefer, A.; Heinzmann, M.; Weber, A. Inductive Low-Frequency Processes in PEMFC-Impedance Spectra. Fuel Cells 2020, 20, 499–506. [Google Scholar] [CrossRef] [Green Version]
  34. Siracusano, S.; Trocino, S.; Briguglio, N.; Baglio, V.; Aricò, A. Electrochemical Impedance Spectroscopy as a Diagnostic Tool in Polymer Electrolyte Membrane Electrolysis. Materials 2018, 11, 1368. [Google Scholar] [CrossRef] [Green Version]
  35. Koch, S.; Heizmann, P.A.; Kilian, S.K.; Britton, B.; Holdcroft, S.; Breitwieser, M.; Vierrath, S. The Effect of Ionomer Content in Catalyst Layers in Anion-Exchange Membrane Water Electrolyzers Prepared with Reinforced Membranes (Aemion+TM). J. Mater. Chem. A 2021, 9, 15744–15754. [Google Scholar] [CrossRef]
  36. Kang, Z.; Schuler, T.; Chen, Y.; Wang, M.; Zhang, F.-Y.; Bender, G. Effects of Interfacial Contact under Different Operating Conditions in Proton Exchange Membrane Water Electrolysis. Electrochim. Acta 2022, 429, 140942. [Google Scholar] [CrossRef]
  37. Sorsa, O.; Nieminen, J.; Kauranen, P.; Kallio, T. Stable Reference Electrode in Polymer Electrolyte Membrane Electrolyser for Three-Electrode Measurements. J. Electrochem. Soc. 2019, 166, F1326–F1336. [Google Scholar] [CrossRef] [Green Version]
  38. Garcia-Navarro, J.C.; Schulze, M.; Friedrich, K.A. Measuring and Modeling Mass Transport Losses in Proton Exchange Membrane Water Electrolyzers Using Electrochemical Impedance Spectroscopy. J. Power Sources 2019, 431, 189–204. [Google Scholar] [CrossRef]
  39. Suermann, M.; Takanohashi, K.; Lamibrac, A.; Schmidt, T.J.; Büchi, F.N. Influence of Operating Conditions and Material Properties on the Mass Transport Losses of Polymer Electrolyte Water Electrolysis. J. Electrochem. Soc. 2017, 164, F973–F980. [Google Scholar] [CrossRef] [Green Version]
  40. Villagra, A.; Millet, P. An Analysis of PEM Water Electrolysis Cells Operating at Elevated Current Densities. Int. J. Hydrogen Energy 2019, 44, 9708–9717. [Google Scholar] [CrossRef]
  41. Faid, A.Y.; Barnett, A.O.; Seland, F.; Sunde, S. NiCu Mixed Metal Oxide Catalyst for Alkaline Hydrogen Evolution in Anion Exchange Membrane Water Electrolysis. Electrochim. Acta 2021, 371, 137837. [Google Scholar] [CrossRef]
  42. Alobaid, A.; Wang, C.; Adomaitis, R.A. Mechanism and Kinetics of HER and OER on NiFe LDH Films in an Alkaline Electrolyte. J. Electrochem. Soc. 2018, 165, J3395–J3404. [Google Scholar] [CrossRef]
  43. Hwang, J.; Matsumoto, K.; Hagiwara, R. Symmetric Cell Electrochemical Impedance Spectroscopy of Na 2 FeP 2 O 7 Positive Electrode Material in Ionic Liquid Electrolytes. J. Phys. Chem. C 2018, 122, 26857–26864. [Google Scholar] [CrossRef] [Green Version]
  44. Pushkareva, I.V.; Pushkarev, A.S.; Grigoriev, S.A.; Modisha, P.; Bessarabov, D.G. Comparative Study of Anion Exchange Membranes for Low-Cost Water Electrolysis. Int. J. Hydrogen Energy 2020, 45, 26070–26079. [Google Scholar] [CrossRef]
  45. Khalid, H.; Najibah, M.; Park, H.S.; Bae, C.; Henkensmeier, D. Properties of Anion Exchange Membranes with a Focus on Water Electrolysis. Membranes 2022, 12, 989. [Google Scholar] [CrossRef] [PubMed]
  46. Ahn, S.H.; Lee, B.-S.; Choi, I.; Yoo, S.J.; Kim, H.-J.; Cho, E.; Henkensmeier, D.; Nam, S.W.; Kim, S.-K.; Jang, J.H. Development of a Membrane Electrode Assembly for Alkaline Water Electrolysis by Direct Electrodeposition of Nickel on Carbon Papers. Appl. Catal. B Environ. 2014, 154–155, 197–205. [Google Scholar] [CrossRef]
  47. López-Fernández, E.; Gómez-Sacedón, C.; Gil-Rostra, J.; Espinós, J.P.; González-Elipe, A.R.; Yubero, F.; de Lucas-Consuegra, A. Ionomer-Free Nickel-Iron Bimetallic Electrodes for Efficient Anion Exchange Membrane Water Electrolysis. Chem. Eng. J. 2022, 433, 133774. [Google Scholar] [CrossRef]
  48. Huang, J.; Li, P.; Chen, S. Quantitative Understanding of the Sluggish Kinetics of Hydrogen Reactions in Alkaline Media Based on a Microscopic Hamiltonian Model for the Volmer Step. J. Phys. Chem. C 2019, 123, 17325–17334. [Google Scholar] [CrossRef]
  49. Razmjooei, F.; Farooqui, A.; Reissner, R.; Gago, A.S.; Ansar, S.A.; Friedrich, K.A. Elucidating the Performance Limitations of Alkaline Electrolyte Membrane Electrolysis: Dominance of Anion Concentration in Membrane Electrode Assembly. ChemElectroChem 2020, 7, 3951–3960. [Google Scholar] [CrossRef]
  50. Hirschorn, B.; Orazem, M.E.; Tribollet, B.; Vivier, V.; Frateur, I.; Musiani, M. Determination of Effective Capacitance and Film Thickness from Constant-Phase-Element Parameters. Electrochim. Acta 2010, 55, 6218–6227. [Google Scholar] [CrossRef]
  51. Rezaei Niya, S.M.; Hoorfar, M. Study of Proton Exchange Membrane Fuel Cells Using Electrochemical Impedance Spectroscopy Technique—A Review. J. Power Sources 2013, 240, 281–293. [Google Scholar] [CrossRef]
  52. Zhou, X.; Pan, Z.; Han, X.; Lu, L.; Ouyang, M. An Easy-to-Implement Multi-Point Impedance Technique for Monitoring Aging of Lithium Ion Batteries. J. Power Sources 2019, 417, 188–192. [Google Scholar] [CrossRef]
  53. Westerhoff, U.; Kurbach, K.; Lienesch, F.; Kurrat, M. Analysis of Lithium-Ion Battery Models Based on Electrochemical Impedance Spectroscopy. Energy Technol. 2016, 4, 1620–1630. [Google Scholar] [CrossRef] [Green Version]
  54. Fortin, P.; Khoza, T.; Cao, X.; Martinsen, S.Y.; Oyarce Barnett, A.; Holdcroft, S. High-Performance Alkaline Water Electrolysis Using AemionTM Anion Exchange Membranes. J. Power Sources 2020, 451, 227814. [Google Scholar] [CrossRef]
  55. Lettenmeier, P.; Wang, R.; Abouatallah, R.; Helmly, S.; Morawietz, T.; Hiesgen, R.; Kolb, S.; Burggraf, F.; Kallo, J.; Gago, A.S.; et al. Durable Membrane Electrode Assemblies for Proton Exchange Membrane Electrolyzer Systems Operating at High Current Densities. Electrochim. Acta 2016, 210, 502–511. [Google Scholar] [CrossRef] [Green Version]
  56. Stiber, S.; Balzer, H.; Wierhake, A.; Wirkert, F.J.; Roth, J.; Rost, U.; Brodmann, M.; Lee, J.K.; Bazylak, A.; Waiblinger, W.; et al. Porous Transport Layers for Proton Exchange Membrane Electrolysis Under Extreme Conditions of Current Density, Temperature, and Pressure. Adv. Energy Mater. 2021, 11, 2100630. [Google Scholar] [CrossRef]
  57. Miousse, D.; Lasia, A.; Borck, V. Hydrogen Evolution Reaction on Ni-Al-Mo and Ni-Al Electrodes Prepared by Low Pressure Plasma Spraying. J. Appl. Electrochem. 1995, 25, 592–602. [Google Scholar] [CrossRef]
  58. Chen, L.; Lasia, A. Study of the Kinetics of Hydrogen Evolution Reaction on Nickel-Zinc Powder Electrodes. J. Electrochem. Soc. 1992, 139, 3214–3219. [Google Scholar] [CrossRef]
  59. Liu, J.; Kang, Z.; Li, D.; Pak, M.; Alia, S.M.; Fujimoto, C.; Bender, G.; Kim, Y.S.; Weber, A.Z. Elucidating the Role of Hydroxide Electrolyte on Anion-Exchange-Membrane Water Electrolyzer Performance. J. Electrochem. Soc. 2021, 168, 054522. [Google Scholar] [CrossRef]
  60. Motealleh, B.; Liu, Z.; Masel, R.I.; Sculley, J.P.; Richard Ni, Z.; Meroueh, L. Next-Generation Anion Exchange Membrane Water Electrolyzers Operating for Commercially Relevant Lifetimes. Int. J. Hydrogen Energy 2021, 46, 3379–3386. [Google Scholar] [CrossRef]
  61. Faid, A.Y.; Barnett, A.O.; Seland, F.; Sunde, S. Optimized Nickel-Cobalt and Nickel-Iron Oxide Catalysts for the Hydrogen Evolution Reaction in Alkaline Water Electrolysis. J. Electrochem. Soc. 2019, 166, F519–F533. [Google Scholar] [CrossRef] [Green Version]
  62. Faid, A.Y.; Xie, L.; Barnett, A.O.; Seland, F.; Kirk, D.; Sunde, S. Effect of Anion Exchange Ionomer Content on Electrode Performance in AEM Water Electrolysis. Int. J. Hydrogen Energy 2020, 45, 28272–28284. [Google Scholar] [CrossRef]
  63. Klotz, D.; Weber, A.; Ivers-Tiffée, E. Practical Guidelines for Reliable Electrochemical Characterization of Solid Oxide Fuel Cells. Electrochim. Acta 2017, 227, 110–126. [Google Scholar] [CrossRef]
  64. Kobayashi, K.; Suzuki, T.S. Free Analysis and Visualization Programs for Electrochemical Impedance Spectroscopy Coded in Python. Electrochemistry 2021, 89, 218–222. [Google Scholar] [CrossRef]
  65. Schönleber, M.; Klotz, D.; Ivers-Tiffée, E. A Method for Improving the Robustness of Linear Kramers-Kronig Validity Tests. Electrochim. Acta 2014, 131, 20–27. [Google Scholar] [CrossRef]
  66. Zappen, H.; Fuchs, G.; Gitis, A.; Sauer, D. In-Operando Impedance Spectroscopy and Ultrasonic Measurements during High-Temperature Abuse Experiments on Lithium-Ion Batteries. Batteries 2020, 6, 25. [Google Scholar] [CrossRef] [Green Version]
Figure 1. The equivalent circuit model (ECM) used to fit the EIS data.
Catalysts 13 00554 g001
Figure 2. The Nyquist (A) plots of AEM water electrolyzer EIS are given. Raw EIS data are given as dots. Reference EIS dots obtained at ca. 0.1, 1.0, 11, 116, 1200, and 8700 Hz are given as open symbols. The Nyquist plots of the lower Re values are given in (B).
Catalysts 13 00554 g002
Figure 3. The MEA resistance components R1–R4 variation with the cell voltage (A) and the comparison of only R1 and R2 values (B).
Catalysts 13 00554 g003
Figure 4. The resistance components R1–R4 variation as a function of temperature (A). The Arrhenius plots of MEA resistance components (B), measured at different temperatures and in 1.0 M KOH supporting electrolyte). R1–R2 values are averaged among the whole voltage range. Given R3–R4 values are measured at 1.7 V.
Catalysts 13 00554 g004
Figure 5. The effect of supporting electrolyte concentration on ohmic resistance and high-frequency resistance R2 values: Nyquist plots (A) and the comparison of R1 and R2 values (B) measured at cell voltage 1.4 V and 50 °C. Reference EIS dots obtained at ca. 0.1, 1.0, 11, 116, 1200, and 8700 Hz are given as open symbols. The fitting is shown as lines.
Catalysts 13 00554 g005
Figure 6. Characteristic frequencies related to the high-, mid-, and low-frequency arcs, calculated for a voltage range of 1.6–1.9 V (50 °C, 1 M KOH) (presented as dots); the filled area relates to the high-, mid-, and low-frequency arcs colored with black, red and blue, respectively. Filled areas are given considering the fi variation with temperature.
Catalysts 13 00554 g006
Disclaimer/Publisher’s Note: The statements, opinions and data contained in all publications are solely those of the individual author(s) and contributor(s) and not of MDPI and/or the editor(s). MDPI and/or the editor(s) disclaim responsibility for any injury to people or property resulting from any ideas, methods, instructions or products referred to in the content.