Article

Ca2Fe2O5-Based WGS Catalysts to Enhance the H2 Yield of Producer Gases

by
Isabel Antunes
1,*,
Luís C. M. Ruivo
1,2,
Luís A. C. Tarelho
2 and
Jorge R. Frade
1,*
1
Department of Materials and Ceramic Engineering, CICECO—Aveiro Institute of Materials, University of Aveiro, 3810-193 Aveiro, Portugal
2
Department of Environment and Planning, CESAM—Centre for Environmental and Marine Studies, University of Aveiro, 3810-193 Aveiro, Portugal
*
Authors to whom correspondence should be addressed.
Catalysts 2024, 14(1), 12; https://doi.org/10.3390/catal14010012
Submission received: 5 November 2023 / Revised: 14 December 2023 / Accepted: 19 December 2023 / Published: 21 December 2023

Abstract

:
Ca2Fe2O5-based catalysts were synthesized from siderite and calcite precursors, which were processed in the form of pelletized samples and tested as water gas shift catalysts. Catalytic tests were performed in a tubular reactor, at temperatures in the range 400–500 °C and with different H2O:CO ratios, diluted with N2; this demonstrates the positive impact of Ca2Fe2O5 on conversion of CO and H2 yield, relative to corresponding tests without catalyst. The catalytic performance was also remarkably boosted in a microwave-heated reactor, relative to conventional electric heating. Post-mortem analysis of spent catalysts showed significant XRD reflections of spinel phases (Fe3O4 and CaFe2O4), and SiO2 from the siderite precursor. Traces of calcium carbonate were also identified, and FTIR analysis revealed relevant bands ascribed to calcium carbonate and adsorbed CO2. Thermodynamic modelling was performed to assess the redox tolerance of Ca2Fe2O5-based catalysts in conditions expected for gasification of biomass and thermochemical conditions at somewhat lower temperatures (≤500 °C), as a guideline for suitable conditions for water gas shift. This modelling, combined with the results of catalytic tests and post-mortem analysis of spent catalysts, indicated that the O2 and CO2 storage ability of Ca2Fe2O5 contributes to its catalytic activity, suggesting prospects to enhance the H2 content of producer gases by water gas shift.

1. Introduction

Thermal conversion of lignocellulosic biomass by gasification can be an important contribution to the carbon-neutral economy since producer gas mixtures may be used as commodities for other industrial applications. Though the biomass-derived gas is greatly influenced by process conditions, the typical H2:CO molar ratio is often lower than 1:1 [1], even after biomass steam gasification [2]. Consequently, depending on the end-use application (i.e., methanation), the contents of H2 in the producer gas must be upgraded by water gas shift (WGS) reaction. The WGS reaction may be performed at relatively low (LTS, 150–300 °C) or intermediate (HTS, 350–500 °C) temperatures, relying on a wide diversity of catalysts or non-catalytic processes in less common environments, such as supercritical water or plasma [3], or unusual conditions, such as microwave irradiation [4]. Classical WGS catalysts for LTS and HTS processes are based on Fe/Cr and Cu/Zn mixed oxides [5,6]. Still, the environmental impact of Cr content raised concerns; this stimulated research on Cr-free catalysts with incorporation of other transition metal oxides and lanthanides [7], or even noble metals. Ni-based catalysts are also affected by limitations such as promotion of methanation [8]. Moreover, Cu/Zn based-catalysts are readily deactivated at low sulphur content (<0.5 ppm), which requires previous cleaning of the biomass-derived gas [9]. Thus, alternative low-cost catalysts are still needed for specific applications such as H2-enriched producer gas by a combination of biomass gasification and WGS [10], or supercritical water gasification [11], possibly operating also in less common conditions. An interesting option is based on the application of Fe/Ca-based materials, due to their thermal stability, low cost and effective activity towards WGS and reforming reactions.
Ca2Fe2O5-based catalysts are attracting attention for their activity in biomass gasification [12], including chemical looping gasification [13], and relevant mechanisms which enhance the yield of H2 in the producer gas and promote tar conversion by steam reforming [14]. The catalytic activity has also been demonstrated for a variety of other processes, including catalysts for steam reforming of methane [15], chemical looping gasification of coal [16], or chemical looping combustion [17], decomposition of NOx in exhaust gases [18], catalyst supports for oxidation of CO [19], etc. These catalysts are based on low-cost calcium and iron oxides (FexOy), and their synthesis can be achieved from low-cost precursors at relatively low temperatures [20].
Gasification of biomass assisted with co-additions of iron and calcium oxides yielded a slight increase in gasification efficiency and enhanced the yield of H2 [21]; this can be related to redox cycles in the presence of CO/CO2 and H2O/H2 pairs [22] and was ascribed to a combination of chemical looping provided by FexOy and adsorption of CO2 by CaO. Similarly, enhanced gas yield was reported for steam gasification of coal catalyzed by calcium ferrites with different Ca:Fe ratios [16]. The yield of H2 reached a maximum at the intermediate Ca:Fe ratio, which was ascribed to promotion of the water gas shift (WGS) reaction by Ca2Fe2O5.
One also expects good sulphur tolerance of calcium ferrites in contact with producer gases from biomass or other low-grade energy sources, based on the demonstrated ability to capture H2S and other contaminants [23]. The oxygen looping can be related to variable oxygen sub-stoichiometry and the rich structural diversity of iron species with different oxidation states and co-existing octahedral and tetrahedral coordination [24]. The brownmillerite structure of Ca2Fe2O5 is also highly stable in wide ranges of redox conditions, except for the onset of traces of CaO [25], exceeding the stability of FexOy and also CaFe2O4 [24].
The promotion of H2 yield in producer gas obtained by biomass gasification [26] has been interpreted as a promotion of the WGS reaction (Equation (1)) in gas mixtures containing high contents of CO and steam:
C O + H 2 O C O 2 + H 2 ;
Still, a different work suggests that Ca2Fe2O5 may also promote the reverse WGS reaction [27] in CO2- and H2-rich gas mixtures; this indicates that the catalyst promotes convergence to equilibrium (Equation (2)) from both sides.
k e q = p C O 2 p H 2 p C O   p H 2 O .
Note that the equilibrium constant of WGS corresponds to a difference between the redox conditions of the H2/H2O and CO/CO2 redox pairs; this depends on absolute temperature (Equation (3)) [28], and is reverted at about 800 °C.
l n p H 2 p H 2 O l n p C O p C O 2 = l n k e q
13.15 + 5.44 × 10 4 T 1.125 × 10 7 T 2 + 1.077 ln T + 5.694 × 10 3 T 4.917 × 10 4 T 2 .
On the other hand, the operation of conventional WGS reactors at high pressures also notably penalizes the economic feasibility of the gasification plant [29]. Note that WGS processes are usually carried out in fixed-bed reactors, and truly isothermal conditions are seldom reached in the packed bed. As a result, high energy inputs are involved to balance heat transfer limitations, which points out the necessity to explore alternative energy-efficient methods. In this perspective, microwave-assisted operation can significantly improve the performance of WGS catalysts. Compared with conventional heating, where heat is shifted from the surface to the core of the material through conduction driven by temperature gradients, microwaves induce local heating by direct conversion of the electromagnetic field into heat; this promotes direct heating of catalyst particles.
Therefore, the present work was intended to confirm the catalytic activity of Ca2Fe2O5 to promote the WGS reaction, at atmospheric pressure while suppressing methanation, and to assess the impact of microwave irradiation on catalytic performance. The Ca2Fe2O5-based catalyst was selected for its Fe- and Ca-based composition, structural stability in wide redox ranges, prospective economic feasibility based on abundant elements (Ca and Fe), and ability to be processed from low-cost precursors without previous separation of gang components, by a facile method [20].
One seeks enhancement of the H2 yield of producer gas by secondary treatment based on WGS, after a primary step of biomass steam gasification. Thus, working conditions for WGS treatment were focused on a relatively high temperature range (400–500 °C) to prevent condensation of tars. The range of the steam to carbon monoxide ratio H 2 O : C O cannot be directly taken from the reported composition of producer gas, which is measured after condensation of steam and, thus, reported on a dry basis [1]. Nevertheless, one predicts approximate values for the concentration of steam and H 2 O : C O in the producer gas before condensation, by combining typical values of the H:C elemental ratio in the biomass feedstock H : C b i o m 1.5 [1] with the additional contribution of the steam:carbon ratio added to assist gasification S : C g a s 0.5 [2]; this yields the effective ratio H : C e f f   H : C b i o m 1 + 2 S : C g a s   2.5 , and on combining with elemental balances of H and C in reported producer gas compositions (e.g., ref. [2]), one expects H 2 O : C O in the range 1–2 depending on temperature and other operating conditions.

2. Results and Discussion

2.1. Catalytic Testing

WGS catalytic testing was performed in a microwave reactor or in a conventional electric furnace, and blank tests were also performed without a catalytic bed. Other operating conditions were identical for every case, namely temperature (500 °C), H2O:CO feed ratio (H2O:CO = 3) and gas hourly velocity (GHSV = 5900–6750 h−1). Gas analysis only detected H2, CO and CO2, without any traces of light hydrocarbons (CH4, C2H6, etc. ) or other volatile compounds, and Table 1 summarizes the relevant results in terms of conversion of CO and H2 yield, relative to total contents of C-containing gases. Blank results without a catalyst did not show significant differences with and without microwaves, whereas the combination of catalyst with microwave heating yielded higher conversion of CO to CO2 and also enhanced H2 yield.
Thus, we found clear evidence of catalytic activity of Ca2Fe2O5 and remarkable microwave boosting, possibly related to the microwave absorption properties of ferrite-based catalysts, and prospects for direct self-heating under microwave irradiation. Note that although the WGS reaction is moderately exothermic, this may be insufficient to account for the sensible heat of reactants from room temperature up to the reaction temperature, which increases with the reaction temperature and with the H2O:CO feed ratio [3]. In fact, microwave-assisted WGS was previously proposed with a commercial Fe–Cr-based catalyst at intermediate temperatures [4] and with Cu-Zn catalyst at lower temperatures [30]; this work was also supported by modelling, which revealed significant temperature differences, with overheating in dense parts of the reactor. Other references also analyzed the applicability and limitations of microwave reactors for other processes intended for catalytic valorization of biomass-derived products [31].
The yields of H2 and CO2 in Table 1 are similar, within the range of expected experimental errors, and indicate that the WGS reaction (Equation (1)) prevails. Slight differences between the yields of H2 and CO2 might still be ascribed to direct oxidation ( C O + 0.5 · O 2 C O 2 ) [22], relying on the oxygen storage ability of the catalyst by phase transformations or by variable oxygen stoichiometry of calcium ferrites [25]. In addition, the CO/CO2 balance may be slightly changed by the onset of calcium carbonate (CaCO3), as revealed by post-mortem analysis.
In fact, X-ray diffraction showed significant differences between the as-prepared catalyst and post-mortem analysis of spent catalysts (Figure 1). The as-prepared catalyst contained mainly the Ca2Fe2O5-based brownmillerite phase (JCPDS 00-047-1744), with CaFe2O4 (JCPDS 01-072-1199) as secondary phase, unreacted SiO2 (JCPDS 00-005-0490) from the natural siderite precursor and traces of hematite Fe2O3 (JCPDS 00-033-0664). The most relevant changes in spent catalyst samples refer to extinction of the Fe2O3 phase, onset of magnetite Fe3O4 (JCPDS 01-088-0866) and also CaCO3 (JCPDS 00-005-0586). Note that its main reflection (104) at ≈29.41° (Figure 1) is significantly shifted from the (131) reflection of Ca2Fe2O5 (≈29.22°).
The relative integrated intensity of the main reflection of the secondary phase I 121 : I 141 is also somewhat higher in spent catalyst samples, where I 141 and I 121 denote the integrated intensities of the main reflections of Ca2Fe2O5 and CaFe2O4. The integrated intensity of the (141) reflection of C a 2 F e 2 O 5 was calculated after de-convolution of the partially superimposed (200) and (141) reflections, as shown by the insert in Figure 1. The integrated intensity ratio I 121 : I 141 increased from 0.19 in the as-prepared catalyst to 0.30 after catalytic testing with microwave heating. The integrated intensity ratio was also slightly higher after catalytic testing with microwave heating (0.30) than after testing in the electric furnace (0.25).
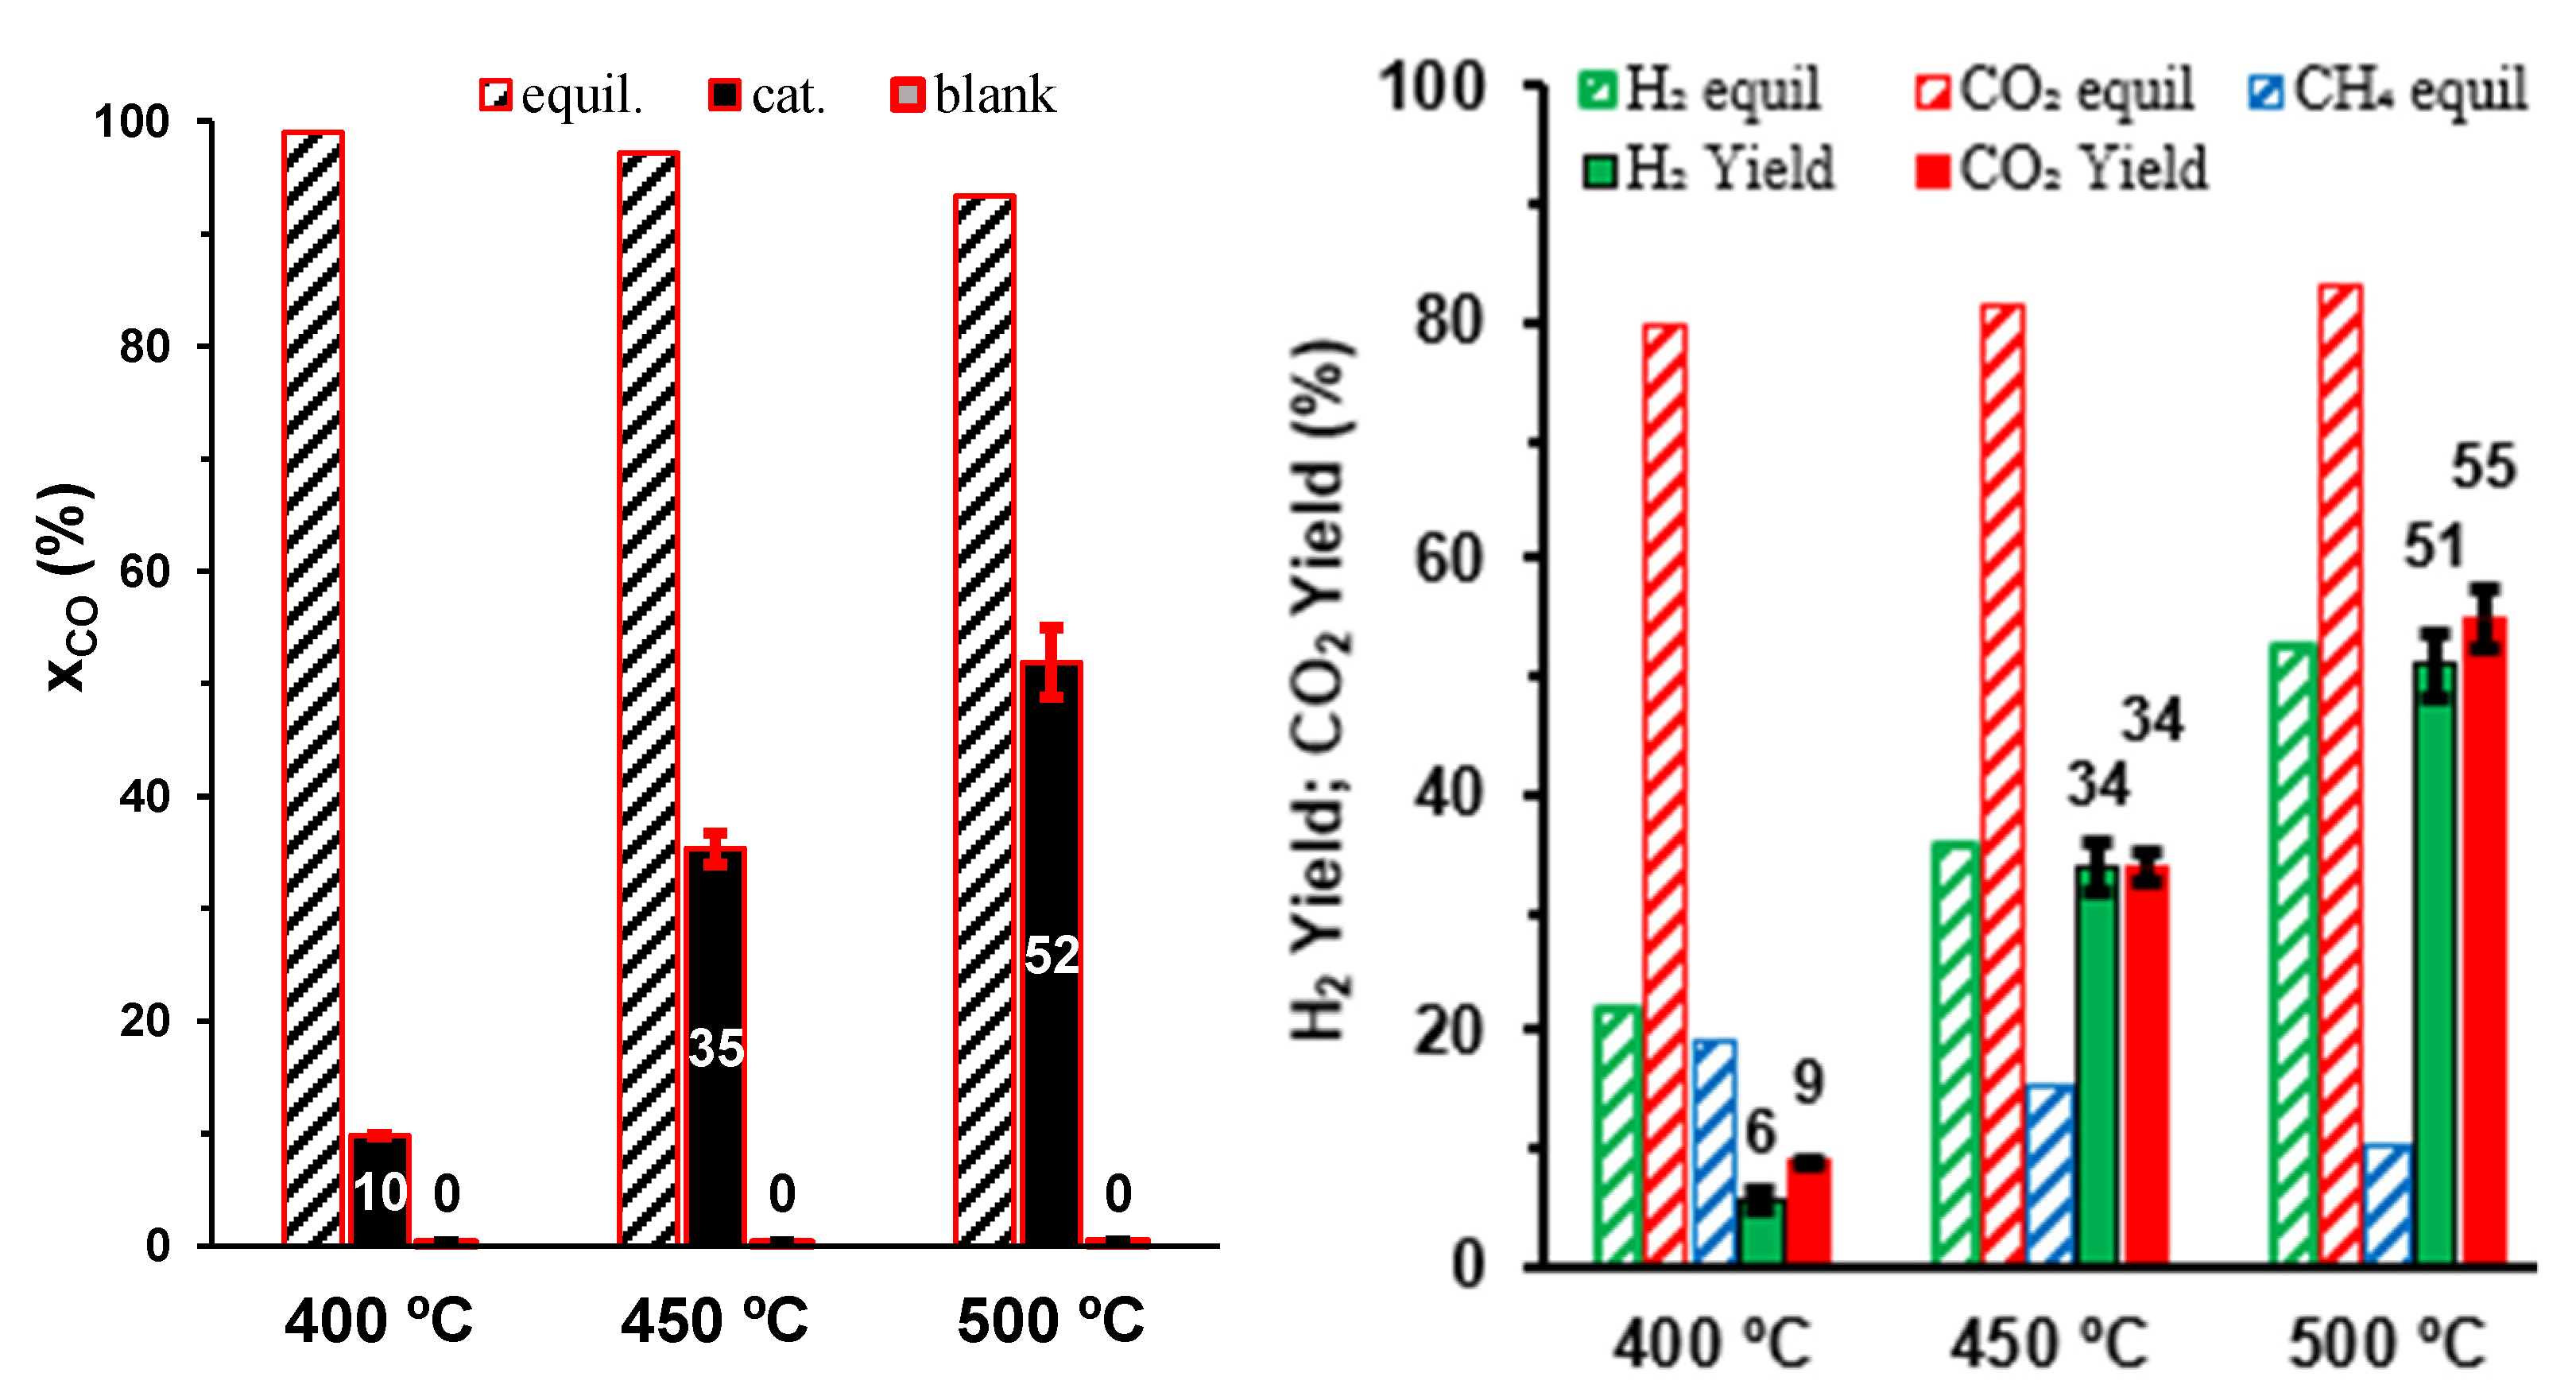
A more-detailed study of the catalytic activity of the Ca2Fe2O5-based catalyst was performed to assess the dependence of conversion of CO and yield of H2 on temperature and H2O:CO feed ratio. Temperature plays a key role in the conversion of CO, which can be ascribed mainly to kinetic limitations, since thermodynamic equilibrium should reach about 93% at 500 °C or 99% at 400 °C. we also assessed a representative rate constant (k) based on deviation from thermodynamic equilibrium, combined with the average value of GHSV 6325 h−1, i.e.,
k = G H S V 1 x C O / x C O , e q   15.7 exp 3919 / T .
The corresponding activation energy ( E a 33 kJ/mol) was close to the lowest values reported for WGS with Pt/FeOx catalysts [32], and also for WGS reaction with Cu/Zn-based catalysts under microwave heating [30]. However, this similarity was inconclusive since the literature data are highly scattered and may depend on the temperature range [3].
The results of thermodynamic equilibrium can be ascribed to a combination of WGS and methanation (Equation (5)), with a corresponding decrease in yield of H2 and changes in the stoichiometric H2:CO2 ratio, mainly at lower temperatures:
C O + 1 2 x H 2 O 1 x C O 2 + x C H 4 + 1 4 x H 2
However, CH4 was not detected in the actual experimental results (Figure 2), indicating that the catalysts hinders the reaction of methanation while promoting WGS. Thus, the effective yield of H2 is still close to equilibrium and in the same range as the yield of CO2, as expected for the prevailing WGS (Equation (1)). Note that the side reaction of methanation is considered a drawback of some WGS catalysts, such as Ni-based catalyst, and suitable changes in catalyst composition are needed to minimize the negative impact on H2 yield [33].
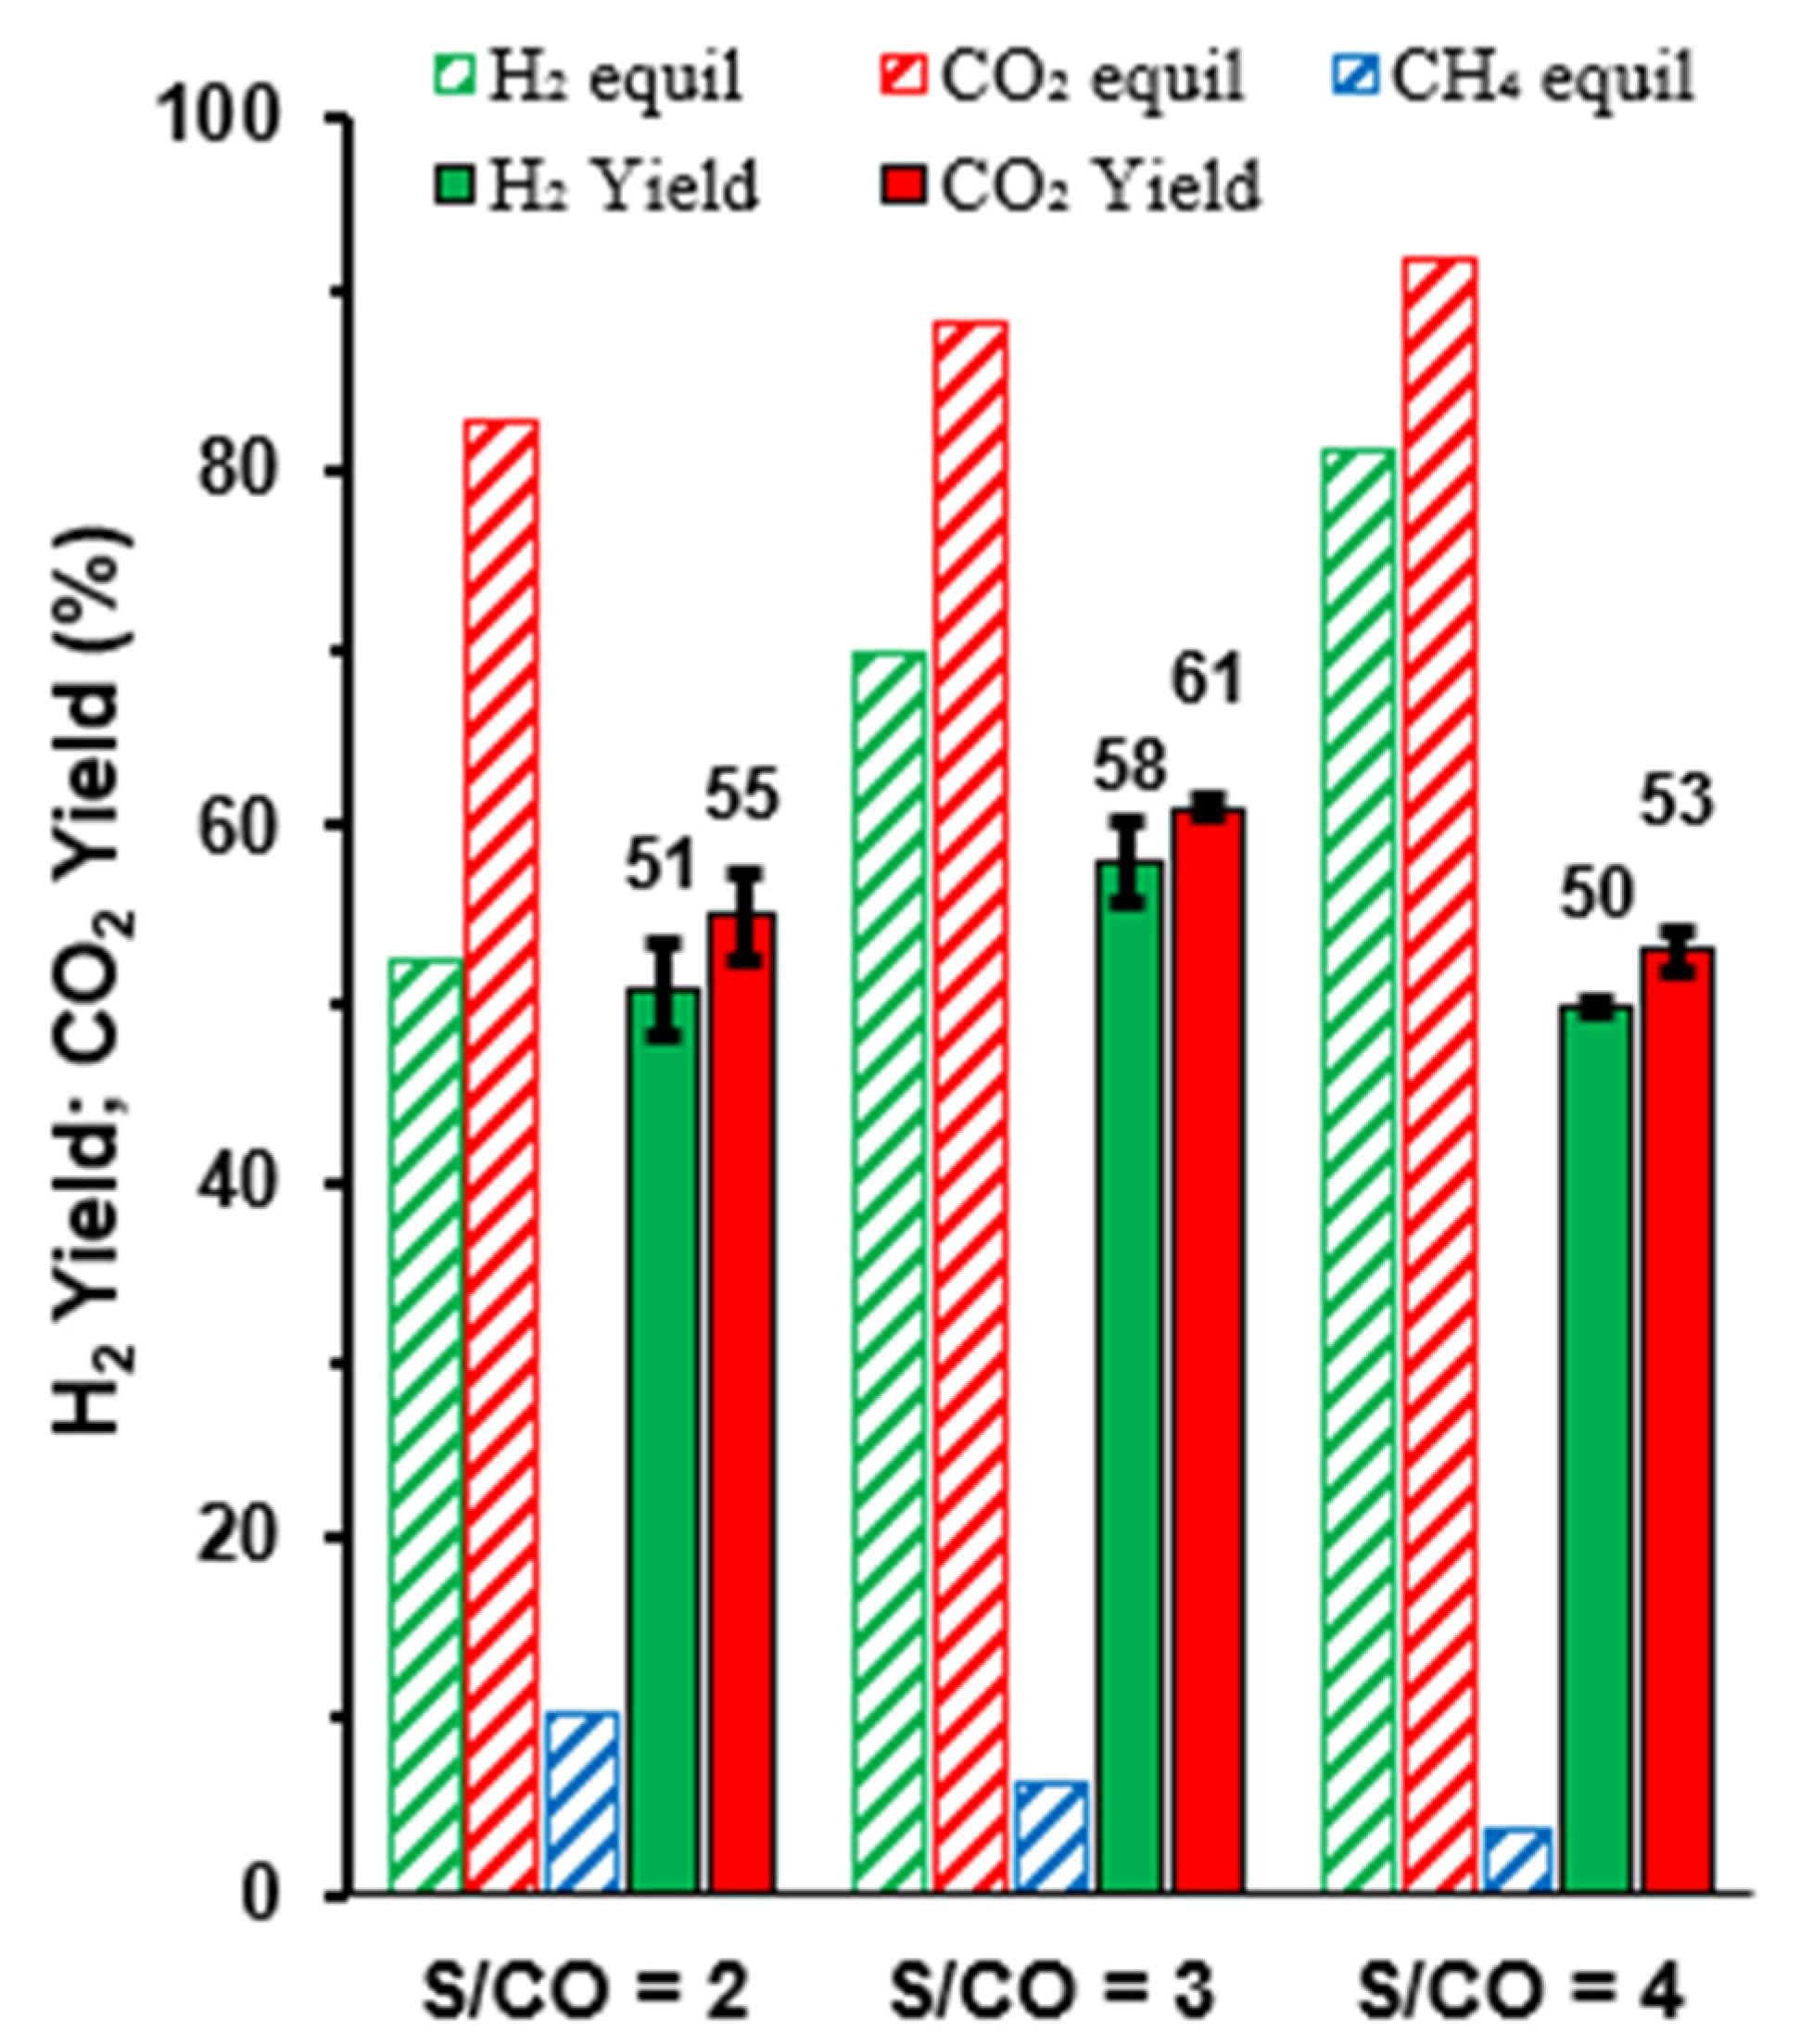
Thermodynamic predictions also indicated that the impact of the side reaction of methanation should decrease with increasing H2O:CO ratio (Figure 3). However, the corresponding experimental results only showed a slight gain in the yield of H2 for an intermediate steam:CO ratio, and this trend was reverted for the highest steam:CO ratio. In addition, the yields of H2 and CO2 remained similar, indicating that methanation remains negligible independently of the steam:CO ratio. Thus, an excessive H2O:CO ratio affects the WGS reaction (Equation (1)), as revealed by increasing differences between the experimental yield of H2 and the corresponding equilibrium values (Figure 3).

2.2. Post-Mortem Analysis

Post-mortem analysis of spent samples (Figure 4) showed that the reacting gas mixture exerted significant effects on the catalyst, with emphasis on onset of CaCO3 and Fe3O4. The main reflection of CaCO3 (104) increased with the temperature of the catalytic tests, in close relation with increasing catalytic activity (Figure 2). In addition, the highest H2O:CO ratio gave rise to aragonite, indicating that excessive humidity promotes ready CO2 adsorption and/or carbonation, with a negative impact on catalytic performance (Figure 3), possibly by blocking active sites. In fact, humidity often assists adsorption of CO2 by capture materials [34] and promotes readier carbonation of CaO-rich materials such as cements. The intensities of Fe3O4 reflections also increased with the temperature of catalytic testing, by gradual reduction of traces of Fe2O3, possibly combined with additional segregation of Fe3O4 at onset of CaCO3.
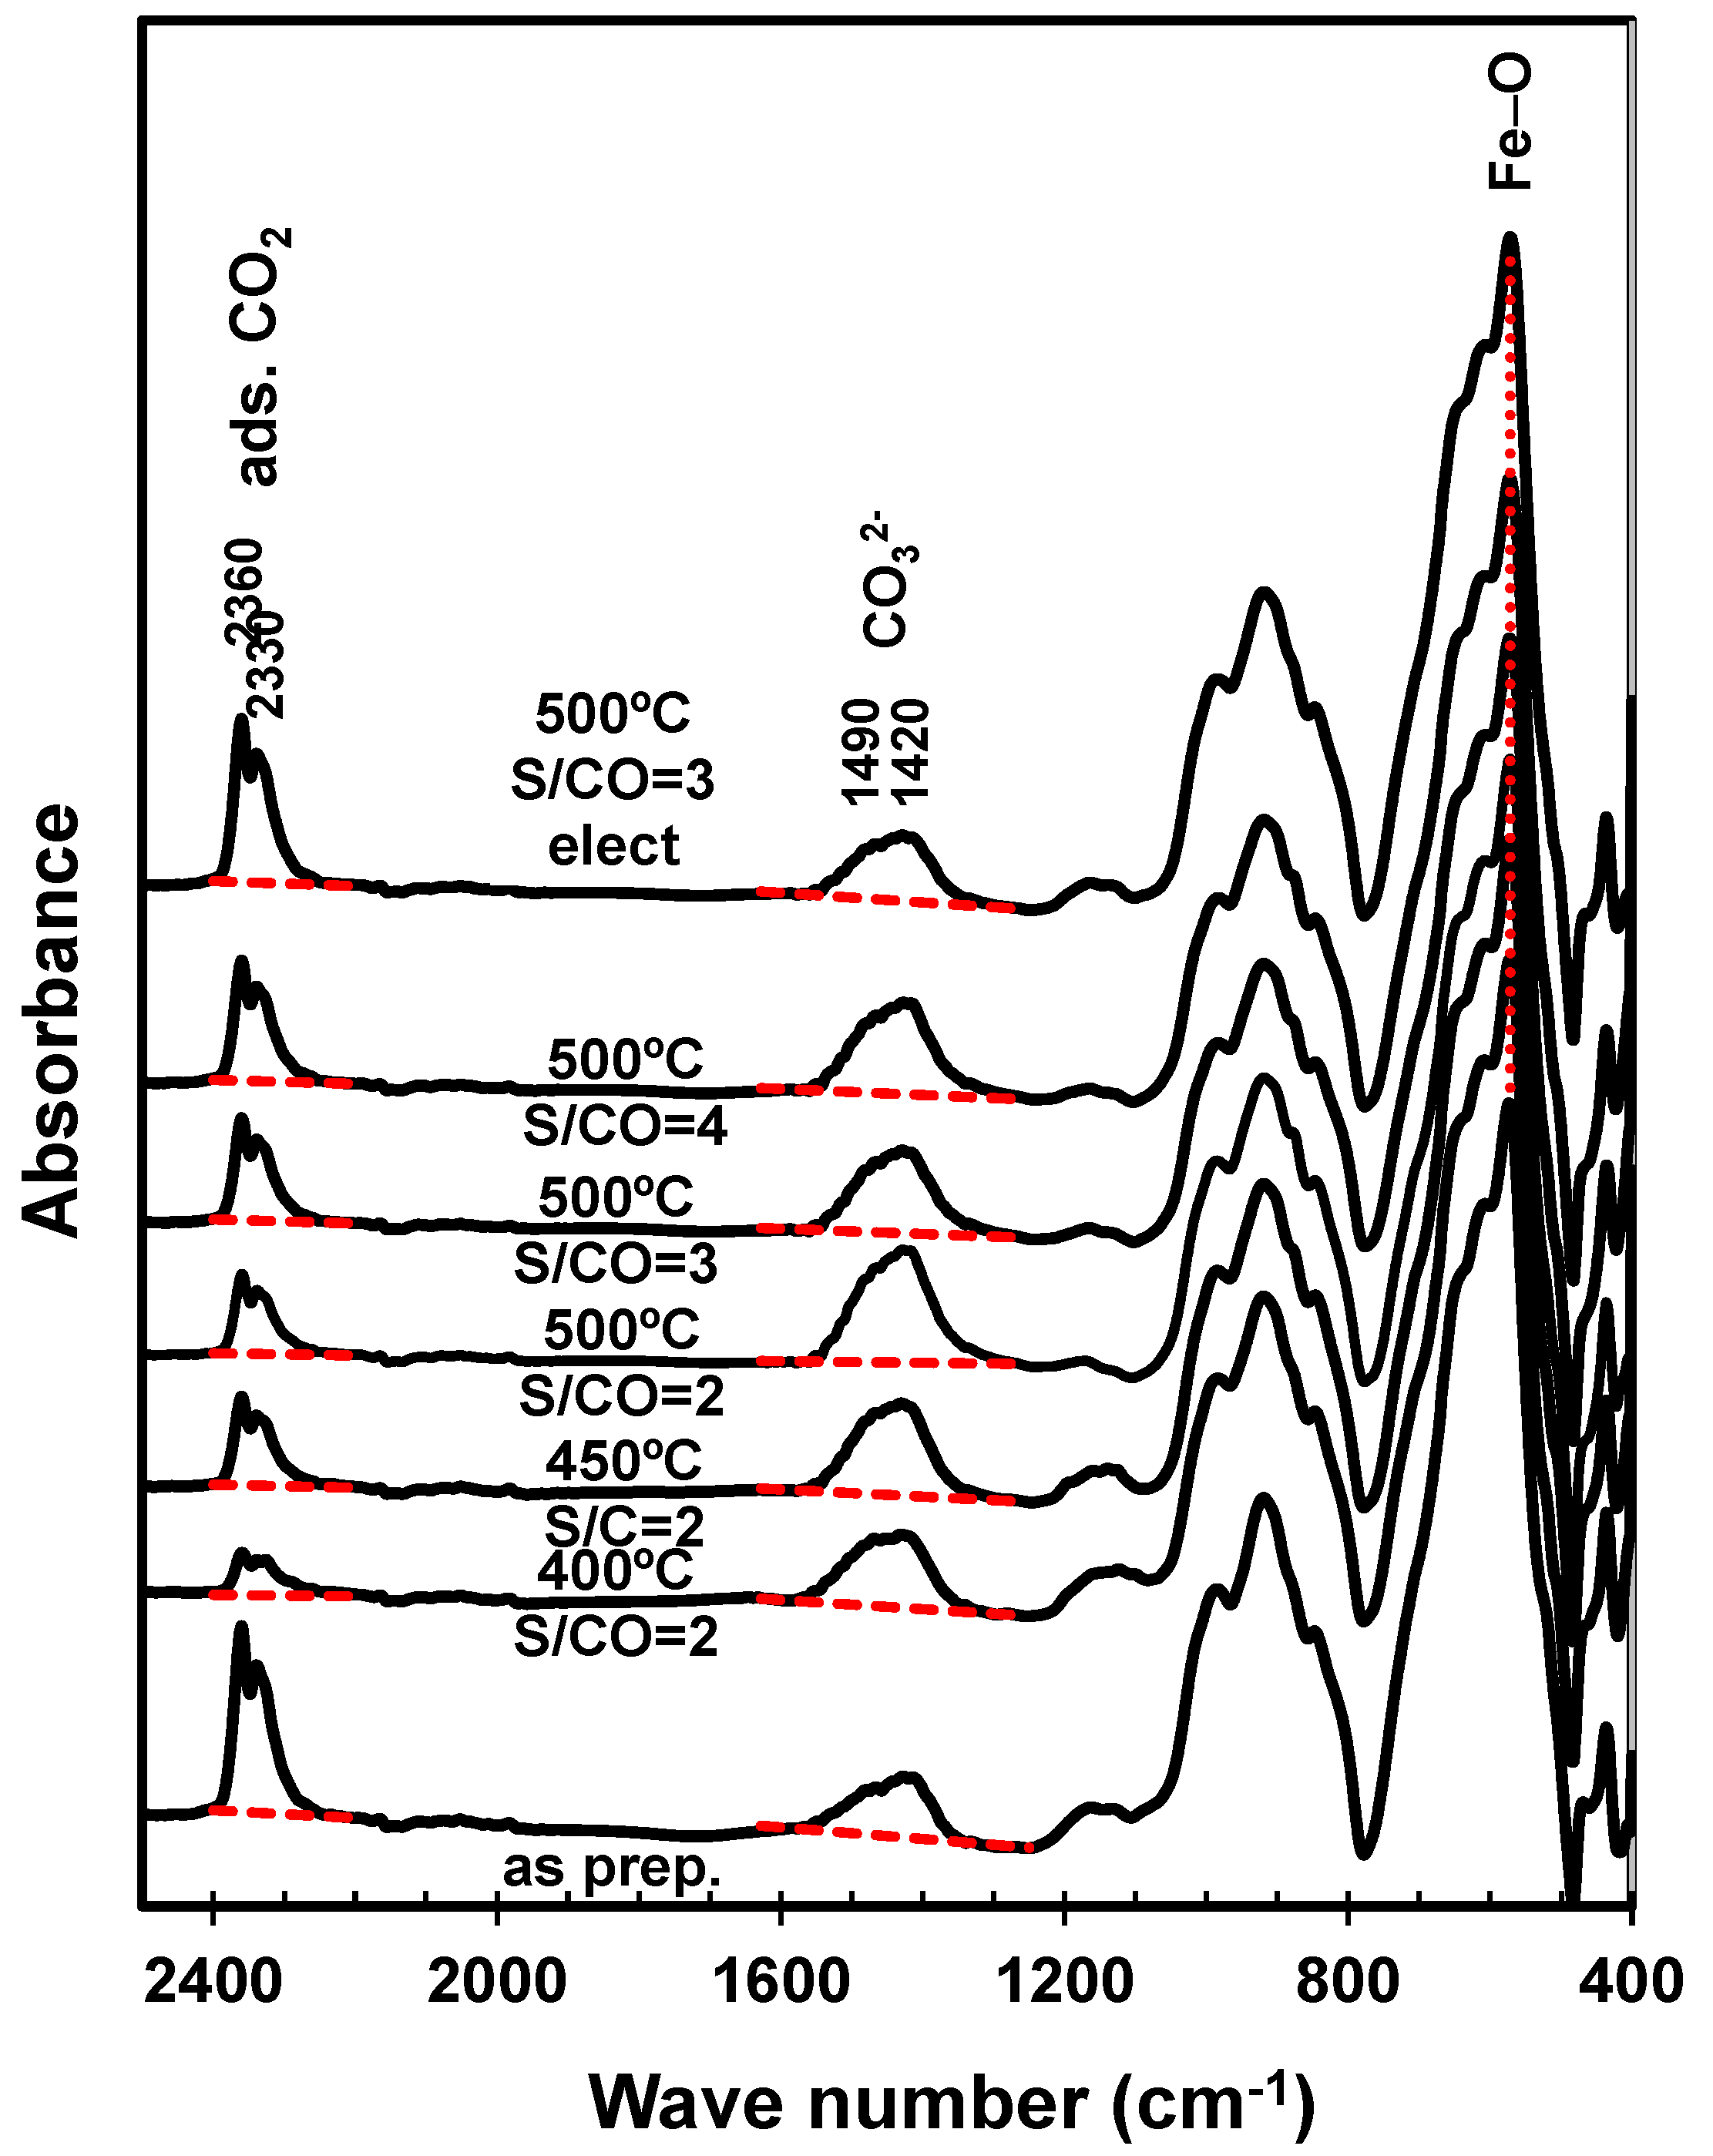
Post-mortem FTIR analyses (Figure 5) confirmed the onset of calcium carbonate, revealed by asymmetric stretching of carbonate groups at 1490–1420 cm−1 [35], combined with adsorbed CO2, revealed by the band at 2360–2330 cm−1, by analogy with catalysts impregnated with alkaline earth oxides [36]. Note that the relative amplitudes of corresponding bands have been adjusted, taking the Fe-O stretching band (≈570 cm−1) [37] as reference. Thus, both processes increased mainly with the temperature of the catalytic tests. The H2O:CO ratio also determined mainly the adsorption band, suggesting combined effects of humidity and CO2, as reported for carbon capture materials [34,38]. On the contrary, the impact of steam:CO on the carbonate band was far from clear, since it decayed at intermediate H2O:CO and reverted for the highest steam:CO value. Note also that CO2 adsorption may also have occurred preferentially on cooling to room temperature, after the catalytic tests. In fact, the as-prepared catalyst showed a strong band ascribed to adsorbed CO2, possibly because the initial firing temperature (800 °C) may have activated basic sites for subsequent adsorption of CO2 at room temperature.
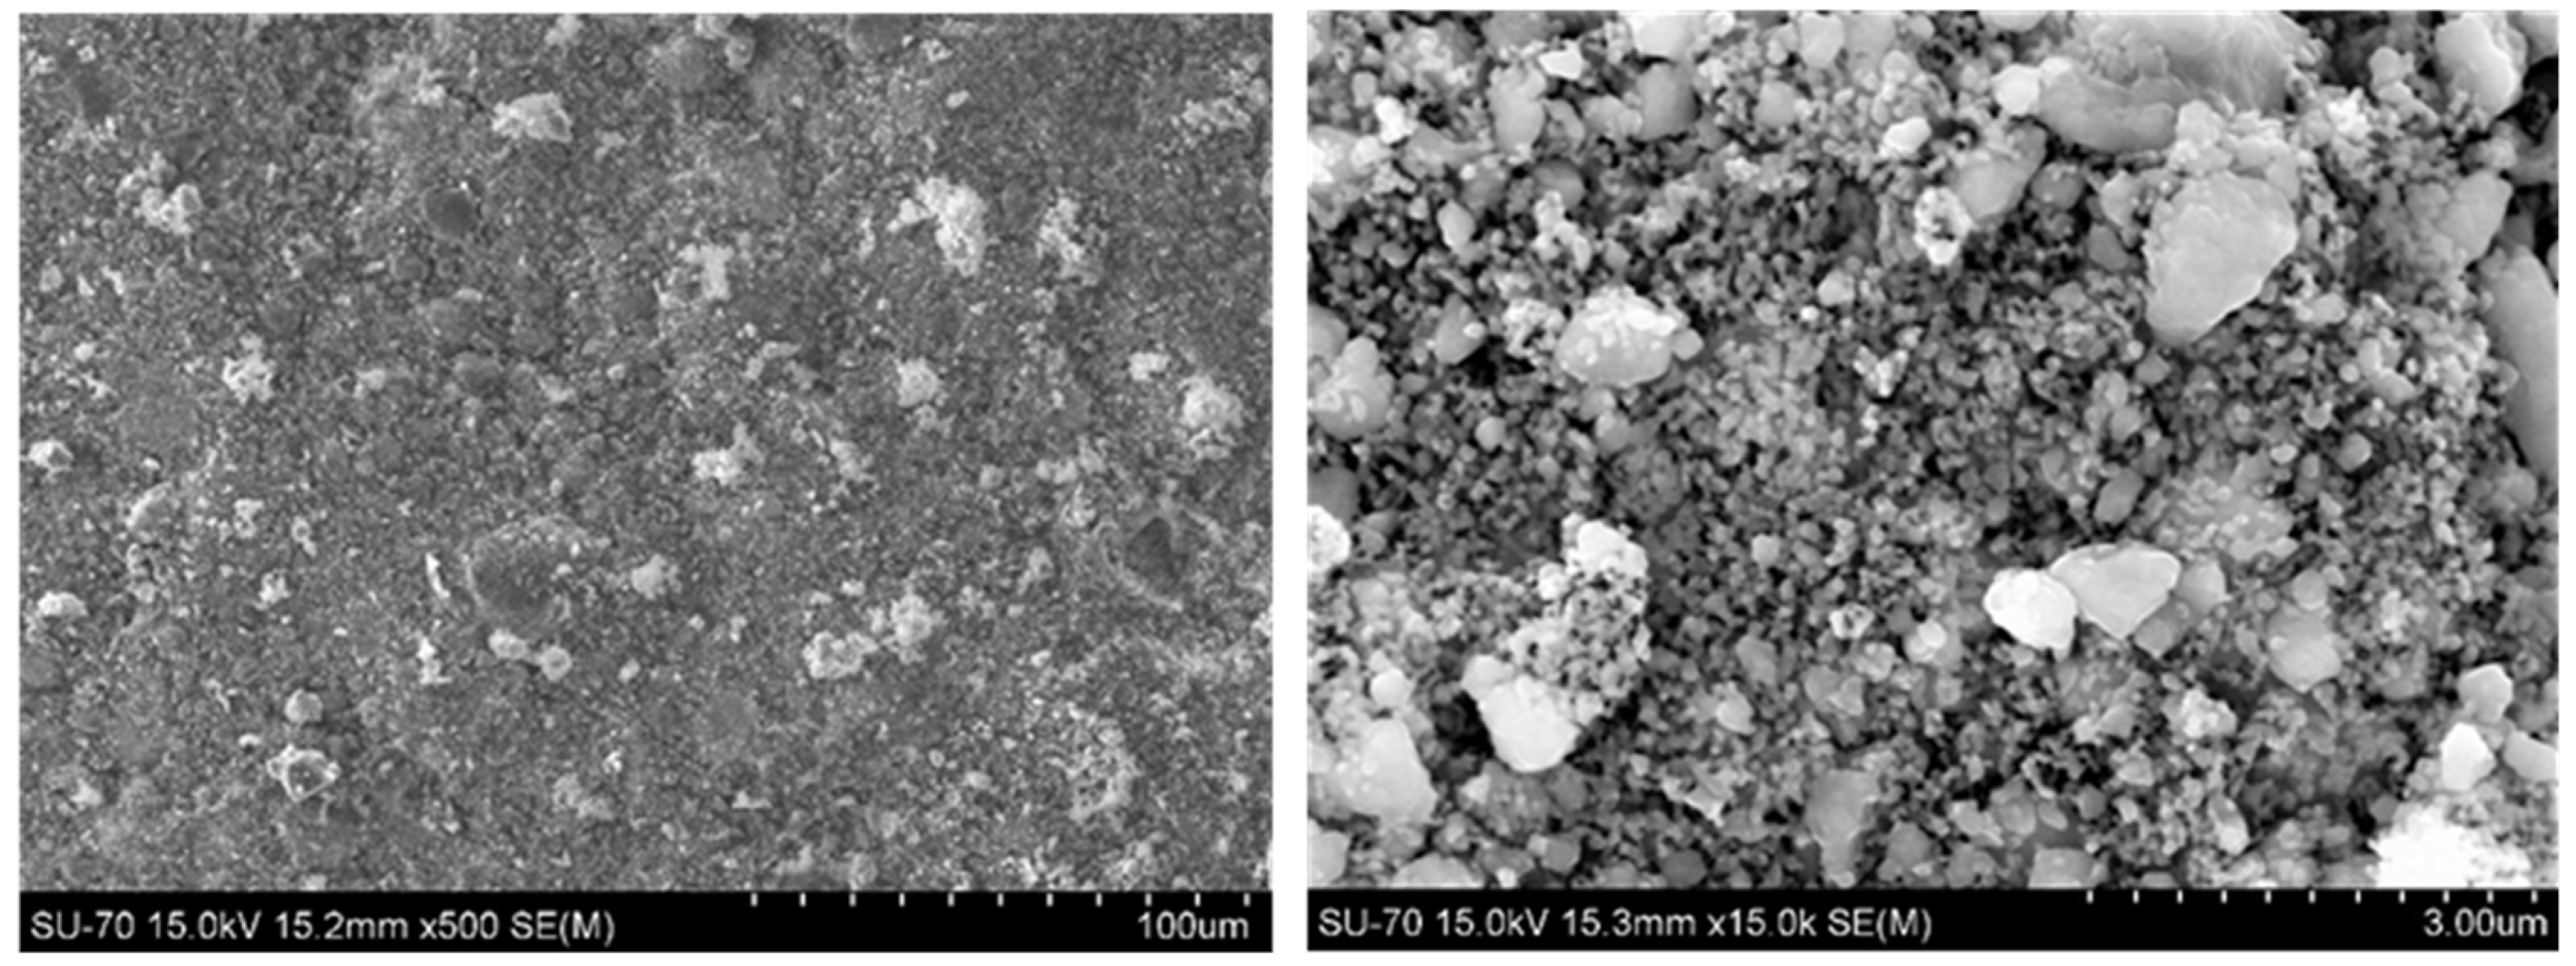
Scanning electron microstructures of spent catalysts (Figure 6) confirmed the heterogeneous features of the catalyst samples, with relatively coarse crystals of gang components (SiO2) from the siderite precursor. Low magnification microstructures of spent catalysts did not show any evidence of onset of fractures, mechanical failure or significant erosion. On the other hand, higher magnification was still ill-suited to obtain precise assessment of grain sizes for the main phase (Ca2Fe2O5), except possibly for a crude range 1   μ m .
X-ray diffractograms confirmed nanostructuring of the main brownmillerite phase Ca2Fe2O5 by estimating an approximate range for the crystallite size D from full width half maximum β and θ angles of the main X-ray reflections (Figure 1 and Figure 4), as described by the Debye–Scherrer equation [39]:
D λ / β c o s θ
this yielded typical sizes in the order of 36 ± 5   nm for as-fired samples, and similar results for spent samples, after catalytic testing at temperatures, namely 39 ± 5   nm at 400 °C and 37 ± 4   nm at 500 °C. On combining this crystallite size range with the density of the main brownmillerite phase ( ρ 3.70   g / cm 3 ), we also estimated typical values of specific surface area, in the order of S 3 / D ρ 20   m 2 / g .

2.3. Thermodynamic Guidelines

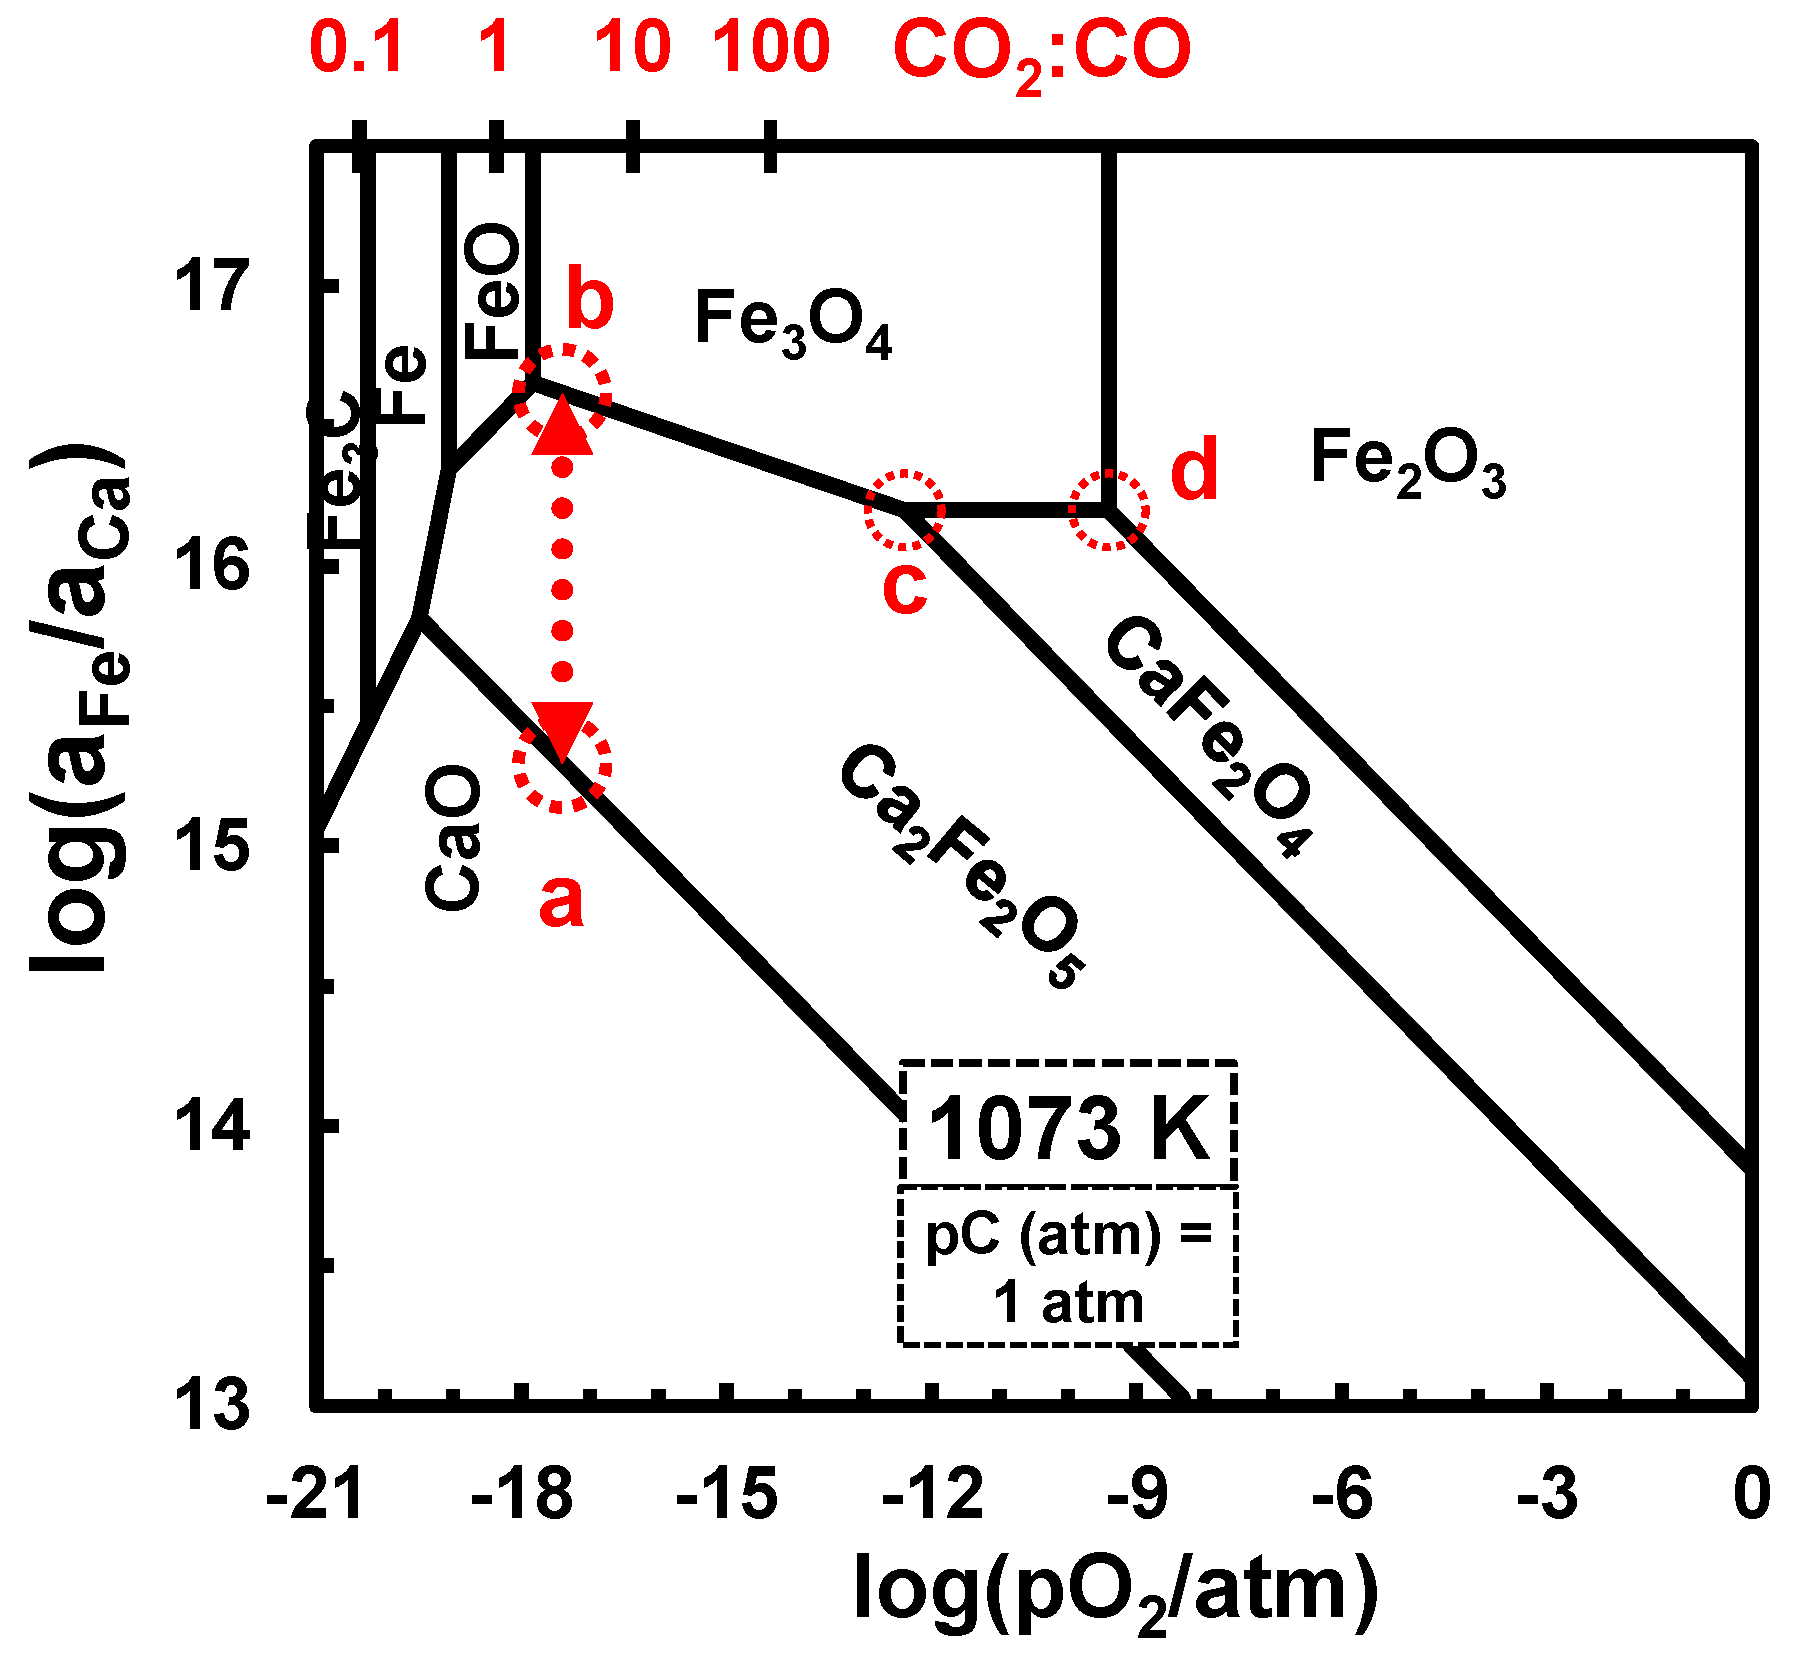
Figure 7 shows thermodynamic predictions for the Ca−Fe−O−C system at the firing temperature of the catalyst (800 °C), as a guideline for synthesis from the mixture of carbonates. On assuming complete reactivity of a stoichiometric mixture of carbonate precursors, while neglecting impurities in the low-grade siderite precursors and assuming also a self-controlled redox condition by evolving CO/CO2 gas mixtures:
2 C a C O 3 + 2 F e C O 3 C a 2 F e 2 O 5 + C O + 3 C O 2
Thus, the redox conditions in a closed atmosphere should be along the ab line in Figure 7. However, the X-ray diffractogram of the as-fired catalyst sample (Figure 1) showed co-existence of the Ca2Fe2O5- and CaFe2O4-based phases, combined with segregation of Fe2O3 and SiO2 from the low-grade siderite precursor; this indicated decomposition of the brownmillerite phase, probably induced by gradual evolution towards oxidizing conditions, through the intermediate ternary point Ca2Fe2O5/CaFe2O4/Fe3O4 (c in Figure 7), and then oxidation of the Fe3O4 fraction to Fe2O3 (d in Figure 7). Note that the apparent deviation from the stoichiometric Ca:Fe = 2 ratio may be explained by incorporation of light elements (Mg and Al from the siderite precursor) in the brownmillerite phase, i.e., Ca2(Fe,Al,Mg)2O5 [40], with impact on relevant properties such as magnetization and coercivity [41].
Thermodynamic predictions for the Ca−Fe−O−C system and interactions between catalyst and reacting gas mixture at 400 °C are shown in Figure 8, for gas feed diluted in N2, with p C = p C O + p C O 2 0.03 atm and 0.007 atm. In the case of p C = p C O + p C O 2 0.03 atm (Figure 8/top), the equilibrium redox condition for the feed ratio H2O:CO = 2 (vertical dotted line) was outside the upper limit of the redox stability range of the Ca2Fe2O5-based brownmillerite phase. On the contrary, the experimental results showed low conversion of CO, retaining a very low CO2:CO ratio, below the low limits of the stability range of Ca2Fe2O5. Though this suggests risks of carbon deposition, we did not find any traces of carbon deposits, probably because the effective phase composition of the catalyst (Figure 4) did not include the most active metallic phase. In addition, microwave heating combined with CaO-rich catalysts may promote the highly endothermic Boudouard reaction ( C + C O 2 2 C O ) [42].
On combining experimental evidence of catalyst phase composition (Figure 4) with thermodynamic predictions (Figure 8), we may also assume that onset of the calcium carbonate and magnetite was consistent, with reactivity with mixtures of CO and CO2:
C a 2 F e 2 O 5 + 1 / 3 C O + 5 / 3 C O 2 2 / 3 F e 3 O 4 + 2 C a C O 3 ;
In this case, carbonation may have contributed to maintaining a low CO2:CO ratio after catalytic testing at 400 °C, by preferential consumption of CO2.
The effective phase composition of the spent catalyst after testing at 400 °C (Figure 4) also indicated co-existence of the Ca2Fe2O5-based brownmillerite phase with the main CaFe2O4-based secondary phase, and also weaker reflections of Fe3O4 and CaCO3; this differed from the predicted equilibrium conditions, which suggested extensive carbonation and the absence of CaFe2O4 for the actual experimental gas feed with p C = p C O + p C O 2 0.03 atm (Figure 8/top). Actually, the effective phase composition of the spent catalyst was more consistent with non-equilibrium conditions, evolving by non-uniform redox conditions, as revealed by residual traces of Fe2O3, and only incipient carbonation; this is consistent with the equilibrium phase diagram for lower p C O + p C O 2 contents, as predicted for p C O + p C O 2 0.007 atm (Figure 8/bottom). In this case, the phase stability diagram predicted separate 3-phase contacts for Ca2Fe2O5/CaCO3/Fe3O4 (a in Figure 8/bottom) and for CaCO3/CaFe2O4/Fe3O4 (b in Figure 8/bottom). In the second case, carbonation may occur by:
C a F e 2 O 4 + 1 / 3 C O + 2 / 3 C O 2 2 / 3 F e 3 O 4 + C a C O 3 ;
Figure 9 shows the equilibrium phase diagram predicted for the Ca−Fe−O−C system at 450 °C, superimposed on the expected redox conditions of the reacting gas mixture with p C = p C O + p C O 2 0.03 atm and feed ratio H2O:CO = 2. In this case, the phase stability range of the Ca2Fe2O5 comprised the effective experimental results for the CO2:CO ratio (dashed vertical line) and also extended to the predicted equilibrium conditions for the reacting gas mixture (dotted vertical line). For less-reducing conditions, one finds the 3-phase point Ca2Fe2O5/CaFe2O4/Fe3O4 (a in Figure 9), and one might assume that this provides oxygen storage ability to assist conversion of CO, possibly combined with adsorption of CO2 on the catalyst surface, as indicated by FTIR spectra (Figure 5):
2 C a F e 2 O 4 + 1 / 3 C O C a 2 F e 2 O 5 + 2 / 3 F e 3 O 4 + 1 / 3 C O 2 ( ads ) .
Prospects to promote CO oxidation near the ternary Ca2Fe2O5/CaFe2O4/Fe3O4 point may also provide clues about the microwave boosting of catalytic performance, based on selective microwave heating of Fe3O4 [43]; this is consistent with the increasing contents of Fe3O4 after catalytic testing at temperatures above 400 °C (Figure 4), by reduction of the residual content of Fe2O3 in the as-prepared catalyst and subsequent segregation of magnetite.
The phase diagram at 450 °C also predicts the 3-phase contact Ca2Fe2O5/CaFe2O4/CaCO3 (b in Figure 9), which may also promote subsequent carbonation:
C a 2 F e 2 O 5 + C O 2 C a F e 2 O 4 + C a C O 3 ;
Figure 10 shows the phase stability of the Ca−Fe−O−C system at 500 °C, superimposed on the relevant gas phase conditions predicted for p C O + p C O 2 0.03 atm and feed ratio H2O:CO = 2. In this case, oxidation of CO to CO2 might also be promoted near the 3-phase contact Ca2Fe2O5/CaFe2O4/Fe3O4 (a in Figure 10), as mentioned for catalytic tests at 450 °C (Equation (10)). In addition, one may assume oxidation of CO to CO2 by slight oxygen deficiency of Ca2Fe2O5, combined with significant oxygen permeability [24,44], as follows:
C a 2 F e 2 O 5 + δ C O C a 2 F e 2 O 5 δ + δ C O 2
Ca2Fe2O5 is also known for its sensitivity to CO and CO2 [45], even if the actual mechanisms of CO oxidation might be somewhat complex, as emphasized by DFT simulation, which identified different controlling steps such as oxygen diffusion [46] or formation of 2CO2—Ca2Fe2O5-δ complexes [47].
Onset of calcium carbonate at 500 °C must also rely on the point defect chemistry of brownmillerites rather than 3-phase contacts. In fact, anti-Frenkel and/or partial Schottky defects might allow significant concentrations of oxygen ion ( V O ) and A-site vacancies ( V A ) [48], with corresponding deviations from ideal stoichiometry, A2−xFe2O5−δ, where A = Sr, Ca. Thus, one may assume carbonation along the 2-phase boundary Ca2Fe2O5/CaCO3 (b in Figure 10), as follows:
C a 2 F e 2 O 5 + δ C O 2 C a 2 δ F e 2 O 5 δ + δ C a C O 3 .

2.4. Prospective Applicability to Upgrade Producer Gases

Table 2 summarizes the actual WGS results with and without Ca2Fe2O5-based catalyst, with conventional electric heating or under microwave irradiation, and literature data on some of the most relevant WGS catalysts. The present results obtained at 500 °C under microwave irradiation were close to those reported for some established high-temperature (Fe-Cr)-based catalysts [4] but quite lower than those reported for other optimized catalysts, such as Ca-Fe-Ox [49] or Pt-NaA zeolites [50]. Still, improvements are expected by subsequent optimization of the Ca2Fe2O5-based catalyst, possibly by slight composition changes, as shown for other Fe-based catalysts [7] or optimized processing. Other (Cu-Zn)-based catalysts perform even better at lower temperatures (≤300 °C) [30]. However, these relatively low temperatures imply greater risks of condensation of tars, which are often found in producer gases. In addition, still-higher temperatures (>500 °C) might allow further increases in CO conversion and yield of H2, as demonstrated with siderite–concrete composite catalysts [51]. Note that the authors also used a representative composition of producer gas to confirm its upgrading with enhanced conversion of CO and increased yield of H2 at up to 700 °C. In this temperature range, one may even seek a contribution of Fe-based catalysts to promote tar conversion, possibly relying on additions of other elements, such as Ni [52]. Sulphur tolerance is also expected based on the demonstrated ability of calcium ferrites to capture H2S [23], and also taking into account guidelines for other Fe-based catalysts [2,53].

3. Materials and Methods

3.1. Catalyst Preparation

Ca2Fe2O5-based pellets were prepared by reactive firing of low-cost natural siderite (SIDCO Minerals Inc., Linden, TX, USA) and calcite (CaCO3, LabChem, Tokyo, Japan), based on a method reported earlier [20]. The X-ray diffraction of natural siderite showed FeCO3 as the main crystalline phase, combined with quartz (SiO2). However, further chemical analysis by XRF spectrometry (Philips PW 1400/00, Philips, Amsterdam, The Netherlands) also revealed the presence of significant fractions of aluminum and alkaline earth elements (Ca and Mg), and traces of Mn and Ti. Assuming that Fe, Ca and Mg are present as carbonates, and that the remaining elements are in oxide form, the estimated elemental composition of the siderite is 80.8% Fe, 10.8% Si, 6.2% Al, 0.9% Mg, 0.9% Ca, 0.2% Mn and 0.2% Ti.
Stoichiometric mixtures of CaCO3 and siderite (based on the elemental fraction of Fe) were ball milled (Retsch PM 100, Retsch, Berlin, Germany) at 400 rpm for 3 h, using a Teflon vial (~375 cm3) and zirconia balls (TOSOH Co.) with diameters of 1.5 cm and 1 cm, in the proportion of 10 and 40, respectively. The ball to powder weight ratio was ~2.5:1, and undue heating was avoided by milling for periods of 5 min with a subsequent pause of 2 min. The quantity of activated powder prepared in each milling experiment was ~60 g. The mechanically activated precursor mixture was then used to process bar-shaped catalyst samples (~0.7 × 0.3 × 0.3 cm) by cold isostatic pressure at 200 MPa, with subsequent thermochemical treatment in air at 800 °C for 4 h, with a heating rate of 2 °C/min.

3.2. Water Gas Shift (WGS) Tests

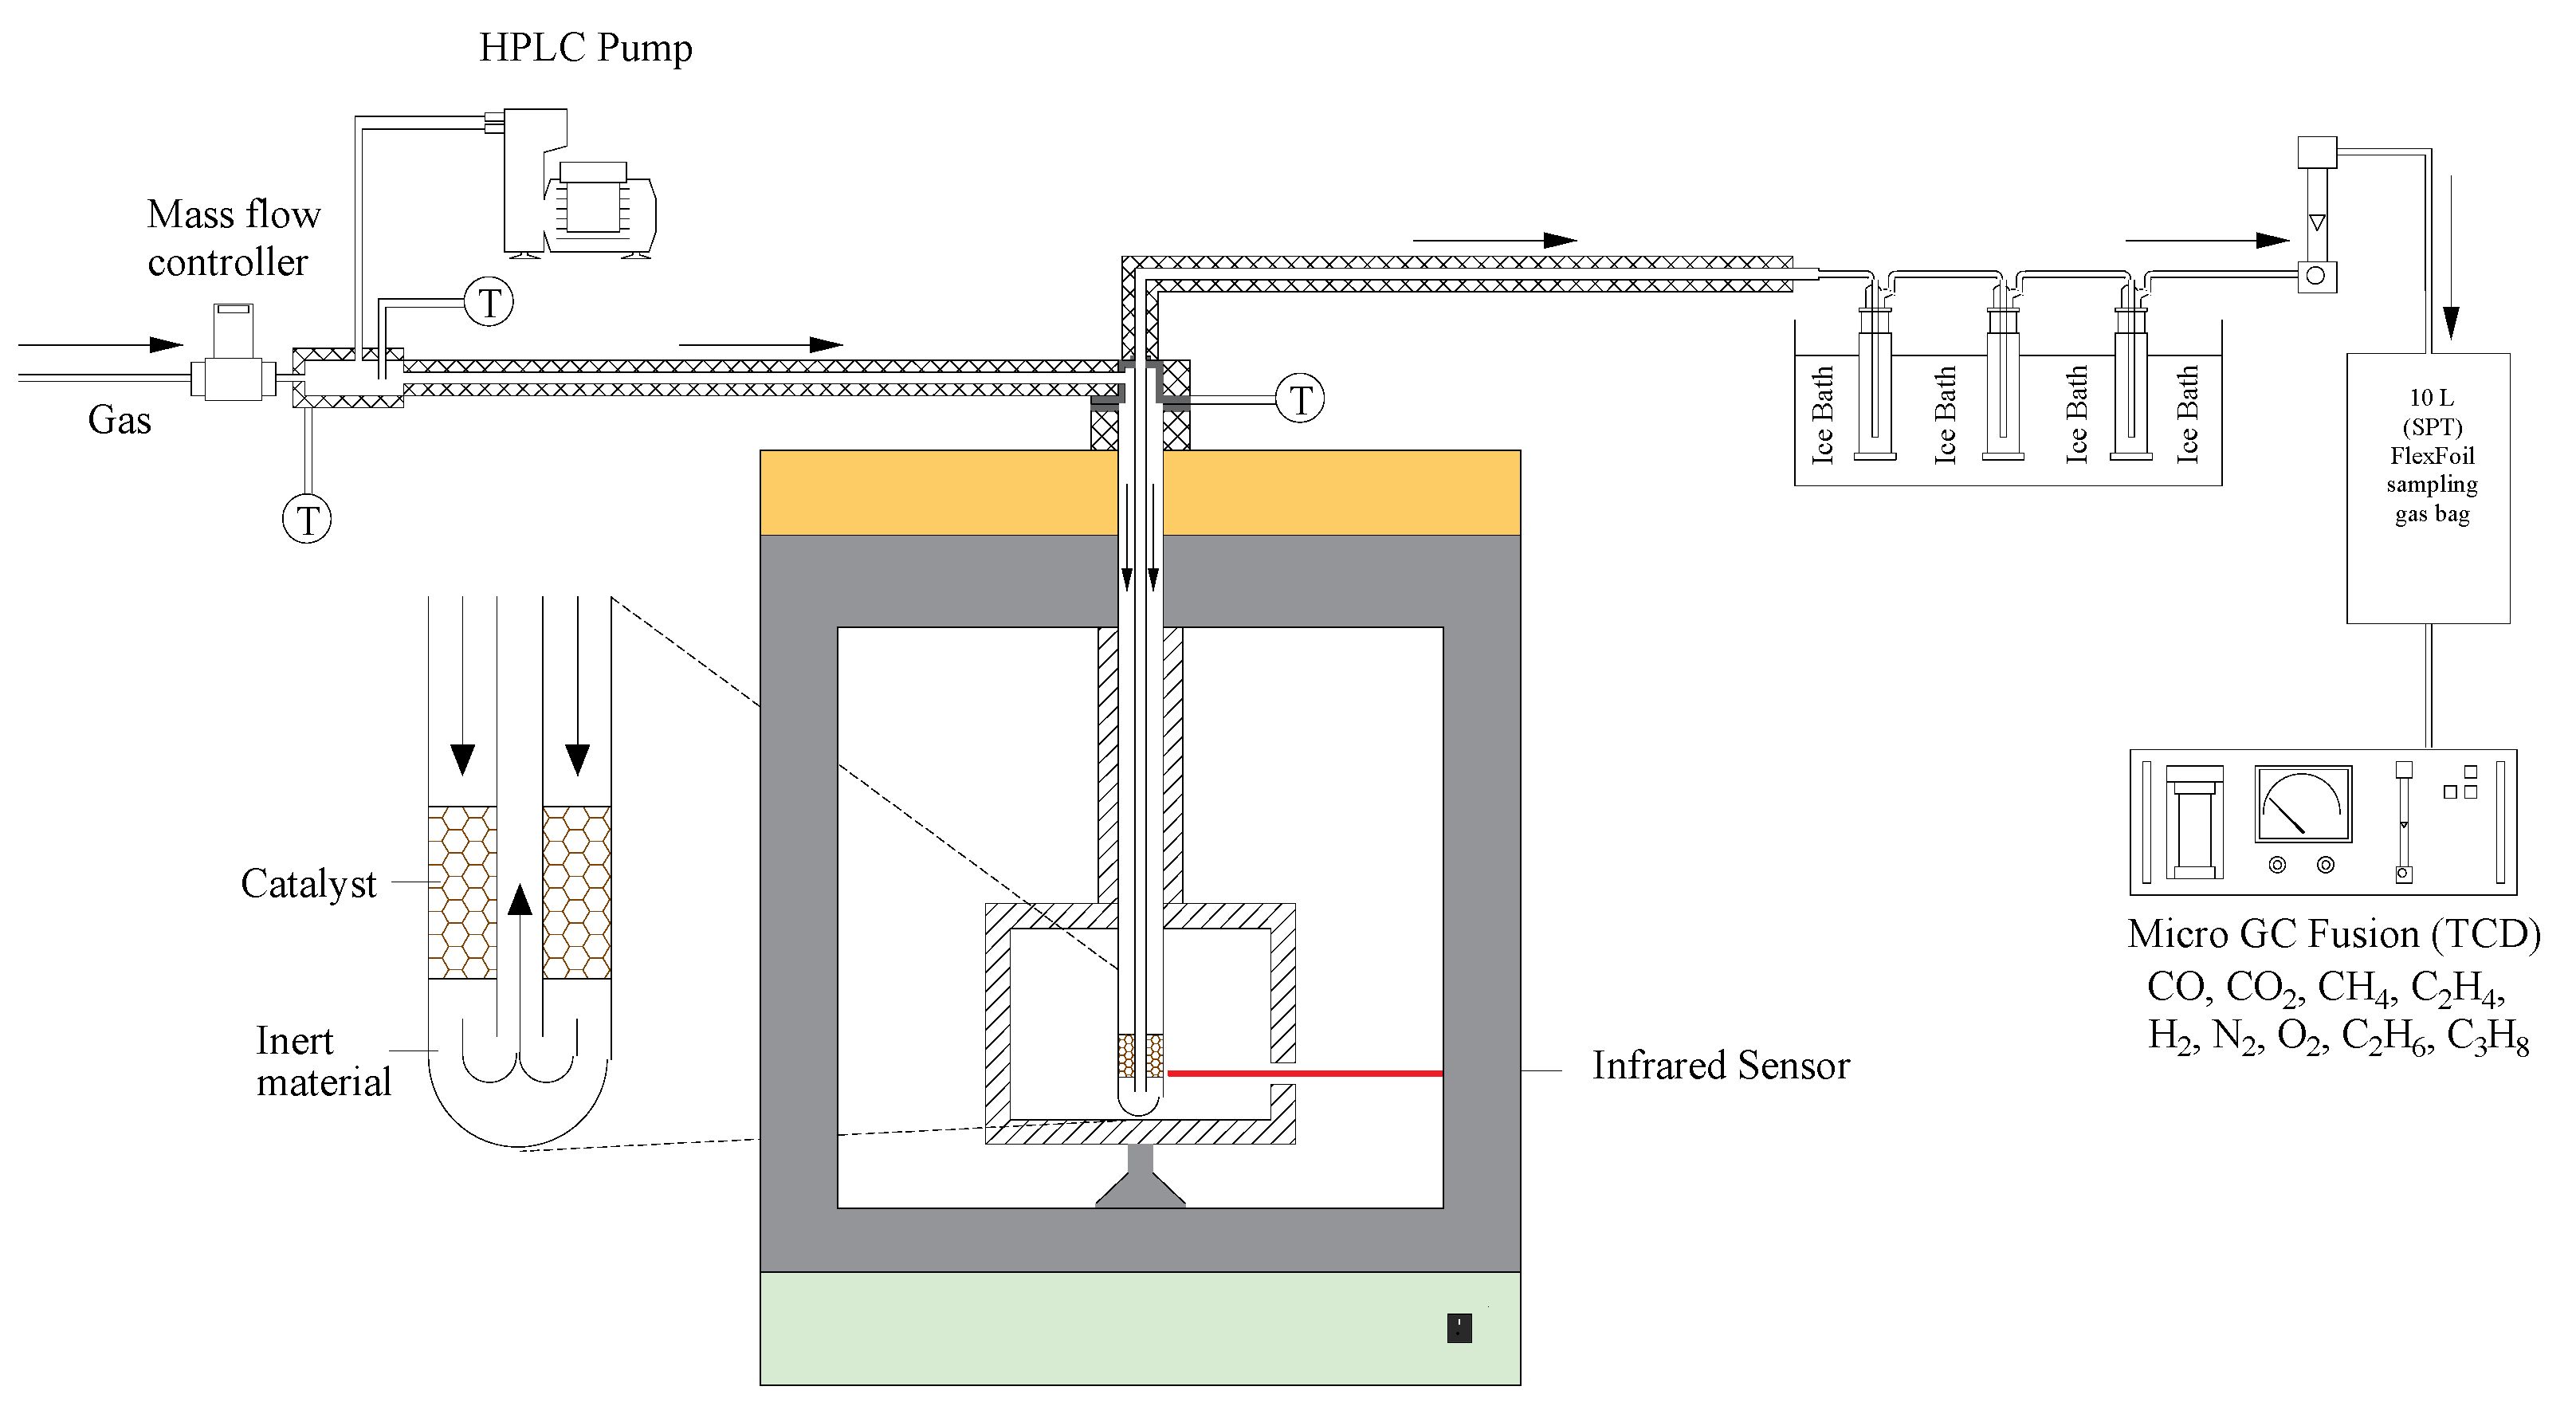
Testing of the WGS reaction was performed with and without catalyst (blank) using a 1.8 kW microwave system (PYRO Microwave Furnace, Milestone Srl., Milan, Italy) that contains a fixed-bed reactor, as shown in Figure 11. The microwave irradiation was performed through an industrial magnetron, connected to a power supply with 4 kV high tension and filament current. The system also incorporated an evaporator chamber, externally heated by a heater tape. Each experiment was performed following the same protocol: 15 g of catalyst supported on two layers of ceramic wool was loaded into the fixed-bed reactor and heated at 5 °C⋅min−1 in N2 atmosphere to the reaction temperature. Afterwards, H2O was injected into the evaporator by an HPLC pump (Jasco, PV-980 model, Tokyo, Japan) and carried by a gas mixture (0.5 LSTP·min−1) containing 10 vol.% CO and N2 (balance) into the reactor. The gas mixture was fed by a mass flow controller (MFC, Alicat, MCS Series, Alicat Scientific, Thane, India), whereas the temperature of the catalyst bed was controlled by an infrared sensor located on the right side of the unit. To prevent condensation, all lines were maintained at 250 °C through the use of heating tapes. At the reactor outlet, the gas product passed through a set of traps, which removed the unconverted water by condensation, before being collected in sample bags for off-line analysis by gas chromatography (Micro-GC Fusion, INFICON, Bad Ragaz, Switzerland, equipped with wall-coated open tubular (WCOT) and porous layer open tubular (PLOT) GC columns). The tests were performed at temperatures in the range 400–500 °C (microwave power from 410 to 520 W), with steam to carbon monoxide feed ratio (H2O:CO) in the range 2:1 to 4:1. The gas hourly space velocity (GHSV) changed from 5900–6750 h−1 due to steam addition. Some tests were also performed with a conventional electric furnace for comparison.
The performance of the WGS reaction was evaluated, by the conversion of CO and through H2 and CO2 yields, relative to the total contents of C-containing species in the gas mixture, at the reactor outlet, i.e.,
Y H 2 = n ˙ H 2 n ˙ C O + n ˙ C O 2 + n ˙ C H 4 +
Y C O 2 = n ˙ C O 2 n ˙ C O + n ˙ C O 2 + n ˙ C H 4 +
where n ˙ H2, n ˙ CO2 ,   n ˙ C O ,   n ˙ C H 4 + are the molar flow rates of H2, CO2  , C O ,   C H 4 … (mol⋅min−1) at the reactor outlet, respectively; this was best-suited to minimize the impact of experimental errors in critical steps such as injection of H2O in the evaporator or collection of samples for gas chromatography.

3.3. Catalyst Characterization

X-ray diffractograms of the as-prepared catalyst and spent catalyst were carried out using a PANalytical X’Pert PRO3 diffractometer equipped with graphite monochromator (CuKα radiation, scan step size = 0.02°) to monitor phase changes. Additionally, post-mortem analysis of the catalyst samples after WGS experiments was performed by Fourier-transform infrared spectroscopy (FTIR, Thermo Fisher Scientific, Waltham, MA, USA). The spectra of the samples were recorded by accumulating 64 scans at 4 cm−1 resolution in the spectral range of 400–4000 cm−1 using a Galaxy Series FT-IR 700 spectrometer equipped with a DTGS CsI detector. A scanning electron microscope (SEM, Hitachi, TM4000 Plus, Tokyo, Japan) equipped with energy dispersive X-ray spectroscopy (EDS Oxford Inca TEM250, Oxford Instruments, Abingdon, UK) was used for microstructural characterization and to assess eventual changes under the conditions of catalytic testing.
Quasi planar phase stability diagrams were derived for the Ca-Fe-O and Ca-Fe-O-C systems in representative redox conditions and represented as a function of the activity ratio a F e : a C a in the condensed phases, and oxygen partial pressure in the gas phase ( p O 2 ). Diagrams for the Ca-Fe-O system were derived by a method detailed elsewhere [54,55], and the extension for the Ca-Fe-O-C system is described in Appendix A.

4. Conclusions

Low-cost Ca2Fe2O5-based catalysts prepared from natural mineral precursors catalyzed the WGS reaction while hindering the side reaction of methanation and preventing carbon deposition; this confirmed prospects to enhance the H2 yield of producer gas. The catalytic performance achieved under microwave heating was also much better than by conventional electric heating. Post-mortem analyses of spent catalyst samples by XRD and FTIR provided evidence to interpret the catalytic activity of the actual Ca2Fe2O5-based catalysts, taking into account the onset of Fe3O4 and calcium carbonate polymorphs, combined with adsorbed CO2. Phase diagrams predicted for the Ca-Fe-O-C system also provided relevant guidelines for the mechanisms of CO oxidation, carbonation and onset of Fe3O4, in close relation with 3-phase contacts, or relying on the point defect chemistry of the brownmillerite phase; this allows variable oxygen stoichiometry by redox cycles, probably combined with deviations from ideal stoichiometry of the brownmillerite phase (Ca:Fe < 1). Ready onset of Fe3O4 under the redox conditions of WGS may also explain high prospects for microwave boosting, based on the superior magnetic properties of Fe3O4. Still, further work is required to reach a comprehensive understanding of the role of microwaves in catalytic performance.

Author Contributions

Conceptualization, I.A., L.C.M.R. and J.R.F.; Methodology, I.A., L.C.M.R. and J.R.F.; Validation, J.R.F.; Formal analysis, I.A. and J.R.F.; Investigation, I.A. and L.C.M.R.; Resources, L.A.C.T. and J.R.F.; Writing—original draft preparation, J.R.F.; Writing—review & editing, I.A., L.C.M.R., L.A.C.T. and J.R.F.; Supervision, J.R.F.; Project administration, L.A.C.T.; Funding acquisition, L.A.C.T. and J.R.F. All authors have read and agreed to the published version of the manuscript.

Funding

This research was funded through project NOTARGAS (ref. POCI-01-0145-FEDER-030661), CESAM–Centre for Environmental and Marine Studies (UIDB/50017/2020, UIDP/50017/2020, & LA/P/0094/2020), and CICECO–Aveiro Institute of Materials (UIDB/50011/2020, UIDP/50011/2020 & LA/P/0006/2020), financed by national funds through Portuguese Foundation for Science and Technology (FCT)/Ministry of Science, Technology and Higher Education (MCTES).

Data Availability Statement

Data are contained within the article.

Conflicts of Interest

The authors declare no conflict of interest.

Appendix A

Diagrams for the Ca-Fe-O system were computed from free-energy calculations of 2-solid phase equilibria, at constant temperature. Representative cases of 2-solid phase reactions may depend on p O 2 only (Equation (A1)), on the activity ratio a F e : a C a (Equation (A2)), or on both (Equation (A3)):
6 F e O + O 2 k 1 2 F e 3 O 4 ;
l o g p O 2 = G 1 2.30 R T
C a + F e 3 O 4 k 2 F e + C a F e 2 O 4 ;
l o g a F e a C a = G 2 2.30 R T
C a + 2 3 F e 3 O 4 k 3 F e + 0.5 C a 2 F e 2 O 5 + 1 12 O 2 ;
l o g a F e a C a = G 3 2.30 R T 1 12 l o g p O 2
Onset of C a C O 3 by reaction of CaO with atmospheric C O 2 (Equation (A4)) in the redox conditions of gasification can be coupled with C O / C O 2 equilibrium (Equation (A5)), to establish the redox dependence:
C a O + C O 2 k 4 C a C O 3
p C O 2 = 1 / k 4
C O + 0.5 O 2 k 5 C O 2
p C O 2 p C O = k 5 p O 2 1 / 2
In addition, one must consider another specific relation between these gases, such as the overall content p C O + p C O 2 p C determined by the chemical composition of the biomass and the relation between the gasification agent and biomass; this yields:
p C O 2 = p C 1 + k 5 p O 2 1 / 2 1
p C O = p C 1 + k 5 p O 2 1 / 2
Thus, on combining with Equation (A4), one obtains:
l o g p O 2 = 2 l o g k 5 k 4 p C 1
Redox conditions for onset of carbon can be described by disproportionation of carbon monoxide, combined with Equations (A6) and (A7):
2 C O k 9 C + C O 2
k 9 = p C O 2 p C O 2 = 1 + k 5 p O 2 1 / 2 k 5 p O 2 1 / 2 p C
Redox conditions for the onset of F e 3 C may be predicted for reactions of CO with metallic Fe or with iron oxides (FeO or F e 3 O 4 ), as shown in Table A1. In addition, Table A1 shows the 2-phase equilibria derived for C a C O 3 and mixed oxide phases ( C a 2 F e 2 O 5 or C a F e 2 O 4 ) or between C a C O 3 and different iron oxides (FeO, F e 3 O 4 or F e 2 O 3 ).
Table A1. Relevant equilibria of C-based species in the Ca-Fe-O-C system. The corresponding solid phases are shown in bold.
ReactionRedox Conditions
C a O + C O 2 k 4 C a C O 3 l o g p O 2 = 2 l o g k 5 k 4 p C 1
2 C O k 9 C + C O 2 k 9 = 1 + k 5 p O 2 1 / 2 k 5 p O 2 1 / 2 p C
3 F e + C O k 10 F e 3 C + 0.5 O 2 k 10 = 1 + k 5 p O 2 1 / 2 p O 2 1 / 2 p C
3 F e O + C O k 11 F e 3 C + 2 O 2 k 11 = 1 + k 5 p O 2 1 / 2 p O 2 2 p C
F e 3 O 4 + C O k 12 F e 3 C + 2.5 O 2 k 12 = 1 + k 5 p O 2 1 / 2 p O 2 2.5 p C
C a + 2 / 3 F e 3 C + 19 / 12 O 2 k 13 F e + 0.5 C a 2 F e 2 O 5 + 2 / 3 C O k 13 = a F e a C a p C 2 / 3 p O 2 19 / 12 1 + k 5 p O 2 1 / 2 2 / 3
C a + 1 / 3 F e 3 C + 2 / 3 O 2 k 14 F e + C a O + 1 / 3 C O k 14 = a F e a C a p C 1 / 3 p O 2 2 / 3 1 + k 5 p O 2 1 / 2 1 / 3
C a + 0.5 C a 2 F e 2 O 5 + 2 C O + 0.75 O 2 k 15 F e + 2 C a C O 3   k 15 = a F e a C a 1 + k 5 p O 2 1 / 2 2 p O 2 0.75 p C 2
C a + 0.5 C a F e 2 O 4 + 1.5 C O 2 k 16 F e + 1.5 C a C O 3 + 0.25 O 2 k 16 = a F e a C a 1 + k 5 p O 2 1 / 2 1 1.5 p O 2 0.25 p C 1.5
C a + F e O + C O + 1 / 2 O 2 k 17 F e + C a C O 3   k 17 = a F e a C a 1 + k 5 p O 2 1 / 2 p O 2 1 / 2 p C
C a + 1 / 3 F e 3 O 4 + C O + 1 / 3 O 2 k 18 F e + C a C O 3   k 18 = a F e a C a 1 + k 5 p O 2 1 / 2 p O 2 1 / 3 p C
C a + 0.5 F e 2 O 3 + C O 2  
k 19 F e + C a C O 3 + 0.25 O 2
k 19 = a F e a C a 1 + k 5 p O 2 1 / 2 1 p O 2 0.25 p C

References

  1. Pio, D.T.; Ruivo, L.C.M.; Tarelho, L.A.C.; Frade, J.R.; Kantarelis, E.; Engvall, K. Tar formation during eucalyptus gasification in a bubbling fluidized bed reactor: Effect of feedstock and reactor bed composition. Energy Convers. Manag. 2021, 229, 113749. [Google Scholar] [CrossRef]
  2. Ruivo, L.C.M.; Gomes, H.; Lopes, D.V.; Yaremchenko, A.A.; Vilas-Boas, C.; Tarelho, L.A.C.; Frade, J.R. Catalytic O2-steam gasification of biomass over Fe2−xMnxO3 oxides supported on ceramic foam filters. Fuel 2022, 324, 124566. [Google Scholar] [CrossRef]
  3. Chen, W.-H.; Chen, C.Y. Water gas shift reaction for hydrogen production and carbon dioxide capture: A review. Appl. Energy 2020, 258, 114078. [Google Scholar] [CrossRef]
  4. Chen, W.-H.; Jheng, J.-G.; Yu, A.B. Hydrogen generation from a catalytic water gas shift reaction under microwave irradiation. Int. J. Hydrogen Energy 2008, 33, 4789–4797. [Google Scholar] [CrossRef]
  5. Levalley, T.L.; Richard, A.R.; Fan, M. The progress in water gas shift and steam reforming hydrogen production technologies—A review. Int. J. Hydrogen Energy 2014, 39, 16983–17000. [Google Scholar] [CrossRef]
  6. Lang, C.; Sécordel, X.; Kiennemann, A.; Courson, C. Water gas shift catalysts for hydrogen production from biomass steam gasification. Fuel Process. Technol. 2017, 156, 246–252. [Google Scholar] [CrossRef]
  7. Meshkani, F.; Rezaei, M. High temperature water gas shift reaction over promoted iron based catalysts prepared by pyrolysis method. Int. J. Hydrogen Energy 2014, 39, 16318–16328. [Google Scholar] [CrossRef]
  8. Kim, S.H.; Nam, S.-W.; Lim, T.-H.; Lee, H.-I. Effect of pretreatment on the activity of Ni catalyst for CO removal reaction by water–gas shift and methanation. Appl. Catal. B Environ. 2008, 81, 97–104. [Google Scholar] [CrossRef]
  9. Kung, H.H. Deactivation of methanol synthesis catalysts—A review. Catal. Today 1992, 11, 443–453. [Google Scholar] [CrossRef]
  10. Pala, L.P.R.; Wang, Q.; Kolb, G.; Hessel, V. Steam gasification of biomass with subsequent syngas adjustment using shift reaction for syngas production: An Aspen Plus model. Renew. Energy 2017, 101, 484–492. [Google Scholar] [CrossRef]
  11. Kruse, A.; Dinjus, E. Influence of salts during hydrothermal biomass gasification: The role of the catalysed water-gas shift reaction. Z. Für Phys. Chem. 2005, 219, 341–366. [Google Scholar] [CrossRef]
  12. Huang, B.S.; Chen, H.Y.; Chuang, K.H.; Yang, R.X.; Wey, M.Y. Hydrogen production by biomass gasification in a fluidized-bed reactor promoted by an Fe/CaO catalyst. Int. J. Hydrogen Energy 2012, 37, 6511–6518. [Google Scholar] [CrossRef]
  13. Tang, G.; Gu, J.; Huang, Z.; Yuan, H.; Chen, Y. Cellulose gasification with Ca-Fe oxygen carrier in chemical-looping process. Energy 2022, 239, 122204. [Google Scholar] [CrossRef]
  14. Zamboni, I.; Courson, C.; Kiennemann, A. Fe-Ca interactions in Fe-based/CaO catalyst/sorbent for CO2 sorption and hydrogen production from toluene steam reforming. Appl. Catal. B Environ. 2017, 203, 154–165. [Google Scholar] [CrossRef]
  15. Chan, M.S.C.; Liu, W.; Ismail, M.; Yang, Y.; Scott, S.A.; Dennis, J.S. Improving hydrogen yields, and hydrogen:steam ratio in the chemical looping production of hydrogen using Ca2Fe2O5. Chem. Eng. J. 2016, 296, 406–411. [Google Scholar] [CrossRef]
  16. Wang, Y.; Niu, P.; Zhao, H. Chemical looping gasification of coal using calcium ferrites as oxygen carrier. Fuel Process. Technol. 2019, 192, 75–86. [Google Scholar] [CrossRef]
  17. Hirabayashi, D.; Yoshikawa, T.; Mochizuki, K.; Suzuki, K.; Sakai, Y. Formation of brownmillerite type calcium ferrite (Ca2Fe2O5) and catalytic properties in propylene combustion. Catal. Lett. 2006, 110, 269–274. [Google Scholar] [CrossRef]
  18. Shin, S.; Hatakeyama, Y.; Ogawa, K.; Shimomura, K.Y. Catalytic decomposition of NO over brownmillerite-like compounds, Ca2Fe2O5 and Sr2Fe2O5. Mater. Res. Bull. 1979, 14, 133–136. [Google Scholar] [CrossRef]
  19. Penkala, B.; Gatla, S.; Aubert, D.; Ceretti, M.; Tardivat, C.; Paulus, W.; Kaper, H. In situ generated catalyst: Copper(ii) oxide and copper(i) supported on Ca2Fe2O5 for CO oxidation. Catal. Sci. Technol. 2018, 8, 5236–5243. [Google Scholar] [CrossRef]
  20. Antunes, I.; Ruivo, L.C.M.; Tarelho, L.A.C.; Yaremchenko, A.A.; Frade, J.R. Solid state synthesis of Ca2Fe2O5 by reactive firing of calcite and siderite. Ceram. Int. 2022, 48, 34025–34032. [Google Scholar] [CrossRef]
  21. Wu, Y.; Liao, Y.; Liu, G.; Ma, X. Syngas production by chemical looping gasification of biomass with steam and CaO additive. Int. J. Hydrogen Energy 2018, 43, 19375–19383. [Google Scholar] [CrossRef]
  22. Ismail, M.; Liu, W.; Chan, M.S.C.; Dunstan, M.T.; Scott, S.A. Synthesis, application, and carbonation behavior of Ca2Fe2O5 for chemical looping H2 production. Energy Fuels 2016, 30, 6220–6232. [Google Scholar] [CrossRef]
  23. Ikenaga, N.; Ohgaito, Y.; Suzuki, T. H2S absorption behavior of calcium ferrite prepared in the presence of coal. Energy Fuels 2005, 19, 170–179. [Google Scholar] [CrossRef]
  24. Shaula, A.L.; Markov, A.A.; Naumovich, E.N.; Waerenborgh, J.C.; Pivak, Y.V.; Kharton, V.V. Redox behaviour and transport properties of brownmillerite Ca2(Fe,M)2Oδ (M = Mn, Co). Solid. State Ion. 2012, 225, 206–210. [Google Scholar] [CrossRef]
  25. Kharton, V.V.; Tsipis, E.V.; Kolotygin, V.A.; Avdeev, M.; Viskup, A.P.; Waerenborgh, J.C.; Frade, J.R. Mixed Conductivity and Stability of CaFe2O4−δ. J. Electrochem. Soc. 2008, 155, 13–20. [Google Scholar] [CrossRef]
  26. Sun, S.Z.; He, S.; Wu, C.F. Ni promoted Fe-CaO dual functional materials for calcium chemical dual looping. Chem. Eng. J. 2022, 441, 135752. [Google Scholar] [CrossRef]
  27. Sun, Z.; Chen, S.; Russell, C.K.; Hu, J.; Rony, A.H.; Tan, G.; Chen, A.; Duan, L.; Boman, J.; Tang, J.; et al. Improvement of H2-rich gas production with tar abatement from pine wood conversion over bi-functional Ca2Fe2O5 catalyst: Investigation of inner looping redox reaction and promoting mechanisms. Appl. Energy 2018, 212, 931–943. [Google Scholar] [CrossRef]
  28. Smith, R.; Loganathan, M.; Shantha, M.S. A review of the water gas shift reaction kinetics. Int. J. Chem. React. Eng. 2010, 8, 4. [Google Scholar] [CrossRef]
  29. Devi, L.; Ptasinski, K.J.; Janssen, F.J.J.G. A review of the primary measures for tar elimination in biomass gasification processes. Biomass Bioenergy 2003, 24, 125–140. [Google Scholar] [CrossRef]
  30. Chen, W.-H.; Cheng, T.-C.; Hung, C.-I.; Lin, B.-J. Chemical reactions and kinetics of a low-temperature water gas shift reaction heated by microwaves. Int. J. Hydrogen Energy 2012, 37, 276–289. [Google Scholar] [CrossRef]
  31. Priecel, P.; Lopez-Sanchez, J.A. Advantages and limitations of microwave reactors: From chemical synthesis to the catalytic valorization of biobased chemicals, with significant improvement in H2 yield. ACS Sustain. Chem. Eng. 2019, 7, 3–21. [Google Scholar] [CrossRef]
  32. Chen, Y.; Lin, J.; Li, L.; Qiao, B.; Liu, J.; Su, Y.; Wang, X. Identifying size effects of Pt as single atoms and nanoparticles supported on FeOx for the water-gas shift reaction. ACS Catal. 2018, 8, 859–868. [Google Scholar] [CrossRef]
  33. Saw, E.; Oemar, U.; Tan, X.; Du, Y.; Borgna, A.; Hidajat, K.; Kawit, S. Bimetallic Ni–Cu catalyst supported on CeO2 for high-temperature water–gas shift reaction: Methane suppression via enhanced CO adsorption. J. Catal. 2014, 314, 32–46. [Google Scholar] [CrossRef]
  34. Kolle, J.M.; Fayaz, M.; Sayari, A. Understanding the effect of water on CO2 adsorption. Chem. Rev. 2021, 121, 7280–7345. [Google Scholar] [CrossRef] [PubMed]
  35. Wan, D.; Zhang, H.; Liu, M.; Fu, Y.; Zhang, Z.S.X.; Zhong, Q. The characterization and mechanism of carbonated steel slag and its products under low CO2 pressure. Mater. Today Commun. 2023, 35, 105827. [Google Scholar] [CrossRef]
  36. Bekhti, H.; Boucheffa, Y.; Blal, A.H.A.; Travert, A. In situ FTIR investigation of CO2 adsorption over MgO–Impregnated NaY Zeolite. Vib. Spectrosc. 2021, 117, 103313. [Google Scholar] [CrossRef]
  37. Namduri, H.; Nasrazadani, S. Quantitative analysis of iron oxides using Fourier transform infrared spectrophotometry. Corros. Sci. 2008, 50, 2493–2497. [Google Scholar] [CrossRef]
  38. Zhao, J.; Deng, S.; Zhao, L.; Yuan, X.; Wang, B.; Chen, L.; Wu, K. Synergistic and competitive effect of H2O on CO2 adsorption capture: Mechanism explanations based on molecular dynamic simulation. J. CO2 Util. 2021, 52, 101662. [Google Scholar] [CrossRef]
  39. Patterson, A.L. The Scherrer formula for X-ray particle size determination. Phys. Rev. 1939, 56, 978–982. [Google Scholar] [CrossRef]
  40. Malveiro, J.; Ramos, T.; Ferreira, L.P.; Waerenborgh, J.C.; Nunes, M.R.; Godinho, M.; Carvalho, M.D. Magnesium doping on brownmillerite Ca2FeAlO5. J. Solid State Chem. 2007, 180, 1863–1874. [Google Scholar] [CrossRef]
  41. Phan, T.-L.; Tran, N.; Kim, D.H.; Tho, P.T.; Huy, B.T.; Dang, T.N.; Yang, D.-S.; Lee, B. Electronic structure and magnetic properties of Al-doped Ca2Fe2O5 brownmillerite compounds. J. Am. Ceram. Soc. 2018, 101, 2181–2189. [Google Scholar] [CrossRef]
  42. Hunt, J.; Ferrari, A.; Lita, A.; Crosswhite, M.; Ashley, B.; Stiegman, A.E. Microwave-specific enhancement of the carbon−carbon dioxide (Boudouard) reaction. J. Phys. Chem. C 2013, 117, 26871–26880. [Google Scholar] [CrossRef]
  43. Tanaka, M.; Kono, H.; Maruyama, K. Selective heating mechanism of magnetic metal oxides by a microwave magnetic field. Phys. Rev. B 2009, 79, 104420. [Google Scholar] [CrossRef]
  44. Shaula, A.L.; Pivak, Y.V.; Waerenborgh, J.C.; Gaczyñski, P.; Yaremchenko, A.A.; Kharton, V.V. Ionic conductivity of brownmillerite-type calcium ferrite under oxidizing conditions. Solid. State Ion. 2006, 177, 2923–2930. [Google Scholar] [CrossRef]
  45. Karbi, S.B.; Hona, R.K.; Ramezanipour, F. Effect of structure on sensor properties of oxygen-deficient perovskites, A2BB’O5 (A = Ca, Sr; B = Fe; B’ = Fe, Mn) for oxygen, carbon dioxide and carbon monoxide sensing. Electron. Mater. 2020, 49, 1557–1567. [Google Scholar] [CrossRef]
  46. Wang, J.; Gu, J.; Rony, A.; Fan, M.; Leszczynsky, J. Theoretical DFT study on the mechanisms of CO/CO2 conversion in chemical looping catalyzed by calcium ferrite. J. Phys. Chem. A 2021, 125, 8159–8167. [Google Scholar] [CrossRef] [PubMed]
  47. Feng, Y.; Wang, N.; Guo, X.; Zhang, S. Reaction mechanism of Ca2Fe2O5 oxygen carrier with CO in chemical looping hydrogen production. Appl. Surf. Sci. 2020, 534, 147583. [Google Scholar] [CrossRef]
  48. Fisher, C.A.J.; Islam, M.S. Mixed ionic/electronic conductors Sr2Fe2O5 and Sr4Fe6O13: Atomic-scale studies of defects and ion migration. J. Mater. Chem. 2005, 15, 3200–3207. [Google Scholar] [CrossRef]
  49. Chen, L.; Zhang, J.; Liang, X. Reducing gas atmosphere (H2, CO) assisted formation of Fe-Ce-Ox composite oxides with enhanced catalytic activity for water-gas shift reaction. Catal. Commun. 2020, 138, 105849. [Google Scholar] [CrossRef]
  50. Galeano, Y.M.; Negri, F.; Moreno, M.S.; Múnera, J.; Cornaglia, L.; Tarditi, A.M. Pt encapsulated into NaA zeolite as catalyst for the WGS reaction. Appl. Catal. A Gen. 2019, 572, 176–184. [Google Scholar] [CrossRef]
  51. Ruivo, L.; Oliveira, H.; Gomes, H.; Cruz, N.; Yaremchenko, A.; Tarelho, L.A.C.; Frade, J. Siderite/Concrete catalysts for H2-enriched gas production from biomass steam gasification. Energy Convers. Manag. 2022, 255, 115280. [Google Scholar] [CrossRef]
  52. Ruivo, L.C.M.; Pio, D.T.; Yaremchenko, A.A.; Tarelho, L.A.C.; Frade, J.R.; Kantarelis, E.; Engvall, K. Iron-based catalyst (Fe2−xNixTiO5) for tar decomposition in biomass gasification. Fuel 2021, 300, 120859. [Google Scholar] [CrossRef]
  53. Ruivo, L.; Silva, T.; Neves, D.; Tarelho, L.; Frade, J. Thermodynamic guidelines for improved operation of iron-based catalysts in gasification of biomass. Energy 2023, 268, 126641. [Google Scholar] [CrossRef]
  54. Yokokawa, H.; Kawada, T.; Dokiya, M. Construction of chemical potential diagrams for metal-metal-nonmetal systems: Applications to the decomposition of double oxides. J. Am. Ceram. Soc. 1989, 72, 2104–2110. [Google Scholar] [CrossRef]
  55. Yokokawa, H.; Sakai, N.; Kawada, T.; Dokiya, M. Thermodynamic stabilities of perovskite oxides for electrodes and other electrochemical materials. Solid. State Ion. 1992, 52, 43–56. [Google Scholar] [CrossRef]
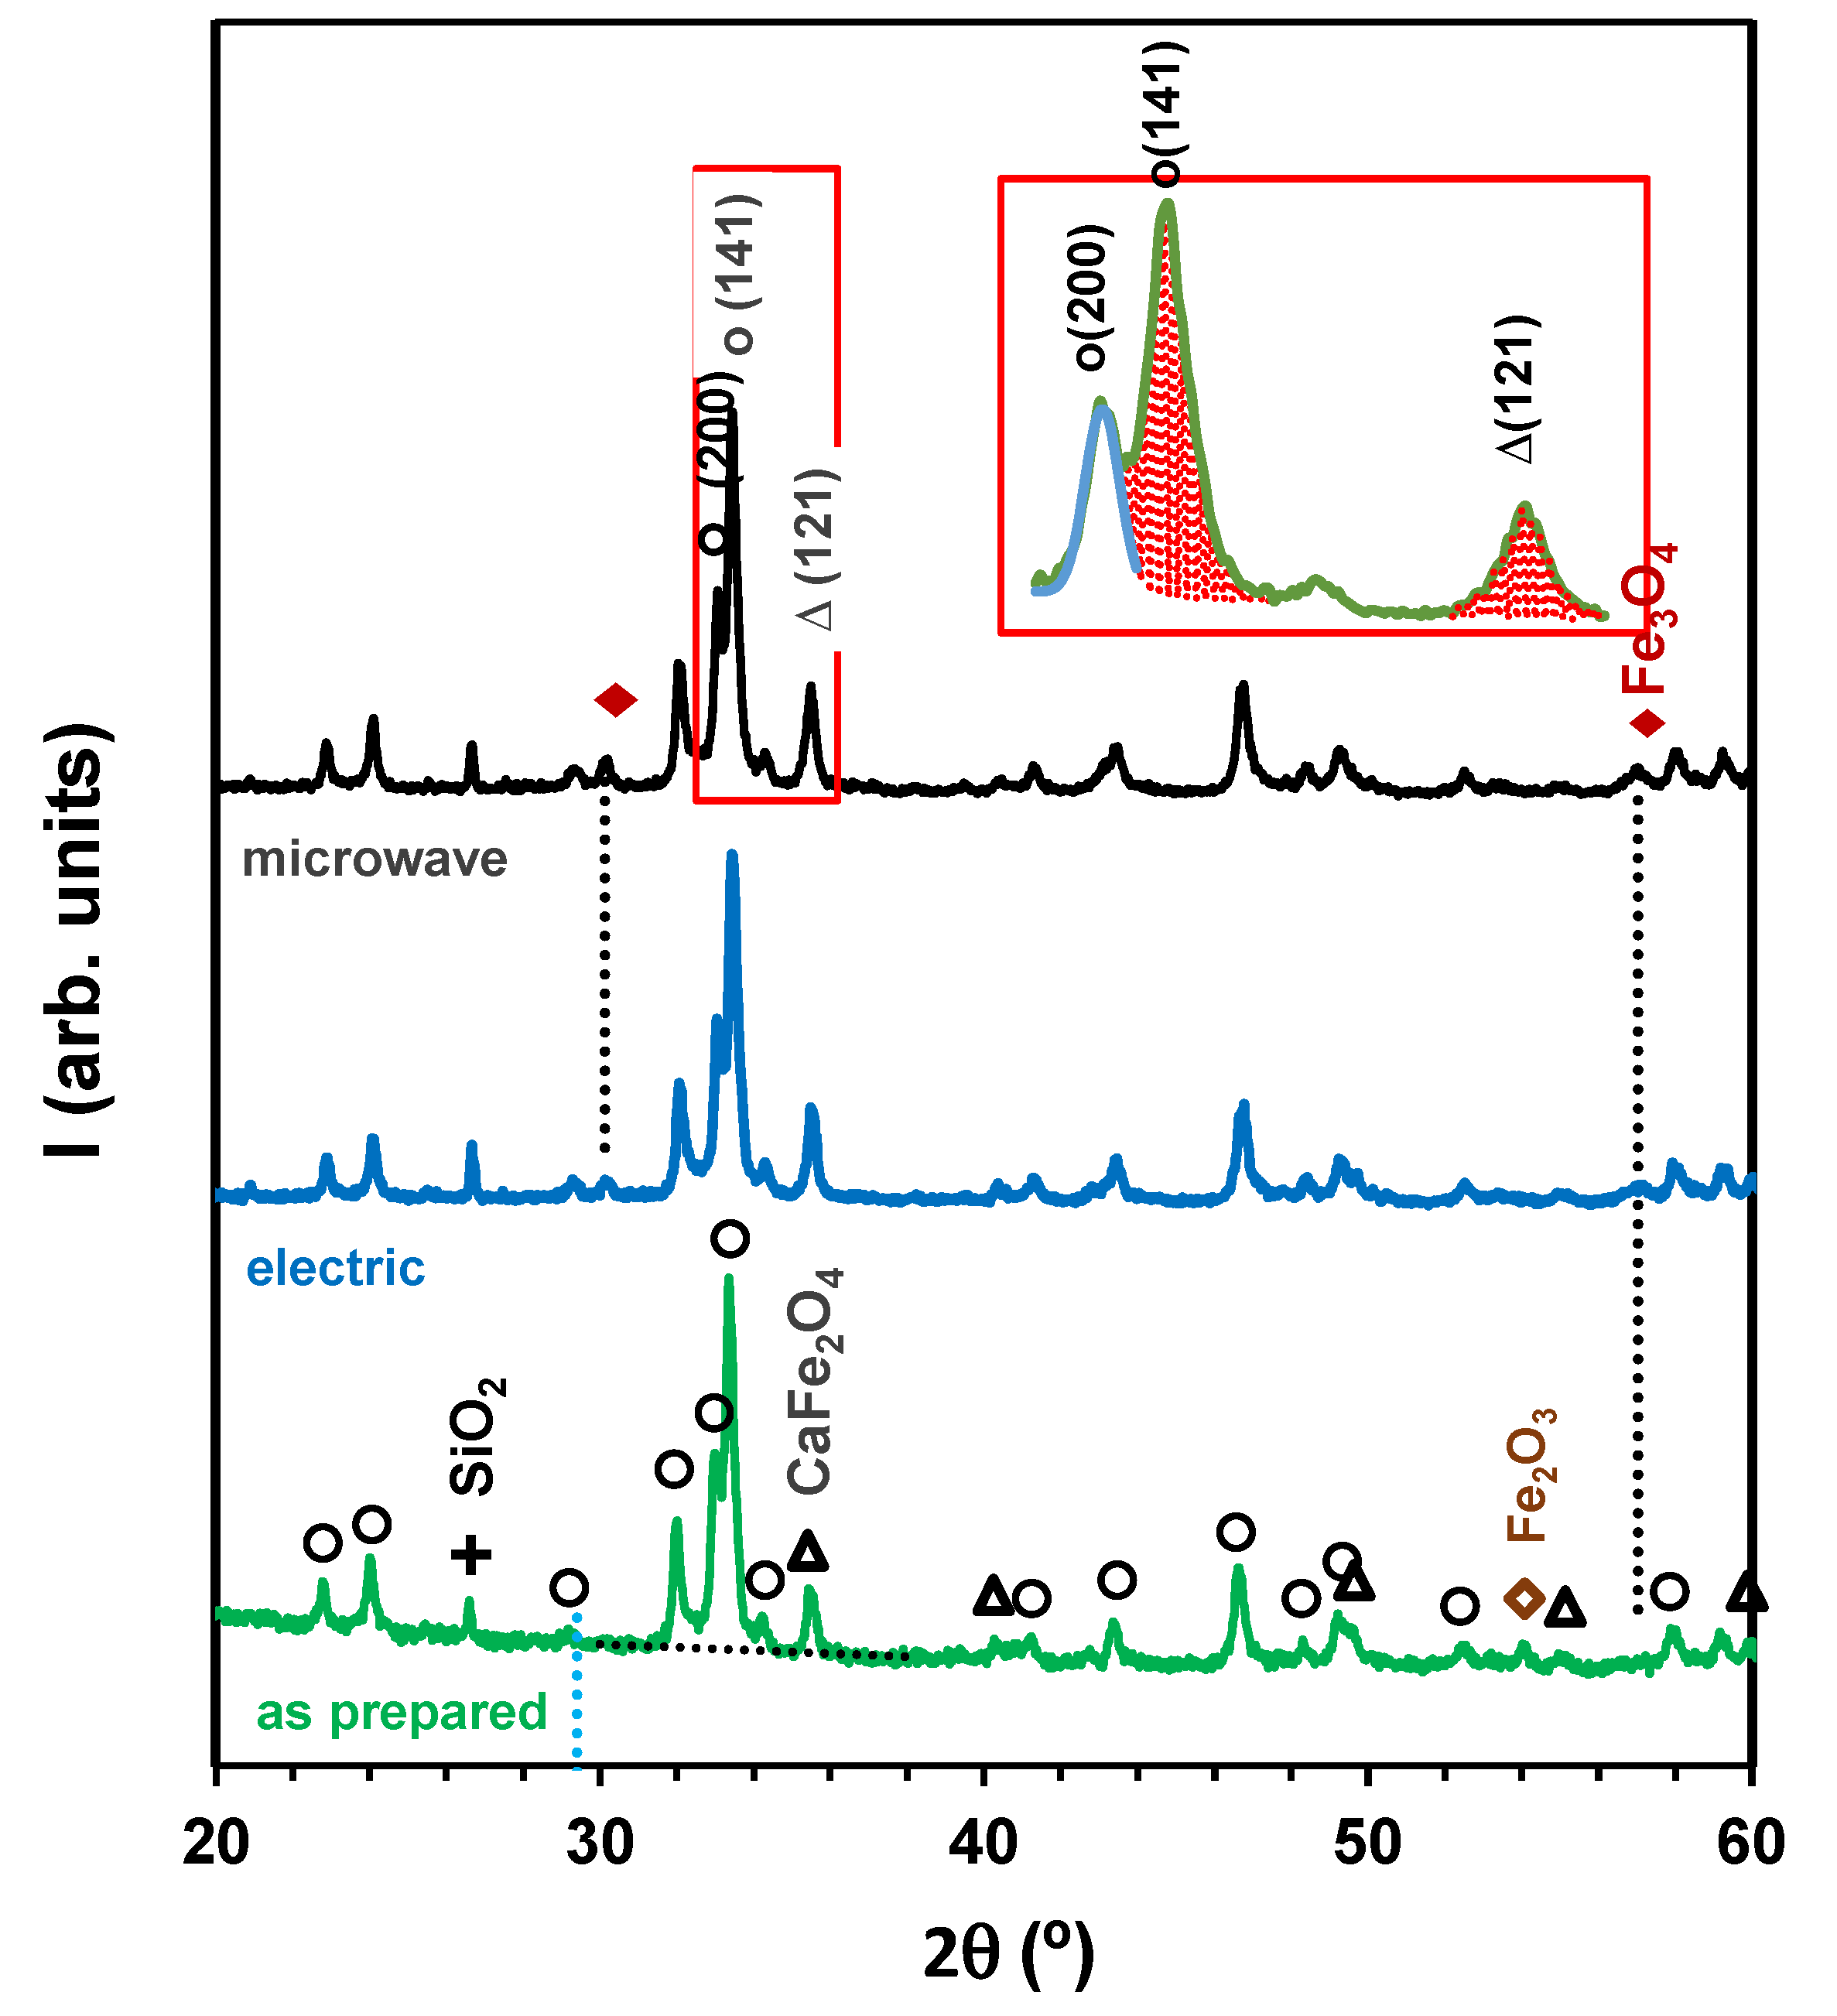
Figure 1. X-ray diffractograms of as-prepared catalyst samples and spent catalysts after water gas shift testing at 500 °C, with H2O:CO ratio = 3:1 and GHSV = 5900–6750 h−1, in conventional electric furnace or microwave heating. The markers identify reflections ascribed to Ca2Fe2O5 (◯), () CaFe2O4, (+) SiO2, () Fe2O3 and () Fe3O4.
Catalysts 14 00012 g001
Figure 2. Temperature dependence of CO conversion and yields of H2, CO2 and CH4 in equilibrium and corresponding experimental results for feed ratio H2O:CO = 2 and GHSV = 5900–6750 h−1.
Catalysts 14 00012 g002
Figure 3. Temperature dependence of yields of H2, CO2 and CH4 in equilibrium and corresponding experimental results vs. the feed ratio H2O:CO (S/CO), at 500 °C and for GHSV = 5900–6750 h−1.
Catalysts 14 00012 g003
Figure 4. X-ray diffractograms of as-prepared catalyst samples and spent catalysts after water gas shift testing under different combinations of temperature and H2O:CO ratio (S/CO), with microwave irradiation. The markers identify reflections ascribed to Ca2Fe2O5 (◯), () CaFe2O4, (+) SiO2, () Fe2O3 and () Fe3O4. The calcite and aragonite, polymorphs of CaCO3 are identified by (c) and (a).
Catalysts 14 00012 g004
Figure 5. FTIR spectra of the as-prepared catalysts and spent catalyst samples tested at different combinations of temperature and H2O:CO ratio (S/CO).
Catalysts 14 00012 g005
Figure 6. Scanning electron microstructures of a spent catalyst after testing at 500 °C, with feed ratio H2O:CO = 2, under microwave irradiation.
Catalysts 14 00012 g006
Figure 7. Phase stability for the Ca−Fe−O−C diagram vs. oxygen partial pressure, at 800 °C and in equilibrium with CO/CO2 atmospheres, under p C = p C O + p C O 2 = 1   a t m . The secondary horizontal axis shows the corresponding scale for the CO2:CO ratio.
Catalysts 14 00012 g007
Figure 8. Phase stability for the Ca−Fe−O−C diagram vs. oxygen partial pressure, at 400 °C for p C = p C O + p C O 2 0.03   a t m (top) and 0.007   a t m (bottom). The secondary horizontal axis shows the corresponding scale for the C O : C O 2 ratio. The shaded area shows the redox range that should give rise to deposition of carbon in equilibrium with the gas mixture. The vertical blue lines show the expected redox condition for a feed ratio H 2 O : C O = 2 in equilibrium (dotted line) or based on the experimental results for the CO2:CO ratio (dashed line).
Catalysts 14 00012 g008
Figure 9. Phase stability for the Ca−Fe−O−C diagram vs. oxygen partial pressure, at 450 °C for p C = p C O + p C O 2 0.03   atm . The vertical blue line shows the expected redox condition for a feed ratio H 2 O : C O = 2 in equilibrium (dotted line) or based on the experimental results for the CO2:CO ratio (dashed line).
Catalysts 14 00012 g009
Figure 10. Phase stability for the Ca−Fe−O−C diagram vs. oxygen partial pressure, at 500 °C for p C = p C O + p C O 2 0.03   a t m , and feed ratio H 2 O : C O = 2 . The dotted vertical line shows the equilibrium condition for the gas mixtures, and the dashed vertical line the experimental results for the CO2:CO ratio.
Catalysts 14 00012 g010
Figure 11. Schematic representation of the experimental apparatus used for water gas shift reaction tests in a microwave chamber.
Catalysts 14 00012 g011
Table 1. CO conversion to CO2 and corresponding yield of H2 obtained by water gas shift reaction at 500 °C, under feed ratio H2O:CO = 3, without catalysts (blank) and with the C a 2 F e 2 O 5 -based catalyst, performed with conventional electric heating or microwave heating.
Heating TypeYield (%)BlankCatalyst
ConventionalCO20.217
Microwave0.461
ConventionalH20.116
Microwave0.258
Table 2. Comparison of relevant WGS catalytic results with corresponding results from literature sources.
T (°C)H2O:COGHSV
(h−1)
CatalystHeatingXCO (%)H2 Yield (%)Ref.
4001:1≈28,000(Fe-Cr)-basedelectric ≈49[4]
500 ≈50
400microwave ≈44
500 ≈58
4002:1≈49
4004:1≈67
5002:1≈71
2002:1≈28,000(Cu-Zn)-basedmicrowave≈42 [30]
3002:1≈62
3004:1≈93
4001.25:1≈6000Ce-Fe-Oxelectric≈36–46 [49]
500≈71–84
3002:1≈9000Pt-NaA zeoliteelectric≈15 [50]
400≈68
5002:114,500–18,25075%sid. + 25%conc.electric19 [51]
6003:114,500–18,25075%sid. + 25%conc.47
5003:114,500–18,25050%sid. + 50%conc.48
6001:114,500–18,25050%sid. + 50%conc.40
4002:1≈6000Ca2Fe2O5microwave106present work
5002:15251
5003:16658
5003:1electric2416
5003:1blankmicrowave90.2
Disclaimer/Publisher’s Note: The statements, opinions and data contained in all publications are solely those of the individual author(s) and contributor(s) and not of MDPI and/or the editor(s). MDPI and/or the editor(s) disclaim responsibility for any injury to people or property resulting from any ideas, methods, instructions or products referred to in the content.