Article

Catalytic Hydrodeoxygenation of Solar Energy Produced Bio-Oil in Supercritical Ethanol with Mo2C/CNF Catalysts: Effect of Mo Concentration

by
Alejandro Ayala-Cortés
1,*,
Daniel Torres
1,
Esther Frecha
1,
Pedro Arcelus-Arrillaga
2,
Heidi Isabel Villafán-Vidales
3,
Adriana Longoria
4,
José Luis Pinilla
1,* and
Isabel Suelves
1
1
Instituto de Carboquímica, CSIC, Miguel Luesma Castán 4, 50018 Zaragoza, Spain
2
Department of Chemical Engineering, Faculty of Engineering and Informatics, University of Bradford, Bradford BD7 1DP, West of Yorkshire, UK
3
Instituto de Energías Renovables, UNAM, Priv. Xochicalco S/N, Temixco 62580, Morelos, Mexico
4
CICATA Unidad Morelos, Instituto Politécnico Nacional, Boulevard de la Tecnología, 1036 Z-1T P 2/2, Atlacholoaya 62790, Morelos, Mexico
*
Authors to whom correspondence should be addressed.
Catalysts 2023, 13(12), 1500; https://doi.org/10.3390/catal13121500
Submission received: 31 October 2023 / Revised: 5 December 2023 / Accepted: 6 December 2023 / Published: 8 December 2023

Abstract

:
Transition metal carbides have emerged as an attractive alternative to conventional catalysts in hydrodeoxygenation (HDO) reactions due to surface reactivity, catalytic activity, and thermodynamic stability similar to those of noble metals. In this study, the impact of varying Mo concentration in carbon nanofiber-supported catalysts for the supercritical ethanol-assisted HDO of bio-oils in an autoclave batch reactor is discussed. Raw bio-oils derived from agave bagasse and corncob through solar hydrothermal liquefaction were treated at 350 °C. Our findings indicate that the presence of Mo has a strong impact on both product yield and chemical properties. Thus, a Mo concentration of 10 wt.% is enough to obtain high deoxygenation values (69–72%), resulting in a yield of upgraded bio-oil ranging between 49.9 and 60.4%, depending on the feedstock used, with an energy content of around 35 MJ/kg. A further increase in the Mo loadings (20 and 30 wt.%) reduced the loss of carbon due to gasification and improved the bio-oil yields up to 62.6 and 67.4%, without compromising the product quality.

Graphical Abstract

1. Introduction

Catalytic hydrodeoxygenation (HDO) is considered to be one of the most efficient methods for improving the quality of raw bio-oils. Operational conditions for HDO typically involve temperatures in the range of 250–500 °C and 20 to 300 hydrogen pressures. The primary objective of these conditions is to reduce oxygen content in the upgraded bio-oils [1,2,3,4]. Many catalyst systems can be applied to increase H2 efficiency and minimize the carbon loss. Common commercial catalysts for HDO are based on sulfided, cobalt- and nickel-promoted molybdenum (CoMoS and NiMoS), mainly because of their high catalytic activity. However, the use of conventional sulfided catalysts often leads to coke formation and its progressive deactivation, as well as potential contamination of products due to sulfur incorporation [5,6]. Other options for HDO catalysts are noble metals, which show exceptional activity and high selectivity to saturated hydrocarbons [4]. Nevertheless, cost-effectiveness and their limited availability are some of the main challenges to their effective application for HDO. As a consequence, alternatives with earth-abundant elements have been explored for catalytic processes. Back in 1973, Levy and Boudart found a similarity between the properties of platinum and transition metal carbides as catalysts in terms of surface reactivity, catalytic activity, and thermodynamic stability in reactions involving H2. This resemblance prompted the use of transition metal carbides in different processes, such as hydrazine decomposition, ammonia synthesis, isomerization, and hydroprocessing [7,8,9,10].
Many works in the literature have focused on studying molybdenum carbide (Mo2C) catalysts, supported in different materials such as carbon nanofibers, graphene, activated carbon, Al2O3, and ZrO2 [6,11,12,13,14,15] in hydrodeoxygenation processes for treating model compounds (guaiacol, anisole, phenol, octanol, acrylic acid, and phenolic compound mixtures) [6,11,12,13,14,16,17,18,19] or real bio-oils [15,20,21]. However, only a few works have assessed the influence of Mo concentration within Mo2C catalysts for HDO processes. In one such example, Ranga et al. [22] addressed the combined effect of the Co/Mo ratio as a bimetallic catalyst in the HDO treatment of anisole as a model compound. In a concurrent direction, Chen et al. [23] upgraded methyl laurate with a bimetallic catalyst employing different ratios of Ni/Mo. Furthermore, López et al. [24] used hydrodeoxygenated palm oil to compare Mo2C against NiMo and found that the Mo2C catalyst has the ability to produce more cyclic hydrocarbons than the NiMo catalyst, which favors the linear hydrocarbon formation. Ameen et al. [25] studied the HDO of rubber seed oil using Mo/Al2O3 and Ni/Al2O3 with Mo concentrations of 3, 12, and 15 wt.%. The main findings show that Ni catalysts tend to follow decarboxylation reactions; meanwhile, higher Mo loadings in catalysts tend to enhance HDO reactions. Likewise, Qin et al. [26] studied the influence of different Mo2C loadings (5–40 wt.%) in Mo2C/CNF catalysts for the HDO of vegetable oils. Their results showed that yield increases as Mo2C/CNF catalyst/g increases by 5, 10 and 20%. However, further concentrations of 20 and 40% remain with minor differences. All these cases, however, leave the monometallic effect of Mo loadings unexplored in carbide-supported catalysts for the HDO of bio-oils.
One disadvantage of HDO as an upgrading treatment for bio-oils is the high viscosity, which often provokes transport problems [27,28]. In this context, the use of solvents to dissolve the raw bio-oil appears as an option to decrease viscosity and reduce the loss of upgraded oil due to coke production [29]. A second drawback that economically compromises the viability of the HDO is the costs associated with the high hydrogen consumption. Hence, using a solvent that acts as a hydrogen donor [30,31] while promoting transport properties is worth considering in the upgrading treatment. In particular, it has been reported that the use of supercritical alcohols in HDO represents an advantageous reaction media [32,33], by favoring mass and heat transfer. The benefits associated with supercritical fluids relate to their liquid-like and gas-like properties, including high density, dissolving power, diffusivity, and low viscosity, which eventually promote a pseudohomogeneous media for the reaction [29,34]. Additionally, alcohols are seen as hydrogen donors as a consequence of their dissociation into H2 under supercritical conditions.
Bio-oils can be produced from biomass through thermochemical conversion routes, such as pyrolysis and hydrothermal liquefaction. To the best of the authors’ knowledge, a large body of research on the HDO process has utilized bio-oils obtained from pyrolysis and hydrothermal liquefaction heated by conventional sources, such as electricity or fossil fuels. Instead, the use of concentrated solar technologies (CSTs) offers an appealing alternative to enhance the thermal energy efficiency of thermochemical biomass conversion processes, such as hydrothermal liquefaction. For instance, it has been estimated that the efficiency of hydrothermal liquefaction can be improved from 56% in a non-renewable heating system [35] to a range of 74–90% when applying CST approaches [35,36,37], whereas its energy requirement and environmental impact are reduced to levels of 54 and 58%, respectively [33,35].
Given this background, the present study investigates, for the first time, the impact of varying concentrations of Mo in a Mo2C/CNF catalyst on the supercritical ethanol-assisted hydrodeoxygenation of real bio-oils obtained through solar hydrothermal processing of biomass. A detailed account of the influence of Mo concentration on the catalyst on the chemical properties of the upgraded oil, yields, and selectivity is depicted.

2. Results

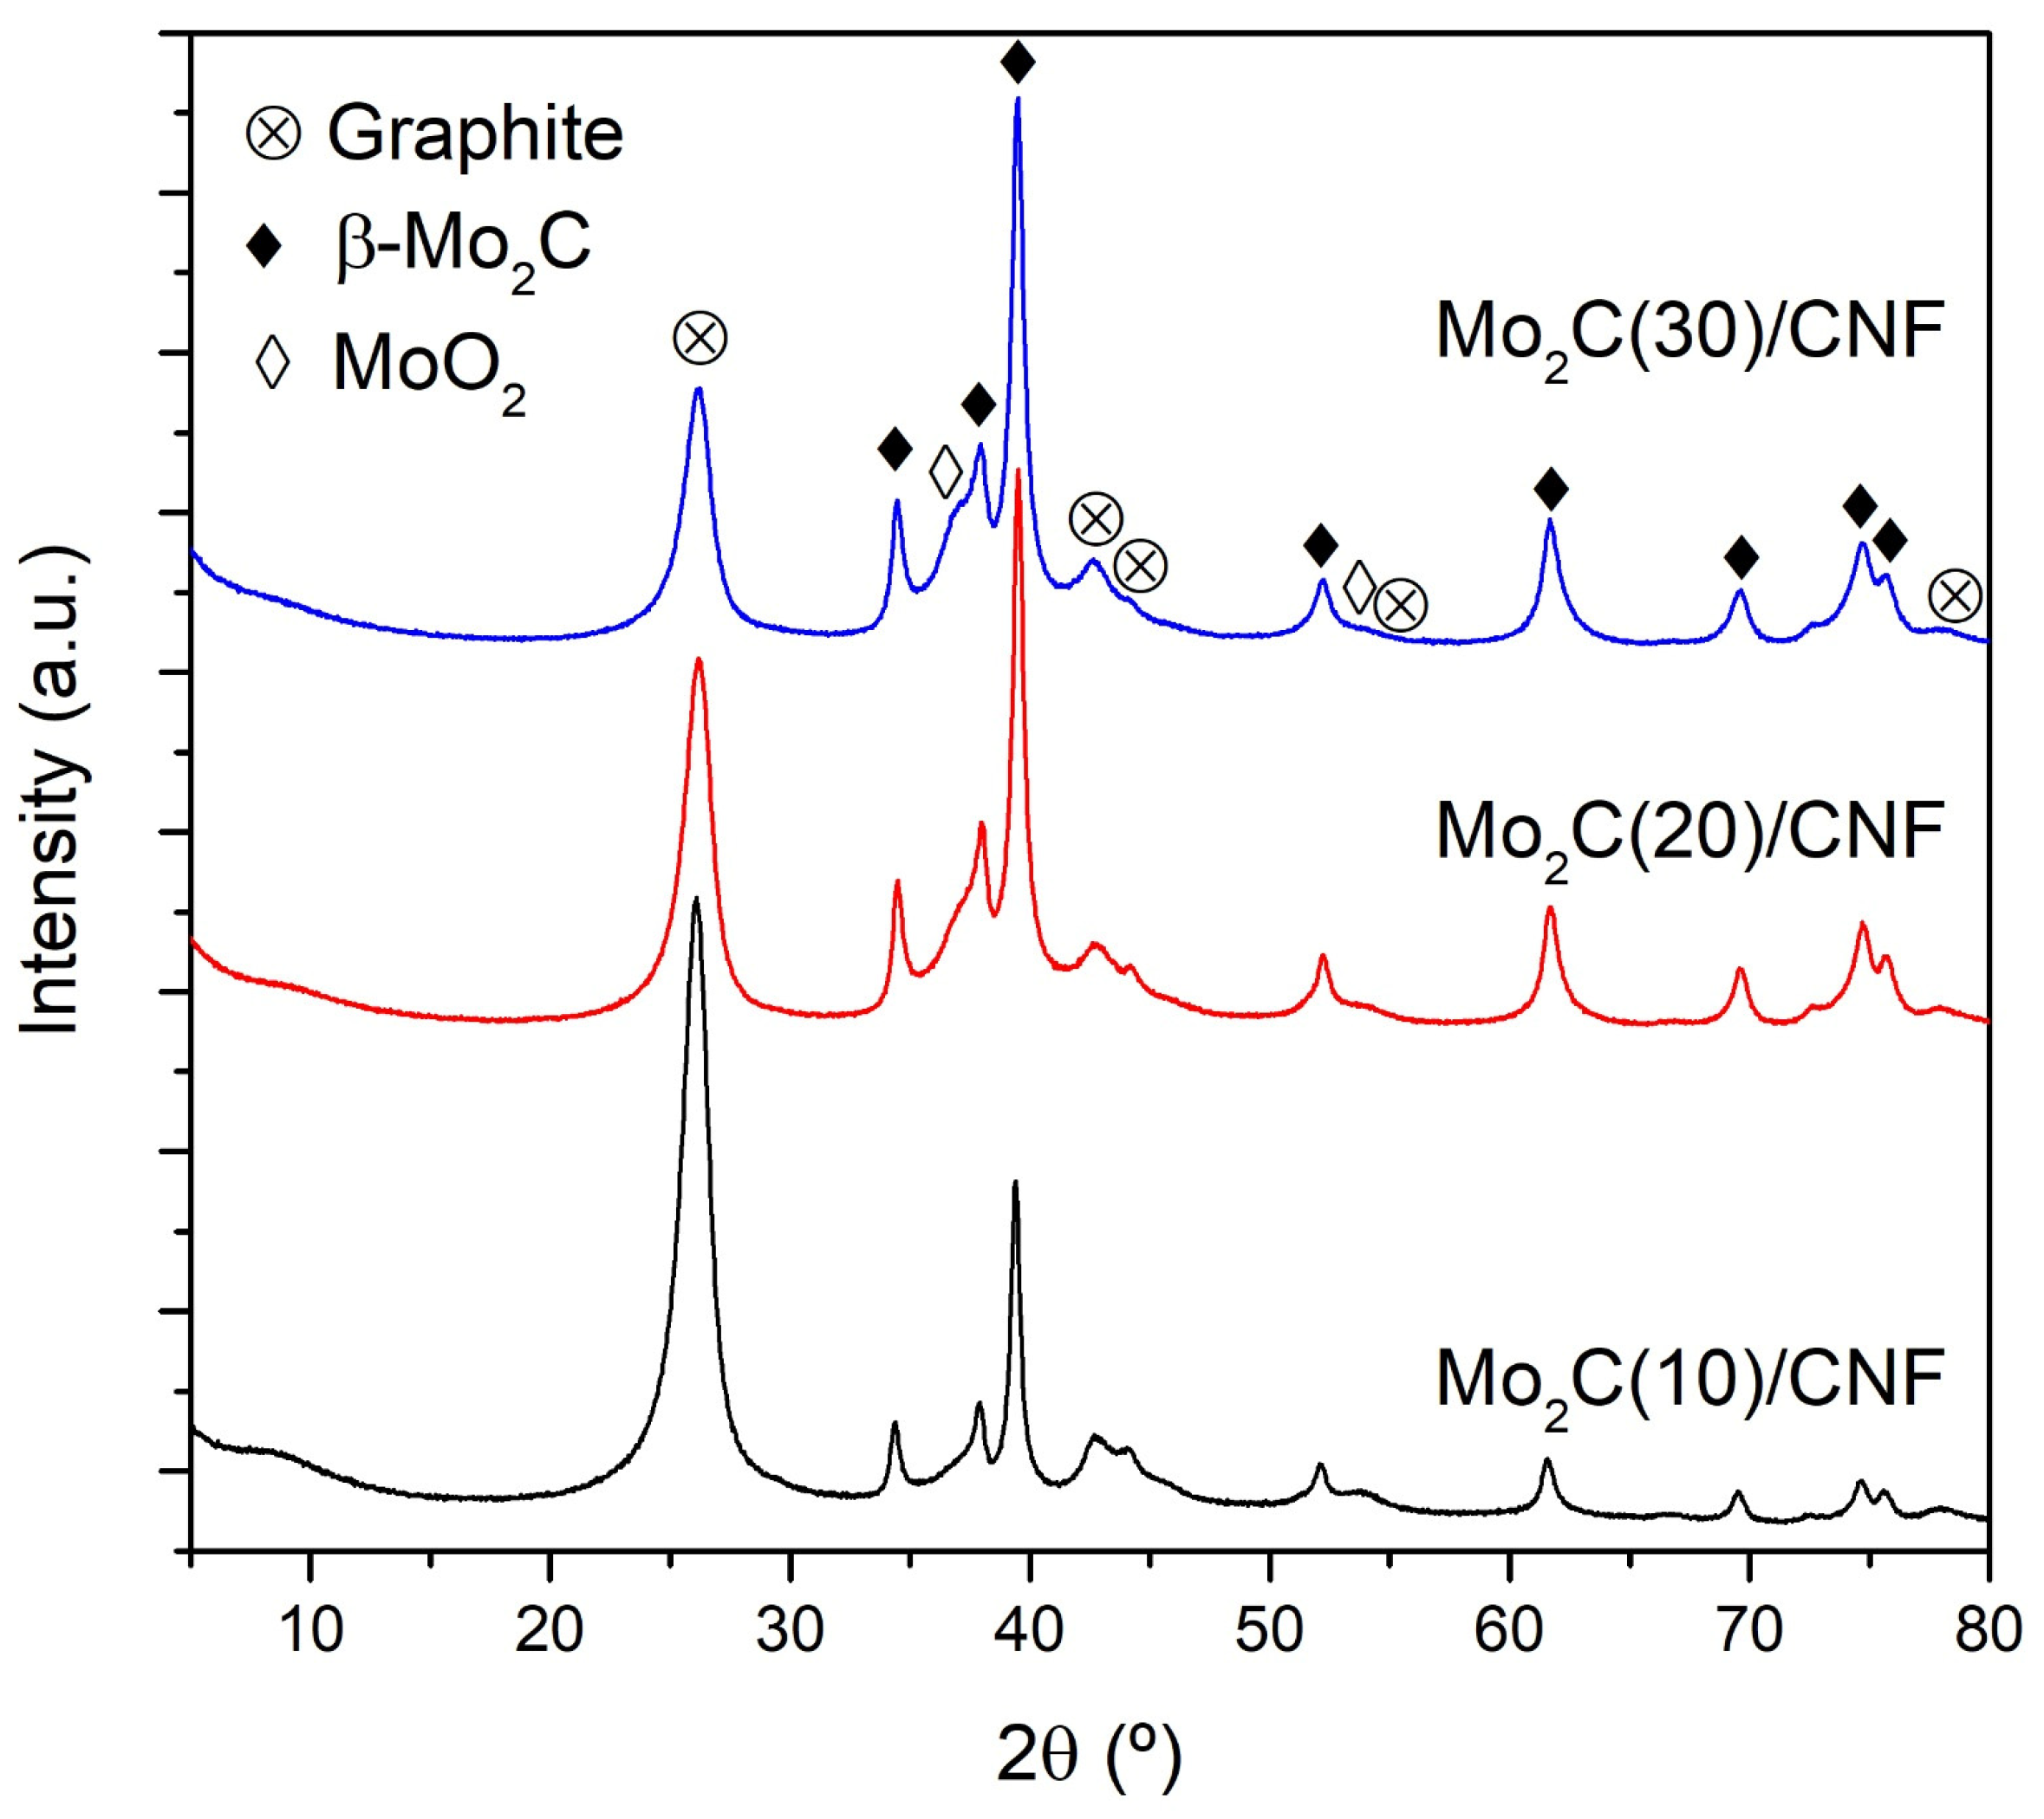
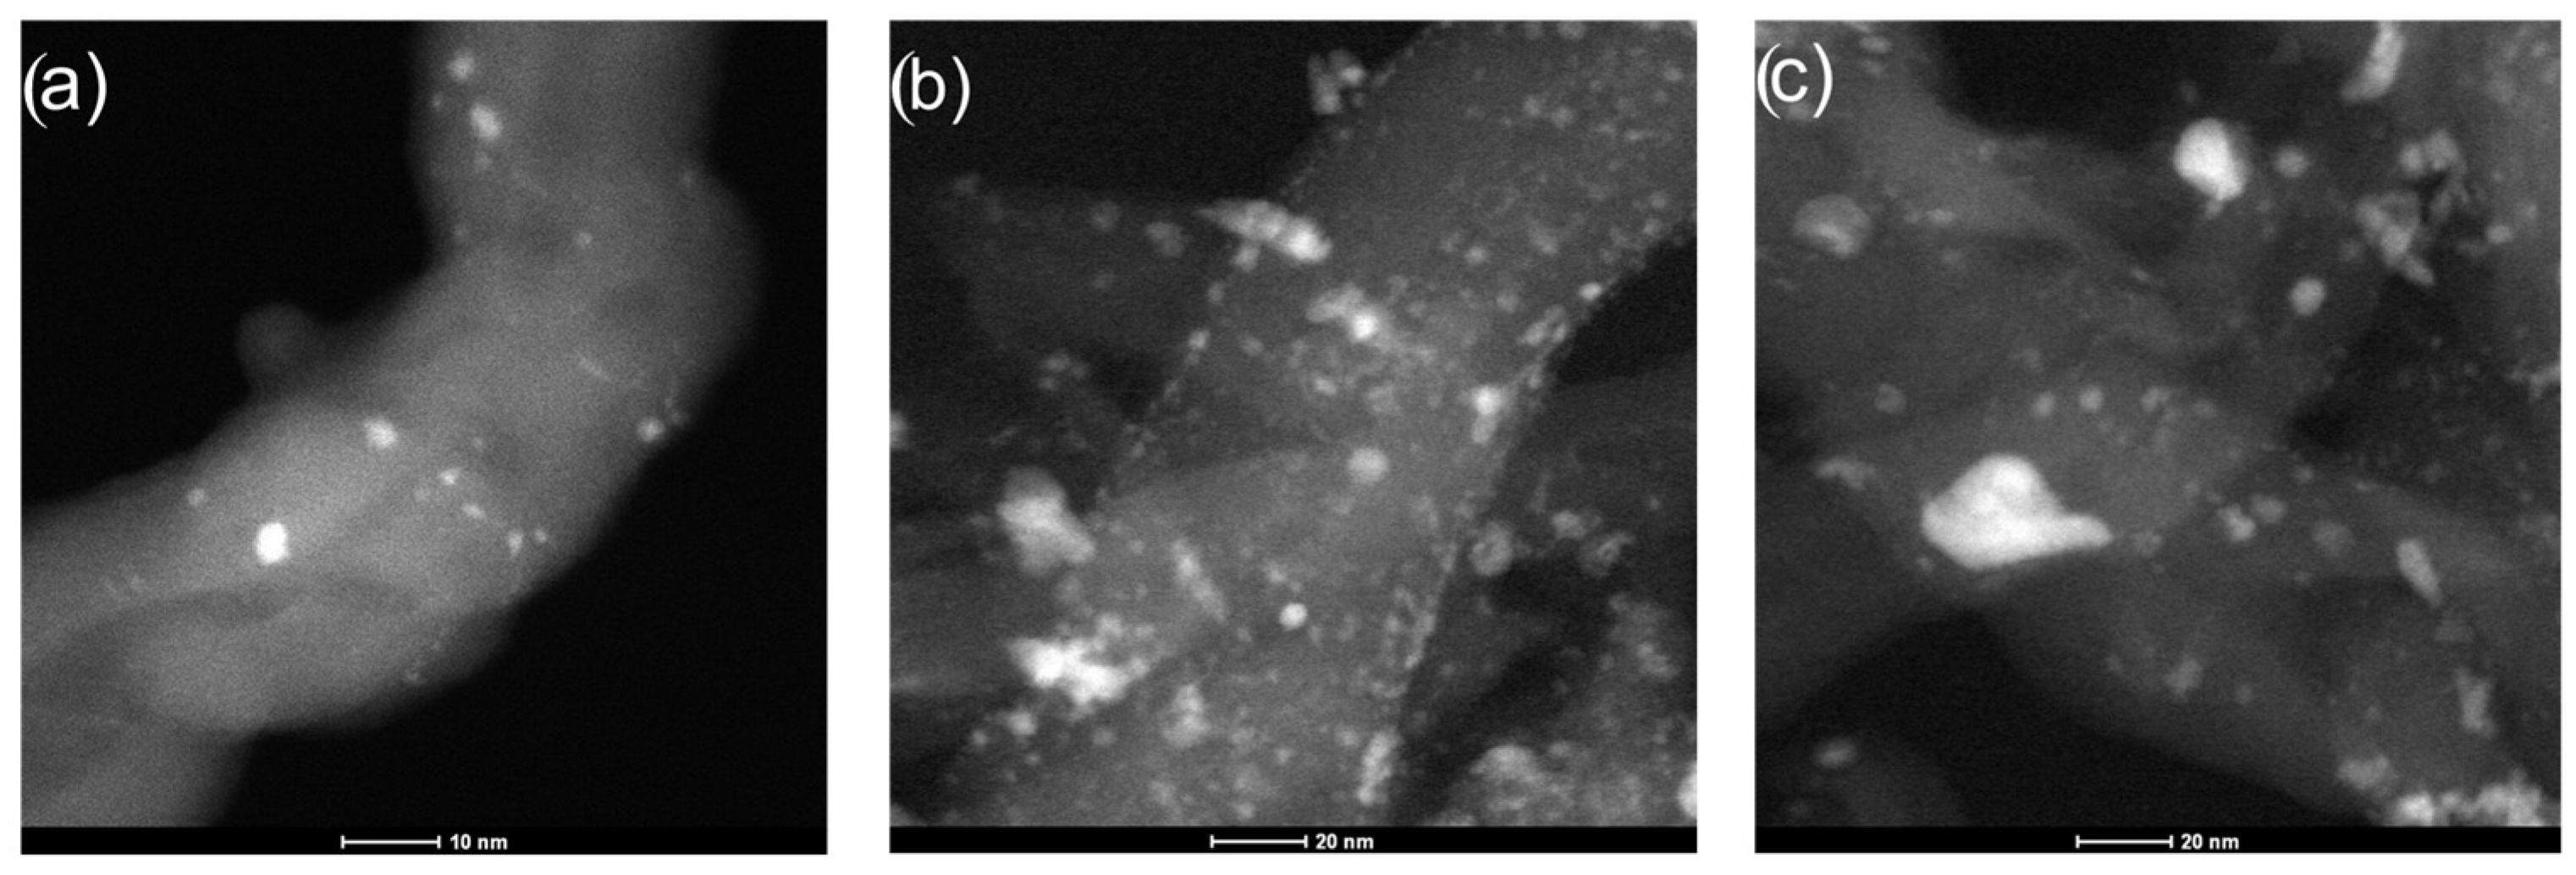
2.1. Characterization of the Mo2C Catalysts

The three catalysts with different Mo concentrations (10, 20, and 30 wt.%) were analyzed by XRD, XPS, and ICP-OES (Table 1 and Figure 1). The ICP-OES and XPS results revealed minor disparities between the theoretical values and actual Mo concentrations for the overall set of catalysts. The catalysts showed a Mo content very close to the bulk values, suggesting a good surface dispersion. In all cases, graphite and Mo2C (β-Mo2C: hcp structure [38]) appear in the diffractograms as the only crystal phases, aside from weak signals of MoO2. Graphite is attributed to the structure of the initial CNF (Figure 1). Moreover, in Figure 1, the crystalline structure of the species in Mo2C/CNF catalysts with different Mo concentrations can be observed. In the three samples, the presence of the same XRD patterns is noticed, such as: (i) graphitic carbon ascribed to the carbon nanofibers at around 26° that reduces its signal as Mo concentration augments. (ii) On the other hand, β-Mo2C peaks indicative of the thermal carboreduction of the Mo salt become more intensive along with the Mo content in the catalyst.
In order to obtain a closer inspection of the catalyst morphology and the dispersion of the Mo2C nanoparticles onto the carbon nanofibers, these were visualized using SEM and TEM. Figure 2 depicts SEM micrographs of the three catalysts with varying Mo concentrations. The left images (secondary electrons) reveal that catalysts primarily consist of carbon nanofibers (used as support and carbon donors), which are responsible for the catalyst’s filamentous texture, and some large particle aggregates (bright areas). According to the carbon and molybdenum elemental mappings (right panel), the samples show a homogeneous distribution throughout the entire surface of each catalyst, revealing that the molybdenum is completely dispersed in the catalyst. Furthermore, it is confirmed that the bright particle agglomerates found in the tree samples (left panel) correspond to compounds of this metal, in agreement with the EDX analysis and Mo mapping. The reduction in surface area at higher metal loadings might be explained by the carboreduction stage on its own, which transforms part of the support carbon into carbide, reducing the original CNF surface area.
Figure 3 and Figure 4 display TEM and STEM images for Mo2C/CNF catalysts, respectively. Irrespective of the Mo content in the catalyst, the samples exhibit molybdenum nanoparticles (dark spots) of varying sizes and shapes on the outer surface of the carbon nanofibers. The molybdenum nanoparticles, whose composition was verified by EDX analyses, exhibit an increasingly rounded appearance as size decreases, indicating the presence of particle aggregates. Since the nanofibers were washed with nitric and hydrochloric acids, the only remnant nickel particles from the catalyst used in their growth are occluded inside the graphite stacks. These embedded nickel particles are larger than 10 nm in size and can be found in the middle of the right image of Figure 3b. HRTEM revealed the presence of small nanoparticles (<5 nm) evenly distributed over the carbon nanofiber in all the catalysts. In a previous work [12], the presence of molybdenum-based nanoparticles with sizes below 2 nm covering the nanofiber was confirmed. These nanoparticles were more clearly resolved by STEM (Figure 4), where they appear as bright spots coating the surface of the carbon nanofibers. The brightness of these small spherical nanoparticles is attributed to their metallic composition, corresponding to molybdenum-based phases such as oxide, oxycarbide, or carbide. EDX analysis of selected samples confirmed the presence of molybdenum particles.

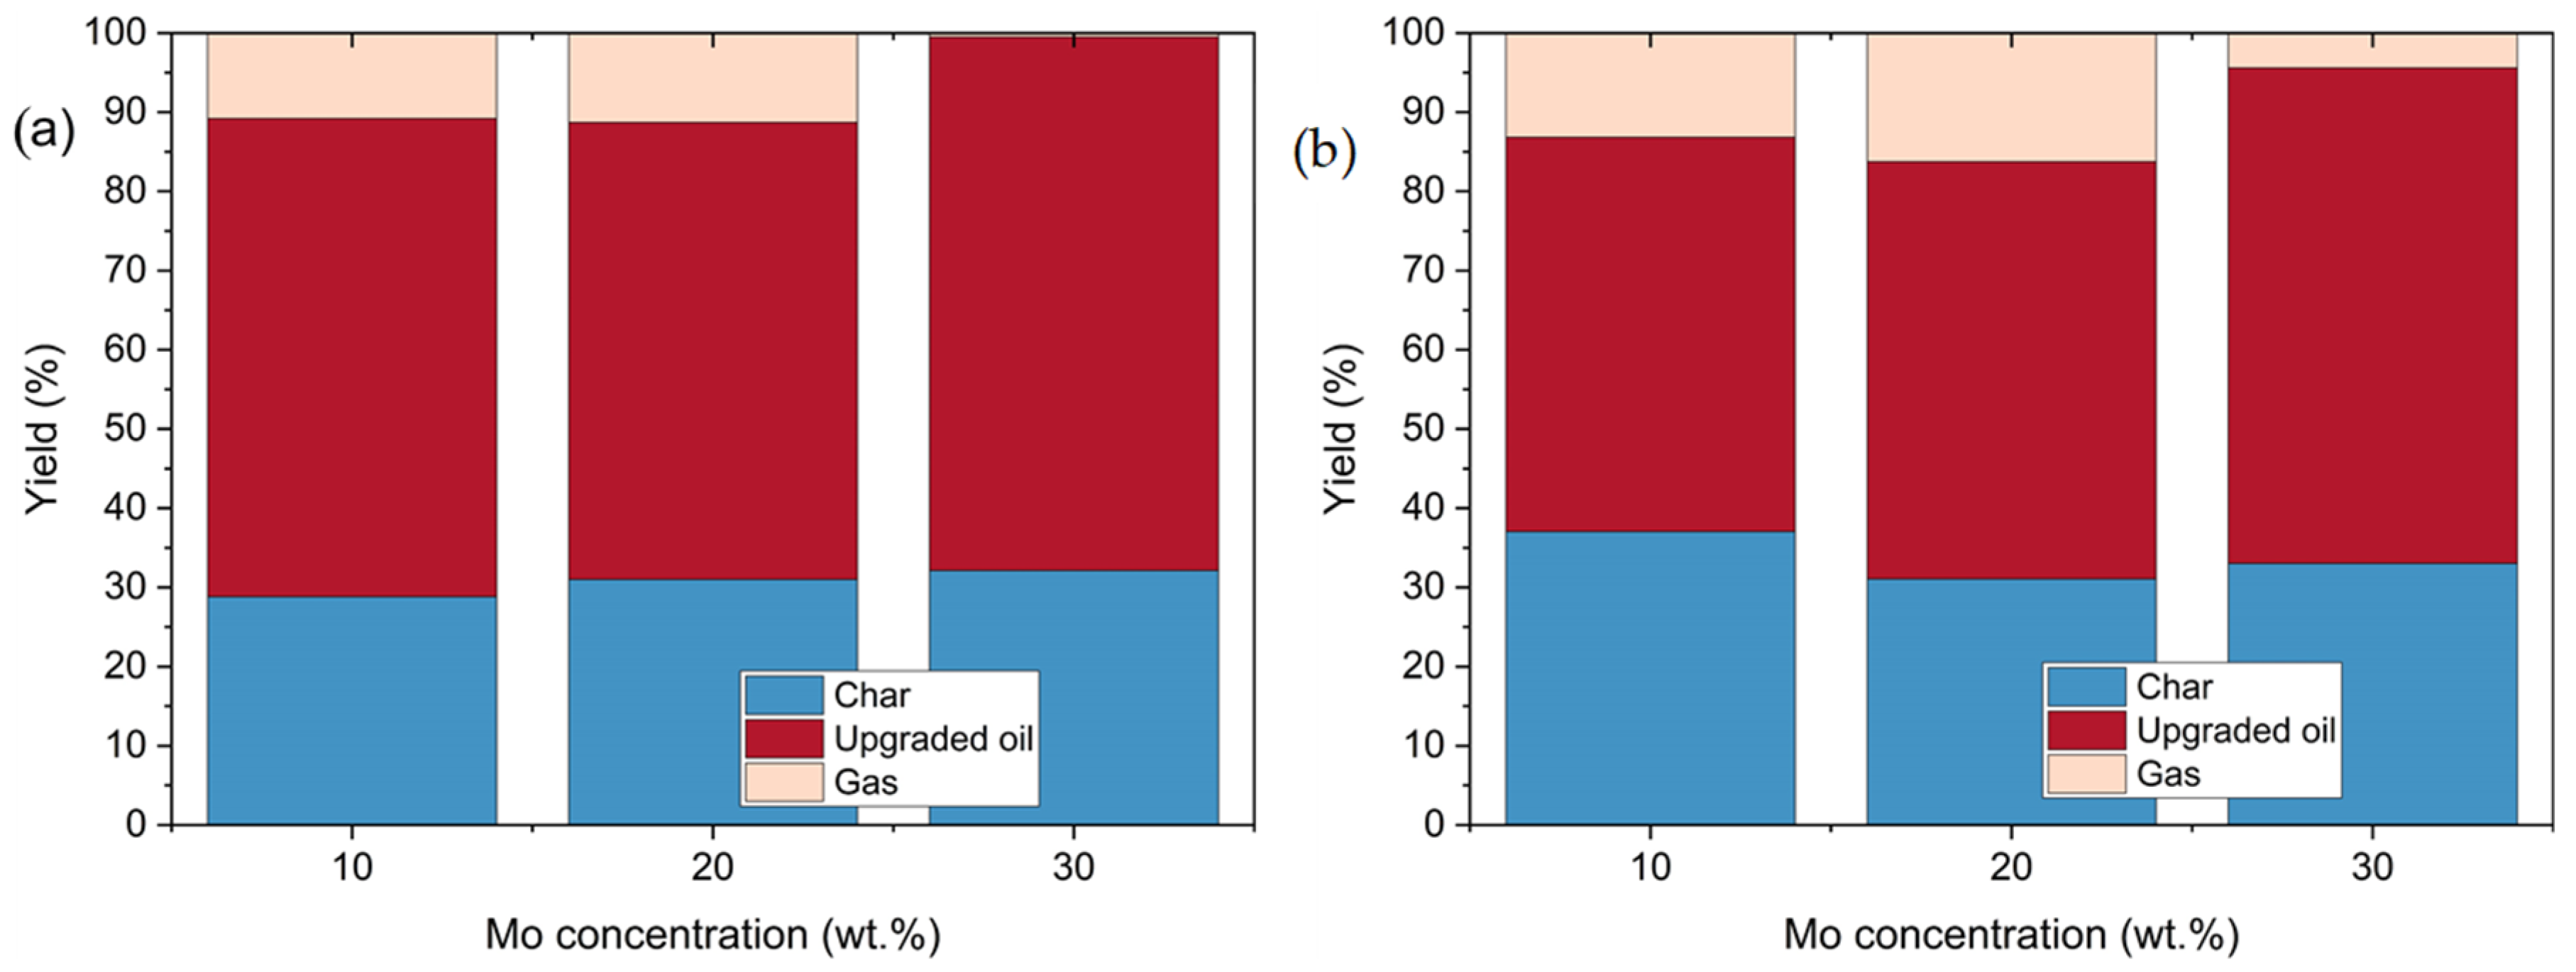
2.2. Effect of the Catalyst Mo Loading on the Product Yields

The impact of using catalysts with different Mo loadings on product distribution for the two different bio-oils can be appreciated in Figure 5. Char yield associated with C200 (Figure 5a) tends to have a slight increase with Mo loading with values of 29, 31, and 32% for the Mo concentrations of 10, 20, and 30 wt.%, respectively. However, these minor variations can also be ascribed to experimental error. For A250 (Figure 5b), the char yields are reduced from 37 to 31% by increasing the catalyst Mo loading from 10 to 20%, respectively. A higher Mo concentration (30%) slightly increases the char yield to 33%. In the case of corncob, yield variations are within experimental error, and in the case of agave, where the phenolic compound concentration is higher, an increase in the Mo loading from 10 to 20 wt.% has a positive impact preventing polymerization and further increase to 30 wt.% has a minor impact on carbon yields, since phenolic compounds are considered the main precursors of coke production by polymerization reactions onto the catalyst surface [28]. On the contrary, gas yields after HDO show a clear trend of diminishing gasification reactions as Mo concentration increases. Bio-oil from corncob (C200) and agave (A250) show minor differences in gas yields at Mo concentrations of 10 and 20%, being 10.8 and 11.3% for C200, and 13.1 and 16.2% for A250, respectively. However, gas yield dramatically decreases to around 0.5 and 4.4% at 30 wt.% Mo concentration, suggesting that more active sites of Mo limit gasification reactions.
Finally, the influence of Mo concentration on the upgraded bio-oils from hydrothermal liquefaction at 200 and 250 °C can be seen in Figure 5a,b, for the samples of corncob and agave bagasse, C200 and A250, respectively. In the case of C200, the bio-oil yield remains almost constant when using Mo loadings in the range of 10–20 wt.% (60.4–57.7%), reaching its maximum value (67.4%) with 30 wt.% of Mo. A similar trend is depicted for A250-derived upgraded bio-oils, showing fairly close values of yield (49.9 and 52.7%) for Mo2C(10)/CNF and Mo2C(20)/CNF catalysts, followed by a notable improvement of 62.6% upon increasing the Mo loading to 30 wt.% (Mo2C(30)/CNF). From both raw bio-oils (C200 and A250), the most positive effect on the yield of upgraded products is observed at the highest Mo concentration (30%). These results agree with the work of Qin et al. [26], who employed a Mo2C/CNF catalyst to produce hydrocarbons from methyl palmitate (CH3(CH2)14COOCH3), finding higher liquid yields as the catalyst loading increased. However, this gain becomes more evident for concentrations above 20 wt.% and less significant at lower Mo amounts (5–20%).
Similarly, Ameen et al. [25] analyzed the influence of Mo loading in catalysts (3, 12, and 15% of Mo concentration) during HDO, showing that higher metal loading usually enhances bio-oil yield, although the increase might not be as considerably high as expected.
Guo et al. [39] analyzed the physicochemical characteristics of a Mo2C catalyst loaded at 5–40%. It was observed that the surface area was reduced as catalyst concentration increased from 5–20% to 438–281 m2g−1, along with its pore volume of 0.072–0.052 cm3g−1. The work mentions that Mo2C particles become larger as a consequence of the low surface of carbon material, which can be ascribed to an overlapping effect on the catalyst.

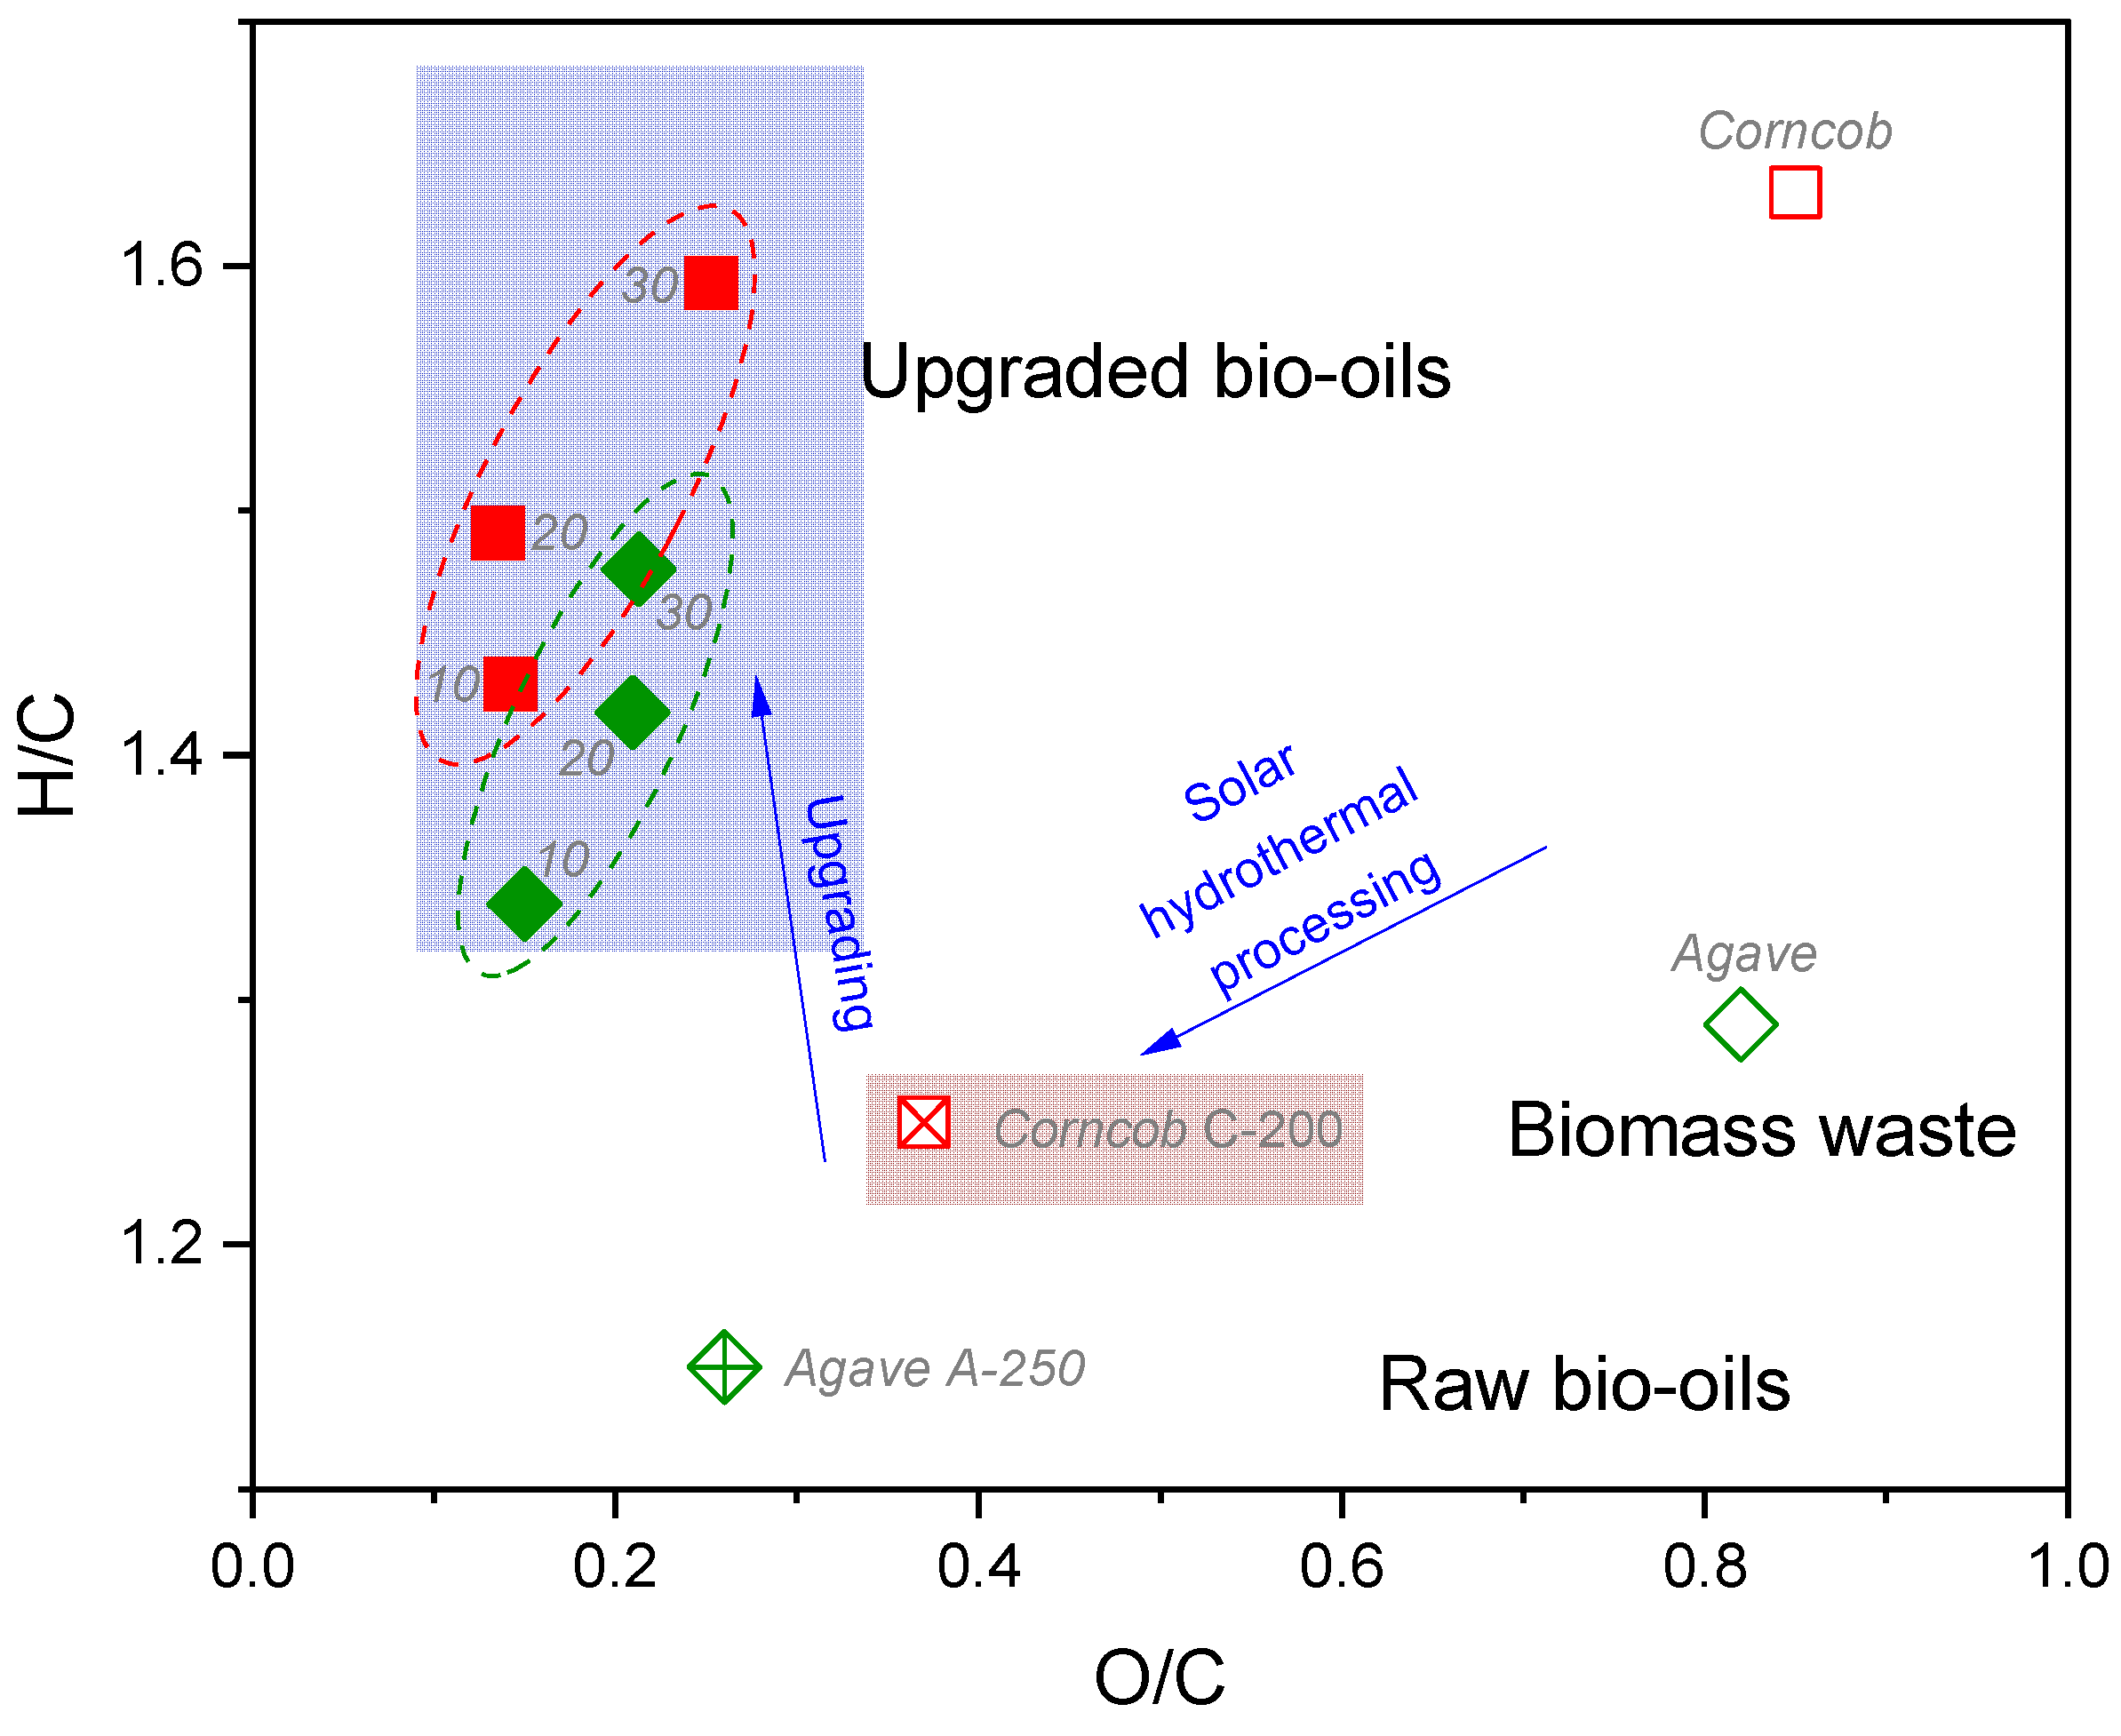
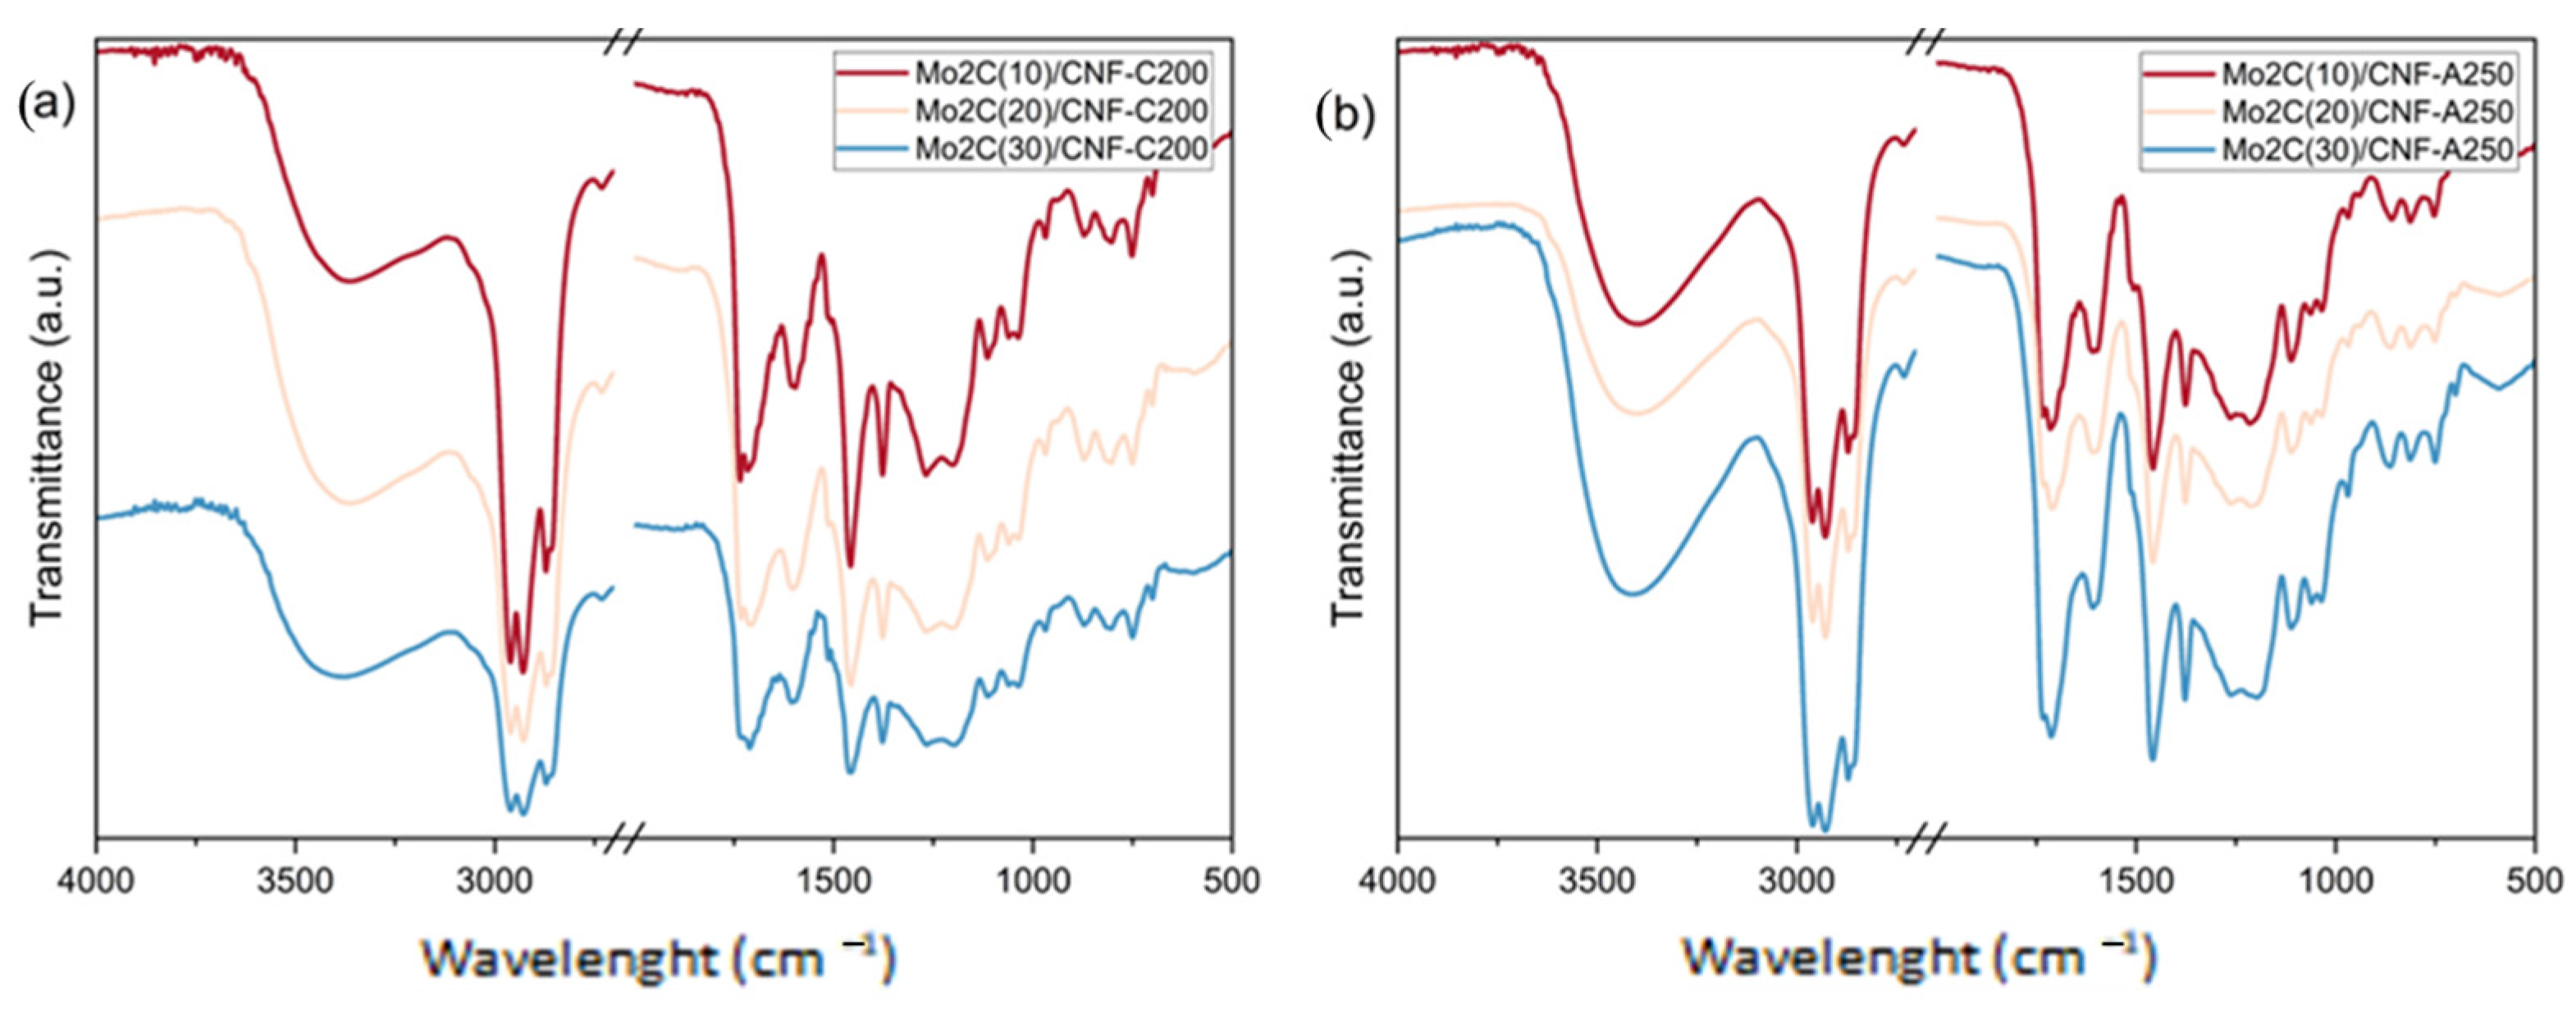
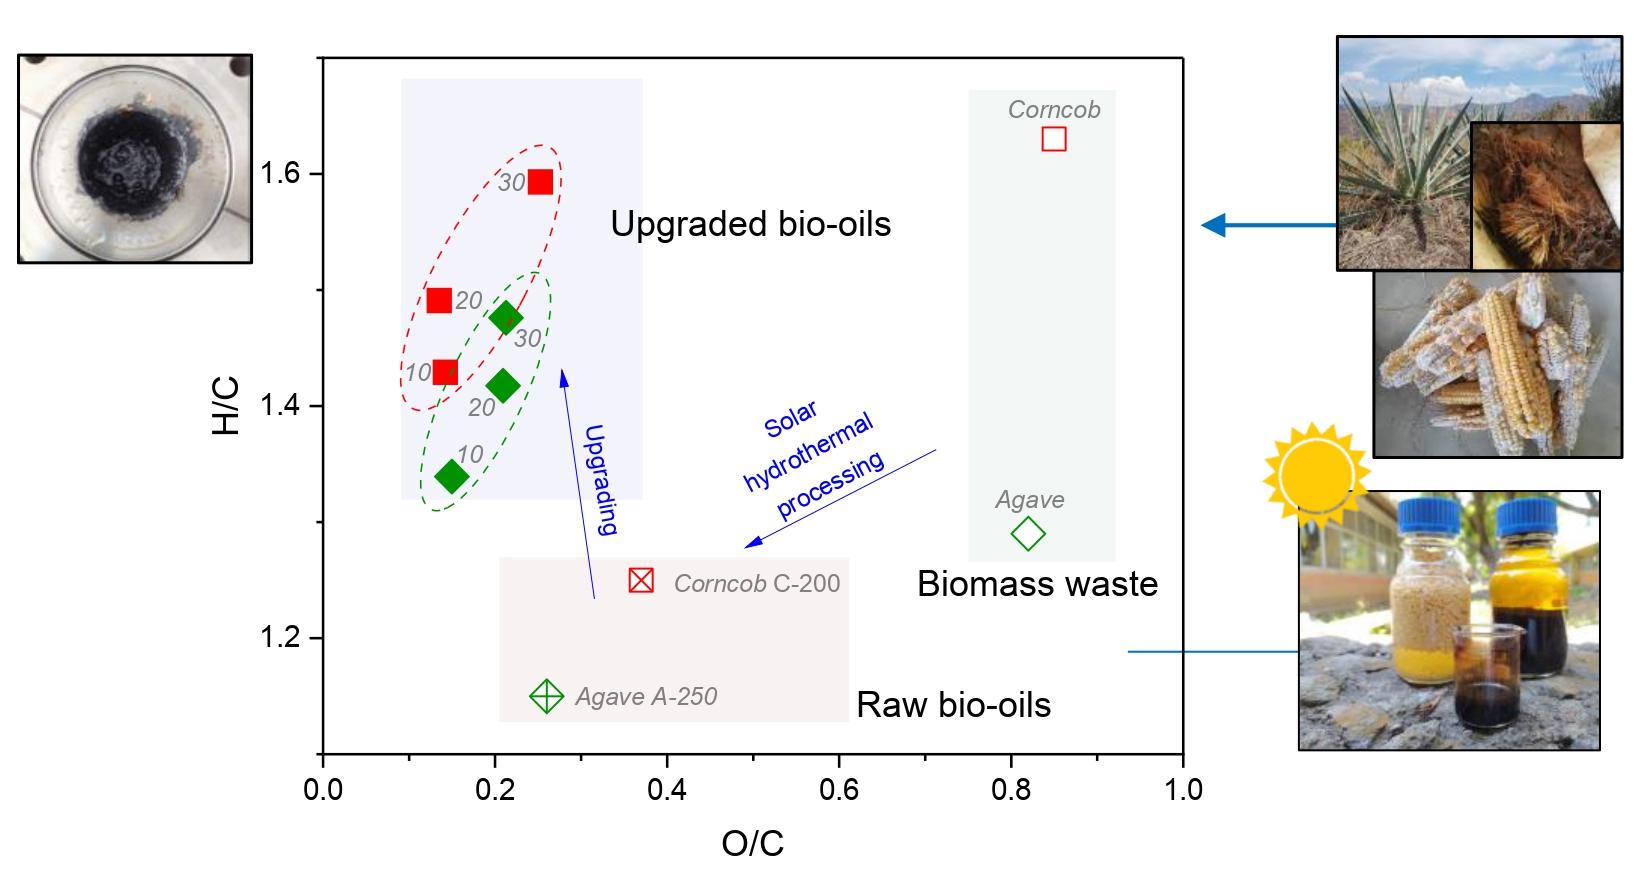
2.3. Effect of the Catalyst Mo Loading on the Upgraded Bio-Oil Properties

The influence of Mo loading on the chemical composition of the different upgraded bio-oils is shown in Table 2. The raw bio-oil sample C200 shows a remarkable enrichment in its carbon content upon upgrading. The most significant variation (75.1 wt.%) is observed at a Mo concentration of 10%, which merely enhances to 75.4 wt.% with further elevation of the Mo loading up to 20%. Furthermore, the molybdenum concentration of 30% results in a carbon content of the upgraded bio-oil up to 67.3 wt.%. Similar trends are observed for the agave bio-oil (A250), with the carbon content increasing from 68 wt.% (raw sample) to 75.7 wt.% when using a Mo catalyst loaded at 10%. Then, further elevations of the Mo concentration to 20 wt.% and 30 wt.% result in lower carbon contents of the upgraded bio-oil of 71 wt.% and 70 wt.%. Overall, the oxygen composition rises as the carbon percentage diminishes, with the hydrogen content remaining almost equal. This behavior is related to the trend in gas yield. As the DOD is less with Mo at 30 wt.%, the oxygen content in the bio-oil is unreleased, which is reflected in the lower gas yields. Normally, an O reduction will result from cracking and the formation of light oxygen-containing compounds, water, CO, and CO2.
As collected in Table 2, the aforementioned variations in composition have a direct impact on the calculated HHV, EE, and DOD values of the upgraded bio-oils. Specifically, the C200 bio-oil shows a greater HHV for the Mo concentrations of 10 and 20 wt.% (35–36 MJ/kg). Meanwhile, the Mo2C(10)/CNF-A250 sample reaches a higher HHV (34.8 MJ/kg) at a Mo loading of 10 wt.%, and the HHV was slightly reduced to approximately 32 MJ/kg when it is treated with catalysts with higher Mo concentrations. The deoxygenation grade for C200 remains in the range of 72.1 and 74.5% for catalysts with 10 and 20 wt.% of Mo. However, a higher Mo concentration of 30 wt.% reduces the DOD up to 50.4%. On the contrary, the DOD for the upgraded bio-oil A250 progressively decreases from 69% to 57 and 48.4% as the Mo concentration on the Mo2C/CNF catalyst rises through 10, 20, and 30 wt.%, respectively. The energy efficiency trend reveals another behavior. While no important variations are observed on C200 (83.2, 81, and 83.4% for 10, 20, and 30 wt.% of Mo, respectively, Table 2), EE remained constant for A250, at around 59% at 10 and 20 wt.% of Mo concentration, but dramatically increased up to 70.1% at a metal loading of 30% of Mo (Table 2).
The differences between the yields and chemical compositions between the samples C200 and A250 can be likely ascribed to the amount of unstable aromatic compounds from the hydrothermal processing, which tend to polymerize [28]. In sample C200, higher improvements are observed with a Mo concentration of 10 and 20%. On the contrary, a higher carbon content and HHV of A250 are observed at 10% of Mo loading. This may be related to some affinity of the Mo catalyst to certain initial compounds during the HDO.
For comparative purposes, the Van Krevelen diagram (Figure 6) is an attractive option to depict the chemical composition of different fuels in terms of their O/C and H/C ratios. As compared to the original biomasses (corncob and agave bagasse), the hydrothermal liquefaction reduces the O/C ratio from 0.8 to values below 0.4. The subsequent catalytic hydrodeoxygenation further decreases the O/C ratio of the upgraded bio-oils up to 0.1, whereas the H/C ratio increases by almost 0.5 on average. Furthermore, the H/C ratios of the upgraded bio-oils of corncob (C200) and agave bio-oils increase with Mo concentration in the catalyst used. It has been reported by the works of Cai et al. and Enaime et al. [40,41] that different HDO reactions can influence the direction followed on the Van Krevelen diagram, for instance, demethanation, dehydration, and decarboxylation. According to the graphical direction, deoxygenation reactions are responsible for increasing the H/C ratio and decreasing O/C, mainly decarboxylation, which is in good agreement with the displacement of the upgraded bio-oils shown in Figure 6. Moreover, it is observed that the lower the Mo concentration in the Mo2C/CNF catalyst, the better O/C ratios obtained.
The qualitative FTIR spectra to detect organic functional groups of the upgraded corncob and agave bio-oils are shown in Figure 7a,b, respectively. Based on the number of absorption bands, it can be observed that all the samples are a complex mixture of molecules. The presence of hydroxyl groups, such as carboxylic, alcoholic, and phenolic compounds, is ascribed to the peak 3400 cm−1 [42], whereas lower Mo contents of 10 and 20% favor the reduction of –OH stretching, which becomes apparent for bio-oils treated with 30% of Mo (Figure 7a). On the contrary, in Figure 7b, the first peak at 3400 cm−1 is observed to be well defined and pronounced, suggesting a major density of hydroxyl groups in A250 samples. By increasing Mo loading by 20%, the band is reduced, and slightly more for 30%, which can lead to a decrease in –OH species. In Figure 7b, it is suggested that minor Mo content reduces the stretching associated with –OH compounds.
In the range of 3000–2800 cm−1, the most defined groups of peaks in the samples are observed, which correspond to alkyl C-H stretching (alkanes and aromatics) [42]. In general terms, Figure 7a,b shows contrary behavior. The intensity of the peaks of Figure 7a tends to reduce as Mo concentration rises. Meanwhile, in Figure 7b, the opposite trend is observed. Although the bands of Mo concentrations of 10 and 20% may seem similar in Figure 7b, when Mo increases up to 30%, the peak associated with alkyl stretching reduces its intensity. However, it must be pointed out that since in this vibrational band, two species may coexist, it may also be the result of a combined effect.
In the next area, around 1719 cm−1, ascribed to the carbonyl group, some organic groups such as aldehydes, ketones, esters, and carboxylic acids can overlap since it is a small area in which they coexist [42,43]. A similar pattern is observed in Figure 7a,b, where carboxylic acids are associated with peaks in the range of 1780–1710 cm−1; the vibrational peaks suggest their presence in Figure 7a at 10% of Mo, then they are reduced at 20% but increase slightly as the Mo concentration rises to 30%. On the other hand, in Figure 7b, the presence of these species seems to remain at a minimum at a Mo concentration of 10%, along with the Mo concentration of 20 wt.%; however, at a concentration of 30%, a slight increase may be suggested.
Ester groups are reported to appear in the range of 1750–1735 cm−1. These become more intense and evident as the Mo concentration rises, evidencing esterification reactions of acid species in an alcohol media. In Figure 7a, these bands are well defined, which may suggest that after 10% of Mo, the ester groups increase but remain similar for Mo concentrations of 20 and 30%. On the other hand, in Figure 7b, the peaks related to Mo concentrations of 10 and 20% appear similar to the difference of those of 30%, which is more pronounced and may indicate an increase in esters. In the three samples, its augment is well reported since esters are one of the main organic groups in bio-oils [44]. Since both bio-oils are of different nature, it is expected that their composition in organic groups also differs; therefore, the influence of Mo loading may differ on each one. In Figure 7a, lower stretching can be seen in a region of near to 1719 cm−1, where aldehydes, ketones, esters, and carboxylic acids coexist, which may suggest the reduction of at least one of these groups. On the other hand, in Figure 7b, in the same range, Mo concentration favors the stretching, noted more at 30% of Mo, which may be related to the conversion of the initial compounds into some of these organic groups.
The results of the gas chromatography–mass spectrometry (GC–MS) analysis of the raw and upgraded bio-oils are shown in Table 3. As can be seen, the initial raw bio-oils have different compositions of phenolic compounds (18% for the corncob bio-oil (C200) and 29% for the agave bio-oil, A250). Upon HDO treatment, C200 phenolic compounds tend to increase up to 30%. On the contrary, upgraded A250 bio-oils slightly reduce their composition of phenolic species from 29 to 27% when using a Mo2C(10)/CNF catalyst. At higher Mo loadings, phenolic groups are reduced to 18% in A250. The phenolic compound content precedes coke yields, as they are considered the main precursors for coke formation through repolymerization reactions [28]. Furthermore, most phenol-containing chains originally present in the bio-oil are expected to fragment and break down into other compounds, such as methoxy, methyl, propenyl, aldehyde, and ketone groups [44].
In the beginning, esters groups remain as minor species in untreated C200 and A250 bio-oils (1.5 and 1.8%); however, afterward, HDO esters become the dominant species in the upgraded bio-oil. Their presence reaches a high value of 41.9% in C200 upon their upgrading process in contact with a Mo concentration of 10 wt.% and up to 48.8% in A250 after the treatment with the same catalyst. The ester composition remains almost constant with catalysts with higher Mo loading, showing a slight increase in C200-derived bio-oils (43.7–43.5%) and small variations in A250-derived bio-oils (39–42.3%). The differences in organic compounds between both upgraded bio-oil compositions can be related to the initial composition of raw bio-oil, especially the operational temperature of hydrothermal liquefaction. Thus, hydrolysis reactions, mainly associated with biomass fragmentation and the formation of unstable compounds, are less pronounced at lower temperatures [45].
Aldehydes, ketones, esters, ethers, phenols, alcohols, and organic acids constitute the most representative organic oxygenated compounds on bio-oils [44,46,47]. Among them, phenols and esters become the dominant species within the upgraded bio-oils, whereas the carboxylic acid content is minimal. In the work of Rahman et al. (2020) [48], it is mentioned that acetic acid is one of the typical compounds found in raw bio-oil associated with the fracture and cracking of hemicellulose, which tends to disappear during the HDO treatment, as can be seen in Table 3. In addition, it is crucial for the identification of some thermally unstable oxygenated compounds, for instance, ketones, phenols, aldehydes and acids that lead to coke/char formation [2]. As previously mentioned, both samples have different proportions of initial compounds, which may lead to the reaction mechanism that follows. The effect of Mo concentration on C200 samples slightly increases the esters and aldehydes and reduces S-compounds, epoxides, ketones, and aromatic group composition. Meanwhile, in A250, Mo concentration reduces the epoxides and phenolic compounds, and at the same time increases aldehydes and other oxygenated compounds. The possible reaction mechanism that can occur during the hydrodeoxygenation of a model compound over Mo2C/CNF catalyst has been previously reported by Remón et al. [19]. In their work, it is proposed that multiple reactions may coexist, leading to a different mechanism; firstly, demethylation, followed by deoxygenation, demethoxylation, deoxygenation, and rearrangement in order to remove one oxygen atom. Further reactions (deoxygenation, demethoxylation, and dehydration) lead to the complete deoxygenation of the guaiacol molecule into benzene or toluene. Then, by the addition of hydrogenation reactions, the final product becomes cyclohexane. In the present work, by the constant stretching of ester groups in the range of 1750–1735 cm−1, it may be suggested that the catalytic hydrodeoxygenation of real lignocellulosic bio-oils only achieved partial deoxygenation of its original compounds, probably as a result of the multiple reactions and intermediate species generated during the process, which complicate a direct transformation into deoxygenated saturated hydrocarbons.

2.4. Exhaust Gas Analysis

The chemical composition of gas products generated during the supercritical ethanol-assisted hydrotreatments is collected in Table 4. Only small variations in the final H2 concentration are observed for C200 bio-oils, which tend to decrease at higher Mo concentrations. This tendency can be indicative of more hydrogen reacting at the catalyst surface, and therefore, being further consumed. CH4 gas production shows minor variations for the C200 sample, which differs from the general decrease in CH4 for A250 as the Mo concentration in the catalyst increases. In this case, the formation of CH4 is the result of methanation reactions between CO2 and H2 [25].
In terms of CO2 production, both samples depicted a parabolic behavior with Mo loading, although with an unclear trend, reaching a minimum of 7.26% at 20 wt.% of Mo for the sample C200 and a maximum value (6.74%) for the bio-oil A250 when using the same catalyst. Finally, the absence of CO proves the absence of decarbonylation reactions during the HDO process.
Previous works [33,49] that have used supercritical ethanol as a solvent mention a minor concentration of CO (0.15–0.49%). Moreover, the main products H2, CO2, and CH4 are indicative of the presence of HDO reactions [50]. Thus, CO2 is an indicator of decarboxylation and decarbonylation reactions of ketones, acids, and aldehydes in the oils, while methanation reactions between CO2/CO and H2 lead to the production of CH4. Overall, low concentrations of CO2 and CH4 point towards deoxygenation routes as the main reaction pathways, as suggested in previous reports [25].

2.5. Comparison of Upgraded Bio-Oils Using Mo Catalysts from Solar and Conventional Heating

A comparison of the main results obtained in the present work and those reported in the literature is shown in Table 5. This is made in terms of yields, chemical composition, and HHV for different upgraded solar bio-oils, along with other upgraded bio-oils from HDO influenced by Mo concentration.
López et al. [24] analyzed two different bio-oils obtained from lignocellulosic biomasses, acacia sawdust, and palm empty fruit bunches. In their work, they synthesized Mo2C as a catalyst and contrasted the results with another commercial catalyst NiMoS under analogous operational conditions of HDO. Therein, the chemical content of the bio-oils and the HHV, in the range of 34–41 MJ/kg, are in good agreement with the present work. On the other hand, the work of Ameen et al. [25] reported diesel yields in the range of 21–62%. Although these are considerable yields and they are in the interval with those reported in this work (34–35%), it should be noted that the differences between both works can be related to the yield equation, as Ameen et al. [25] calculated them by using GC–MS areas instead of gravimetric methods. Therefore, in the present work, HDO of solar bio-oils with varying Mo content in the Mo2C/CNF catalyst was successfully achieved, and the yields and chemical characteristics are comparable to those reported by conventional heating methods, especially if it is considered that most of the works that assess the Mo concentration start from oleaginous biomass sources to yield hydrodeoxygenated bio-oil.
Based on a previous work [39], higher Mo2C loading above 20% on the catalyst does not increase liquid yields significantly, which is not in complete agreement with the results obtained in this work (Table 5), probably as a result of minor Mo dispersion. Moreover, Table 5 compares different works that employ Mo-based catalysts and it can be noted that the present work’s results are in the same range, especially if it is observed that solar bio-oils were upgraded at low hydrogen pressures.
The results obtained here may pave the way to the synthesis of bio-fuels using solar hydrothermal processing of biomass followed by catalytic hydrodeoxygenation. As future work to improve the process and reduce its environmental impact, the use of concentrated solar technologies can be analyzed not only for producing solar bio-oils but also for upgrading the HDO treatment. Furthermore, by analyzing the effect of Mo concentration, it was observed that (i) depending on the initial organic groups in the raw bio-oil, the augment or reduction of some groups can be addressed, and (ii) higher Mo content promotes lower carbon content and higher oxygen content, (iii) along with reducing the gasification reactions.

3. Methodology

3.1. Materials

The feedstock employed for HDO studies was bio-oils obtained through hydrothermal liquefaction of corncob and agave angustifolia bagasse in a concentrated solar furnace (average concentrated solar flux density of 5000 kW/m2 and thermal power up to 25 kW in the focal zone) at the Renewable Energy Institute of the National Autonomous University of Mexico (IER-UNAM). The corncob oil (denoted as C200) was produced at 200 °C, with a solid concentration of 20 wt.% and a 90 min reaction time. On the other hand, agave bio-oil (A250) was obtained at 250 °C, with a 10 wt.% of solids and 60 min. To achieve the abovementioned conditions, the solar reactor was specially designed to operate at elevated pressure and high solar radiative flux. During the experimentation, an initial pressure of 50 bar of Ar was used along with a heating rate of 2 °C/min. Additional information about the solar reactor prototype, its operation, and product recovery can be found in a previous work [51].

3.2. Catalyst Synthesis

Carbon nanofibers, used as catalytic support, were produced via catalytic decomposition of biogas in a rotary bed reactor using a Ni-Co/Al2O3 catalyst. Further information about the rotatory reactor and the synthesis conditions can be found elsewhere [12]. The as-produced CNFs were firstly subjected to a HCl treatment (50 mL of HCl/g of CNF) at 60 °C for 4 h to eliminate the Ni-Co/Al2O3 catalyst used for the CNF growth. Subsequently, CNFs were chemically functionalized (25 mL HNO3/g of CNF) at 130 °C for 1 h in order to increase the surface oxygen content that allows a proper metal phase dispersion. For the sake of simplicity, the acid-treated carbon material with HCl and HNO3 is denoted as CNF.
The CNFs were impregnated with an aqueous solution of (NH4)6Mo7O24H2O (AHM), 99.98% purity, provided by Sigma-Aldrich (Louis, MO, USA), varying the concentration of AHM to achieve nominal Mo loadings of 10, 20, and 30 wt.%. Then, samples were oven-dried at 100 °C overnight, followed by carbothermal hydrogen reduction (CHR) under a H2 flow in a fixed-bed reactor. The thermal heating rate was initially programmed at 10 °C/min up to 350 °C and subsequently decreased to 1 °C/min up to 750 °C. This last temperature was maintained for 60 min before the reactor was cooled down in a N2 atmosphere until room temperature. The as-prepared catalysts were finally passivated with a flow of 1% O2 (N2 balance) for 120 min, with the purpose of preventing their reoxidation upon air contact. Further information related to this technique and the effect of the CHR operational conditions (temperature, heating ramp, and residence time) can be found in [12,52].

3.3. Hydrodeoxygenation of Bio-Oils

A 100 mL commercial autoclave provided by Parker Autoclave Engineers (Erie, PA, USA) made of stainless steel was used to perform the HDO experiments. In a typical run, 0.23 g of Mo2C/CNF catalyst, 2.3 g of raw bio-oil, and 23 g of absolute ethanol (Scharlau) were loaded into the reactor. Then, the system was closed, purged with nitrogen, and checked for tightness at high pressure (60 bar). Before each experiment, the reactor was pressurized with 10 bar of H2. All the HDO experiments were performed at an initial stirring rate of 300 rpm, which rose to 1000 rpm once the target temperature was reached (350 °C) and maintained for 120 min. The average final pressure at zero time and reaction conditions was 107 bar and around 116 bar at the end of the catalytic tests. Then, the reactor was rapidly cooled down to ambient conditions by immersion in a tap water bath. Next, a small fraction of the outlet gas was collected and analyzed.
The liquid effluent was firstly separated by filtration, rinsing the solid portion with acetone to recover the bio-oil. Then, the liquid mixture of acetone and bio-oil was separated in a rotary evaporator at 55 °C. Finally, the bio-oil was dried under a N2 flow until a constant weight was reached, denoting the final liquid product as upgraded bio-oil. Specifically, each upgraded bio-oil will be named based on both the catalyst (X) and the type of raw bio-oil used (Y) in the upgrading treatment as follows: X-Y (for example, Mo2C(10)/CNF-A250).
Yields of char and upgraded bio-oil were gravimetrically calculated according to Equations (1) and (2). Herein, m s o l i d   p r o d u c t refers to the solid residue after filtration and washing with acetone, m c a t a l y s t is the initial mass of the catalyst, while m r a w   o i l and m u p g r a d e d   o i l   correspond to the raw and upgraded bio-oils, respectively. Gas yields were estimated by weight difference (Equation (3)).
Y c h a r   ( w t . % ) = m s o l i d   p r o d u c t m c a t a l y s t m r a w   b i o o i l × 100
Y u p g r a d e d   o i l   ( w t . % ) = m u p g r a d e d   o i l m r a w   o i l × 100
Y g a s   ( w t . % ) = 100 Y c h a r   Y u p g r a d e d   o i l

3.4. Analytical Methods

Bio-oil characterization included elemental and chemical composition and higher heating value (HHV). The elemental composition (CNSHO) was determined using a Thermo Electron Flash 1112 Analyzer, calculating oxygen content by difference. The HHV was theoretically estimated from the CHN/O data using the empirical formula proposed by Channiwala et al. (Equation (4)) [53]:
H H V   ( M J / K g ) = 0.3491   C + 1.1783   H + 0.1005   S 0.1034   O 0.0151   N
In addition, the degree of deoxygenation (DOD) was calculated as a ratio of the oxygen weight percentage in the raw and upgraded oil (Equation (5)) [54]:
D O D   ( w t . % ) = 1 m a s s   o f   O   i n   t h e   u p g r a d e d   o i l m a s s   o f   O   i n   t h e   r a w   o i l × 100
Lastly, to compare the upgraded bio-oils at different conditions, the energy efficiency was calculated according to Equation (6) [55]:
E E   ( % ) = H H V u p g r a d e d   b i o o i l H H V r a w   b i o o i l × Y u p g r a d e d   b i o o i l
The chemical composition was analyzed by gas chromatography coupled to mass-spectrometry (GC/MS). For this purpose, a Perkin Elmer Chromatograph (GC, Clarus® 690) (Waltham, MA, USA) equipped with an auto-sampler, a splitter injection port, and a flame ionization detector (FID) was employed. The separation of products (0.5 µL of sample) was performed on a capillary column (Elite-5, 60 m × 0.25 mm i.d., 0.25 µm film thickness, Perkin Elmer, Waltham, MA, USA) coated with crossbond 5% diphenyl-95% dimethyl polysiloxane. The temperature program was initially maintained at 50 °C for 2 min, ramped to 180 °C at a rate of 15 °C/min, and then rose to 320 °C at 5 °C/min with a final isothermal period of 5 min. The injector was kept at 275 °C. The chromatographic separation line was followed by a Perkin Elmer mass spectrometer (Clarus® SQ 8T). The ion mass spectrum was identified using the preinstalled National Institute of Standards and Technology (NIST) reference database. A semi-quantitative analysis was performed using the peak area ratio of an individual compound with the total cumulative peak area of all compounds.
The formation of gaseous products (H2, CO2, CO, CH4) was traced and included in the mass balance from outlet gas sample analysis, carried out using a Micro GC (Varian CP4900) (Palo Alto, CA, USA) equipped with two packed columns (Molecular Sieve and Porapack) and a TCD detector. The calibration of compounds was performed daily by interpolation from area peaks of known concentration using pure gases (100 vol.%) and a reference gas containing 15% CO2, 20% CH4, 30% CO, and 35% H2 (expressed in vol.%).
Further information about chemical bonds present in the sample was obtained from Fourier transform infrared (FTIR) spectroscopy. FTIR spectra were collected in a VERTEX 70 (Bruker, Billerica, MA, USA) spectrometer from 400 to 4000 cm−1 with a resolution of 1.9 cm−1.

3.5. Catalyst Characterization

Catalysts were characterized with a powder X-ray diffraction (XRD) and Inductively Coupled Plasma Optical Emission Spectroscopy (ICP-OES) in order to verify the crystalline features of the Mo2C phase and metal loading, in either case. XRD patterns were acquired on a Bruker diffractometer (Model D8 Advance, Series 2) (Billerica, MA, USA) in the 2θ range of 5–80° at a scan speed of 4 s/step and a step size = 0.05° using a copper anode (λ = 1.54056 Å, 40 kV, 20 mA) and a secondary graphite monochromator as radiation source. XRD data processing was carried out using the DIFRAC Plus EVA 8.0 software from Bruker (Billerica, MA, USA). ICP determinations were performed on a Spectroblue (Ametek) (Newark, DE, USA) analyzer, digesting the sample according to the fusion method by sodium peroxide (Na2O2).
Porosities and specific surface areas were obtained from N2-physisorption at 77 K using a Micromeritis ASAP2020 instrument (Norcross, GA, USA). Samples were degassed at 150 °C for 5 h before measurements. The micropore volume was calculated according to the t-plot method whereas the Brunauer–Emmett–Teller (BET) equation was applied to estimate the specific surface area.
Chemical surface composition was characterized by X-ray photoelectron spectroscopy (XPS) and elemental mapping, while electron microscopy techniques provided morphological information. XPS analyses were carried out in an ESCAPlus OMICROM System (Houston, TX, USA), equipped with a hemispherical electron energy analyzer, an Al/Mg dual anode, and a detector with 7 channeltrons. The spectrometer was operated at 225 W (15 mA and 15 KV) using non-monochromatic MgAlα radiation (Kα = 1253.6 eV) as the excitation source. The software Casa®XPS (Version 2.3.25, Devon, UK) was used for the spectral processing.
Scanning electron microscopy (SEM) was performed using a Hitachi 3400N microscope (Tokyo, Japan) fitted with an EDX Röntec XFlash analyzer. Transmission electron microscopy works were conducted in the Advanced Microscopy Laboratories (LMA) at the Institute of Nanoscience of Aragón (INA). Images were taken with a Tecnai F30 (FEI company, Eindhoven, The Netherlands) microscope operated at an accelerating voltage of 300 kV.

4. Conclusions

The influence of Mo concentration on a non-sulfided catalyst based on Mo2C/CNF was successfully studied with the hydrodeoxygenation of solar bio-oils using supercritical ethanol as solvent and hydrogen donor. The main results revealed that bio-oil yields improved with Mo addition, reaching up to 67% and 63% for the different bio-oils (C200 and A250, respectively). The deoxygenation grade reached maximum values around 74% with a Mo concentration of 20% (C200). Moreover, it was found that the higher the Mo content, (i) the lower the gasification, which improves the bio-oil yield; and (ii) the lower the carbon content and the higher the oxygen content, reducing the hydrodeoxygenation. Finally, although most works that analyze the influence of Mo concentration in HDO employed oleaginous biomass sources for bio-oil production, it was observed that catalytic HDO treatment of solar lignocellulosic bio-oils with Mo2C/CNF in supercritical ethanol can produce upgraded bio-oils with yields and chemical compositions comparable to those produce by conventional heating methods.

Author Contributions

Conceptualization, D.T., H.I.V.-V., J.L.P. and I.S.; Methodology, D.T., E.F., A.L. and J.L.P.; Validation, A.A.-C.; Formal analysis, A.A.-C. and P.A.-A.; Investigation, A.A.-C., D.T., E.F., P.A.-A. and A.L.; Resources, J.L.P. and I.S.; Writing—original draft, A.A.-C.; Writing—review & editing, D.T., E.F., P.A.-A., H.I.V.-V. and J.L.P.; Visualization, A.A.-C. and J.L.P.; Supervision, D.T., H.I.V.-V., J.L.P. and I.S.; Project administration, J.L.P.; Funding acquisition, H.I.V.-V., J.L.P. and I.S. All authors have read and agreed to the published version of the manuscript.

Funding

This study was supported by MCIN with funding from the European Union NextGenerationEU (PRTR-C17.I1) within the Green Hydrogen and Energy Program—CSIC, as part of the CSIC Interdisciplinary Thematic Platform (PTI+) Transición Energética Sostenible+ (PTI-TRANSENER+) and by the Aragón Government (Research Group Reference T06-23R). The authors also acknowledge the financial support of DGAPA-PAPIIT UNAM through grant IN107923 “Licuefacción hidrotérmica de biomasa residual” and Fondo Sectorial CONACYT-SENER-Sustentabilidad Energética through Grant 207,450 and Centro Mexicano de Innovación en Energía Solar (CeMIE-Sol), within strategic project No. 120. DT is grateful to the Juan de la Cierva Incorporación (JdC-I) fellowship (Grant Number: IJC2020–045553-I) funded by MCIN/AEI/10.13039/501100011033 and by “European Union NextGenerationEU/PRTR”.

Data Availability Statement

Data are contained within the article.

Acknowledgments

Authors would like to acknowledge the use of Servicio General de Apoyo a la Investigación-SAI, Universidad de Zaragoza and the Analysis and Characterization Service of the ICB-CSIC.

Conflicts of Interest

The authors declare no conflict of interest.

References

  1. Cheng, S.; Wei, L.; Julson, J.; Muthukumarappan, K.; Kharel, P.R.; Cao, Y.; Boakye, E.; Raynie, D.; Gu, Z. Hydrodeoxygenation upgrading of pine sawdust bio-oil using zinc metal with zero valency. J. Taiwan Inst. Chem. Eng. 2017, 74, 146–153. [Google Scholar] [CrossRef]
  2. Valle, B.; Remiro, A.; García-Gómez, N.; Gayubo, A.G.; Bilbao, J. Recent research progress on bio-oil conversion into bio-fuels and raw chemicals: A review. J. Chem. Technol. Biotechnol. 2019, 94, 670–689. [Google Scholar] [CrossRef]
  3. Wang, H.; Feng, M.; Yang, B. Catalytic hydrodeoxygenation of anisole: An insight into the role of metals in transalkylation reactions in bio-oil upgrading. Green Chem. 2017, 19, 1668–1673. [Google Scholar] [CrossRef]
  4. Zhang, Y.; Fan, G.; Yang, L.; Zheng, L.; Li, F. Cooperative Effects between Ni-Mo Alloy Sites and Defective Structures over Hierarchical Ni-Mo Bimetallic Catalysts Enable the Enhanced Hydrodeoxygenation Activity. ACS Sustain. Chem. Eng. 2021, 9, 11604–11615. [Google Scholar] [CrossRef]
  5. Zakzeski, J.; Bruijnincx, P.C.A.; Jongerius, A.L.; Weckhuysen, B.M. The Catalytic Valorization of Lignin for the Production of Renewable Chemicals. Chem. Rev. 2010, 110, 3552–3599. [Google Scholar] [CrossRef]
  6. Jongerius, A.L.; Gosselink, R.W.; Dijkstra, J.; Bitter, J.H.; Bruijnincx, P.C.A.; Weckhuysen, B.M. Carbon Nanofiber Supported Transition-Metal Carbide Catalysts for the Hydrodeoxygenation of Guaiacol. ChemCatChem 2013, 5, 2964–2972. [Google Scholar] [CrossRef]
  7. Pang, J.; Sun, J.; Zheng, M.; Li, H.; Wang, Y.; Zhang, T. Transition metal carbide catalysts for biomass conversion: A review. Appl. Catal. B Environ. 2019, 254, 510–522. [Google Scholar] [CrossRef]
  8. Zhang, X.; Shi, C.; Chen, B.; Kuhn, A.N.; Ma, D.; Yang, H. Progress in hydrogen production over transition metal carbide catalysts: Challenges and opportunities. Curr. Opin. Chem. Eng. 2018, 20, 68–77. [Google Scholar] [CrossRef]
  9. Sullivan, M.M.; Chen, C.J.; Bhan, A. Catalytic deoxygenation on transition metal carbide catalysts. Catal. Sci. Technol. 2016, 6, 602–616. [Google Scholar] [CrossRef]
  10. Shilov, I.N.; Smirnov, A.A.; Bulavchenko, O.A.; Yakovlev, V.A. Effect of Ni–Mo carbide catalyst formation on furfural hydrogenation. Catalysts 2018, 8, 560. [Google Scholar] [CrossRef]
  11. Liu, S.; Wang, H.; Smith, K.J.; Kim, C.S. Hydrodeoxygenation of 2-Methoxyphenol over Ru, Pd, and Mo2C Catalysts Supported on Carbon. Energy Fuels 2017, 31, 6378–6388. [Google Scholar] [CrossRef]
  12. Ochoa, E.; Torres, D.; Moreira, R.; Pinilla, J.L.; Suelves, I. Carbon nanofiber supported Mo2C catalysts for hydrodeoxygenation of guaiacol: The importance of the carburization process. Appl. Catal. B Environ. 2018, 239, 463–474. [Google Scholar] [CrossRef]
  13. Mortensen, P.M.; Grunwaldt, J.D.; Jensen, P.A.; Knudsen, K.G.; Jensen, A.D. A review of catalytic upgrading of bio-oil to engine fuels. Appl. Catal. A Gen. 2011, 407, 1–19. [Google Scholar] [CrossRef]
  14. Rocha, A.S.; Souza, L.A.; Oliveira, R.R.; Rocha, A.B.; Teixeira da Silva, V. Hydrodeoxygenation of acrylic acid using Mo2C/Al2O3. Appl. Catal. A Gen. 2017, 531, 69–78. [Google Scholar] [CrossRef]
  15. Kim, S.K.; Yoon, D.; Lee, S.-C.; Kim, J. Mo2C/Graphene Nanocomposite As a Hydrodeoxygenation Catalyst for the Production of Diesel Range Hydrocarbons. ACS Catal. 2015, 5, 3292–3303. [Google Scholar] [CrossRef]
  16. Lee, W.S.; Kumar, A.; Wang, Z.; Bhan, A. Chemical Titration and Transient Kinetic Studies of Site Requirements in Mo2C-Catalyzed Vapor Phase Anisole Hydrodeoxygenation. ACS Catal. 2015, 5, 4104–4114. [Google Scholar] [CrossRef]
  17. Chen, C.J.; Lee, W.S.; Bhan, A. Mo2C catalyzed vapor phase hydrodeoxygenation of lignin-derived phenolic compound mixtures to aromatics under ambient pressure. Appl. Catal. A Gen. 2016, 510, 42–48. [Google Scholar] [CrossRef]
  18. Ochoa, E.; Torres, D.; Pinilla, J.L.; Suelves, I. On the hydrothermal-enhanced synthesis of highly selective Mo2C catalysts to fully deoxygenated products in the guaiacol HDO reaction. J. Environ. Chem. Eng. 2021, 9, 105146. [Google Scholar] [CrossRef]
  19. Remón, J.; Ochoa, E.; Foguet, C.; Pinilla, J.L.; Suelves, I. Towards a sustainable bio-fuels production from lignocellulosic bio-oils: Influence of operating conditions on the hydrodeoxygenation of guaiacol over a Mo2C/CNF catalyst. Fuel Process. Technol. 2019, 191, 111–120. [Google Scholar] [CrossRef]
  20. Grilc, M.; Veryasov, G.; Likozar, B.; Jesih, A.; Levec, J. Hydrodeoxygenation of solvolysed lignocellulosic biomass by unsupported MoS2, MoO2, Mo2C and WS2 catalysts. Appl. Catal. B Environ. 2015, 163, 467–477. [Google Scholar] [CrossRef]
  21. Remón, J.; Casales, M.; Gracia, J.; Callén, M.S.; Pinilla, J.L.; Suelves, I. Sustainable production of liquid biofuels and value-added platform chemicals by hydrodeoxygenation of lignocellulosic bio-oil over a carbon–neutral Mo2C/CNF catalyst. Chem. Eng. J. 2021, 405, 126705. [Google Scholar] [CrossRef]
  22. Ranga, C.; Alexiadis, V.I.; Lauwaert, J.; Lødeng, R.; Thybaut, J.W. Effect of Co incorporation and support selection on deoxygenation selectivity and stability of (Co)Mo catalysts in anisole HDO. Appl. Catal. A Gen. 2019, 571, 61–70. [Google Scholar] [CrossRef]
  23. Chen, J.; Yang, Y.; Shi, H.; Li, M.; Chu, Y.; Pan, Z.; Yu, X. Regulating product distribution in deoxygenation of methyl laurate on silica-supported Ni-Mo phosphides: Effect of Ni/Mo ratio. Fuel 2014, 129, 1–10. [Google Scholar] [CrossRef]
  24. López, M.; Hernández, D.; Laverde, J.; Pérez, S.; López, D. Catalytic Upgrading of Residual Biomass Derived Bio-oil over Molybdenum Carbide. Waste Biomass Valorization 2020, 11, 2849–2856. [Google Scholar] [CrossRef]
  25. Ameen, M.; Azizan, M.T.; Ramli, A.; Yusup, S.; Abdullah, B. The effect of metal loading over Ni/γ-Al2O3 and Mo/γ-Al2O3 catalysts on reaction routes of hydrodeoxygenation of rubber seed oil for green diesel production. Catal. Today 2020, 355, 51–64. [Google Scholar] [CrossRef]
  26. Qin, Y.; Chen, P.; Duan, J.; Han, J.; Lou, H.; Zheng, X.; Hong, H. Carbon nanofibers supported molybdenum carbide catalysts for hydrodeoxygenation of vegetable oils. RSC Adv. 2013, 3, 17485–17491. [Google Scholar] [CrossRef]
  27. Lee, H.; Kim, Y.-M.; Lee, I.-G.; Jeon, J.-K.; Jung, S.-C.; Chung, J.D.; Choi, W.G.; Park, Y.-K. Recent advances in the catalytic hydrodeoxygenation of bio-oil. Korean J. Chem. Eng. 2016, 33, 3299–3315. [Google Scholar] [CrossRef]
  28. Zhang, M.; Hu, Y.; Wang, H.; Li, H.; Han, X.; Zeng, Y.; Xu, C.C. A review of bio-oil upgrading by catalytic hydrotreatment: Advances, challenges, and prospects. Mol. Catal. 2021, 504, 111438. [Google Scholar] [CrossRef]
  29. Xu, X.; Zhang, C.; Zhai, Y.; Liu, Y.; Zhang, R.; Tang, X. Upgrading of Bio-Oil Using Supercritical 1-Butanol over a Ru/C Heterogeneous Catalyst: Role of the Solvent. Energy Fuels 2014, 28, 4611–4621. [Google Scholar] [CrossRef]
  30. Philippov, A.; Nesterov, N.; Pakharukova, V.; Kozhevnikov, I.; Martyanov, O. Advanced High-Loaded Ni–Cu Catalysts in Transfer Hydrogenation of Anisole: Unexpected Effect of Cu Addition. Catalysts 2022, 12, 1307. [Google Scholar] [CrossRef]
  31. Kennema, M.; De Castro, I.B.D.; Meemken, F.; Rinaldi, R. Liquid-Phase H-Transfer from 2-Propanol to Phenol on Raney Ni: Surface Processes and Inhibition. ACS Catal. 2017, 7, 2437–2445. [Google Scholar] [CrossRef]
  32. Chen, W.; Luo, Z.; Yu, C.; Li, G.; Yang, Y.; Zhang, H. Upgrading of bio-oil in supercritical ethanol: Catalysts screening, solvent recovery and catalyst stability study. J. Supercrit. Fluids 2014, 95, 387–393. [Google Scholar] [CrossRef]
  33. Dang, Q.; Luo, Z.; Zhang, J.; Wang, J.; Chen, W.; Yang, Y. Experimental study on bio-oil upgrading over Pt/SO42−/ZrO2/SBA-15 catalyst in supercritical ethanol. Fuel 2013, 103, 683–692. [Google Scholar] [CrossRef]
  34. Zhang, J.; Luo, Z.; Dang, Q.; Wang, J.; Chen, W. Upgrading of Bio-oil over Bifunctional Catalysts in Supercritical Monoalcohols. Energy Fuels 2012, 26, 2990–2995. [Google Scholar] [CrossRef]
  35. Jiang, Y.; Jones, S.B.; Zhu, Y.; Snowden-Swan, L.; Schmidt, A.J.; Billing, J.M.; Anderson, D. Techno-economic uncertainty quantification of algal-derived biocrude via hydrothermal liquefaction. Algal Res. 2019, 39, 101450. [Google Scholar] [CrossRef]
  36. Giaconia, A.; Caputo, G.; Ienna, A.; Mazzei, D.; Schiavo, B.; Scialdone, O.; Galia, A. Biorefinery process for hydrothermal liquefaction of microalgae powered by a concentrating solar plant: A conceptual study. Appl. Energy 2017, 208, 1139–1149. [Google Scholar] [CrossRef]
  37. Pearce, M.; Shemfe, M.; Sansom, C. Techno-economic analysis of solar integrated hydrothermal liquefaction of microalgae. Appl. Energy 2016, 166, 19–26. [Google Scholar] [CrossRef]
  38. Oshikawa, K.; Nagai, M.; Omi, S. Characterization of molybdenum carbides for methane reforming by TPR, XRD, and XPS. J. Phys. Chem. B 2001, 105, 9124–9131. [Google Scholar] [CrossRef]
  39. Guo, H.; Song, Y.; Chen, P.; Lou, H.; Zheng, X. Effects of graphitization of carbon nanospheres on hydrodeoxygenation activity of molybdenum carbide. Catal. Sci. Technol. 2018, 8, 4199–4208. [Google Scholar] [CrossRef]
  40. Cai, J.; Li, B.; Chen, C.; Wang, J.; Zhao, M.; Zhang, K. Hydrothermal carbonization of tobacco stalk for fuel application. Bioresour. Technol. 2016, 220, 305–311. [Google Scholar] [CrossRef] [PubMed]
  41. Enaime, G.; Baçaoui, A.; Yaacoubi, A.; Wichern, M.; Lübken, M. Hydrothermal carbonization of the filter bed remained after filtration of olive mill wastewater on olive stones for biofuel application. Biomass Convers. Biorefinery 2022, 12, 1237–1247. [Google Scholar] [CrossRef]
  42. Luo, Y.; Guda, V.K.; Hassan, E.B.; Steele, P.H.; Mitchell, B.; Yu, F. Hydrodeoxygenation of oxidized distilled bio-oil for the production of gasoline fuel type. Energy Convers. Manag. 2016, 112, 319–327. [Google Scholar] [CrossRef]
  43. Grilc, M.; Likozar, B.; Levec, J. Hydrotreatment of solvolytically liquefied lignocellulosic biomass over NiMo/Al2O3 catalyst: Reaction mechanism, hydrodeoxygenation kinetics and mass transfer model based on FTIR. Biomass Bioenergy 2014, 63, 300–312. [Google Scholar] [CrossRef]
  44. Junming, X.; Jianchun, J.; Yunjuan, S.; Yanju, L. Bio-oil upgrading by means of ethyl ester production in reactive distillation to remove water and to improve storage and fuel characteristics. Biomass Bioenergy 2008, 32, 1056–1061. [Google Scholar] [CrossRef]
  45. Ayala-Cortés, A.; Arcelus-Arrillaga, P.; Millan, M.; Arancibia-Bulnes, C.A.; Valadés-Pelayo, P.J.; Villafán-Vidales, H.I. Solar integrated hydrothermal processes: A review. Renew. Sustain. Energy Rev. 2021, 139, 110575. [Google Scholar] [CrossRef]
  46. Chen, D.; Wang, Y.; Liu, Y.; Cen, K.; Cao, X.; Ma, Z.; Li, Y. Comparative study on the pyrolysis behaviors of rice straw under different washing pretreatments of water, acid solution, and aqueous phase bio-oil by using TG-FTIR and Py-GC/MS. Fuel 2019, 252, 1–9. [Google Scholar] [CrossRef]
  47. Zhang, L.; Shen, C.; Liu, R. GC-MS and FT-IR analysis of the bio-oil with addition of ethyl acetate during storage. Front. Energy Res. 2014, 2, 3. [Google Scholar] [CrossRef]
  48. Rahman, M.M.; Nishu; Sarker, M.; Chai, M.; Li, C.; Liu, R.; Cai, J. Potentiality of combined catalyst for high quality bio-oil production from catalytic pyrolysis of pinewood using an analytical Py-GC/MS and fixed bed reactor. J. Energy Inst. 2020, 93, 1737–1746. [Google Scholar] [CrossRef]
  49. Ahmadi, S.; Yuan, Z.; Rohani, S.; Xu, C. Effects of nano-structured CoMo catalysts on hydrodeoxygenation of fast pyrolysis oil in supercritical ethanol. Catal. Today 2016, 269, 182–194. [Google Scholar] [CrossRef]
  50. Cheng, S.; Wei, L.; Julson, J.; Rabnawaz, M. Upgrading pyrolysis bio-oil through hydrodeoxygenation (HDO) using non-sulfided Fe-Co/SiO2 catalyst. Energy Convers. Manag. 2017, 150, 331–342. [Google Scholar] [CrossRef]
  51. Ayala-Cortés, A.; Arcelus-Arrillaga, P.; Millan, M.; Okoye, P.U.; Arancibia-Bulnes, C.A.; Pacheco-Catalán, D.E.; Villafán-Vidales, H.I. Solar hydrothermal processing of agave bagasse: Insights on the effect of operational parameters. Renew. Energy 2022, 192, 14–23. [Google Scholar] [CrossRef]
  52. Ochoa, E.; Torres, D.; Pinilla, J.L.; Suelves, I. Influence of carburization time on the activity of Mo2C/CNF catalysts for the HDO of guaiacol. Catal. Today 2020, 357, 240–247. [Google Scholar] [CrossRef]
  53. Channiwala, S.A.; Parikh, P.P. A unified correlation for estimating HHV of solid, liquid and gaseous fuels. Fuel 2002, 81, 1051–1063. [Google Scholar] [CrossRef]
  54. Wang, J.; Abdelouahed, L.; Jabbour, M.; Taouk, B. Catalytic hydro-deoxygenation of acetic acid, 4-ethylguaiacol, and furfural from bio-oil over Ni2P/HZSM-5 catalysts. Comptes Rendus. Chim. 2021, 24, 131–147. [Google Scholar] [CrossRef]
  55. Oh, S.; Kim, U.-J.; Choi, I.-G.; Choi, J.W. Solvent effects on improvement of fuel properties during hydrodeoxygenation process of bio-oil in the presence of Pt/C. Energy 2016, 113, 116–123. [Google Scholar] [CrossRef]
Figure 1. Diffractogram of a Mo2C/CNF catalyst with different Mo concentrations (10, 20, and 30 wt.%).
Catalysts 13 01500 g001
Figure 2. SEM micrographs (secondary and backscattered electrons: left and right panels, respectively) and elemental mappings of (a) Mo2C(10)/CNF, (b) Mo2C(20)/CNF, and (c) Mo2C(30)/CNF catalysts.
Catalysts 13 01500 g002
Figure 3. TEM images of (a) Mo2C(10)/CNF, (b) Mo2C(20)/CNF, and (c) Mo2C(30)/CNF catalysts.
Catalysts 13 01500 g003
Figure 4. STEM images of (a) Mo2C(10)/CNF, (b) Mo2C(20)/CNF, and (c) Mo2C(30)/CNF catalysts.
Catalysts 13 01500 g004
Figure 5. Effect of Mo concentration in the Mo2C/CNF catalyst on the yields of different upgraded bio-oils obtained from (a) corncob (C200) and (b) agave bagasse (A250) raw bio-oils at 350 °C.
Catalysts 13 01500 g005
Figure 6. Van Krevelen diagram of the raw bio-oils and the upgraded oils influenced by Mo concentration.
Catalysts 13 01500 g006
Figure 7. FTIR spectra for upgraded bio-oils derived from (a) C200 and (b) A250 bio-oils.
Catalysts 13 01500 g007
Table 1. Mo2C crystal size (XRD) and Mo concentration (ICP-OES and XPS) for Mo2C/CNF catalysts with different Mo loadings.
CatalystBulk Mo
(wt.%)
Surface Mo (wt.%)Ratio Mo/C (wt.%)BET Surface Area (m2/g)
Mo2C(10)/CNF13.016.80.2455
Mo2C(20)/CNF20.019.60.2936
Mo2C(30)/CNF27.030.10.5529
Table 2. Chemical composition, higher heating value, degree of deoxygenation, and energy efficiency of raw and upgraded bio-oils.
Bio-OilC
(wt.%)
H
(wt.%)
O
(wt.%)
N
(wt.%)
HHV
(MJ/kg)
DOD (wt.%)EE
(%)
C20061.06.430.81.825.6--
Mo2C(10)/CNF-C20075.19.014.21.735.372.183.2
Mo2C(20)/CNF-C20075.49.4313.611.536.074.581.0
Mo2C(30)/CNF-C20067.38.922.61.031.750.483.4
A25068.46.624.30.729.1--
Mo2C(10)/CNF-A25075.78.515.10.734.869.059.6
Mo2C(20)/CNF-A25071.18.419.80.632.756.959.2
Mo2C(30)/CNF-A25070.78.720.00.532.948.470.7
Table 3. GC–MS analysis results. Organic compounds in the raw and upgraded oils of corncob and agave bagasse (GC–MS area%).
Corncob Bio-OilsAgave Bio-Oils
C-200Mo2C(10)/CNF-C-200Mo2C(20)/CNF-C200Mo2C(30)/CNF-C200A-250Mo2C(10)/CNF-A250Mo2C(20)/CNF-A250Mo2C(30)/CNF-A250
Phenolic compounds18.124.320.530.729.12718.018.8
Esters1.541.943.743.51.848.839.042.3
Carboxylic acids10.72.1n.d.2.02.2n.d.n.d.3.3
N-compounds46.21114.84.924.93.38.13.1
S-compounds2.61.70.90.93.21.00.71.7
Ketones2.77.36.15.70.76.913.25.9
Epoxides1.92.01.5n.d.n.d.0.3n.d.n.d.
Alcohols1.21.10.61.8n.d.6.63.49.6
Other O-compounds13.27.39.38.232.45.214.914.1
Aldehydes0.41.41.51.82.4n.d.n.d.0.5
Alkanes1.60.8n.d.n.d.3.30.41.0n.d.
Aromaticsn.d.1.41.20.5n.d.0.81.70.7
Table 4. Gas product composition (% mol).
Raw OilCatalystH2CH4CO2COOthersPcold (bar)
C200Mo2C(10)/CNF88.52.47.401.723.7
Mo2C(20)/CNF87.92.17.202.824.3
Mo2C(30)/CNF87.72.88.001.525.6
A250Mo2C(10)/CNF88.26.75.000.121.5
Mo2C(20)/CNF81.16.66.705.620.4
Mo2C(30)/CNF88.74.16.101.126
Table 5. Comparison of HDO-upgraded bio-oils from conventional and solar heating.
Ref.BiomassT
(°C)
CatalystMo
(wt.%)
τ
(min)
H2 Pressure
(bar)
Yoil
(wt.%)
HHV
(MJ/kg)
This workCorncob (C200)350Mo2C/CNF10%120105534
This workAgave (A250)350Mo2C/CNF10%120104834
[24]Acacia sawdust350Mo2C-24050-41
[25]Rubber seed350Mo/γ-Al2O312%-3544-
[25]Rubber seed350Mo/γ-Al2O315%-3562-
[39]Maize oil260Mo2C/CNS<20%1802567-
Disclaimer/Publisher’s Note: The statements, opinions and data contained in all publications are solely those of the individual author(s) and contributor(s) and not of MDPI and/or the editor(s). MDPI and/or the editor(s) disclaim responsibility for any injury to people or property resulting from any ideas, methods, instructions or products referred to in the content.

