Article

Deciphering the Pivotal Reaction Conditions for Hydrogen Production from Tar Catalytic Cracking by Perovskite

1
School of Environmental Science and Engineering, Tianjin University, Tianjin 300350, China
2
State Key Laboratory of Environmental Criteria and Risk Assessment, Chinese Research Academy of Environmental Sciences, Beijing 100012, China
*
Author to whom correspondence should be addressed.
Catalysts 2024, 14(3), 188; https://doi.org/10.3390/catal14030188
Submission received: 6 February 2024 / Revised: 6 March 2024 / Accepted: 8 March 2024 / Published: 10 March 2024
(This article belongs to the Section Industrial Catalysis)

Abstract

:
The catalytic cracking of pyrolysis gasification tar into H2 has garnered significant attention due to its exceptional conversion efficiency. In this study, the effects of pollutant concentration, residence time, weight hourly space velocity (WHSV), and reaction temperature on the hydrogen performance of LaFe0.5Ni0.5O3 perovskite were comprehensively investigated. Results revealed that moderate pollutant concentration (0.3 g/L), low-medium residence time (250 SCCM), and low WHSV (0.24 gtoluene/(gcat·h)) facilitated efficient interaction between LaFe0.5Ni0.5O3 and toluene, thus achieving high hydrogen production. An increase in reaction temperature had minimal effect on the hourly hydrogen production above 700 °C but caused a significant increase in methane production. Additionally, the effects of oxygen evolution reactions, methane reactions, and methane catalytic cracking reactions of perovskite induced by different reaction conditions on tar cracking products were discussed in detail. Compared to previous reports, the biggest advantages of this system were that the hydrogen production per gram of tar was as high as 1.002 L/g, and the highest hydrogen content in gas-phase products reached 93.5%, which can maintain for approximately 6 h. Finally, LaFe0.5Ni0.5O3 showed good thermal stability, long-term stability, and catalyst reactivation potential.

Graphical Abstract

1. Introduction

The depletion of fossil fuels, the global energy demand, and the environmental issues resulting from the burning of fossil fuels have led to increased global attention towards renewable energy development [1]. Hydrogen, recognized for its minimal environmental footprint, played a significant role in mitigating air pollution and reducing greenhouse gas emissions [2,3]. Ensuring the economical, efficient, and clean acquisition of hydrogen was a critical focus in the development of hydrogen production technologies. Biomass pyrolysis gasification for green hydrogen production held great potential. However, Tar, a by-product of the pyrolysis gasification process, posed a challenge to the system’s operational stability, obstructed the removal of pollutants, hampered resource product utilization, and posed environmental hazards [4,5]. Despite these issues, tar is a valuable source of hydrocarbons and contains considerable chemical energy, making it a candidate for high-energy utilization [6]. Employing catalysts to break down tar into hydrogen and other flammable gases at high temperatures addressed a critical obstacle in biomass pyrolysis gasification for hydrogen production, thereby enhancing the system’s hydrogen output efficiency [7].
Nickel-based catalysts were currently the main choice for catalytic cracking of tar to produce hydrogen due to their economy and efficiency [8,9]. Doping nickel-based catalysts with different metals can improve their hydrogen production performance. Huang et al. pointed out that the performance of carbon-supported bimetallic nickel-copper catalysts is superior to that of single metal catalysts, with tar conversion rates and hydrogen production reaching 93.2% and 0.304 L/g, respectively, at 800 °C [10]. Li et al. reported that the multi-metal doped Ni-4% Ce/HZSM-5 catalyst exhibited good catalytic activity and stability, with a toluene conversion rate of 94.5% [11]. Huang et al. demonstrated that toluene conversion was up to 96.83% by using ferrite NiFe2O4 as catalysts, with a hydrogen production rate of 0.91 L/g [6]. Zhang et al. demonstrated that toluene conversion was up to 97.5% at 750 °C by using ferrite NiFe2O4@SBA-15 as catalysts, with syngas yield of 34.22 mmol/g and good stability after 15 cycles [12]. Metal-doped nickel-based catalysts had research potential.
As a composite metal oxide, nickel-based perovskite catalysts had been prepared for catalytic cracking, catalytic reforming, and chemical looping partial oxidation of tar [13,14,15,16]. Thanks to the synergistic effect of different metals in optimizing the perovskite performance, it had shown good catalytic performance in catalytic cracking and reforming hydrogen production. Cui et al. investigated the catalytic cracking performance of LaNi0.8Fe0.2O3 for coal tar and found that its hydrogen yield can reach 20.9 mmol/g [17]. Gai et al. investigated the catalytic performance of La0.8Sr0.2Ni0.8Fe0.2O3 catalyst for tar cracking. It was confirmed that it achieved 100% conversion of tar in a short reaction time, with a hydrogen yield of 27.5 mmol/g [18]. However, current research on the catalytic cracking or reforming performance of nickel-based perovskites focused on dry and wet reforming of methane [19,20,21], and further research on tar was urgently needed.
The catalytic cracking and reforming performance of tar was significantly affected by reaction conditions [22,23]. The study by Lu et al. showed that carbon-based Fe-Ni-Ca catalysts achieved a hydrogen yield of 288.41 mL/g at 800 °C and discussed the effects of heating rate, pyrolysis temperature, and catalyst calcination temperature on their performance [23]. The pyrolysis temperature of 800 °C and heating rate of 10 °C/min can be used as the optimum reaction conditions for industrial hydrogen production using carbon-based Fe-Ni-Ca catalysts. Gu et al. reported that in the process of LaFe1−xNix steam catalytic reforming of toluene, increasing the steam volume can increase the hydrogen production of the system, and increasing the temperature is beneficial for the conversion of toluene [24]. Importantly, the relationship between the performance of nickel-based perovskite catalytic cracking tar and reaction conditions had not been systematically analyzed, and the strategies to enhance hydrogen production had not been provided.
To enhance the efficiency of hydrogen generation through perovskite catalytic cracking tar, this research explored the effects of various factors, including reaction temperature, pollutant concentration, residence time, and weight hourly space velocity (WHSV) on the hydrogen production of LaFe0.5Ni0.5O3 for the first time. Measurements were taken to determine the hydrogen production per gram of tar, the proportion of hydrogen in gas-phase products, and the hourly hydrogen production under different process parameters. Combined with real-time monitoring of hydrogen production, the reaction process and potential influencing factors were analyzed. A comparison with existing studies verified the superior catalytic effectiveness of LaFe0.5Ni0.5O3 in tar decomposition for hydrogen generation and underscored the significance of optimizing reaction conditions to boost hydrogen production. Additionally, the research assessed the thermal durability of perovskite, the sustained stability of hydrogen generation from tar catalytic cracking, and the catalyst’s reactivation potential.

2. Results and Discussion

2.1. Effect of Pollutant Concentrations

The effect of pollutant concentration on the catalytic cracking performance of perovskite for tar was discussed at a reaction temperature of 700 °C, WHSV of 0.72 gToluene/(gcat·h) and carrier gas flow rate of 150 SCCM. The pollutant concentration in the fixed bed was controlled by the mass of tar input per second and the amount of catalyst filling. The production rates of various products from the continuous catalytic cracking of tar for 6 h were shown in Figure 1a,b. Hydrogen (H2) was the major gas-phase product of perovskite catalytic cracking tar, much higher than methane (CH4), carbon monoxide (CO), and carbon dioxide (CO2). Accompanied by the elevated pollutant concentration from 0.2 g/L to 0.3 g/L in the fixed bed reactor, the H2 production per gram of tar was increased from 0.624 L/g to 0.827 L/g. This was attributed to the increased utilization of active sites on perovskite due to the elevated pollutant concentration, which promoted more cracking of toluene into H2. Although the amount of pollutants passing through each gram of catalyst per unit time is controlled to be the same (WHSV), due to the constant diameter of the quartz tube, the amount of pollutants passing through the catalyst surface after filling still varies under different pollutant concentrations. The number of toluene molecules on a single micro interface increases with the increase of pollutant concentration. As the number of toluene molecules gradually increases, more active sites on a single micro interface can participate in the adsorption and degradation process of toluene, promoting more toluene to be cracked per unit time. Additionally, the impact of pollutant concentration on chemical equilibrium also needs to be considered. Under high toluene concentration conditions, the reaction will proceed toward the production of fewer small molecules, resulting in an increase in hydrogen production. The H2 production per gram of tar was decreased when the tar concentration was greater than 0.3 g/L due to the absence of available active sites on the catalyst. The trend of carbon production per gram of tar was consistent with that of H2 production, further confirming the above findings.
The variation of the gas phase product distribution with the pollutant concentration was summarized in Figure 1c. Pollutant concentration led to an increase in the volume percentage of H2 in the gas phase product. With the pollutant concentration increased from 0.2 g/L to 0.4 g/L, the volume percentage of H2 was increased by nearly 7.53%, reaching a maximum of 83.12%. Correspondingly, the volume percentage of methane was decreased by 6.96%. This was attributed to the catalytic cracking of methane to produce hydrogen and carbon by nickel atoms at a suitable reaction temperature (500–800 °C) [25].
The real-time volume percentages of H2, CH4, and CO during the 6 h continuous reaction were summarized in Figure 1d–f. The volume percentage of H2 showed high stability during the reaction. As the pollutant concentration rose to 0.35 g/L, the real-time volume proportion of H2 was gradually increased. The H2 proportion was stabilized at more than 85% when the pollutant concentration was 0.3 g/L and 0.35 g/L. The highest proportion of hydrogen components can reach 89.9% (0.3 g/L). At high concentrations (0.4 g/L), the H2 proportion was decreased with the extension of reaction time. The component fluctuations at low concentration (0.2 g/L) were due to the uneven distribution of trace contaminants in the large-volume reactor. The real-time volume fraction of methane was decreased as the hydrogen proportion increased. The highest volume proportion of methane can reach 26.2%, and the lowest proportion can be stable at 9–12%. The real-time volume proportion of CO followed the same trend as that of hydrogen, and its production was attributed to the oxygen precipitation reaction of perovskite [16,17,26].
The real-time H2 production rate is shown in Figure 1g. When the pollutant concentration was greater than 0.3 g/L, the trends of the hydrogen production rate and the production rate over time were basically the same. This indicated that continuously increasing the pollutant concentration had a limited improvement on the hydrogen production efficiency of the catalyst. Increasing the pollutant concentration had a minimal effect on the hydrogen production rate under high concentrations. The trends of the real-time production rates of methane and carbon monoxide were consistent with those of hydrogen. And the production efficiency could be improved by increasing the pollutant concentration at low and medium concentrations.

2.2. Effect of Residence Time

The effect of residence time on the performance of perovskite catalytic cracking tar was discussed under the conditions of a reaction temperature of 700 °C, a space velocity of 0.72 gtoluene/(gcat·h), and a pollutant concentration of 0.4 g/L. The contaminant residence time in the fixed bed was controlled by the input tar mass per second, catalyst loading, and carrier gas flow rate. The yields of various products produced by continuous catalytic cracking of tar for 6 h were shown in Figure 2a,b. As the carrier gas flow rate increased from 100 SCCM to 150 SCCM, the H2 production per gram of tar did not change much and remained between 0.671 L/g and 0.8 L/g. The small decrease in gas production rate caused by the carrier gas flow rate was attributed to insufficient reaction. The hydrogen production per tar was gradually increased from 0.671 L/g (150 SCCM) to 1.002 L/g (250 SCCM) with the further increasing flow rate. This may be attributed to the rapid release of active sites or the reduction of side reactions. Theoretically, the carbon produced by toluene cracking can be oxidized to CO or CO2 under the action of micro-oxidation sites [27,28]. In addition, H2 produced by toluene cracking could be converted into methane under the action of metal active sites (especially nickel) in perovskite [29]. However, the production of H2 and CH4 increased with the residence time decreased, while the production of CO and CO2 decreased (Figure 2f). This indicated that the products of toluene cracking did not have enough time to undergo secondary reactions with the residence time shortened. Nickel and iron active sites preferentially catalyze the cracking of toluene to release H2. When the flow rate was increased to 300 SCCM, the hydrogen production per gram of tar reached the minimum. This was also attributed to insufficient reaction between the active sites and toluene due to the residence time being too low. The trends of the carbon and methane production per gram of tar were consistent with the H2 production trends, further confirming the above findings.
The variation of gas phase product distribution with pollutant concentration was summarized in Figure 2c. Residence time had little effect on the volume percentage of H2 in the gas phase product. When the carrier gas flow rate was increased from 100 SCCM to 300 SCCM, the volume percentage of H2 only was decreased by 3.04%. However, the volume percentage of methane was increased by 4.47%. This showed that low residence time would promote the existence of hydrogen in the form of methane, which was not conducive to hydrogen production in perovskites.
The real-time volume percentages of gas phase products during the continuous reaction were summarized in Figure 2d–f. The stabilized volume percentage of H2 was higher than 81.9% (300 SCCM) and could reach up to 90.4% (200 SCCM). When the carrier gas flow rate was lower than 200 SCCM, there was basically no difference in hydrogen volume percentage. When the carrier gas flow rate was increased from 200 SCCM to 300 SCCM, the volume percentage of hydrogen gradually was decreased, which was attributed to insufficient tar reaction under short residence time. The real-time volume fraction of methane was increased as the proportion of hydrogen was decreased. The volume proportion of methane reached up to 16.1%, and the lowest was stable at about 9%. The real-time volume percent of CO was decreased as the reaction proceeded, which proved that there was a release process of oxygen element during the perovskite catalytic cracking of tar, and it mainly played an important part in the early stage of the reaction [21,30]. Accompanying the reaction, the oxygen element in the perovskite was continuously consumed, resulting in the production of no oxygen-containing compounds.
The real-time H2 production rate is shown in Figure 2g. The hydrogen production per hour can be stabilized at 6 L/h (250 SCCM), and its change pattern with residence time was consistent with the hydrogen production per gram of tar. Along with the reaction, the methane production per hour at each residence time was relatively stable and did not fluctuate significantly. This showed that the stability of the methanogenesis process was not easily affected by processes such as catalyst reduction and had advantages over the hydrogen production process.

2.3. Effect of Weight Hourly Space Velocity

The effect of WHSV on perovskite catalytic cracking tar was discussed under the conditions of 700 °C, carrier gas flow rate of 150 SCCM, and pollutant concentration of 0.4 g/L. WHSV was controlled by catalyst filling amount. The yields of various products produced by tar continuous catalytic cracking for 6 h were shown in Figure 3a,b. With the increase of WHSV from 0.24 gtoluene/(gcat·h) to 1.44 gtoluene/(gcat·h), the H2 yield per gram of tar was gradually decreased from 0.98 L/g to 0.48 L/g. The variation of CH4, CO, CO2, and carbon yield per gram of tar was consistent with that of H2. This showed that low WHSV was conducive to the full occurrence of catalytic cracking reaction and improved the catalytic efficiency and hydrogen generation efficiency of the catalyst.
Figure 2c summarizes the variation of total gaseous product distribution with WHSV. WHSV had little effect on the volume percentage of H2 in the gas phase product, which was distributed in the range of 78.52–83.4%. The lowest volume percentage of hydrogen and the highest volume percentage of methane both occurred at the maximum WHSV of 1.44 gtoluene/(gcat·h). The volume percentage of carbon monoxide was increased with the decrease of WHSV. It was attributed to the full occurrence of perovskite oxygen evolution reaction at low WHSV [31,32].
The real-time volume percentage of gas phase products during the continuous reaction was summarized in Figure 2d–f. When WHSV was less than 0.72 gtoluene/(gcat·h), the volume percentage of H2 can be stabilized at more than 83.3% (0.72 gtoluene/(gcat·h)), and the highest can be stabilized to 90.5% (0.36 gtoluene/(gcat·h)). An increase in WHSV resulted in a rapid stabilization of hydrogen volume percentage due to an increase in tar input per hour. A rapid decrease in hydrogen volume percentage occurs under high WHSV (1.44 gtoluene/(gcat·h)) conditions, which was attributed to the decline of hydrogen production performance of the catalyst under heavy pollutant loading. Combining with the real-time gas production changes in Figure 3g,h, it can be seen that the reason for the decrease in the proportion of hydrogen and the increase in the proportion of methane was mainly due to the decrease of hydrogen production, but had little correlation with the change of methane production. The effect of WHSV on hydrogen production was significantly higher than that of methane.
The real-time production rates of different products are shown in Figure 3g–i. The higher the WHSV, the more obvious the reduction of hydrogen production per hour. The methane production per hour at different space velocities was relatively stable without significant fluctuations. It showed that the change in gas composition caused by mass space velocity was mainly due to the influence of space velocity on the hydrogen production path. In addition, the low and medium WHSV was helpful in increasing the hydrogen and methane production in the reaction process, which was attributed to the full pyrolysis of toluene. The output of CO per hour was decreased with the reaction, which proved the occurrence of a perovskite oxygen evolution reaction. Low WHSV was helpful for the full reaction between carbon and reactive oxygen species to produce more CO.

2.4. The Influence of Reaction Temperature

The effect of reaction temperature on the performance of perovskite catalytic cracking tar was investigated under the condition of WHSV of 0.72 gtoluene/(gcat·h). The yields of various products produced by continuous catalytic cracking of tar for 6 h were shown in Figure 4a,b. Almost no products such as H2, CO, or CH4 were produced at 600 °C, indicating that the catalytic cracking of tar was able to promote by perovskite above 600 °C. As the reaction temperature was raised from 600 °C to 800 °C, the hydrogen production per gram of tar was gradually increased from 0.001 L/g to 0.266 L/g. The hydrogen production per gram of tar was reduced at 900 °C. The carbon production per gram of tar was decreased from 0.535 g/gtoluene to 0.299 g/gtoluene, and the methane production per gram of tar was increased from 0.007 L/g to 0.094 L/g, with the temperature increasing from 700 °C to 900 °C. The selectivity of methane products was improved at high reaction temperatures in the catalytic cracking, attributed to the methanation reaction above 800 °C promoting the combination of carbon elements with hydrogen [33,34].
Figure 4c summarizes the distribution of total gas-phase products as a function of reaction temperature. Low temperature (600 °C) was not conducive to the catalytic cracking reaction, and only a small amount of synthesis gas was produced, mainly composed of methane. The volume percentage of H2 in gas-phase products was decreased with increasing temperature, and the synthesis gas with the highest proportion of hydrogen was obtained at 700 °C, reaching 93.5%. The proportion of methane in the synthesis gas continued to increase above 700 °C, reaching a maximum of 30.2% at 900 °C. This also confirmed the occurrence of methanation reaction induced by high temperature.
The real-time volume percentage of gas-phase products during the continuous reaction was summarized in Figure 4d–f. The real-time proportion of hydrogen in synthesis gas was the most stable at 700 °C, exceeding 90%. The proportion of hydrogen gas showed a slight decrease with the prolongation of reaction time at 800 °C and 900 °C, attributed to the high hydrogen concentration and high temperature promoting the occurrence of methanation reaction. The variation of methane proportion in syngas over time also proved this point.
The real-time production rates of different products are shown in Figure 3g–i. The stable hydrogen production per hour was around 0.8 L/h at reaction temperatures ranging from 700 °C to 900 °C. As the reaction temperature increased (700–900 °C), the methane production per hour continued to increase, with the highest stable at 0.4 L/h (900 °C). The methane production per hour was the lowest at 700 °C, stable at 0.028 L/h. The variation pattern of hydrogen and methane production per hour indicated that the temperature significantly affected the selectivity of methane products and had a relatively small impact on hydrogen production when the reaction temperature was sufficiently high (≥700 °C).
The proportion of CO in syngas (Figure 4f) and hourly production (Figure 4i) indicated that oxygen-active sites in perovskite could participate in the reaction at low temperatures (600 °C) to promote the production of methane and carbon monoxide and obtain a small amount of hydrogen gas. Oxygen-active sites in perovskite were more easily activated than metal-active sites to promote tar cracking.

2.5. Comparison of Catalytic Performance

Compared with the previous literature on catalytic pyrolysis of tar or tar model compounds, which is shown in Table 1. The reaction temperature, tar conversion rate, hydrogen production efficiency, proportion of hydrogen in gas-phase products, and reaction time were mainly compared. The reaction temperature of the currently studied was concentrated between 600–900 °C, and a higher tar conversion rate was achieved at 900 °C. Among them, the tar conversion rate of Ni-4% Fe/HZSM-5 can reach 99.1% (40 min) at 900 °C, excluding some reports of extremely short reaction time [35]. In this work, 99.9% of the tar conversion rate can be achieved at 900 °C, and 99.4% of the tar conversion rate can be achieved at 800 °C by adjusting the reaction conditions. Even at 700 °C, the tar conversion rate can reach 93.6%. It was worth noting that the tar conversion rate reported in this work was the average tar conversion rate of continuous operation for 6 h, indicating that the catalyst involved in this work had good catalytic stability.
In addition, in the current reported work, without the involvement of gasifying agents, the proportion of hydrogen in gas-phase products was generally concentrated at 30% to 50%, with a maximum of 71.48%. The hydrogen production per gram of tar was mainly concentrated at 0.1 L/g–0.3 L/g, with a maximum of 0.91 L/g and a minimum of 0.039 L/g. In this work, the proportion of hydrogen gas in the gas-phase products was concentrated in the range of 70% to 90%, with a maximum of 93.5% and a minimum of 67.8%, excluding the scenario of unsuccessful catalyst activation (600 °C). Under different reaction conditions, the hydrogen production per gram of tar was mainly concentrated at 0.6 L/g–0.9 L/g, with a maximum of 1.002 L/g and a minimum of 0.203 L/g. Prove that the LaFe0.5Ni0.5O3 used in this work had good hydrogen production performance and was significantly superior to the reported work. At the same time, it also reflected the importance of regulating the reaction conditions.

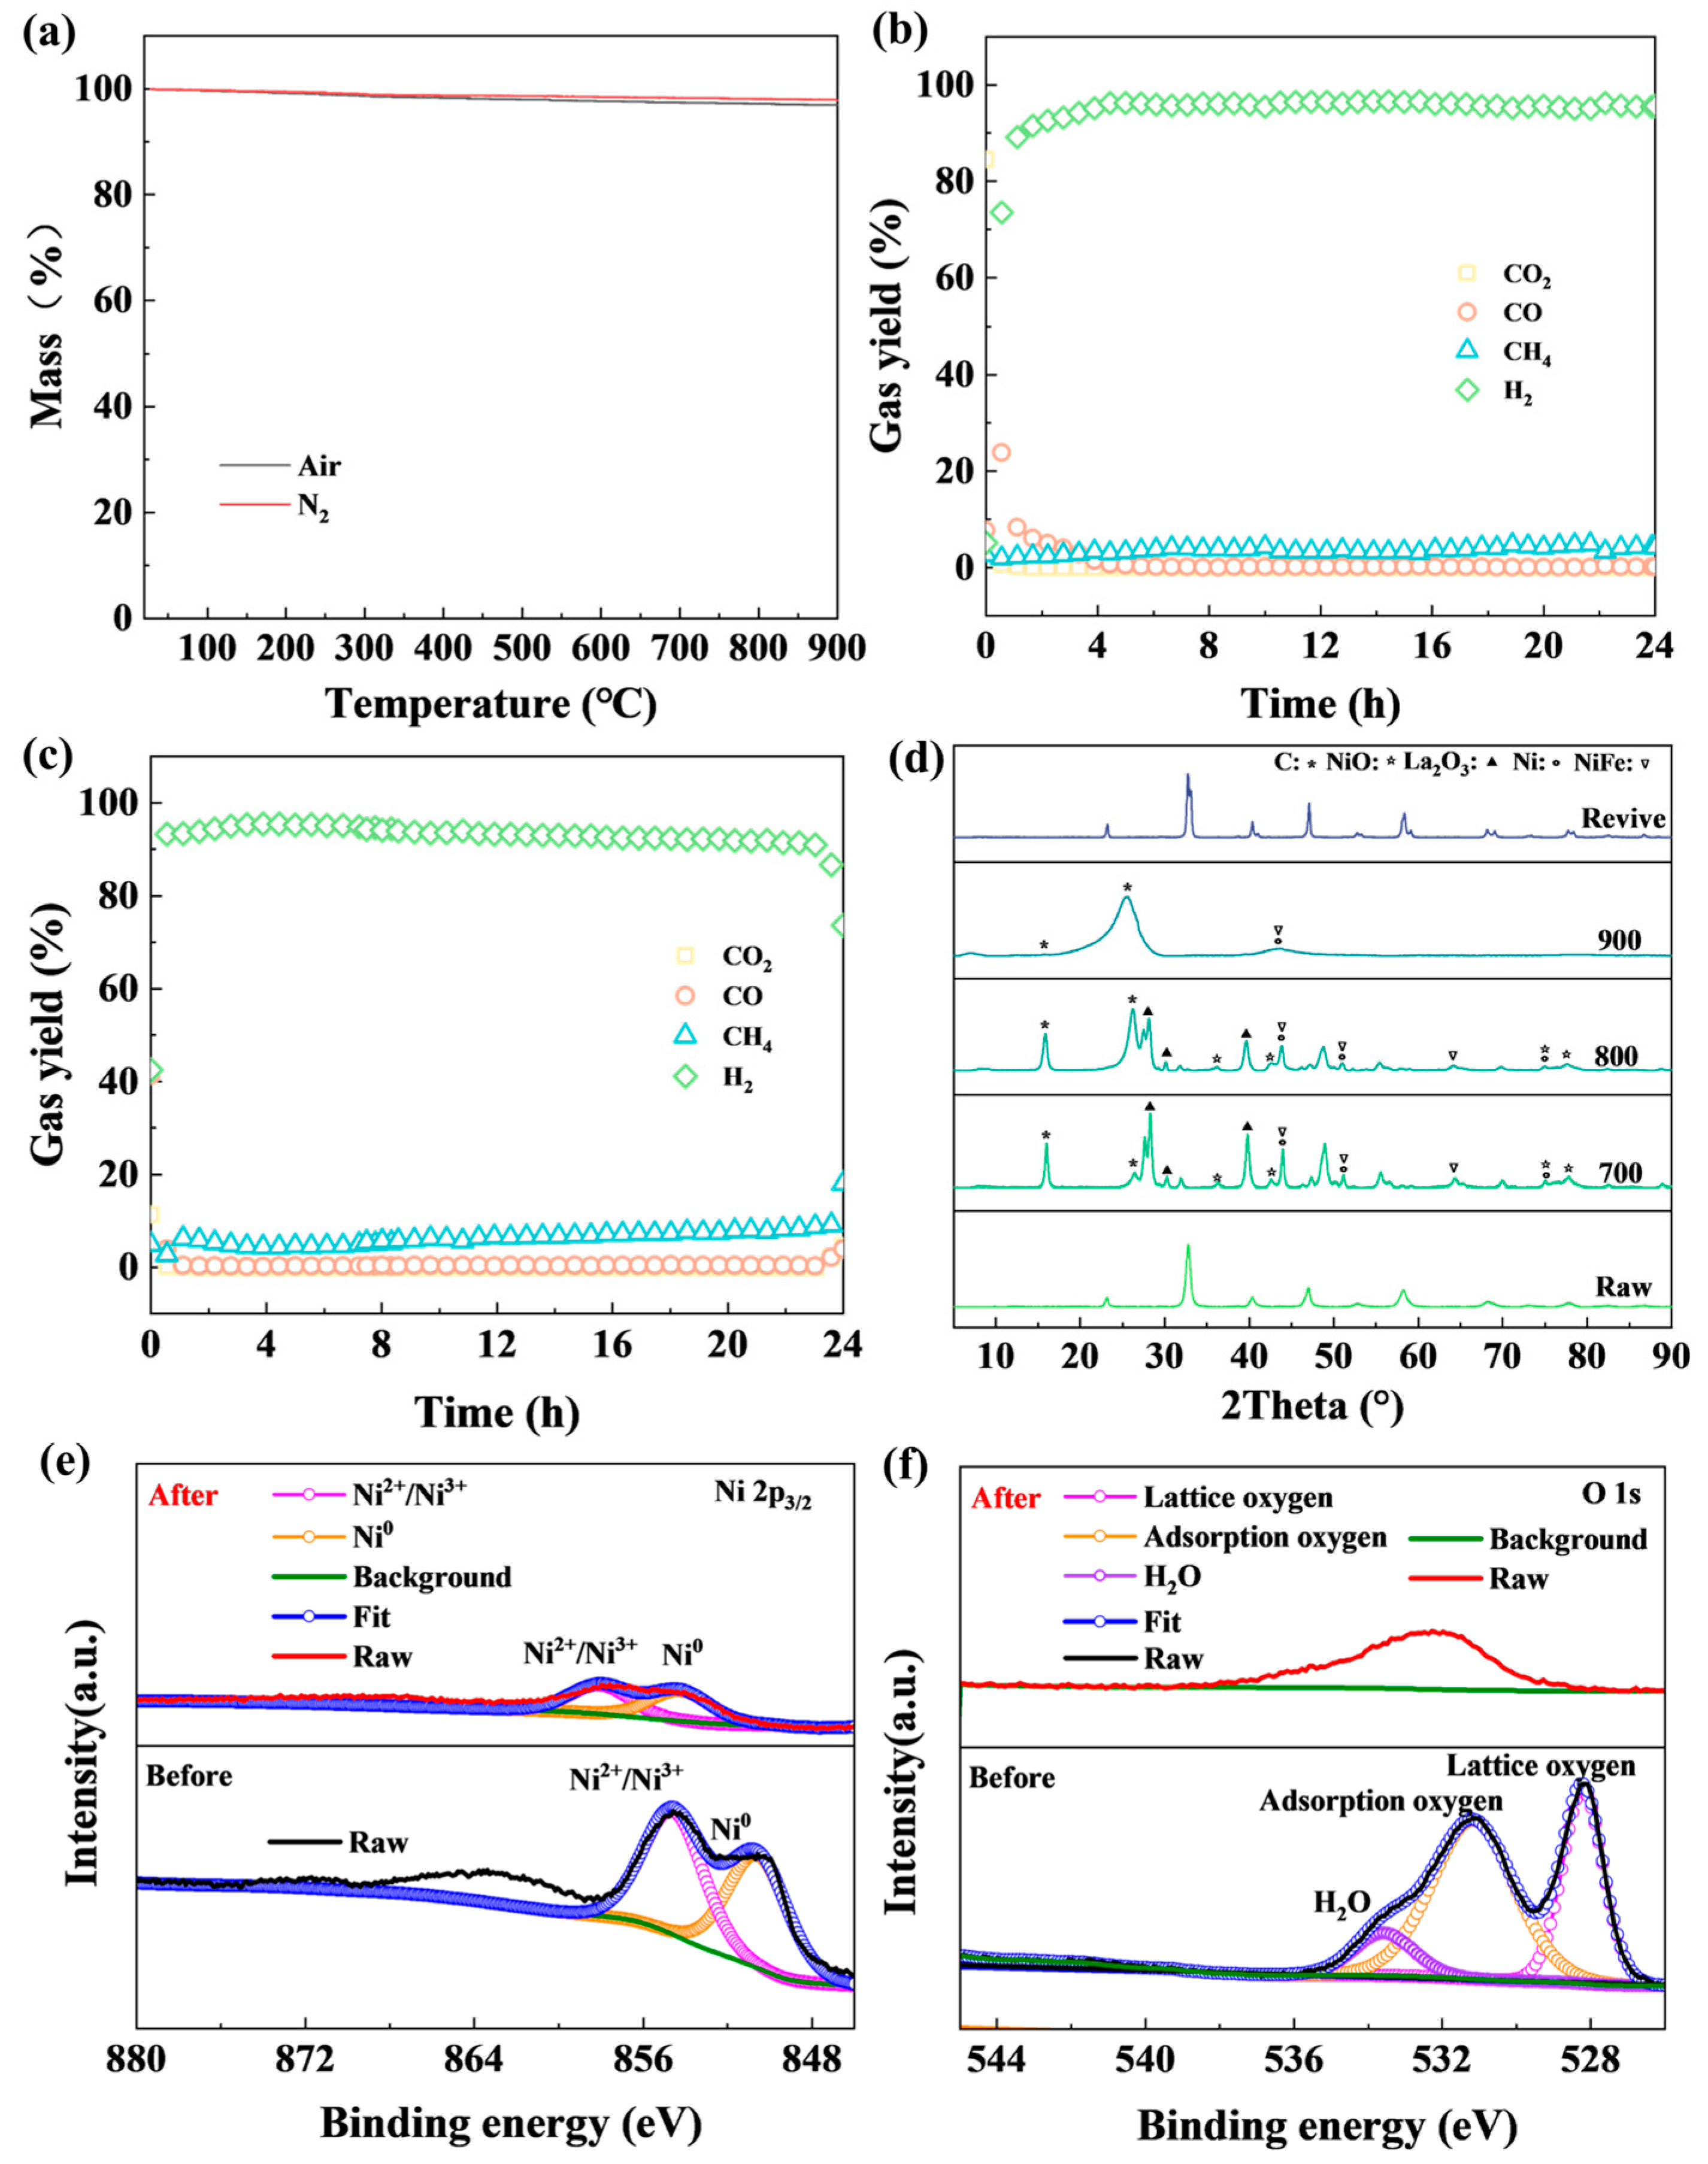
2.6. Catalyst Stability Evaluation

The perovskite catalyst prepared in this work exhibited good stability. The thermogravimetric analysis results of the original catalytic material in air and nitrogen atmospheres showed that the material had good thermal stability below 900 °C and was not prone to thermal decomposition (Figure 5a). The good thermal stability was attributed to the coexistence of nickel and iron elements at the B site. Yan et al. confirmed that doping Fe in LaNiO3 made it more stable at high temperatures, especially LaFe0.5Ni0.5O3 [45]. Chava et al. also confirmed that the structural failure of LaNiO3 under reducing and reaction conditions made it easy to deactivate [46]. The metal-support interactions, catalytic activity, thermal stability, and carbon tolerance were improved by substituting Ni with alkaline earth metals or transition metals.
The long-term stability evaluation was conducted under the following conditions: a reaction temperature of 700 °C, a space velocity of 0.72 gtoluene/(gcat·h), a carrier gas flow rate of 150 SCCM, and a pollutant concentration of 0.4 g/L. The results showed that the perovskite had a stable distribution of gas-phase components within 24 h without gasifying agents, demonstrating its good catalytic stability (Figure 5b).
The XPS spectrum of the perovskite after the reaction showed a change in the species distribution of nickel and oxygen elements (Figure 5e,f). Ni2+/ Ni3+ was reduced to Ni0 [17,47,48,49]. The peak of Ni in the catalyst after the reaction shifted to the direction of high binding energy, indicating that Ni was closer to the metallic state in the catalyst after the reaction but still carried a negative charge [25]. The disappearance of lattice oxygen peaks on the surface of the material after the reaction was attributed to the consumption of adsorbed oxygen and the transformation of lattice oxygen by the surface oxygen evolution reaction [21,50,51]. This was consistent with previous speculation about the occurrence of oxygen evolution reaction in perovskites [52]. Numerous reports have confirmed that carbon can be oxidized into CO and CO2 by lattice oxygen after transfer or diffusion [28,53,54,55]. The process in this study was similar to the existing reports of oxygen transfer and conversion process in Ni-supported perovskite during catalytic cracking tar. During the toluene catalytic cracking of LaFe0.5Ni0.5O3 perovskite, surface-adsorbed oxygen on the perovskite was first desorbed. Subsequently, lattice oxygen within the perovskite was converted to adsorbed oxygen to participate in the reaction.
The XRD pattern showed that the catalyst exhibits characteristic peaks of C [18,56], Ni [6], NiO [13,26], La2O3 [13,24], and Ni-Fe [18] after the reaction (Figure 5d), indicating that the perovskite was reduced during the catalytic cracking of tar, producing zero-valent metals and alloys to promote hydrogen evolution reaction. However, the perovskite showed significant structural changes after 24 h of continuous reaction. The distribution of La, Fe, Ni, and O elements on the surface of the perovskite after the reaction was uniform, and no sintering or stacking occurred (Figure 6a–d). This indicated that the material still exhibited good reactivity. The small change in crystallite size of the regenerated catalyst may be due to the change in metal dispersion caused by the growth of carbon filaments. The recrystallization and growth of grains during high-temperature calcination also need to be considered.
In addition, the material was calcined for 2 h in a muffle furnace under an air atmosphere of 700 °C to obtain a revived material. The XRD characterization results showed that the structure of the revived catalyst was effectively restored, indicating that the material had good reusability.

3. Material and Methods

3.1. Preparation of Perovskite

LaFe0.5Ni0.5O3 were prepared using the sol-gel method, using citric acid and ethylene glycol as the complexing agent. The desired amount of La(NO3)2·6H2O (Macklin, Shanghai, China), Fe(NO3)3·9H2O (Macklin, Shanghai, China), Ni(CH3COO)2·4H2O (Macklin, Shanghai, China), citric acid monohydrate (Macklin, Shanghai, China) and ethylene glycol (Macklin, Shanghai, China) with a stoichiometric amounts of 1:0.5:0.5:2.4:0.96 were weighed and sequentially added to deionized water. The molar ratio of lanthanum to deionized water was 1:55. The mixture was stirred at 25 °C for 30 min and then heated to 80 °C for 90–120 min until a viscous gel was formed. Then, the samples were dried at 105 °C for 24 h, followed by calcined at 700 °C for 4 h, and finally cooled to 500 °C and calcined for 2 h.

3.2. Catalyst Activity Testing

A vertical fixed-bed reactor was used to measure the catalytic performance of catalysts for hydrogen production from tar. Toluene (99.5%, AR, HUSHI, Shanghai, China) was selected as a model compound tar to evaluate the performance of different catalysts for the catalytic cracking of tar. Toluene was one of the main tar species due to its large quantity and stable aromatic structure, especially at relatively low temperatures [5].
The reactor system is shown in Figure 7. The custom quartz tube size was 1 m × 60 mm with a quartz sieve plate set in the constant temperature zone of the tubular furnace, and the catalyst was fixed in the constant temperature zone of the furnace tube through the pipe plug and 3 mm quartz cotton. The amount of catalyst filled each time was 5 ± 0.01 g. The carrier gas was N2 (99.999%), controlled by the mass flow controller, and the flow rate was 100–300 SCCM. Toluene was injected into the system through a high-precision injection pump (TYD-01, Leadfluid, Baoding, China). The toluene and carrier gas transmission pipeline were equipped with a heating belt (200 °C) and mixed in the heating pipeline. The exposed part of the quartz tube and the gas outlet pipeline were also provided with a heating band (200 °C) to prevent condensation of condensable components. The exhaust gases were cleaned by two scrubber cartridges with a cooling system (−10 °C) and passed into the gas analyzer (Vario Plus new, MRU, Heilbronn, Germany) for real-time monitoring.

3.3. Characterizations

The thermal stability of perovskite was tested using a thermogravimetric analyzer (TA TGA 550) with a temperature range of 30 °C–900 °C and a heating rate of 5 °C/min. X-ray photoelectron spectroscopy (XPS, Thermo Scientific K-Alpha, Waltham, USA) was adopted to probe the oxygen element state of the catalysts. The carbonaceous C1s line (284.6 eV) was used as the reference to calibrate the binding energies (BEs). The Element distribution map (SEM-Mapping) of samples was obtained on a Zeiss Merlin Compact microscope to explore the morphological properties. The X-ray diffraction (XRD) patterns of powder catalysts were performed by a Rigaku Ultima IV diffractometer using Cu Kα radiation. The samples were scanned in a 2θ range of 5–90° with a speed of 5°/min.

3.4. Data Process

During the catalytic cracking of toluene, the synthetic gas mainly included hydrogen, methane, carbon monoxide, and carbon dioxide. Real-time monitoring of the produced gases was conducted using a gas analyzer, with a recording every 5 s. The production and production rate of each gas phase product were calculated using the real-time gas flow and component volume percentage data stored in the equipment to evaluate the catalytic performance of LFNO.
Gas   production   per   gram   of   toluene = V 1 m t o l u e n e
Carbon   production   per   gram   of   toluene = m e n d m s t a r t m t o l u e n e
V O L % = V 1 V g a s × 100
Real - time   gas   production   rate = V O L % Re a l t i m e × u
where V1 (L) represented the production of H2, CO, or CO2, mtoluene (g) represented the input amount of toluene, mend (g) and mstart (g) represented the final and initial mass of the filling in the quartz tube, Vgas (L) represented the production of syngas, u (L/h) represented the sampling flow.

4. Conclusions

In summary, LaFe0.5Ni0.5O3 achieved efficient and stable cracking of model tar (toluene) to produce H2 without gasification agents. Within the tested reaction system, the highest average conversion rate of toluene was 99.9% (900 °C), the greatest hydrogen production per gram of tar was 1.002 L/g (700 °C), and the maximum average hydrogen proportion in synthesis gas was 93.5%.
The effect of reaction conditions (pollutant concentration, residence time, WHSV, and reaction temperature) on the gas-phase products of toluene catalytic cracking was fully discussed. The hydrogen production per gram of tar first increased and then decreased with the increase of pollutant concentration or residence time. The hydrogen production efficiency was higher at medium pollutant concentration (0.3 g/L) and low-medium residence time (250 SCCM), reaching 0.827 g/L and 1.002 g/L, respectively. The smaller the WHSV, the higher the hydrogen production of tar catalytic cracking, reaching a maximum of 0.98 g/L (WHSV = 0.24 gtoluene/(gcat·h)). This was mainly attributed to the changes in tar reaction adequacy caused by changes in process parameters. The H2 production decreased above 800 °C, and carbon production was reduced above 700 °C. Combining the above phenomena and the further analysis of the effect of reaction conditions on the real-time gas component distribution and hourly gas production during the continuous reaction, the necessary conditions for the occurrence of perovskite oxygen evolution reactions, methane reactions, and methane catalytic cracking reactions were obtained.
The H2 production and the H2 proportion in the synthesis gas were controlled by regulating the concentration of pollutants, residence time, WHSV, and reaction temperature. The hydrogen production per gram of tar was concentrated in the range of 0.6 L/g to 0.9 L/g, with a maximum of 1.002 L/g and a minimum of 0.203 L/g. The H2 proportion in the synthesis gas was concentrated in the range of 70% to 90%, with a maximum of 93.5% and a minimum of 67.8%. Compared with existing research, the hydrogen production performance of LaFe0.5Ni0.5O3 was significantly better. In addition, the LaFe0.5Ni0.5O3 was proven to have good thermal stability, long-term stability, and catalyst reactivation potential. Therefore, LaFe0.5Ni0.5O3 exhibited significant prospects in converting tar into high-purity hydrogen gas.

Author Contributions

W.-M.C.: Investigation, Methodology, Data curation, Formal analysis, Writing-original draft. B.-D.X.: Investigation, Funding acquisition, Data curation, Formal analysis. M.-X.L.: Supervision, Conceptualization, Project administration, Funding acquisition, Writing-review & editing. M.-Y.Y.: Validation. J.-Q.H.: Investigation, Validation. Y.-F.W.: Investigation, Validation, Writing-review & editing. C.-Z.Y.: Supervision, Writing-review & editing. F.-H.M.: Validation. All authors have read and agreed to the published version of the manuscript.

Funding

This study was supported by the National Natural Science Foundation of China (Project No. 52220105009, Bei-Dou Xi, 2.5 million RMB).

Data Availability Statement

Data are contained within the article.

Acknowledgments

The authors acknowledge the financial support from Tianjin University and the Chinese Research Academy of Environmental Sciences.

Conflicts of Interest

The authors declare no conflicts of interest.

References

  1. Sui, M.; Li, G.Y.; Guan, Y.L.; Li, C.M.; Zhou, R.Q.; Zarnegar, A.M. Hydrogen and syngas production from steam gasification of biomass using cement as catalyst. Biomass. Convers. Bior. 2019, 10, 119–124. [Google Scholar] [CrossRef]
  2. Abidin, S.Z.; Osazuwa, O.U.; Othman, N.H.; Setiabudi, H.D.; Sulaiman, S. Recent progress on catalyst development in biomass tar steam reforming: Toluene as a biomass tar model compound. In Biomass Conversion and Biorefinery; Springer: Berlin/Heidelberg, Germany, 2023. [Google Scholar] [CrossRef]
  3. Ngo, T.N.L.T.; Chiang, K.Y.; Liu, C.F.; Chang, Y.H.; Wan, H.P. Hydrogen production enhancement using hot gas cleaning system combined with prepared Ni-based catalyst in biomass gasification. Int. J. Hydrogen Energy 2021, 46, 11269–11283. [Google Scholar] [CrossRef]
  4. Bhandari, P.N.; Kumar, A.; Bellmer, D.D.; Huhnke, R.L. Synthesis and evaluation of biochar-derived catalysts for removal of toluene (model tar) from biomass-generated producer gas. Renew. Energy 2014, 66, 346–353. [Google Scholar] [CrossRef]
  5. Abou Rached, J.; El Hayek, C.; Dahdah, E.; Gennequin, C.; Aouad, S.; Tidahy, H.L.; Estephane, J.; Nsouli, B.; Aboukaïs, A.; Abi-Aad, E. Ni based catalysts promoted with cerium used in the steam reforming of toluene for hydrogen production. Int. J. Hydrogen Energy 2017, 42, 12829–12840. [Google Scholar] [CrossRef]
  6. Huang, Z.; Deng, Z.; Feng, Y.; Chen, T.; Chen, D.; Zheng, A.; Wei, G.; He, F.; Zhao, Z.; Wu, J.; et al. Exploring the Conversion Mechanisms of Toluene as a Biomass Tar Model Compound on NiFe2O4 Oxygen Carrier. ACS Sustain. Chem. Eng. 2019, 7, 16539–16548. [Google Scholar] [CrossRef]
  7. Zhao, M.; Memon, M.Z.; Ji, G.; Yang, X.; Vuppaladadiyam, A.K.; Song, Y.; Raheem, A.; Li, J.; Wang, W.; Zhou, H. Alkali metal bifunctional catalyst-sorbents enabled biomass pyrolysis for enhanced hydrogen production. Renew. Energy 2020, 148, 168–175. [Google Scholar] [CrossRef]
  8. Wang, T.J.; Chang, J.; Wu, C.Z.; Fu, Y.; Chen, Y. The steam reforming of naphthalene over a nickel-dolomite cracking catalyst. Biomass Bioenergy 2005, 28, 508–514. [Google Scholar] [CrossRef]
  9. Gao, N.; Salisu, J.; Quan, C.; Williams, P. Modified nickel-based catalysts for improved steam reforming of biomass tar: A critical review. Renew. Sust. Energy Rev. 2021, 145, 111023. [Google Scholar] [CrossRef]
  10. Huang, S.; Xu, H.; Li, H.; Guo, Y.; Sun, Z.; Du, Y.; Li, H.; Zhang, J.; Pang, R.; Dong, Q.; et al. Preparation and characterization of char supported Ni Cu nanoalloy catalyst for biomass tar cracking together with syngas-rich gas production. Fuel. Process. Technol. 2021, 218, 106858. [Google Scholar] [CrossRef]
  11. Li, J.; Tao, J.; Yan, B.; Cheng, K.; Chen, G.; Hu, J. Microwave reforming with char-supported Nickel-Cerium catalysts: A potential approach for thorough conversion of biomass tar model compound. Appl. Energy 2020, 261, 114375. [Google Scholar] [CrossRef]
  12. Zhang, B.; Sun, Z.; Li, Y.; Yang, B.; Shang, J.; Wu, Z. Chemical looping reforming characteristics of methane and toluene from biomass pyrolysis volatiles based on decoupling strategy: Embedding NiFe2O4 in SBA-15 as an oxygen carrier. Chem. Eng. J. 2023, 466, 143228. [Google Scholar] [CrossRef]
  13. Jurado, L.; Papaefthimiou, V.; Thomas, S.; Roger, A.C. Upgrading syngas from wood gasification through steam reforming of tars over highly active Ni-perovskite catalysts at relatively low temperature. Appl. Catal. B-Environ. 2021, 299, 120687. [Google Scholar] [CrossRef]
  14. Dong, X.; Zhu, X.; Lin, F.; Yan, B.; Li, J.; Chen, G. UV–vis-enhanced photothermal catalytic reforming of biomass model tar via LaMnxNi1-xO3 perovskite catalyst. Chem. Eng. J. 2023, 457, 14112. [Google Scholar] [CrossRef]
  15. Gai, D.; Shi, J.; Cui, X.; Zhao, P.; Zuo, W.; Zhang, J.; Jia, G.; Huang, Z. Catalytic performance and mechanism of A-site vacancy deficient perovskite catalyst over tar cracking during biomass pyrolysis. J. Clean. Prod. 2023, 405, 126987. [Google Scholar] [CrossRef]
  16. Lv, Y.; Cheng, B.; Yang, H.; Cui, X.; Zhao, M. Chemical looping partial oxidation (CLPO) of toluene on LaFeO3 perovskites for tunable syngas production. Chem. Eng. J. 2023, 451, 138968. [Google Scholar] [CrossRef]
  17. Cui, X.; Wu, T.; Cao, J.P.; Tang, W.; Yang, F.L.; Zhu, B.A.; Wang, Z. Mechanism for catalytic cracking of coal tar over fresh and reduced LaNi1-xFexO3 perovskite. Fuel 2021, 288, 119683. [Google Scholar] [CrossRef]
  18. Gai, D.; Cui, X.; Wu, T.; Shi, J.; Zhao, P.; Zhang, J.; Xia, X. A-site disubstituted of La1−xSrxNi0.8Fe0.2O3 perovskite on coal pyrolysis volatiles catalytic cracking: Activity and reaction mechanism. Process Safe. Environ. 2022, 168, 748–759. [Google Scholar] [CrossRef]
  19. Zhao, K.; He, F.; Huang, Z.; Zheng, A.; Li, H.; Zhao, Z. Three-dimensionally ordered macroporous LaFeO3 perovskites for chemical-looping steam reforming of methane. Int. J. Hydrogen Energy 2014, 39, 3243–3252. [Google Scholar] [CrossRef]
  20. Zhao, K.; He, F.; Huang, Z.; Wei, G.; Zheng, A.; Li, H.; Zhao, Z. Perovskite-type oxides LaFe1-xCoxO3 for chemical looping steam methane reforming to syngas and hydrogen co-production. Appl. Energy 2016, 168, 193–203. [Google Scholar] [CrossRef]
  21. Zheng, Y.; Li, K.; Wang, H.; Tian, D.; Wang, Y.; Zhu, X.; Wei, Y.; Zheng, M.; Luo, Y. Designed oxygen carriers from macroporous LaFeO3 supported CeO2 for chemical-looping reforming of methane. Appl. Catal. B-Environ 2017, 202, 51–63. [Google Scholar] [CrossRef]
  22. Xu, T.; Zheng, X.; Xu, J.; Wu, Y. Hydrogen-Rich Gas Production from Two-Stage Catalytic Pyrolysis of Pine Sawdust with Nano-NiO/Al2O3 Catalyst. Catalysts 2022, 12, 256. [Google Scholar] [CrossRef]
  23. Lu, Q.; Shenfu, Y.; Chen, X.; Li, K.; Qian, T.; Zhao, Y.; Meng, L.; Xie, X.; Zhao, Y.; Zhou, Y. The effect of reaction condition on catalytic cracking of wheat straw pyrolysis volatiles over char-based Fe-Ni-Ca catalyst. Energy 2023, 263, 125722. [Google Scholar] [CrossRef]
  24. Gu, H.; Yang, J.; Song, G.; Cui, X.; Niu, M.; Zhao, S. LaFe1-xNix as a Robust Catalytic Oxygen Carrier for Chemical Looping Conversion of Toluene. Appl. Sci. 2021, 12, 391. [Google Scholar] [CrossRef]
  25. Chen, L.; Song, Z.; Zhang, S.; Chang, C.K.; Chuang, Y.C.; Peng, X.; Dun, C.; Urban, J.J.; Guo, J.; Chen, J.L.; et al. Ternary NiMo-Bi liquid alloy catalyst for efficient hydrogen production from methane pyrolysis. Science 2023, 381, 857–861. [Google Scholar] [CrossRef]
  26. Hojo, H.; Inohara, Y.; Ichitsubo, R.; Einaga, H. Catalytic properties of LaNiO3 and Mn-modified LaNiO3 catalysts for oxidation of CO and benzene. Catal. Today 2023, 410, 127–134. [Google Scholar] [CrossRef]
  27. Li, Z.; Dong, X.; Yan, B.; Li, J.; Wang, J.; Jiao, L.; Chen, G.; Ahmed, S.; Cao, Y. Chemical looping gasification of digestate: Investigation on the surface and lattice oxygen of perovskite oxygen carrier. Fuel 2022, 318, 123663. [Google Scholar] [CrossRef]
  28. He, J.; Yang, Q.; Song, Z.; Chang, W.; Huang, C.; Zhu, Y.; Ma, X.; Wang, X. Improving the carbon resistance of iron-based oxygen carrier for hydrogen production via chemical looping steam methane reforming: A review. Fuel 2023, 351, 128864. [Google Scholar] [CrossRef]
  29. Wang, H.W.; Wu, J.X.; Wang, X.Y.; Wang, H.; Liu, J.R. Formation of perovskite-type LaNiO3 on La-Ni/Al2O3-ZrO2 catalysts and their performance for CO methanation. J. Fuel. Chem. Technol. 2021, 49, 186–197. [Google Scholar] [CrossRef]
  30. Wang, T.; Liu, S.; Wang, L.; Liu, G. High-performance Rh/CeO2 catalysts prepared by l-lysine-assisted deposition precipitation method for steam reforming of toluene. Fuel 2023, 341, 127736. [Google Scholar] [CrossRef]
  31. Zhang, C.; Guo, Y.; Guo, Y.; Lu, G.; Boreave, A.; Retailleau, L.; Baylet, A.; Giroir-Fendler, A. LaMnO3 perovskite oxides prepared by different methods for catalytic oxidation of toluene. Appl. Catal. B-Environ. 2014, 148–149, 490–498. [Google Scholar] [CrossRef]
  32. Vella, L.D.; Villoria, J.A.; Specchia, S.; Mota, N.; Fierro, J.L.G.; Specchia, V. Catalytic partial oxidation of CH4 with nickel-lanthanum-based catalysts. Catal. Today 2011, 171, 84–96. [Google Scholar] [CrossRef]
  33. Ruocco, C.; de Caprariis, B.; Palma, V.; Petrullo, A.; Ricca, A.; Scarsella, M.; De Filippis, P. Methane dry reforming on Ru perovskites, AZrRuO3: Influence of preparation method and substitution of A cation with alkaline earth metals. J. CO2 Util. 2019, 30, 222–231. [Google Scholar] [CrossRef]
  34. Shen, Y. Chars as carbonaceous adsorbents/catalysts for tar elimination during biomass pyrolysis or gasification. Renew. Sust. Energy Rev. 2015, 43, 281–295. [Google Scholar] [CrossRef]
  35. Li, X.; Liu, P.; Huang, S.; Wu, S.; Li, Y.; Wu, Y.; Lei, T. Study on the mechanism of syngas production from catalytic pyrolysis of biomass tar by Ni-Fe catalyst in CO2 atmosphere. Fuel 2023, 335, 126705. [Google Scholar] [CrossRef]
  36. Lei, Z.; Hao, S.; Yang, J.; Lei, Z.; Dan, X. Study on solid waste pyrolysis coke catalyst for catalytic cracking of coal tar. Int. J. Hydrogen Energy 2020, 45, 19280–19290. [Google Scholar] [CrossRef]
  37. Deng, J.; Zhou, Y.; Zhao, Y.; Meng, L.; Qin, T.; Chen, X.; Li, K.; Yuan, S. Catalytic pyrolysis of pine needle biomass over Fe-Co-K catalyst for H2-rich syngas production: Influence of catalyst preparation. Energy 2022, 244, 122602. [Google Scholar] [CrossRef]
  38. Lu, Q.; Zhao, Y.; Zhang, L.; Xie, X.; Yuan, S. The forms of active sites of Fe/Ca/Ni@C catalyst for the reforming of volatiles of biomass pyrolysis under N2 and CO2 atmosphere. Fuel 2022, 318, 123625. [Google Scholar] [CrossRef]
  39. Chen, W.; Li, X.; Li, Y.; Liu, P.; Sun, T.; Yang, Y.; Wang, Z.; Li, H.; Lei, T. Synergistic modification of Ca/Co on Ni/HZSM-5 catalyst for pyrolysis of organic components in biomass tar. J. Anal. Appl. Pyrolysis 2022, 166, 136876. [Google Scholar] [CrossRef]
  40. Liu, H.; Ye, C.; Ye, Z.; Zhu, Z.; Wang, Q.; Tang, Y.; Luo, G.; Guo, W.; Dong, C.; Li, G.; et al. Catalytic cracking and catalyst deactivation/regeneration characteristics of Fe-loaded biochar catalysts for tar model compound. Fuel 2023, 334, 126810. [Google Scholar] [CrossRef]
  41. Li, X.; Liu, P.; Chen, W.; Wu, Y.; Lei, T.; Huang, S.; Li, Y.; Wu, S.; Wang, Z. Catalytic pyrolysis of toluene as biomass tar model component using Ni/HZSM-5 modified by CeO2 and MgO promoters. J. Anal. Appl. Pyrolysis 2022, 162, 105436. [Google Scholar] [CrossRef]
  42. Guo, F.; Liang, S.; Jia, X.; Peng, K.; Jiang, X.; Qian, L. One-step synthesis of biochar-supported potassium-iron catalyst for catalytic cracking of biomass pyrolysis tar. Int. J. Hydrogen Energy 2020, 45, 16398–16408. [Google Scholar] [CrossRef]
  43. Shanmuganandam, K.; Thanikaikarasan, S.; Venkata Ramanan, M.; Anichai, J.; Sebastian, P.J. Enhancement of hydrogen energy from Casuarina equisetifolia using NiO-Pr2O3/TiO2 and NiO/TiO2 nano composites. Int. J. Hydrogen Energy 2020, 45, 4152–4160. [Google Scholar] [CrossRef]
  44. Du, S.; Dong, Y.; Guo, F.; Tian, B.; Mao, S.; Qian, L.; Xin, C. Preparation of high-activity coal char-based catalysts from high metals containing coal gangue and lignite for catalytic decomposition of biomass tar. Int. J. Hydrogen Energy 2021, 46, 14138–14147. [Google Scholar] [CrossRef]
  45. Yan, J.; Liu, W.; Sun, R.; Jiang, S.; Wang, S.; Shen, L. Chemical looping catalytic gasification of biomass over active LaNixFe1-xO3 perovskites as functional oxygen carriers. Chin. J. Chem. Eng. 2021, 36, 146–156. [Google Scholar] [CrossRef]
  46. Chava, R.; Roy, B.; Appari, S. Recent advances and perspectives of perovskite-derived Ni-based catalysts for CO2 reforming of biogas. J. CO2 Util. 2022, 65, 102206. [Google Scholar] [CrossRef]
  47. Ren, J.; Liu, Y.L. Promoting syngas production from steam reforming of toluene using a highly stable Ni/(Mg, Al)Ox catalyst. Appl. Catal. B-Environ. 2022, 300, 120743. [Google Scholar] [CrossRef]
  48. Liu, L.; Zhang, Z.; Das, S.; Xi, S.; Kawi, S. LaNiO3 as a precursor of Ni/La2O3 for reverse water-gas shift in DBD plasma: Effect of calcination temperature. Energy Convers. Manag. 2020, 206, 112475. [Google Scholar] [CrossRef]
  49. Li, X.; Li, Z.; Lu, C.; Li, D.; Li, Z.; Gao, J.; Wei, J.; Li, K. Enhanced performance of LaFeO3 oxygen carriers by NiO for chemical looping partial oxidation of methane. Fuel. Process. Technol. 2022, 236, 107396. [Google Scholar] [CrossRef]
  50. Wang, B.; Liu, Y.; Guan, Y.; Zhang, G.; Xing, D. Hydrogen production and coke resistance characteristic during volatile reforming over Fe2O3-Ce2O3/sludge char catalyst. J. Clean. Prod. 2024, 434, 139836. [Google Scholar] [CrossRef]
  51. Sun, Z.; Russell, C.K.; Whitty, K.J.; Eddings, E.G.; Dai, J.; Zhang, Y.; Fan, M.; Sun, Z. Chemical looping-based energy transformation via lattice oxygen modulated selective oxidation. Prog. Energy Combust. 2023, 96, 101045. [Google Scholar] [CrossRef]
  52. Zhang, Z.; Ou, Z.; Qin, C.; Ran, J.; Wu, C. Roles of alkali/alkaline earth metals in steam reforming of biomass tar for hydrogen production over perovskite supported Ni catalysts. Fuel 2019, 257, 116032. [Google Scholar] [CrossRef]
  53. Sun, R.; Shen, L.; Wang, S.; Bai, H. CO conversion over LaFeO3 perovskite during chemical looping processes: Influences of Ca-doping and oxygen species. Appl. Catal. B-Environ. 2022, 316, 121598. [Google Scholar] [CrossRef]
  54. Zhu, M.; Chen, S.; Soomro, A.; Hu, J.; Sun, Z.; Ma, S.; Xiang, W. Effects of supports on reduction activity and carbon deposition of iron oxide for methane chemical looping hydrogen generation. Appl. Energy 2018, 225, 912–921. [Google Scholar] [CrossRef]
  55. Shen, X.; Sun, Y.; Wu, Y.; Wang, J.; Jiang, E.; Xu, X.; Su, J.; Jia, Z. The coupling of CH4 partial oxidation and CO2 splitting for syngas production via double perovskite-type oxides LaFexCo1−xO3. Fuel 2020, 268, 117381. [Google Scholar] [CrossRef]
  56. Ren, J.; Liu, Y.L. Direct Conversion of Syngas Produced from Steam Reforming of Toluene into Methane over a Ni/Biochar Catalyst. ACS Sustain. Chem. Eng. 2021, 9, 11212–11222. [Google Scholar] [CrossRef]
Figure 1. Effect of pollutant concentrations on (a) H2 and carbon yield per gram of tar (b) CH4, CO, and CO2 yield per gram of tar (c) gas phase product distribution (d) real-time volume percentages of H2 (e) real-time volume percentages of CH4 (f) real-time volume percentages of CO (g) real-time H2 production rate (h) real-time CH4 production rate (i) real-time CO production rate.
Catalysts 14 00188 g001
Figure 2. Effect of residence time on (a) H2 and carbon yield per gram of tar (b) CH4, CO, and CO2 yield per gram of tar (c) gas phase product distribution (d) real-time volume percentages of H2 (e) real-time volume percentages of CH4 (f) real-time volume percentages of CO (g) real-time H2 production rate (h) real-time CH4 production rate (i) real-time CO production rate.
Catalysts 14 00188 g002
Figure 3. Effect of WHSV on (a) H2 and carbon yield per gram of tar (b) CH4, CO, and CO2 yield per gram of tar (c) gas phase product distribution (d) real-time volume percentages of H2 (e) real-time volume percentages of CH4 (f) real-time volume percentages of CO (g) real-time H2 production rate (h) real-time CH4 production rate (i) real-time CO production rate.
Catalysts 14 00188 g003
Figure 4. Effect of reaction temperature on (a) H2 and carbon yield per gram of tar (b) CH4, CO, and CO2 yield per gram of tar (c) gas phase product distribution (d) real-time volume percentages of H2 (e) real-time volume percentages of CH4 (f) real-time volume percentages of CO (g) real-time H2 production rate (h) real-time CH4 production rate (i) real-time CO production rate.
Catalysts 14 00188 g004
Figure 5. (a) TG analysis of LaFe0.5Ni0.5O3 (b) CH4, CO and CO2 yield of tar catalytic cracking by LaFe0.5Ni0.5O3 (24 h) (c) CH4, CO and CO2 yield of tar catalytic cracking by LaFe0.5Ni0.5O3 (24 h) (d) XRD patterns of catalysts (e) XPS Ni 2p patterns of spent catalysts (f) XPS O 1 s patterns of spent catalysts.
Catalysts 14 00188 g005
Figure 6. The results of EDS-Mapping (a) La distribution of spent catalysts (b) Fe distribution of spent catalysts (c) Ni distribution of spent catalysts (d) O patterns of catalysts.
Catalysts 14 00188 g006
Figure 7. Pyrolysis experimental equipment.
Catalysts 14 00188 g007
Table 1. Comparison with previous research results.
Catalytic AgentT/°CTar Conversion Rate/%ProductTime
NiFe2O485096.83H2: 0.91 L/g1 h[6]
Pyrolysis coke H2: 0.145 L/g
H2: 56.78%
[36]
Nickel-dolomite70094.8H2: 50.1%1 h[8]
70084.3H2: 51.5%6 h
La1-xSrxNi0.8Fe0.2O3700 H2: 0.217 L/g
CO: 0.258 L/g
10 min[15]
Fe-Co-K700 H2: 0.154 L/g
CO: 0.108 L/g
1 h[37]
5Fe1.5Ca@C600 H2: 0.299 L/g [38]
Ni-4 wt%Ca-0.1 wt%Co90098.6H2: 0.12 L/g
H2: 51.6%
40 min[39]
Ni-4%Fe/HZSM-590099.1H2: 0.224 L/g
H2: 54.47%
40 min[35]
Fe-loaded biochar80094.0H2: 81%90 min[40]
Ni-4%Ce/HZSM-580094.5H2: 0.04 L/g
H2: 37.66%
[41]
Ni-1%Mg/HZSM-580089.5H2: 0.039 L/g
H2: 37.64%
[41]
PSC-K2FeO480094.9H2: 0.18 L/g
H2: ~30%
CO: 0.3 L/g
[42]
Nano-NiO/γ-A12O380073.06H2: 0.47 L/g
H2: 48.44%
[22]
NiO-Pr2O3/TiO285097H2: 22% [43]
Ni-Cu/ASC80093.2H2: 0.304 L/g
H2: 37.82%
[10]
Fe-Ni-Ca800 H2: 0.288 L/g
H2: 71.48%
[23]
Ni-Cu/ASC80093.2H2: 0.105 L/g
H2: 33.87%
[10]
High-activity coal char80093.5H2: 0.175 L/g
H2: 36.84%
[44]
LaNi0.5Fe0.5O370093.6H2 MAX:
1.002 L/g
93.5%
6 hThis study
80099.4
90099.9
Disclaimer/Publisher’s Note: The statements, opinions and data contained in all publications are solely those of the individual author(s) and contributor(s) and not of MDPI and/or the editor(s). MDPI and/or the editor(s) disclaim responsibility for any injury to people or property resulting from any ideas, methods, instructions or products referred to in the content.

