
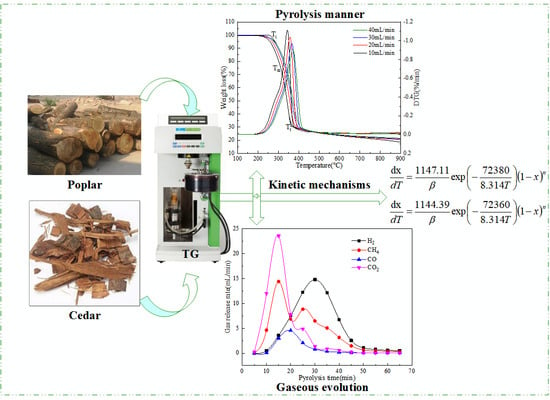
A Study on the Pyrolysis Behavior and Product Evolution of Typical Wood Biomass to Hydrogen-Rich Gas Catalyzed by the Ni-Fe/HZSM-5 Catalyst
Abstract
:
1. Introduction
2. Results and Discussion
2.1. Pyrolysis Kinetics of Wood Biomass
2.1.1. TG/DTG Analysis
2.1.2. Analysis of Apparent Kinetics
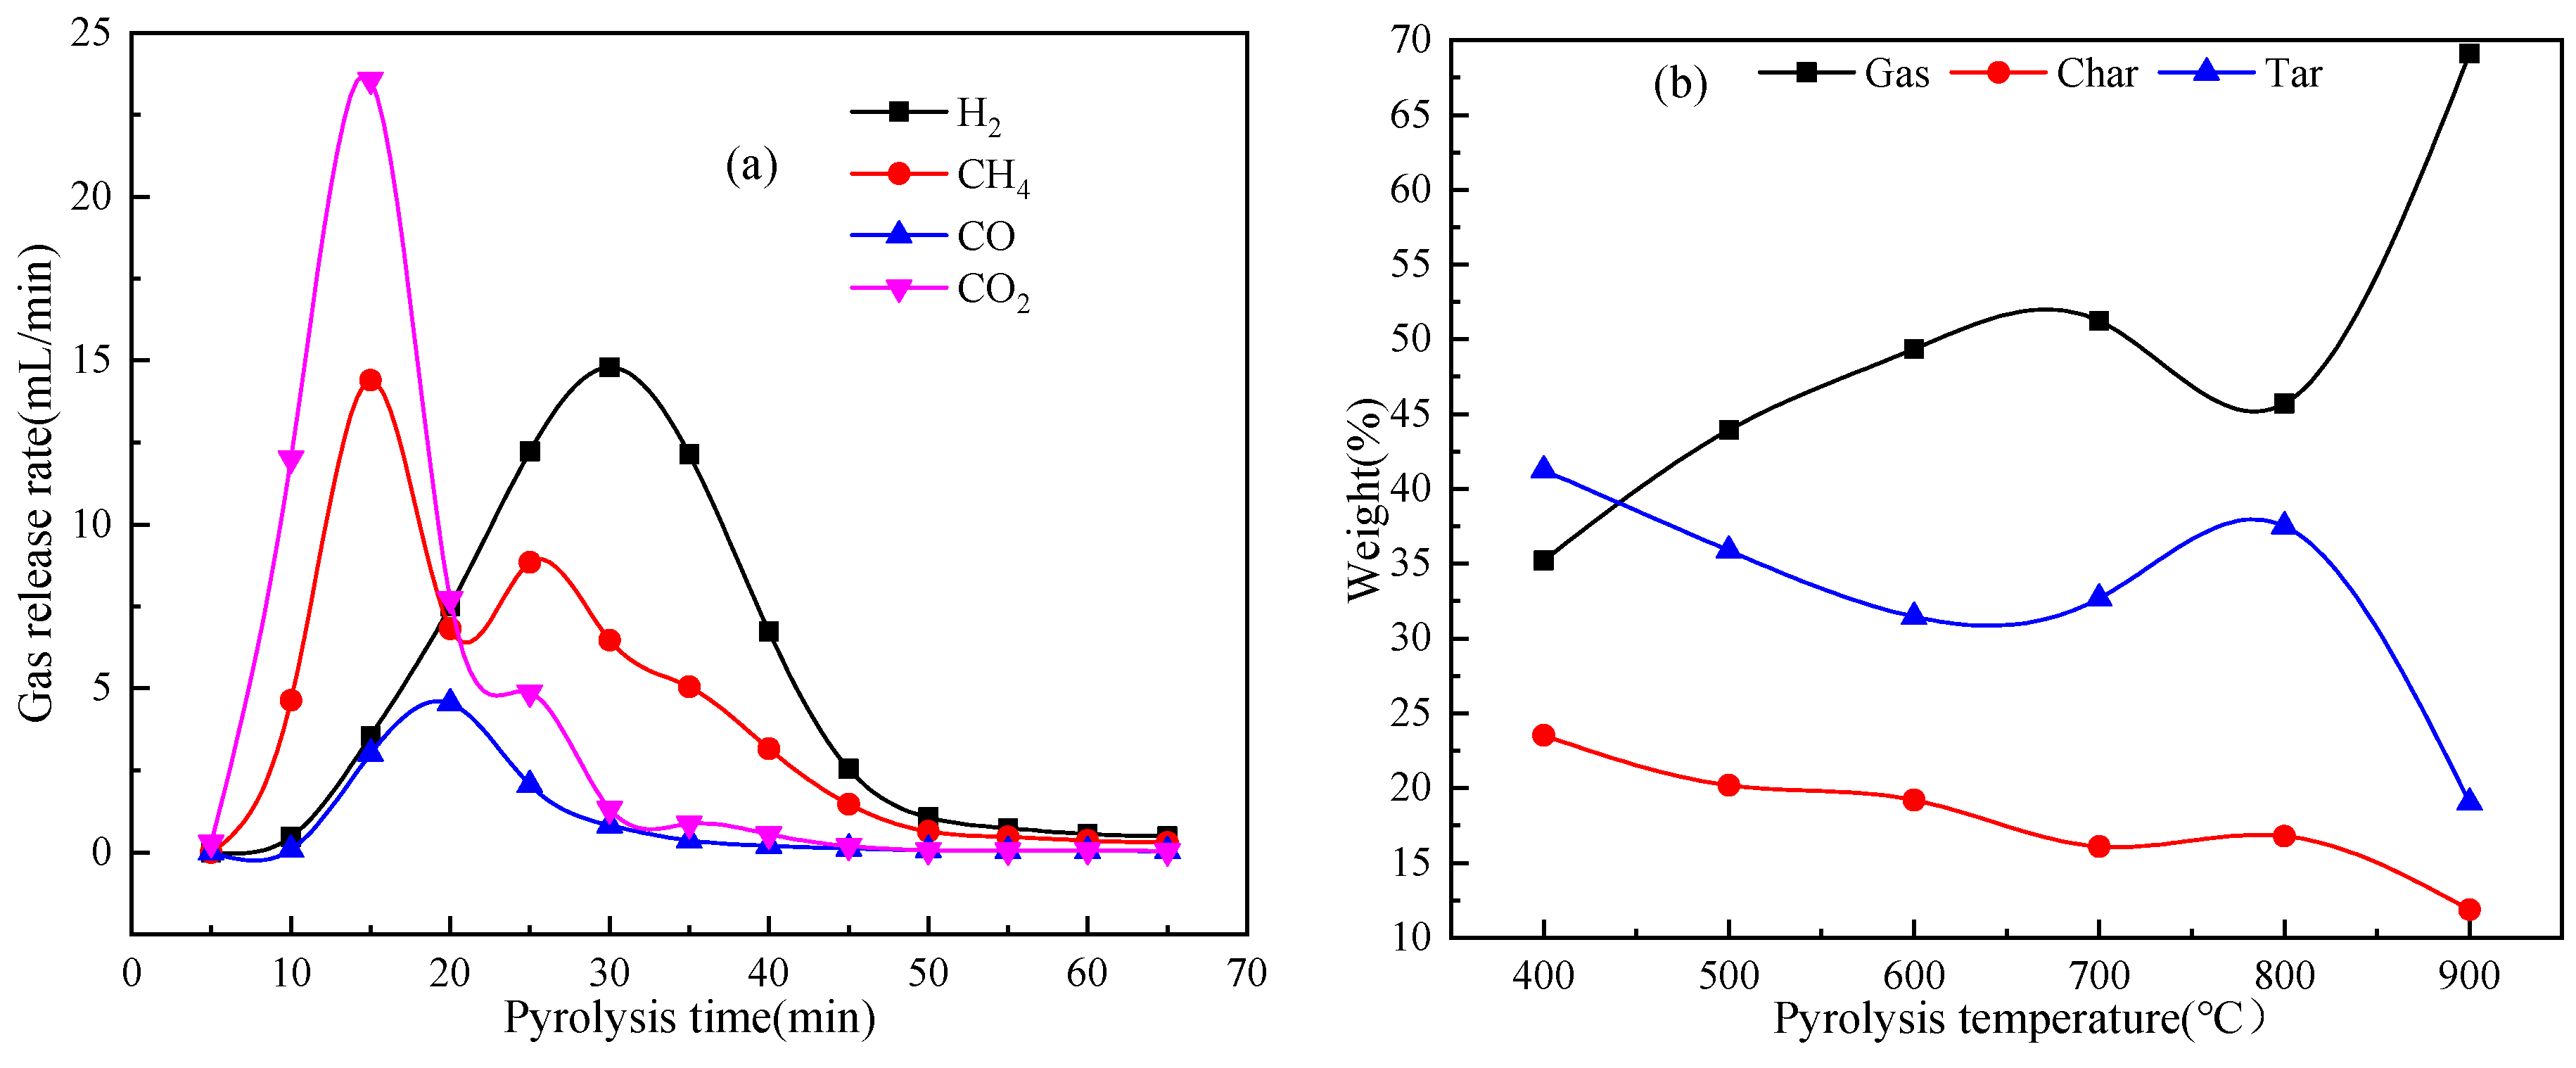
2.2. Effect of Pyrolysis Temperature on the Product Distribution from Catalytic Pyrolysis of MWC
2.2.1. Product Distribution and Release Rate of Pyrolysis Gas
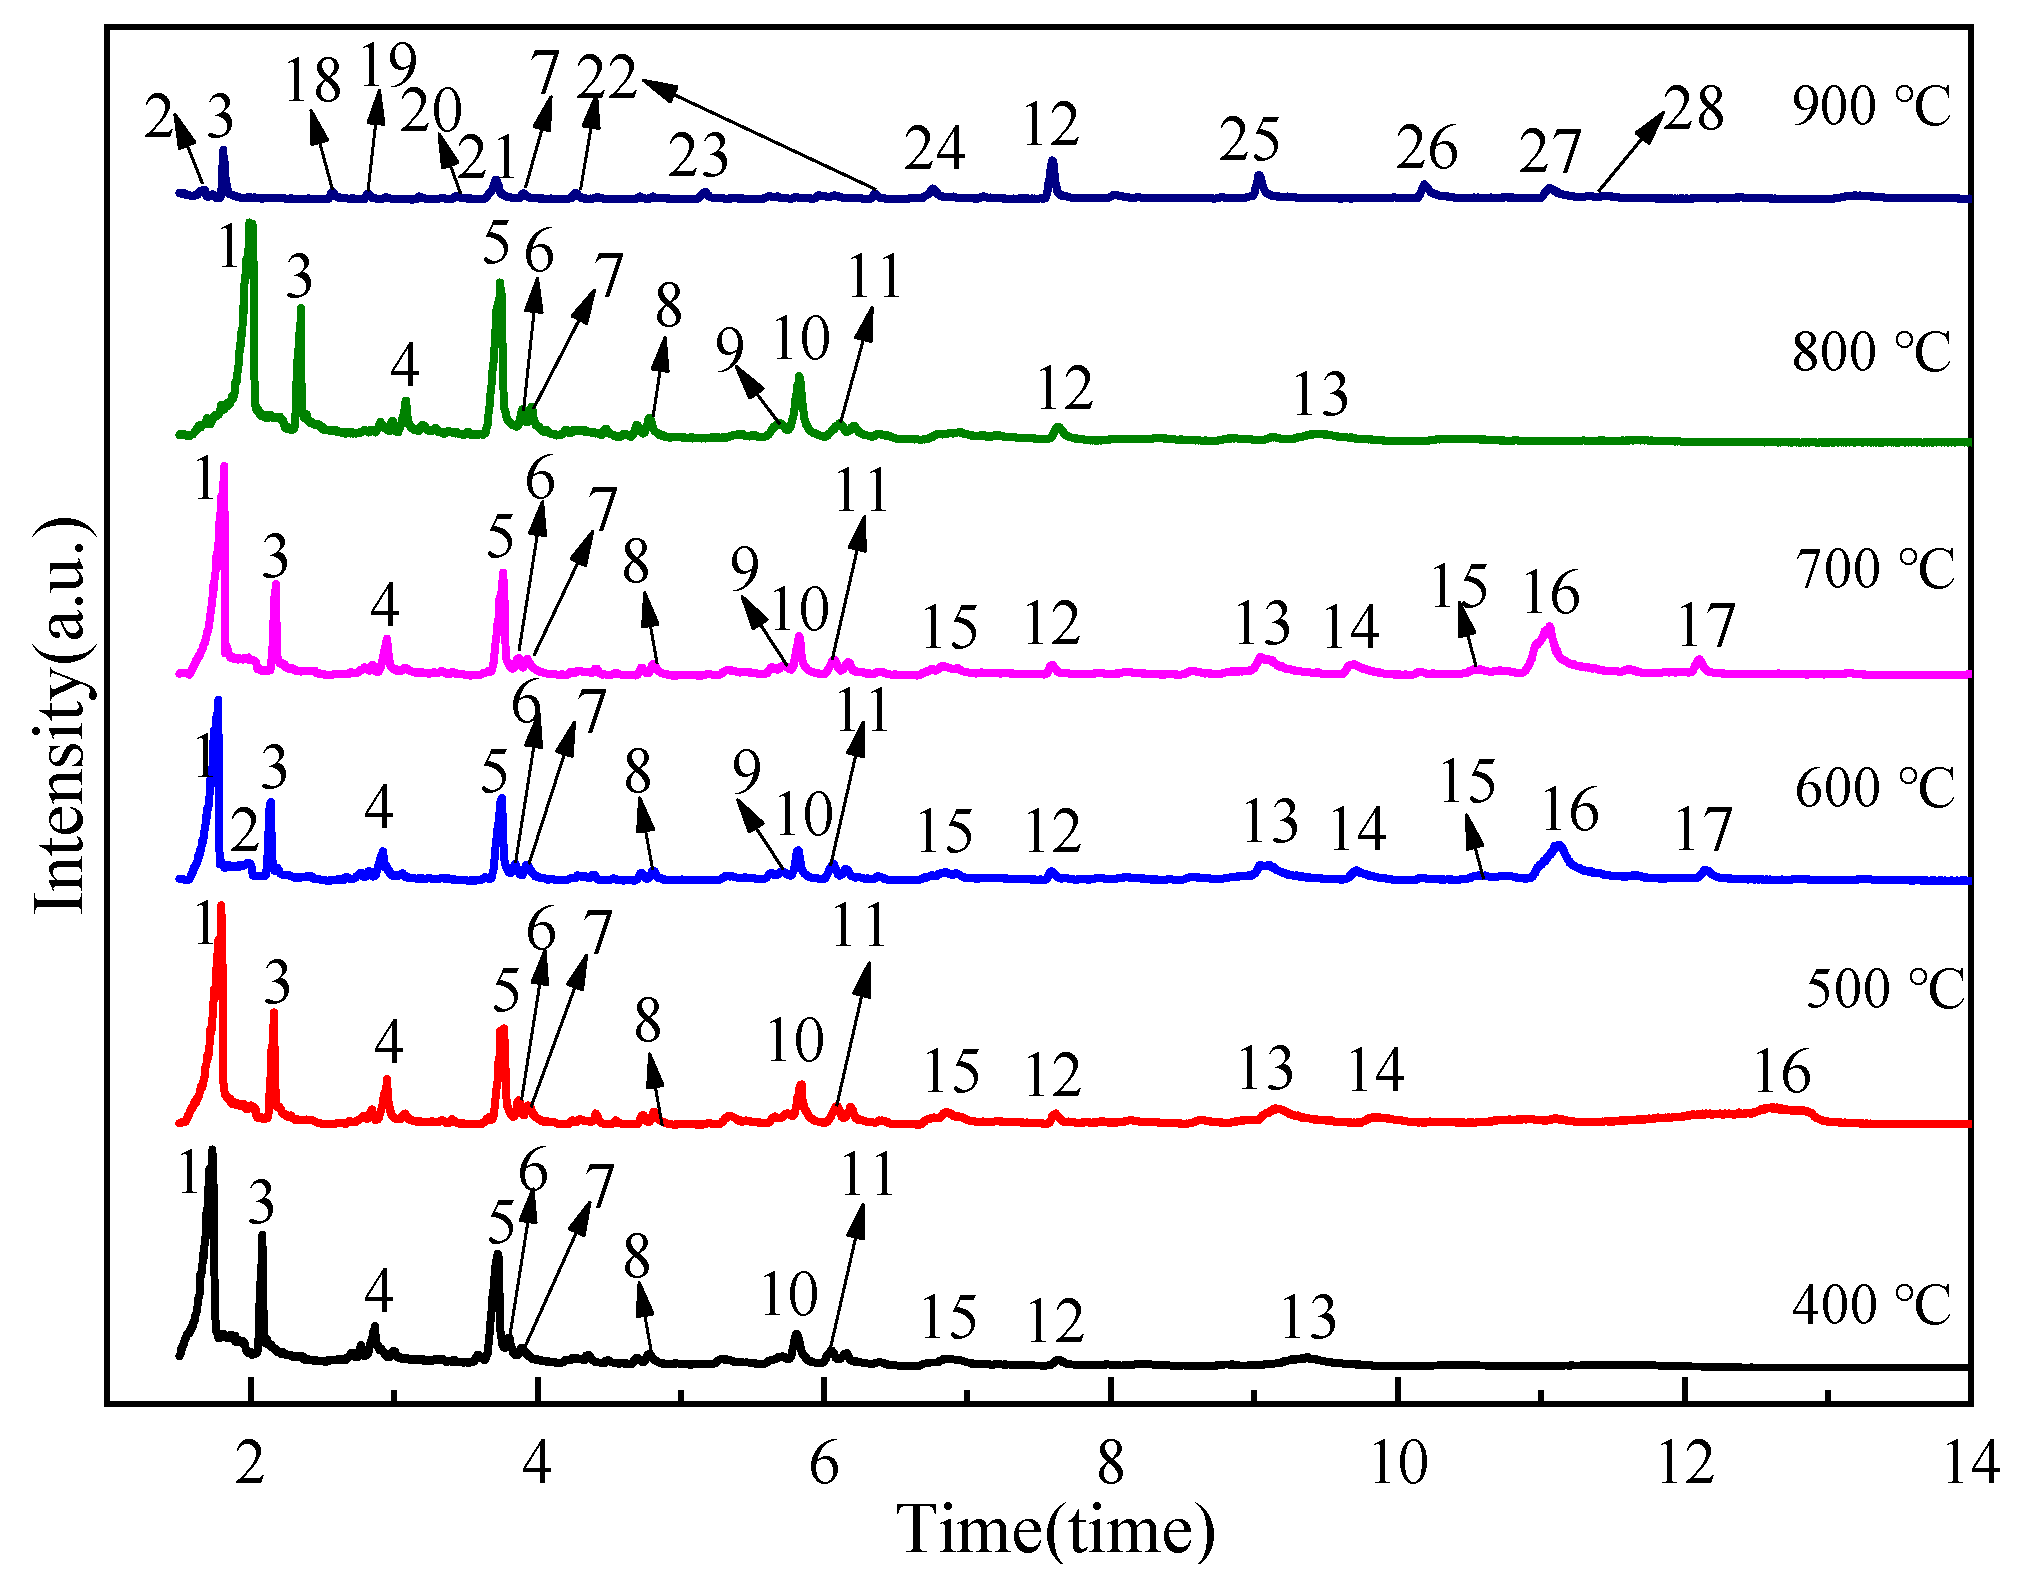
2.2.2. Formation Process and Composition Distribution of Tar
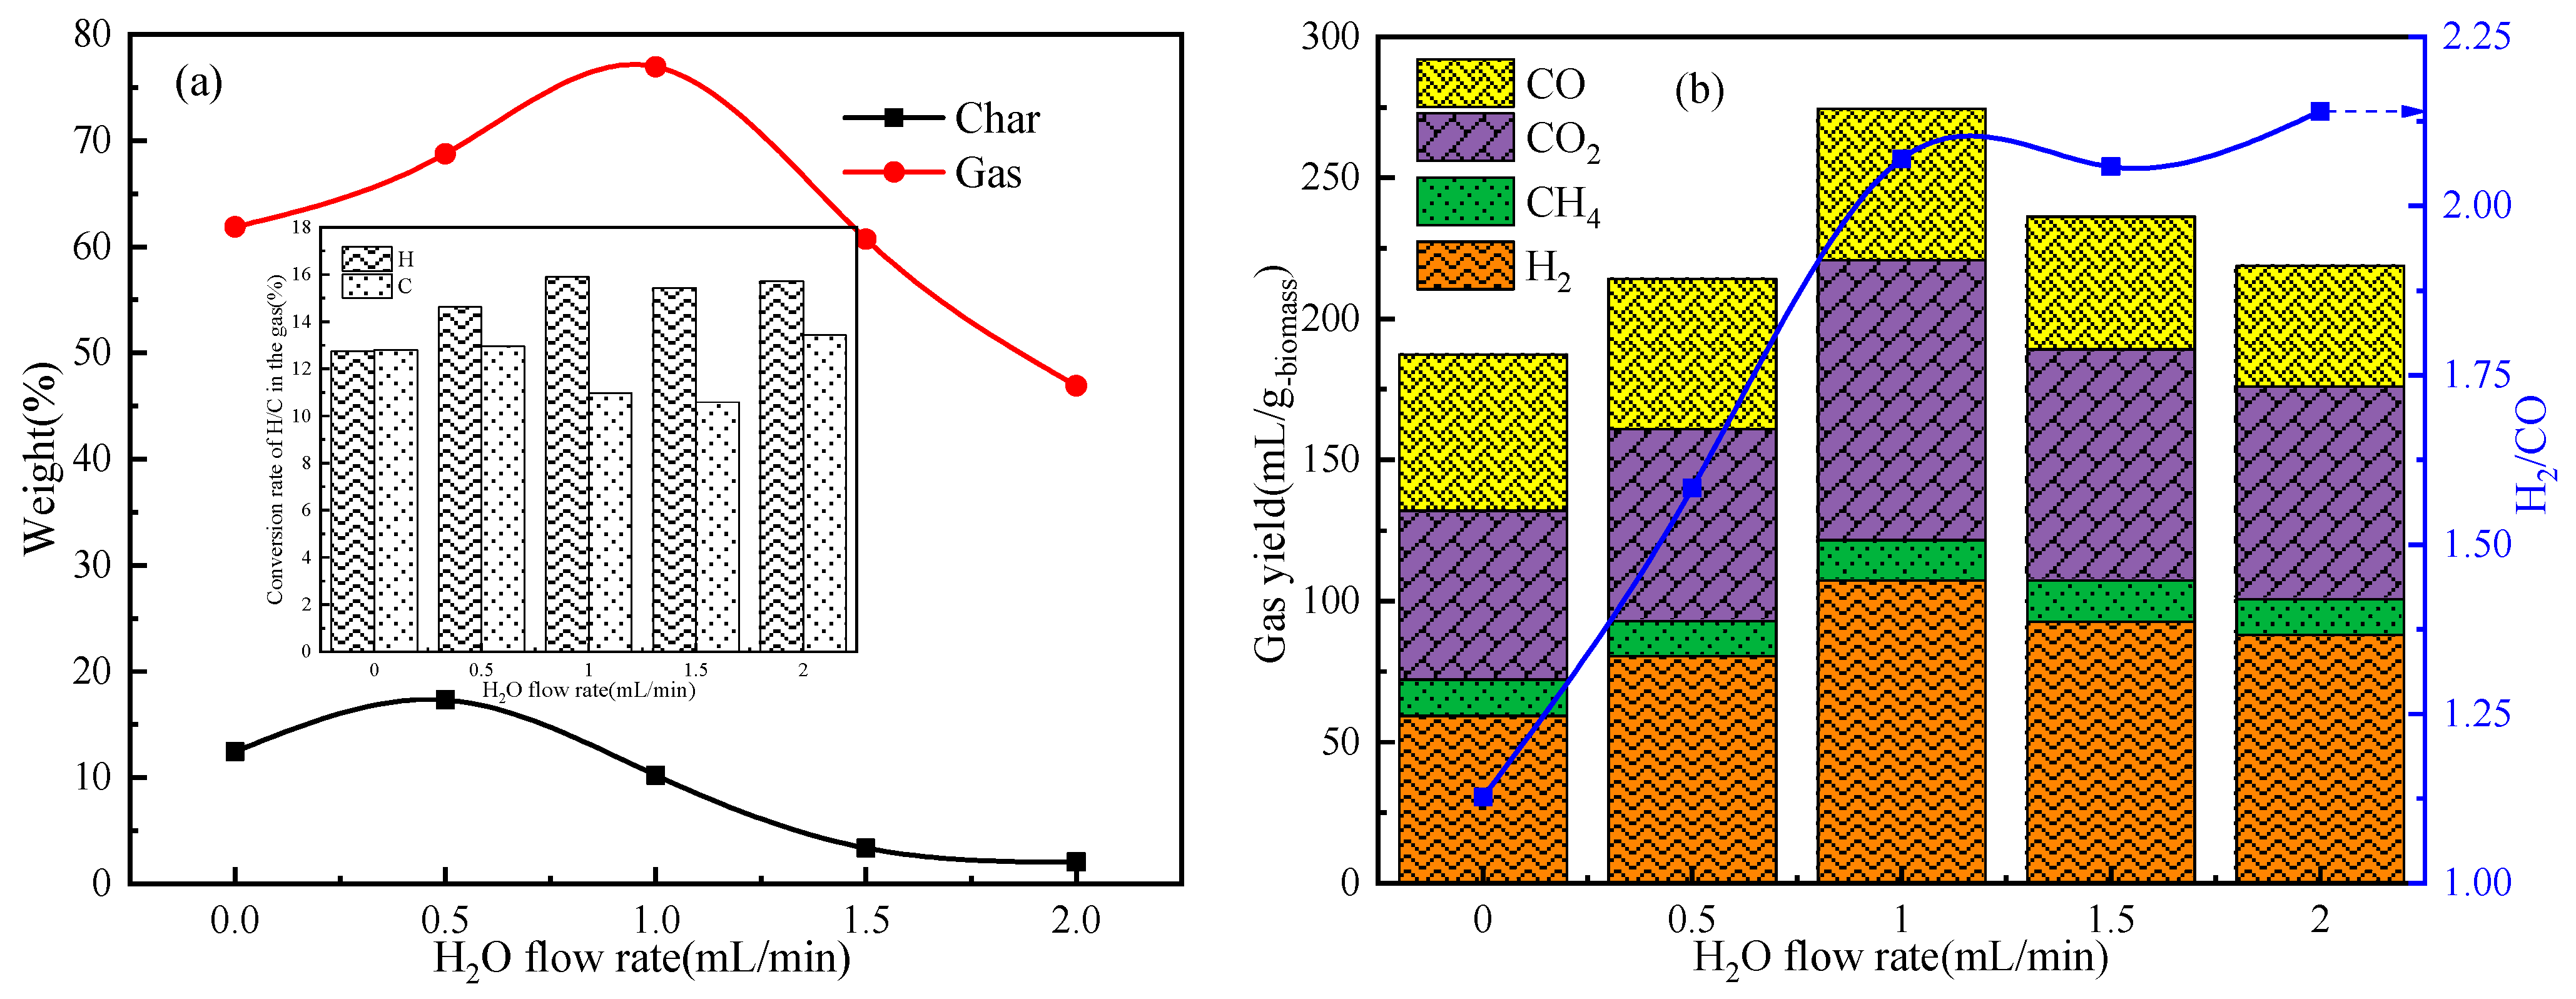
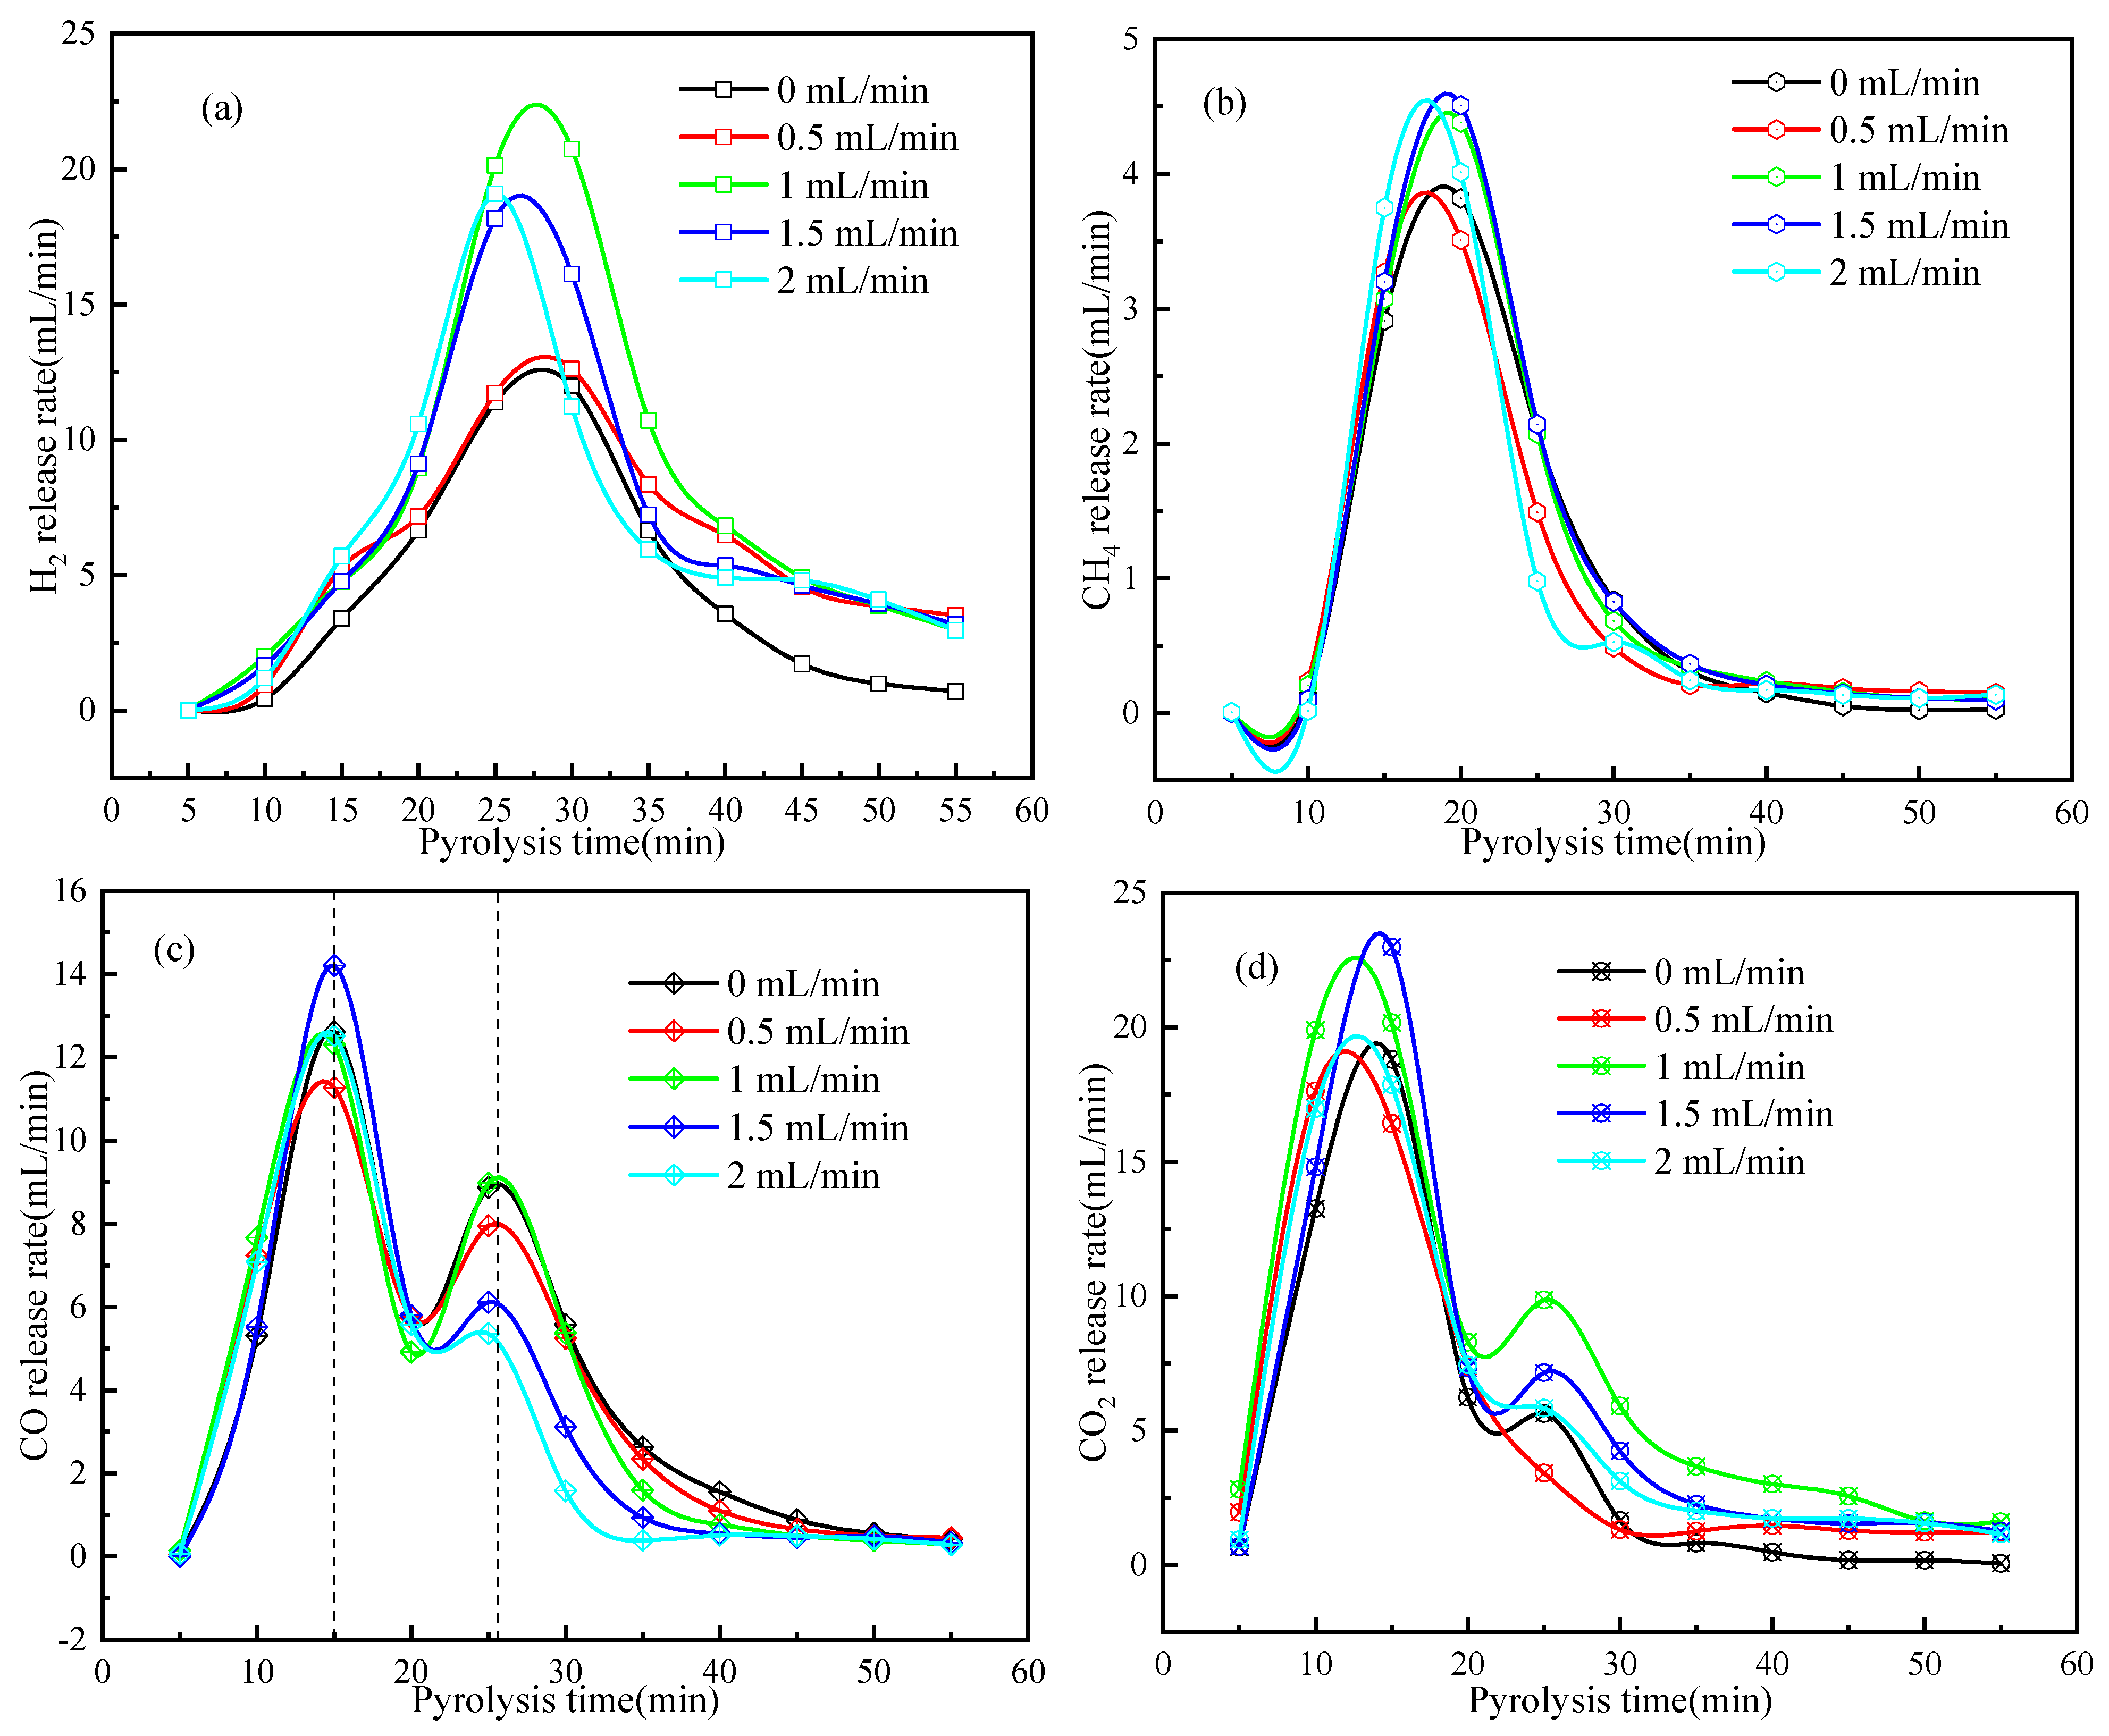
2.3. Enhanced Catalytic Pyrolysis of Wood Biomass under H2O Steam Atmosphere
3. Materials and Method
3.1. Raw Materials
3.2. Pyrolysis Method
3.2.1. Pyrolysis in TG
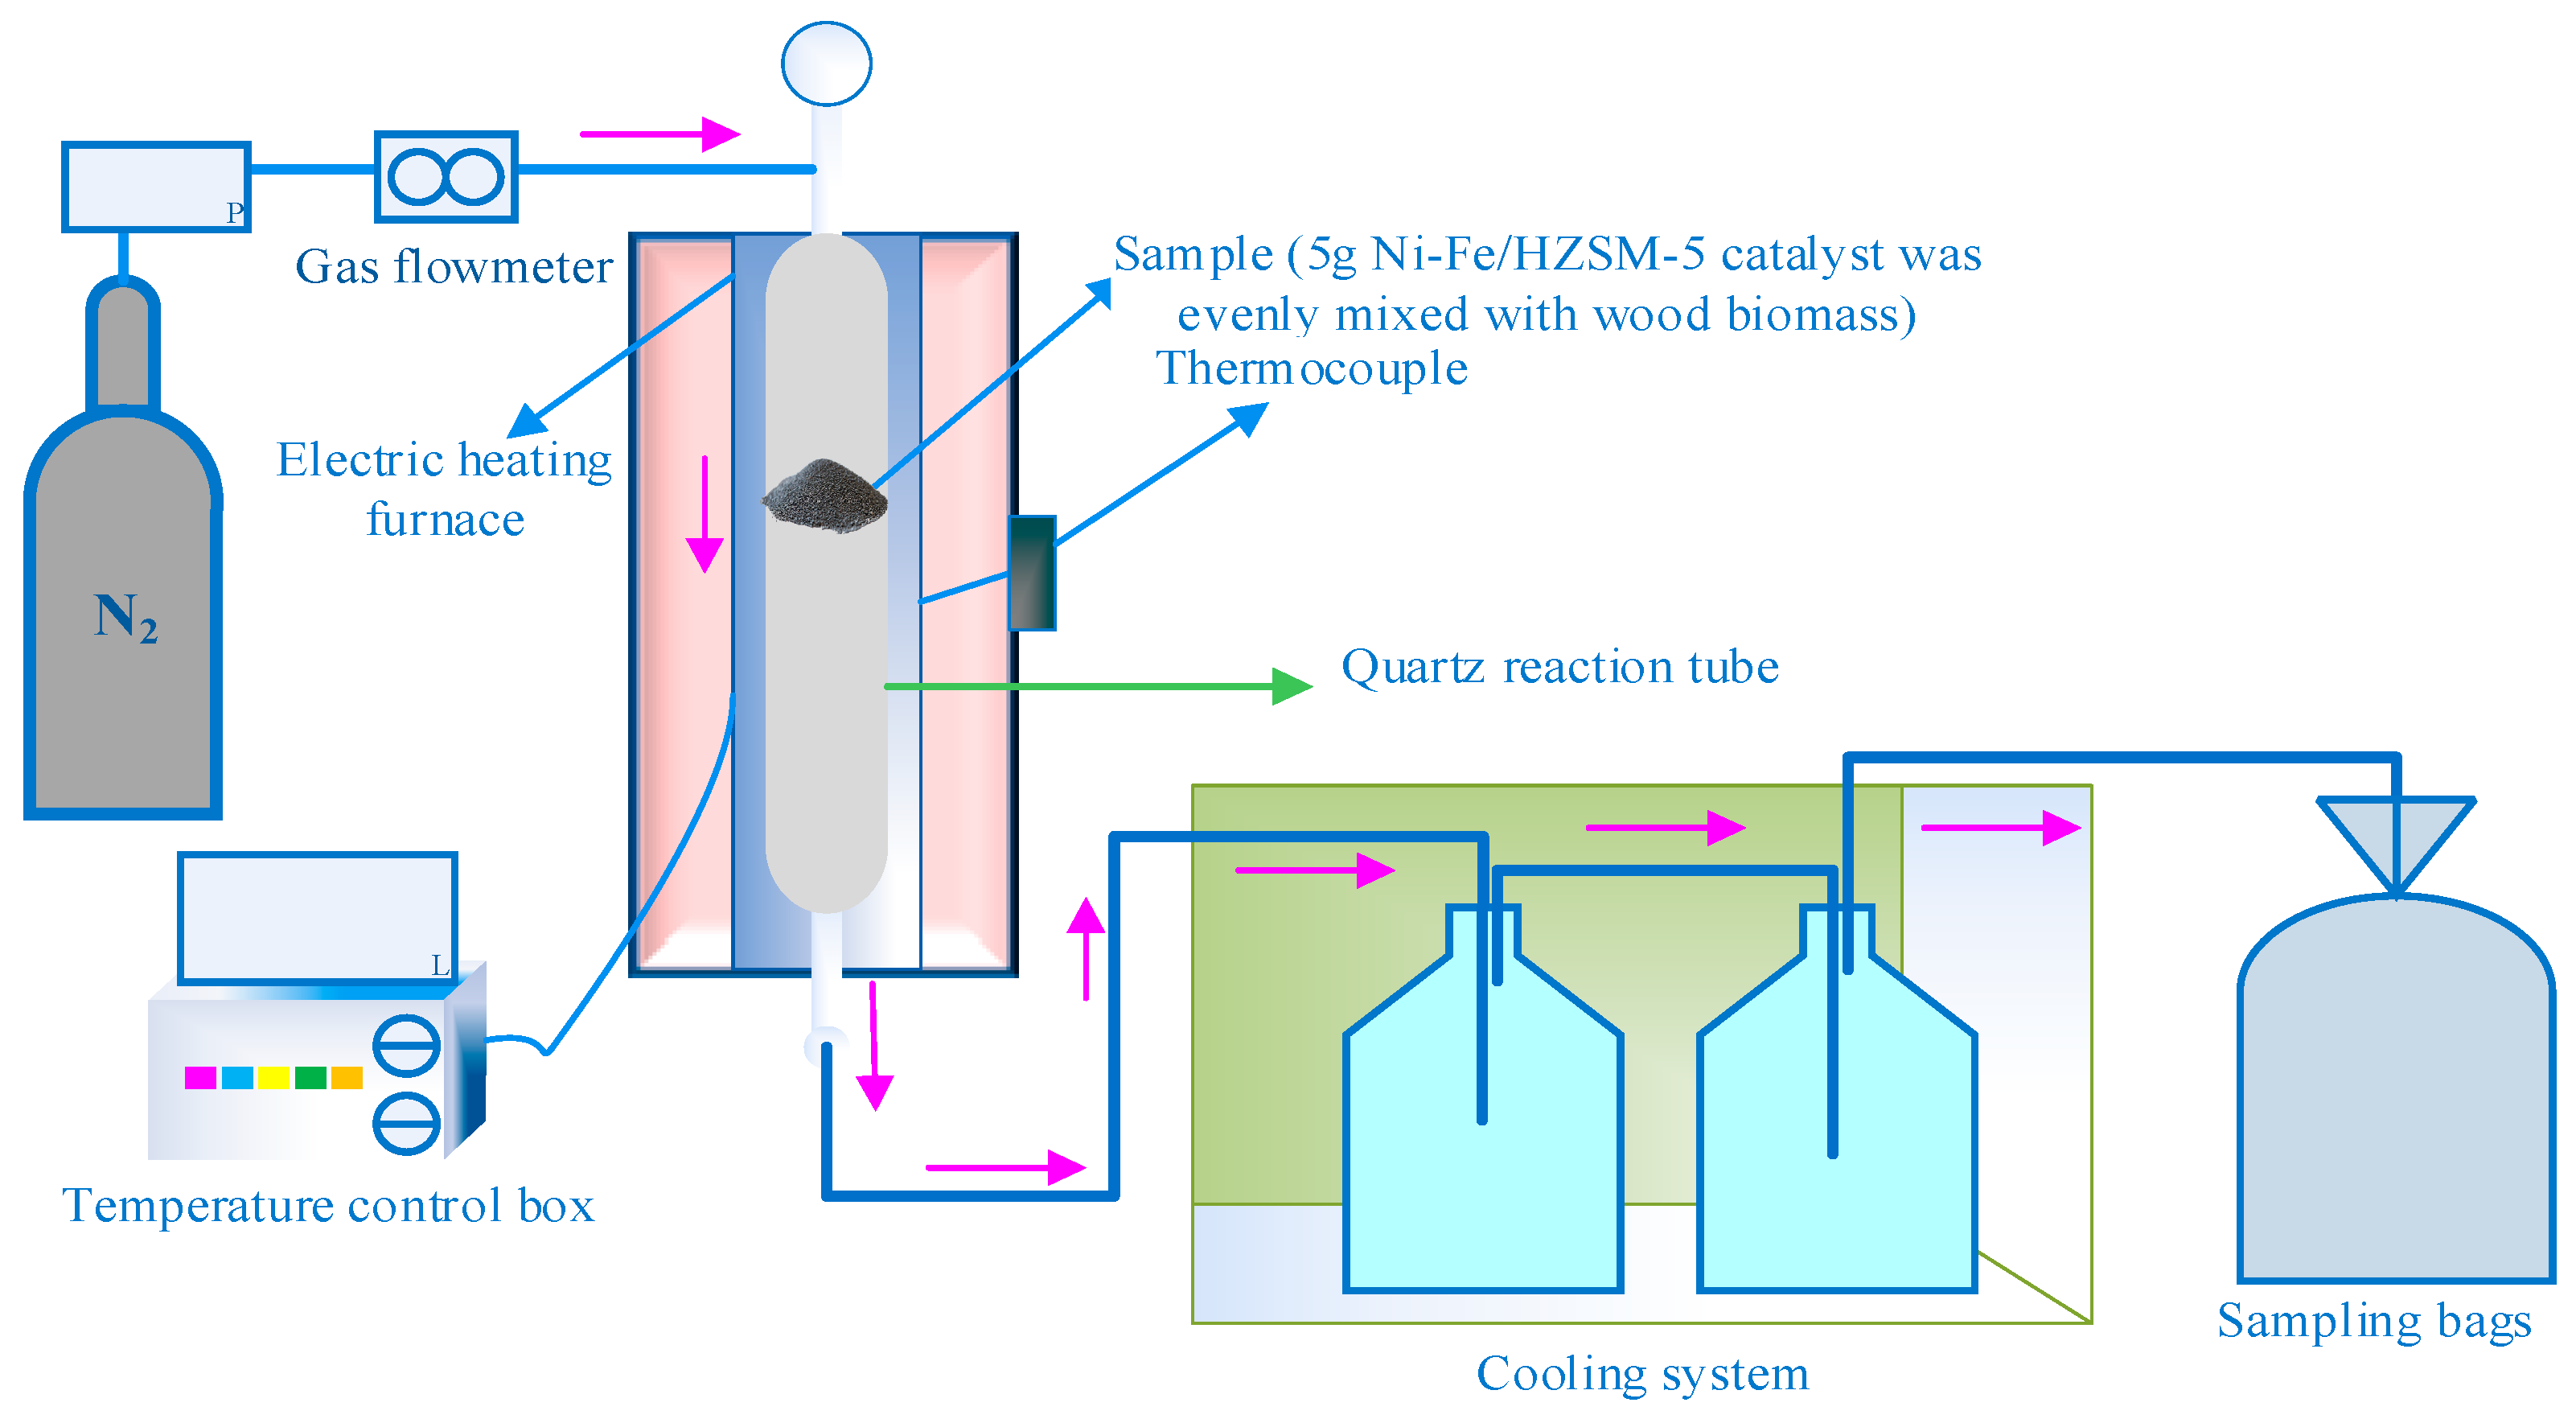
3.2.2. Catalytic Pyrolysis in a Fixed Bed Reactor
3.3. Analysis of Samples and Products
3.3.1. Analysis of Pyrolysis Products
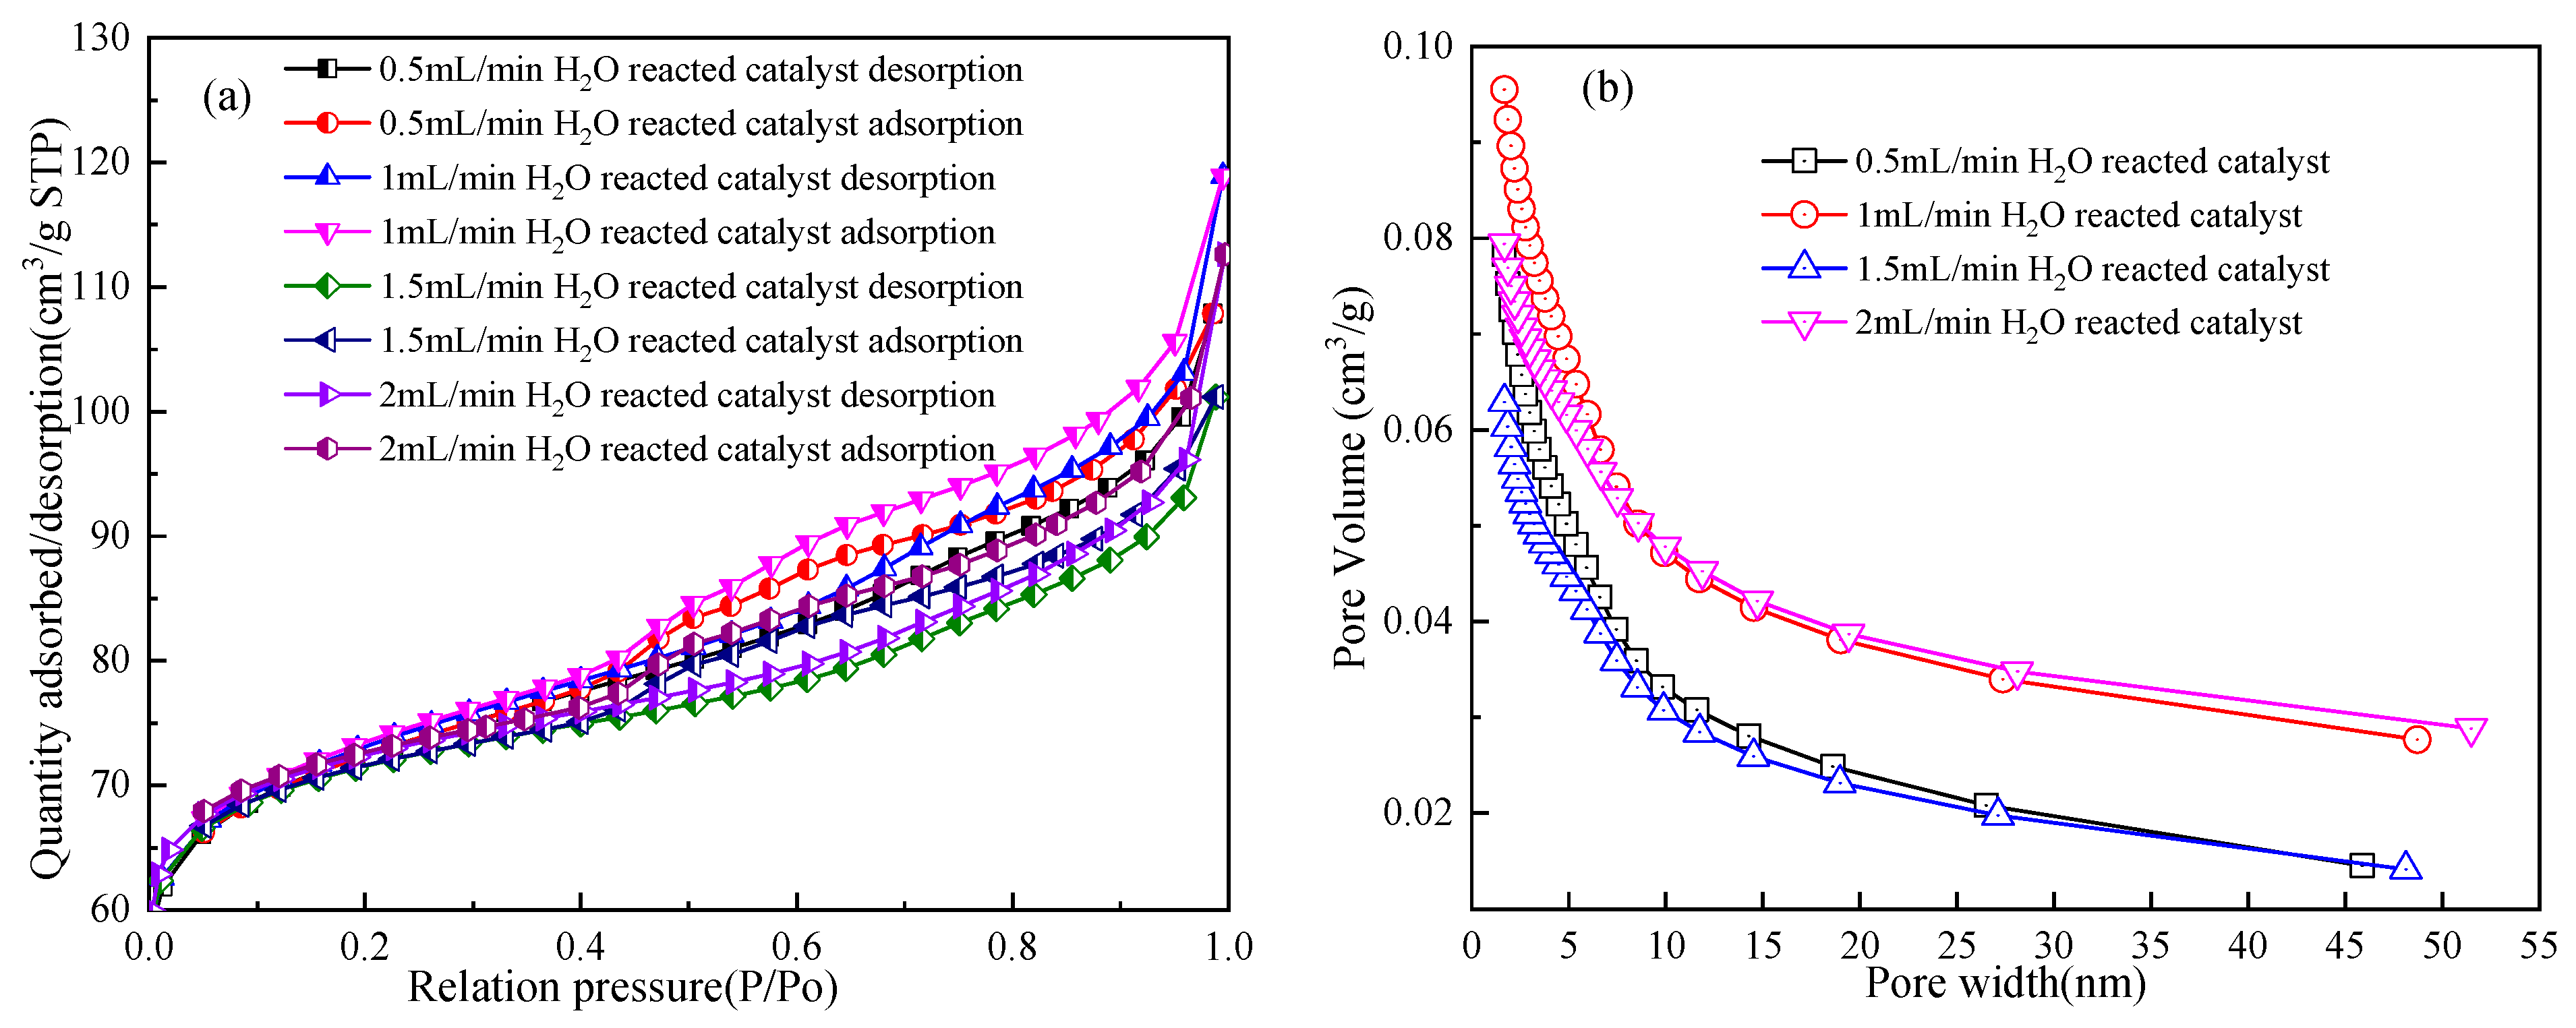
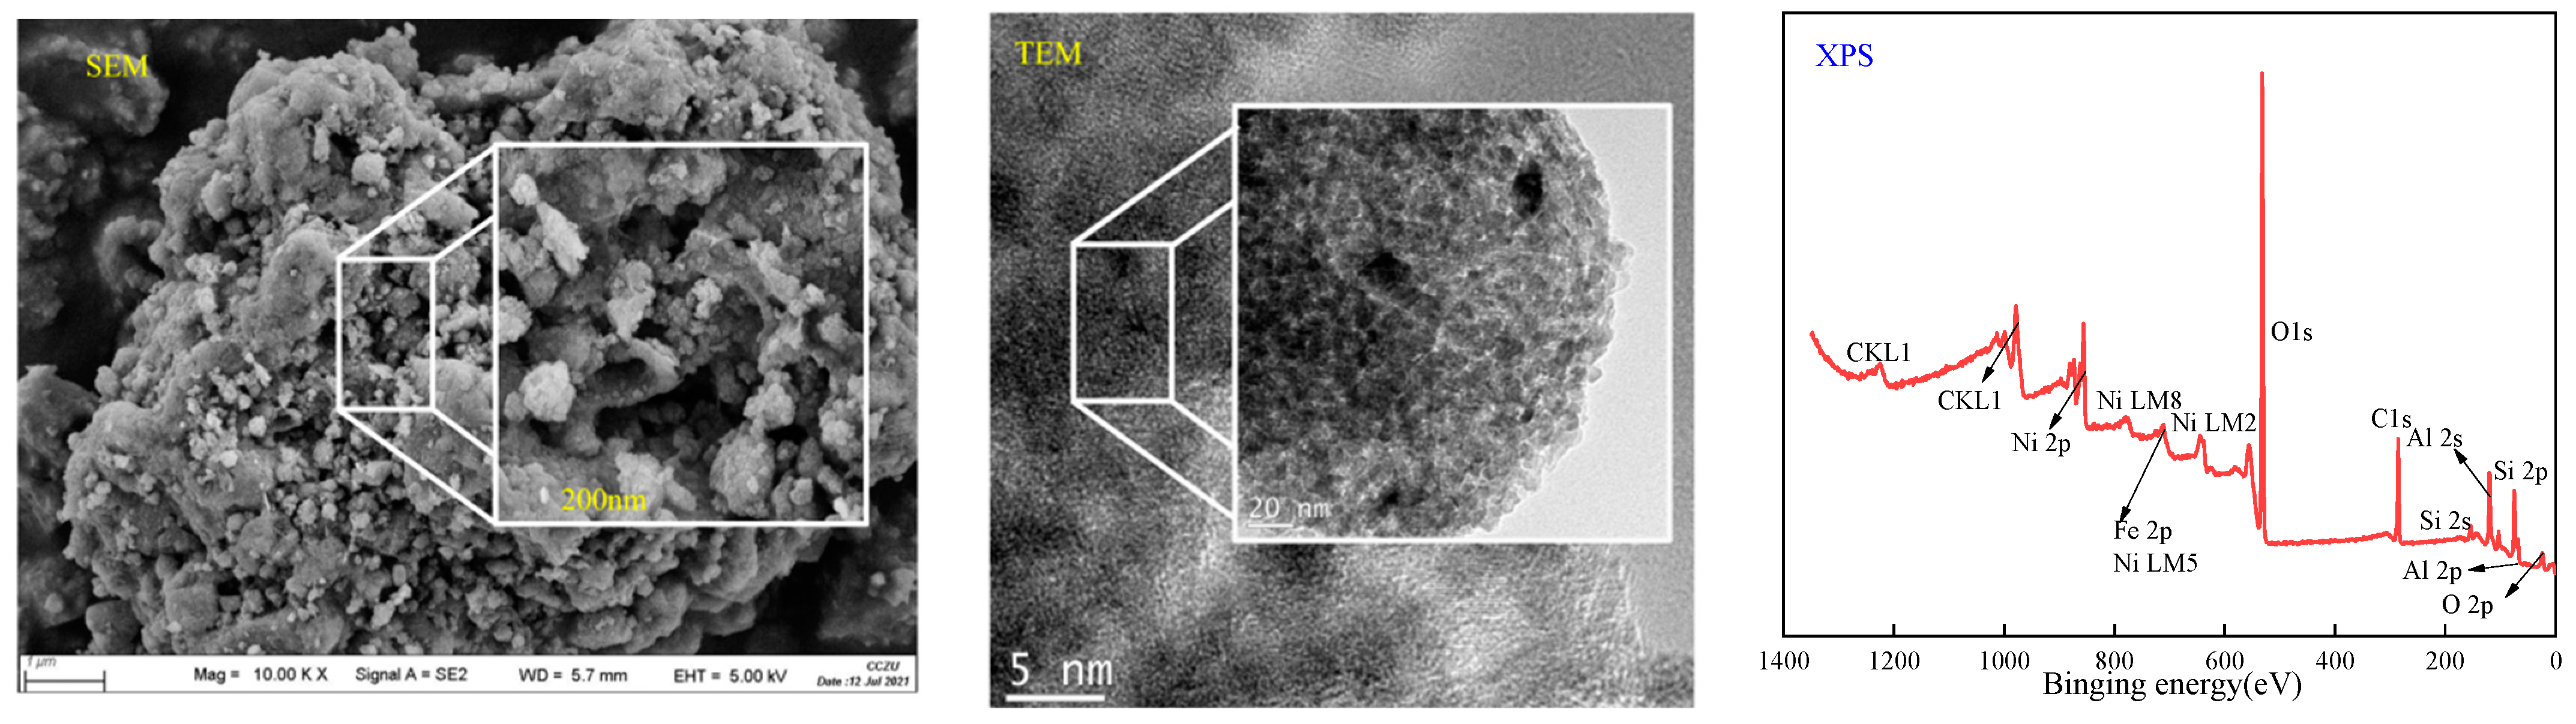
3.3.2. Surface Characteristics of the Reacted Catalyst
3.4. Apparent Kinetic Model
4. Conclusions
Supplementary Materials
Author Contributions
Funding
Data Availability Statement
Conflicts of Interest
References
- Su, J.; Li, T.; Luo, G.; Zhang, Y.; Naranov, E.R.; Wang, K. Co-hydropyrolysis of pine and HDPE over bimetallic catalysts: Efficient BTEX production and process mechanism analysis. Fuel Process. Technol. 2024, 249, 107845. [Google Scholar] [CrossRef]
- Cai, J.; Lin, N.; Li, Y.; Xue, J.; Li, F.; Wei, L.; Yu, M.; Zha, X.; Li, W. Research on the application of catalytic materials in biomass pyrolysis. J. Anal. Appl. Pyrolysis 2024, 177, 106321. [Google Scholar] [CrossRef]
- Suriapparao, D.V.; Tejasvi, R. A review on role of process parameters on pyrolysis of biomass and plastics: Present scope and future opportunities in conventional and microwave-assisted pyrolysis technologies. Process Saf. Environ. Prot. 2022, 162, 435–462. [Google Scholar] [CrossRef]
- Wang, W.; Luo, G.; Zhao, Y.; Tang, Y.; Wang, K.; Li, X.; Xu, Y. Kinetic and thermodynamic analyses of co-pyrolysis of pine wood and polyethylene plastic based on Fraser-Suzuki deconvolution procedure. Fuel 2022, 322, 124200. [Google Scholar] [CrossRef]
- Tan, H.; Yang, M.; Chen, Y.; Chen, X.; Fantozzi, F.; Bartocci, P.; Tschentscher, R.; Barontini, F.; Yang, H.; Chen, H. Preparation of aromatic hydrocarbons from catalytic pyrolysis of digestate. Chin. J. Chem. Eng. 2023, 57, 1–9. [Google Scholar] [CrossRef]
- Wrasman, C.J.; Wilson, A.N.; Mante, O.D.; Iisa, K.; Dutta, A.; Talmadge, M.S.; Dayton, D.C.; Uppili, S.; Watson, M.J.; Xu, X.; et al. Catalytic pyrolysis as a platform technology for supporting the circular carbon economy. Nat. Catal. 2023, 6, 563–573. [Google Scholar] [CrossRef]
- Wang, S.; Cheng, A.; Liu, F.; Zhang, J.; Xia, T.; Zeng, X.; Fan, W.; Zhang, Y. Catalytic conversion network for lignocellulosic biomass valorization: A panoramic view. Ind. Chem. Mater. 2023, 1, 188–206. [Google Scholar] [CrossRef]
- Ranzi, E.; Cuoci, A.; Faravelli, T.; Frassoldati, A.; Migliavacca, G.; Pierucci, S.; Sommariva, S. Chemical Kinetics of Biomass Pyrolysis. Energy Fuels 2008, 22, 4292–4300. [Google Scholar] [CrossRef]
- Wang, G.; Dai, Y.; Yang, H.; Xiong, Q.; Wang, K.; Zhou, J.; Li, Y.; Wang, S. A Review of Recent Advances in Biomass Pyrolysis. Energy Fuels 2020, 34, 15557–15578. [Google Scholar] [CrossRef]
- Singh, S.; Chakraborty, J.P.; Mondal, M.K. Intrinsic kinetics, thermodynamic parameters and reaction mechanism of non-isothermal degradation of torrefied Acacia nilotica using isoconversional methods. Fuel 2020, 259, 116263. [Google Scholar] [CrossRef]
- Jaffar, M.M.; Nahil, M.A.; Williams, P.T. Pyrolysis-catalytic hydrogenation of cellulose-hemicellulose-lignin and biomass agricultural wastes for synthetic natural gas production. J. Anal. Appl. Pyrolysis 2020, 145, 104753. [Google Scholar] [CrossRef]
- Das, P.; Tiwari, P. Thermal degradation kinetics of plastics and model selection. Thermochim. Acta 2017, 654, 191–202. [Google Scholar] [CrossRef]
- Mishra, G.; Kumar, J.; Bhaskar, T. Kinetic studies on the pyrolysis of pinewood. Bioresour Technol. 2015, 182, 282–288. [Google Scholar] [CrossRef]
- Hosoya, T.; Kawamoto, H.; Saka, S. Cellulose–hemicellulose and cellulose–lignin interactions in wood pyrolysis at gasification temperature. J. Anal. Appl. Pyrolysis 2007, 80, 118–125. [Google Scholar] [CrossRef]
- Xu, M. Study on the Characteristics Analysis and Experimental of Biomass Pyrolysis and Gasification. Master’s Thesis, Tianjin University, Tianjin, China, 2008. [Google Scholar]
- Xiu, S.; Yi, W.; He, F. Analyisis on Thermogrametric Curves of Biomass. J. Zibo Uriversity (Nat. Sci. Eng. Ed.) 2002, 2, 82–85. [Google Scholar]
- Jiang, J.; Shen, Y. Study on Reaction Kinetics of Biomass Pyrolysis. Chem. Ind. For. Prod. 2003, 23, 1–6. [Google Scholar]
- Zhang, C. Study on Pyrolysis and its Reaction Kinetics of Agricuiltural and Forestry Biomass. Master’s Thesis, Beijing University of Chemical Technology, Beijing, China, 2013. [Google Scholar]
- Yao, Q.; Xu, L.; Zhang, Y. Production of High Value-added Chemicals by Catalytic Fast Pyrolysis of Biomass. Chem. Ind. For. Prod. 2015, 35, 138–144. [Google Scholar]
- Wu, H.; Liu, A.; Li, L.; Wang, X.; Zhang, Z.; Li, H.; He, F. Effects of potassium on pyrolysis characteristics of pine. J. Fuel Chem. Technol. 2014, 42, 7. [Google Scholar]
- Chen, W.; Lu, J.; Yang, M.; Li, J.; Sun, J. Characteristics of Purolysis Products of Typical Biomass at Different Temperatures. Ind. Heat. 2019, 48, 6. [Google Scholar]
- Sun, T. Production Distribution and Experimental Study of Lignocellulosic Biomass Directional Pyrolysis. Ph.D. Thesis, Henan Agricultural University, Zhengzhou, China, 2021. [Google Scholar]
- Dickerson, T.; Soria, J. Catalytic Fast Pyrolysis: A Review. Energies 2013, 6, 514–538. [Google Scholar] [CrossRef]
- Duan, D.; Wang, Y.; Dai, L.; Ruan, R.; Zhao, Y.; Fan, L.; Tayier, M.; Liu, Y. Ex-situ catalytic co-pyrolysis of lignin and polypropylene to upgrade bio-oil quality by microwave heating. Bioresour. Technol. 2017, 241, 207–213. [Google Scholar] [CrossRef]
- Wang, Y.; Akbarzadeh, A.; Chong, L.; Du, J.; Tahir, N.; Awasthi, M.K. Catalytic pyrolysis of lignocellulosic biomass for bio-oil production: A review. Chemosphere 2022, 297, 134181. [Google Scholar] [CrossRef]
- Qiu, B.; Tao, X.; Wang, J.; Liu, Y.; Li, S.; Chu, H. Research progress in the preparation of high-quality liquid fuels and chemicals by catalytic pyrolysis of biomass: A review. Energy Convers. Manag. 2022, 261, 115647. [Google Scholar] [CrossRef]
- Liao, Y. Hydrogen-Rich Gas Production from Biomass Catalytic Gasification over Fe-Ce/Olivine Catalyst. Master’s Thesis, Huazhong University of Science and Technology, Wuhan, China, 2015. [Google Scholar]
- Zhang, X.; Chen, G.; Meng, X.; Li, X. Production of hydrogen-rich gas from biomass by catalytic pyrolysis. J. Fuel Chem. Technol. 2004, 32, 446–449. [Google Scholar]
- Feng, J.; Shu, X. Study on Preparation of Hydrogen from Biomass Waste. Environ. Sustain. Dev. 2007, 4, 234–237. [Google Scholar]
- Hu, G. Research on biomass gasification catalysts for hydrogen production. Master’s Thesis, Dalian University of Technology, Dalian, China, 2005. [Google Scholar]
- Pang, Y.; Meng, H.; Chen, Y.; Liu, X.; Wu, Y. Biomass charcoal catalytic with Ca/Fe enhancing hydrogen production by pyrolysis volatile steam reforming. Trans. Chin. Soc. Agric. Eng. 2019, 35, 187–192. [Google Scholar]
- Cao, Z.; Wang, L.; Wu, Y.; Zhu, Y. Research progress in effect of catalysts on hydrogen production by biomass gasification. Mod. Chem. Ind. 2021, 41, 47–52. [Google Scholar]
- Hao, Q.; Wang, C.; Lu, D.; Wang, Y.; Li, D.; Li, G. Production of hydrogen-rich gas from plant biomass by catalytic pyrolysis at low temperature. Int. J. Hydrog. Energy 2010, 35, 8884–8890. [Google Scholar]
- Fernandez, E.; Amutio, M.; Artetxe, M.; Arregi, A.; Santamaria, L.; Lopez, G.; Bilbao, J.; Olazar, M. Assessment of product yields and catalyst deactivation in fixed and fluidized bed reactors in the steam reforming of biomass pyrolysis volatiles. Trans. Inst. Chem. Eng. Process Saf. Environ. Prot. Part B 2021, 145, 52–62. [Google Scholar] [CrossRef]
- Sun, N.; Ying, H.; Xu, W.; Sun, Y.; Xu, Y.; Jia, S. Catalytic gasification of pine sawdust for producing hydrogen-rich gas. Chem. Ind. Eng. Prog. 2017, 36, 2158–2163. [Google Scholar]
- Ghodke, P.K.; Sharma, A.K.; Jayaseelan, A.; Gopinath, K.P. Hydrogen-rich syngas production from the lignocellulosic biomass by catalytic gasification: A state of art review on advance technologies, economic challenges, and future prospectus. Fuel 2023, 342, 127800. [Google Scholar] [CrossRef]
- Collard, F.-X.; Blin, J.; Bensakhria, A.; Valette, J. Influence of impregnated metal on the pyrolysis conversion of biomass constituents. J. Anal. Appl. Pyrolysis 2012, 95, 213–226. [Google Scholar] [CrossRef]
- Zhou, X.; Zhang, L.; Chen, Q.; Xiao, X.; Wang, T.; Cheng, S.; Li, J. Study on the mechanism and reaction characteristics of red-mud-catalyzed pyrolysis of corn stover. Fuel 2023, 338, 127290. [Google Scholar] [CrossRef]
- Lu, Q.; Zhang, T.; Deng, X.; He, R.; Yuan, S.; Li, J.; Xie, X.; Li, W.; Liu, Z.; Zhang, X. Enhancement of gas and aromatics by in-situ catalytic pyrolysis of biomass in the presence of silica gel. Biomass Bioenergy 2020, 138, 105567. [Google Scholar] [CrossRef]
- Xia, S.; Yang, H.; Lu, W.; Cai, N.; Xiao, H.; Chen, X.; Chen, Y.; Wang, X.; Wang, S.; Wu, P.; et al. Fe–Co based synergistic catalytic graphitization of biomass: Influence of the catalyst type and the pyrolytic temperature. Energy 2022, 239, 122262. [Google Scholar] [CrossRef]
- Tsaplin, D.; Sadovnikov, A.; Ramazanov, D.; Gorbunov, D.; Ryleeva, V.; Maximov, A.; Wang, K.; Naranov, E. Selective Hydrodeoxy genation of Guaiacol to Cyclohexane over Ru-Catalysts Based on MFI Nanosheets. Micro 2023, 3, 610–619. [Google Scholar] [CrossRef]
- Liu, P.; Wang, Y.; Zhou, Z.; Yuan, H.; Zheng, T.; Chen, Y. Effect of carbon structure on hydrogen release derived from different biomass pyrolysis. Fuel 2020, 271, 117638. [Google Scholar] [CrossRef]
- Liu, P.; Liu, L.; Zhou, Z.; Li, Y.; Yuan, H.; Huhetaoli; Lei, T. Co-pyrolysis of pine sawdust with aluminum dross for immobilization of heavy metal and enhancing hydrogen generation. Fuel 2021, 305, 121597. [Google Scholar] [CrossRef]
- Liu, P.; Lang, P.; Chen, Z.; Li, Y.; Sun, T.; Yang, Y.; Huhe, T.; Lei, T. Relevance of chemical structure in different wood wastes to pyrolysis behavior: Kinetics and hydrogen release. J. Energy Inst. 2023, 111, 101416. [Google Scholar] [CrossRef]
- Li, X.; Liu, P.; Yang, Y.; Li, Y.; Wu, S.; Huhe, T.; Huang, S.; Sun, T.; Wang, L.; Wu, Y.; et al. Pyrolysis behaviors of biomass tar-related model compounds catalyzed by Ni-modified HZSM-5 molecular sieve. Ind. Crops Prod. 2023, 199, 116743. [Google Scholar] [CrossRef]
- Lang, P.; Liu, P.; Li, Y.; Li, X.; Lei, T. Study on Kinetics and Thermodynamic Parameters for Pyrolysis of Different Sawdust Biomass. China For. Prod. Ind. 2022, 59, 30–37+52. [Google Scholar]
- Sun, L. Mechanism and Experiment of Biomass Pyrolysis for Hydrogen Production. Ph.D. Thesis, Tianjin University, Tianjin, China, 2007. [Google Scholar]
- Lan, Y.; Lv, M.; Ma, C.; Shi, M. Study on the Characteristics and Dynamics of Pyrolysis Process Agricultural Residues. Acta Energiae Solaris Sin. 2002, 23, 203–206. [Google Scholar]


| Research Organization | Pyrolytic Technique | Country | Sale (kg/h) |
|---|---|---|---|
| Dynamotive | Fluidized bed | Canada | 1500 |
| Red Arrom/Emsyn | Circulating fluidized bed | America | 1250 |
| Red Arrom/Emsyn | Circulating fluidized bed | America | 1000 |
| ENEL/Emsym | Circulating fluidized bed | Italy | 625 |
| BTC/kara | Rotating cone | Netherlands | 200 |
| Uniom Feboea/Waterloo | Fluidized bed | Spain | 200 |
| Ensym | Circulating fluidized bed | Canada | 100 |
| BTC | Rotating cone | Netherlands | 50 |
| University of Hamburg | Fluidized bed | Germany | 50 |
| University of Laval | Vacuum fluidized bed | Canada | 50 |
| NREL | Ablation rotating cone | America | 30 |
| RTI | Fluidized bed | Canada | 30 |
| VET/Ensym | Circulating fluidized bed | Finland | 30 |
| CRES | Circulating fluidized bed | Greece | 20 |
| University of Waterloo | Fluidized bed | Canada | 4 |
| Sample | β (mL/min) | m0 (mg) | m (mg) | m∞ (mg) | t (min) | T (K) | RT |
|---|---|---|---|---|---|---|---|
| PR | 10 | 12.66 | 1.41 | 1.27 | 146.00 | 1123.15 | 9337.87 |
| 20 | 12.11 | 1.61 | 1.52 | 104.50 | 1123.50 | 9340.78 | |
| 30 | 12.69 | 1.69 | 1.62 | 92.18 | 1123.33 | 9339.32 | |
| 40 | 12.41 | 1.63 | 1.56 | 85.76 | 1123.33 | 9339.32 | |
| CR | 10 | 17.41 | 3.31 | 3.15 | 142.00 | 1123.15 | 9337.87 |
| 20 | 15.98 | 3.08 | 2.97 | 104.50 | 1123.50 | 9340.78 | |
| 30 | 16.16 | 3.18 | 3.06 | 92.18 | 1123.33 | 9339.32 | |
| 40 | 16.07 | 3.15 | 3.05 | 85.76 | 1123.33 | 9339.32 |
| β(mL/min) | PR | CR | ||
|---|---|---|---|---|
| Ea (kJ/mol) | A (min−1) | Ea (kJ/mol) | A (min−1) | |
| 10 | 73.89 | 1341.81 | 73.04 | 1237.76 |
| 20 | 72.22 | 1144.56 | 72.27 | 1150.18 |
| 30 | 71.69 | 1091.38 | 72.44 | 1169.72 |
| 40 | 71.63 | 1084.02 | 71.77 | 1099.88 |
| Sample | Ea (kJ/mol) | A (min−1) |
|---|---|---|
| CR | 72.38 | 1147.11 |
| PR | 72.36 | 1144.39 |
| Type | Name | Percent Proportion (%) | |||||
|---|---|---|---|---|---|---|---|
| 400 °C | 500 °C | 600 °C | 700 °C | 800 °C | 900 °C | ||
| AC | Acetic acid | 3.96 | 36.01 | 24.50 | 23.74 | 42.91 | |
| Acetic acid, (acetyloxy)- | 1.61 | ||||||
| Propanoic acid | 2.61 | 2.67 | 2.44 | ||||
| Dodecanoic acid, 3-hydroxy- | 3.03 | 4.42 | 1.05 | 2.71 | |||
| KE | 2-Propanone, 1-hydroxy- | 66.28 | 6.53 | 3.30 | 5.04 | 5.53 | 9.86 |
| 1-Hydroxy-2-butanone | 0.90 | 0.99 | 0.70 | 2.40 | |||
| 1-Hydroxy-2-pentanone | 1.80 | ||||||
| 2-Cyclopenten-1-one | 2.32 | 2.65 | 2.02 | 1.65 | 2.07 | 1.62 | |
| 2-Propanone, 1-(acetyloxy)- | 0.77 | 3.74 | 6.15 | ||||
| 2-Cyclopenten-1-one, 2-hydroxy- | |||||||
| 2-Cyclopenten-1-one, 2-hydroxy-3-methyl- | 6.16 | ||||||
| AL | Succindialdehyde | 1.40 | |||||
| 3-Furaldehyde | 1.19 | 10.43 | 7.68 | 9.06 | 1.74 | ||
| 2-Furancarboxaldehyde, 5-methyl- | 3.23 | 2.50 | 3.13 | 6.91 | |||
| Furfural | 9.03 | ||||||
| 5-Hydroxymethylfurfural | 20.32 | 15.26 | 16.82 | ||||
| ALc | 2,3-Butanediol | 4.24 | 4.16 | 33.02 | 3.38 | 2.49 | |
| 2-Furanmethanol | 2.40 | 1.95 | 1.47 | 1.18 | 2.91 | ||
| Creosol | 12.27 | ||||||
| 2-Propyl-tetrahydropyran-3-ol | 5.60 | 6.06 | 6.00 | 64.83 | 4.75 | ||
| ALk | Propanal, 2,3-dihydroxy-, (S)- | 1.13 | 1.34 | ||||
| PH | Phenol, 2-methoxy- | 1.04 | 1.04 | 0.77 | 0.91 | 2.25 | 14.06 |
| Phenol, 4-ethyl-2-methoxy- | 9.39 | ||||||
| Phenol, 2,6-dimethoxy- | 2.03 | 1.76 | |||||
| Phenol, 2-methoxy-5-(1-propenyl)-, (E)- | 3.13 | ||||||
| Phenol, 2-methoxy-4-(1-propenyl)- | 9.25 | ||||||
| 2-Methoxy-4-vinylphenol | 9.43 | ||||||
| FU | Ethanone, 1-(2-furanyl)- | 1.22 | 0.91 | 0.72 | 0.79 | 1.46 | |
| Benzofuran, 2,3-dihydro- | 2.09 | 2.25 | 2.65 | ||||
| ES | Carbamic acid, methyl-, phenyl ester | 1.19 | 0.90 | 0.90 | 2.01 | ||
| Butyrolactone | 1.49 | 18.60 | 1.55 | 1.55 | 1.90 | ||
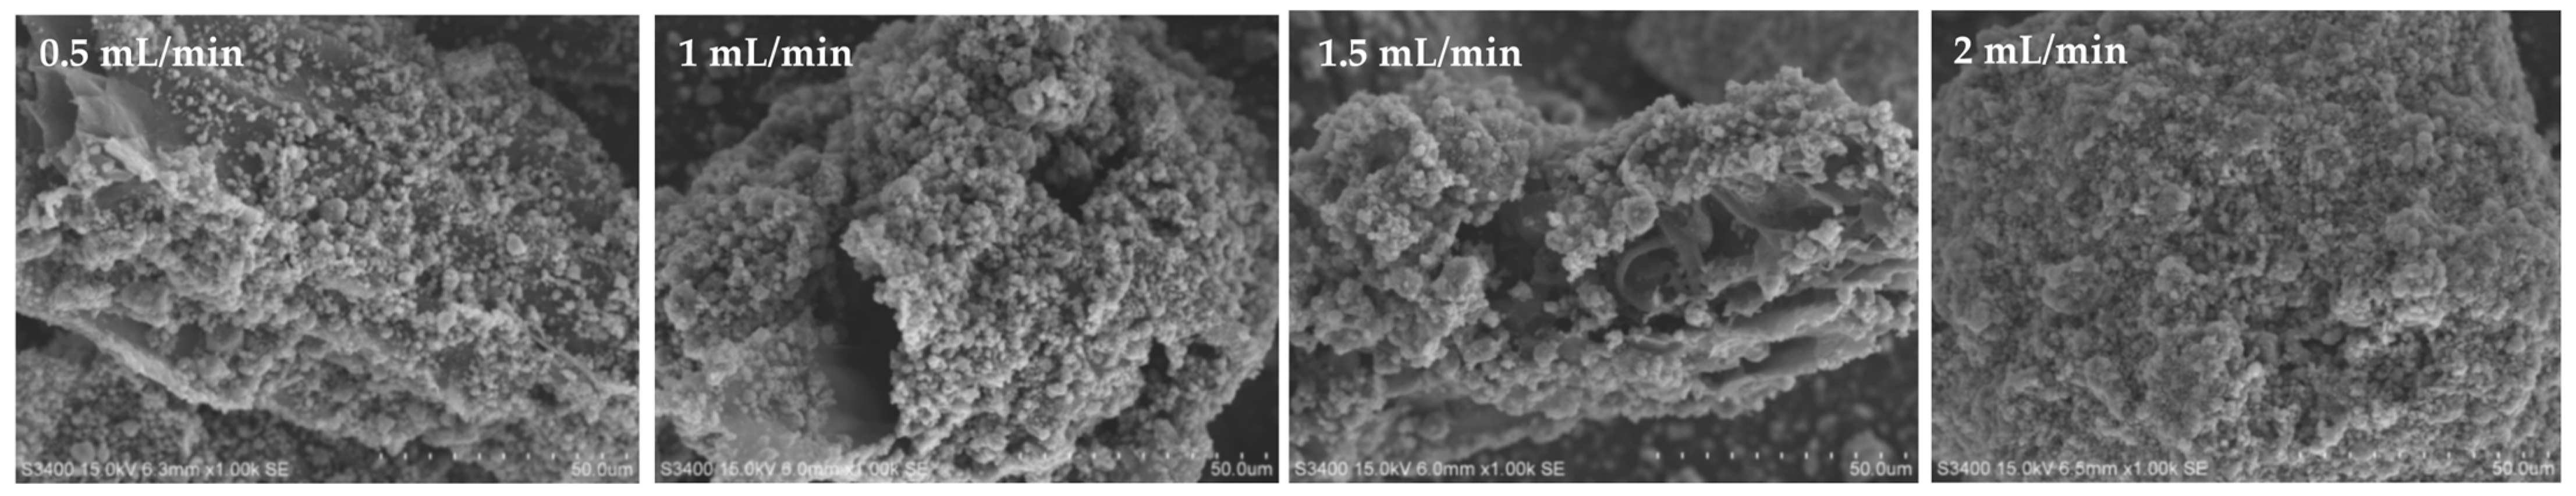
| Sample | BET Surface Area (m²/g) | t-Plot Micropore Area (m²/g) | Total Pore Volume (cm³/g) | Pore Size (nm) | Average Nanoparticle (nm) |
|---|---|---|---|---|---|
| Reacted catalyst under 0.5 mL/min H2O | 227.56 | 157.86 | 0.17 | 2.93 | 26.37 |
| Reacted catalyst under 1 mL/min H2O | 229.30 | 157.15 | 0.18 | 3.21 | 26.17 |
| Reacted catalyst under 1.5 mL/min H2O | 224.82 | 171.25 | 0.16 | 2.82 | 26.16 |
| Reacted catalyst under 2 mL/min H2O | 224.35 | 174.34 | 0.17 | 3.11 | 26.74 |
| Catalyst | Raw Material | Temperature (°C) | Gas Production Composition (vol%) | |||
|---|---|---|---|---|---|---|
| H2 | CH4 | CO | CO2 | |||
| 40%wtCaCO3 | Rice straw | 750 | 11.8 | 14.5 | 15 | |
| K2CO3/Ni-Al2O3 | Coking coal | 560 | 61.4 | 0 | 1.9 | 36.6 |
| Ni-based catalyst | Apricot pit | 850 | 88.74 | 9.15 | ||
| biocarbon | Corn straw | 800 | 34.53 | 10.71 | 30.37 | |
| Dolomite | 650 | 79.1 | ||||
| Pine | 900 | 70.5 | ||||
| Ni-Mo/Al2O3 | Sawdust | 600 | 52.82 | 3.8 | 33.68 | 8.63 |
| SiO2 | Sawdust | 600 | 0.45 | 9.31 | 3.65 | 0.75 |
| Ni-Al2O3-Ca | Pine | 500 | 0.04 | 0.36 | 3.27 | 3.38 |
| Ni-based catalyst | Pine | 700 | 31.31 | 1.8 | 49.83 | 16.4 |
| Wood biomass | 46.03 | 0.79 | 39.03 | 14.15 | ||
| Cellulose | 34.67 | 1.08 | 47.36 | 16.83 | ||
| Ni-CaO catalyst | Pine | 750 | 60.23 | 6.74 | 18.44 | 13.18 |
| 1.8Ni/Al2O3 | Pine | 900 | 29.78 | 15.55 | 39.97 | 10.20 |
| W-Ni0.65 | Beech wood | 600 | 0.58 | 0.9 | 10 | 16.6 |
| RM800-40%Fe2O3 | Corn straw | 900 | 22.98 | 29.8 | 36.6 | 10.6 |
| 5%SiO2 | Wheat straw | 600 | 20.7 | 7.89 | 25.86 | 45.6 |
| BFeCo | Bamboo | 850 | 32.6 | 7.96 | 27.97 | 28.76 |
| Sample | Proximate Analysis/% | QG (MJ/Kg) | |||||
| Mad | Aad | Vad | FCad | ||||
| PR | 9.70 | 1.30 | 83.65 | 16.35 | 16.62 | ||
| CR | 10.57 | 5.35 | 80.04 | 19.96 | 16.40 | ||
| Sample | Ultimate analysis (dry)/% | ||||||
| N | C | H | S | O # | H/C | O/C | |
| PR | 0.48 | 53.51 | 7.27 | 0.04 | 38.70 | 1.63 | 0.54 |
| CR | 0.76 | 51.88 | 7.51 | 0.04 | 36.21 | 1.62 | 0.49 |
| Sample | Fiber analysis(dry)/% | ||||||
| Hemicellulose | Cellulose | Lignin | Extractable | ||||
| PR | 19.56 | 53.20 | 18.96 | 8.28 | |||
| CR | 17.71 | 39.45 | 27.62 | 15.22 | |||
| BET Surface Area (m²/g) | t-Plot Micropore Area (m²/g) | t-Plot External Surface Area (m²/g) | Total Pore Volume (cm³/g) | Pore Size (nm) |
|---|---|---|---|---|
| 219.50 | 133.02 | 84.48 | 0.17 | 3.11 |
Disclaimer/Publisher’s Note: The statements, opinions and data contained in all publications are solely those of the individual author(s) and contributor(s) and not of MDPI and/or the editor(s). MDPI and/or the editor(s) disclaim responsibility for any injury to people or property resulting from any ideas, methods, instructions or products referred to in the content. |
© 2024 by the authors. Licensee MDPI, Basel, Switzerland. This article is an open access article distributed under the terms and conditions of the Creative Commons Attribution (CC BY) license (https://creativecommons.org/licenses/by/4.0/).
Share and Cite
Li, X.; Lu, Y.; Liu, P.; Wang, Z.; Huhe, T.; Chen, Z.; Wu, Y.; Lei, T. A Study on the Pyrolysis Behavior and Product Evolution of Typical Wood Biomass to Hydrogen-Rich Gas Catalyzed by the Ni-Fe/HZSM-5 Catalyst. Catalysts 2024, 14, 200. https://doi.org/10.3390/catal14030200
Li X, Lu Y, Liu P, Wang Z, Huhe T, Chen Z, Wu Y, Lei T. A Study on the Pyrolysis Behavior and Product Evolution of Typical Wood Biomass to Hydrogen-Rich Gas Catalyzed by the Ni-Fe/HZSM-5 Catalyst. Catalysts. 2024; 14(3):200. https://doi.org/10.3390/catal14030200
Chicago/Turabian StyleLi, Xueqin, Yan Lu, Peng Liu, Zhiwei Wang, Taoli Huhe, Zhuo Chen, Youqing Wu, and Tingzhou Lei. 2024. "A Study on the Pyrolysis Behavior and Product Evolution of Typical Wood Biomass to Hydrogen-Rich Gas Catalyzed by the Ni-Fe/HZSM-5 Catalyst" Catalysts 14, no. 3: 200. https://doi.org/10.3390/catal14030200