

Hydrocracking of a HDPE/VGO Blend: Influence of Catalyst-to-Feed Ratio on Fuel Yield and Composition

Department of Chemical Engineering, University of the Basque Country UPV/EHU, P.O. Box 644, 48080 Bilbao, Spain
*
Author to whom correspondence should be addressed.
Catalysts 2024, 14(3), 203; https://doi.org/10.3390/catal14030203
Submission received: 20 February 2024
/
Revised: 7 March 2024
/
Accepted: 14 March 2024
/
Published: 19 March 2024
(This article belongs to the Special Issue Heterogeneous Catalysis for Sustainable Conversion of Biomass, Carbon Dioxide and Plastic Waste into Fuels and Chemicals)
Abstract
:The effects that the catalyst-to-feed ratio have on the yields of products and composition of the naphtha and light cycle oil (LCO) fractions in the hydrocracking of a blend composed of high-density polyethylene (HDPE) and vacuum gasoil (VGO) using a PtPd/HY catalyst were assessed. The hydrocracking runs were carried out in a batch reactor fixing the following operation conditions: 420 °C, 80 bar, 120 min and an HDPE-to-VGO ratio of 0.2 gHDPE gVGO−1, varying the catalyst-to-feed mass ratio within the 0.05–0.1 gcatalyst gfeed−1 range. The obtained results exposed that a catalyst-to-feed mass ratio of 0.075 gcatalyst gfeed−1 provided the best results, since the conversion of the heavy cycle oil (HCO) fraction and of the HDPE offered quite high values (73.1 and 63.9%, respectively) without causing an excessive overcracking in the form of gas products (the yield of gases was of 25%). Moreover, an interesting yield of naphtha (37.0 wt%) with an RON within the commercial standards (92.5) was obtained. With regard to coke formation, not-so-developed structures were formed for a catalyst-to-feed mass ratio of 0.075 gcatalyst gfeed−1, easing their combustion and presumably extending the lifespan of the catalyst.
1. Introduction
The consciousness-raising of citizens about the environmental damage that the excessive use of plastics and especially the mismanagement of waste plastic cause has propelled investments and efforts to recycle plastics in an effective way; that is to say, waste plastic recycling is gaining momentum [1]. Furthermore, the low waste plastic recycling rates (<9% in the USA [2] and about 30% in the EU [3]) and the dissatisfaction that it creates have definitely pushed governments to adopt institutional amendments in order to ameliorate the situation. Among these amendments, the establishment of taxes for the use of virgin plastic, the phase-out of single-use plastic and the efforts in educating the public to minimize the use of plastic, especially the single-use ones, can be highlighted [4]. However, these measures are not enough to attain the sustainable management of waste plastics, and efforts must be focused on improving the current waste plastics recycling technologies and developing new ones.
In this context, chemical recycling technologies could potentially handle waste plastic streams that are currently mismanaged, landfilled or incinerated and produce high-added-value products [5]. Among the main routes for the chemical valorization of waste plastics [6], pyrolysis and gasification stand out given the simplicity of these technologies and their current deployment scale. The former could be used for the direct production of light olefins [7], monomers [8], aromatics [9] and waxes [10], making it highly versatile. In contrast, gasification aims at the production of syngas [11] or directly hydrogen [12] from waste plastics. Nonetheless, the possible industrial implementation of these technologies will require important investments with the high degree of uncertainty that it entails. Hence, the possibility of committing to a fully developed and widespread technology with already depreciated units becomes crucial. In this regard, the concept of waste refineries comes up, which consists of using the industrial units available within the facilities of oil refineries for recycling waste plastics [13]. Among the units available in refineries, fluid catalytic cracking (FCC) and hydrocracking units are the most suitable ones for handling these alternative feeds. However, the fact of handling a solid always implies operational difficulties. Accordingly, blending the waste plastics with a benchmark refinery feedstock, such as vacuum gasoil (VGO) or light cycle oil (LCO), is a strategy that eases the process [14]. Even though the FCC unit is appropriate for handling blended plastics, the hydrocracking unit is by far more versatile, and its production can be easily oriented towards the production of gasoline or diesel by just modifying operation conditions.
Therefore, a proper assessment of the effects that the operation conditions have on the yields and composition of the products is crucial for tuning the hydrocracking process. Thence, the effects of temperature [15], hydrogen pressure [16] and contact time [17] in the hydrocracking of a blend of HDPE and VGO have been already studied, whereas the influence of the catalyst-to-feed ratio remains yet unfaced. Consequently, this work specifically focuses on the effects that this operational parameter has on the yields of products and on the composition of the naphtha and LCO fractions. Moreover, catalyst deactivation has been also assessed, distinguishing between different types of coke, which were attributed to cokes of different nature located on different points of the catalyst. This work closes with a deep study of the operation conditions in the hydrocracking of a HDPE/VGO blend, exposing that the process could be scaled up.
2. Results and Discussion
2.1. Hydrocracking Yields and Conversion
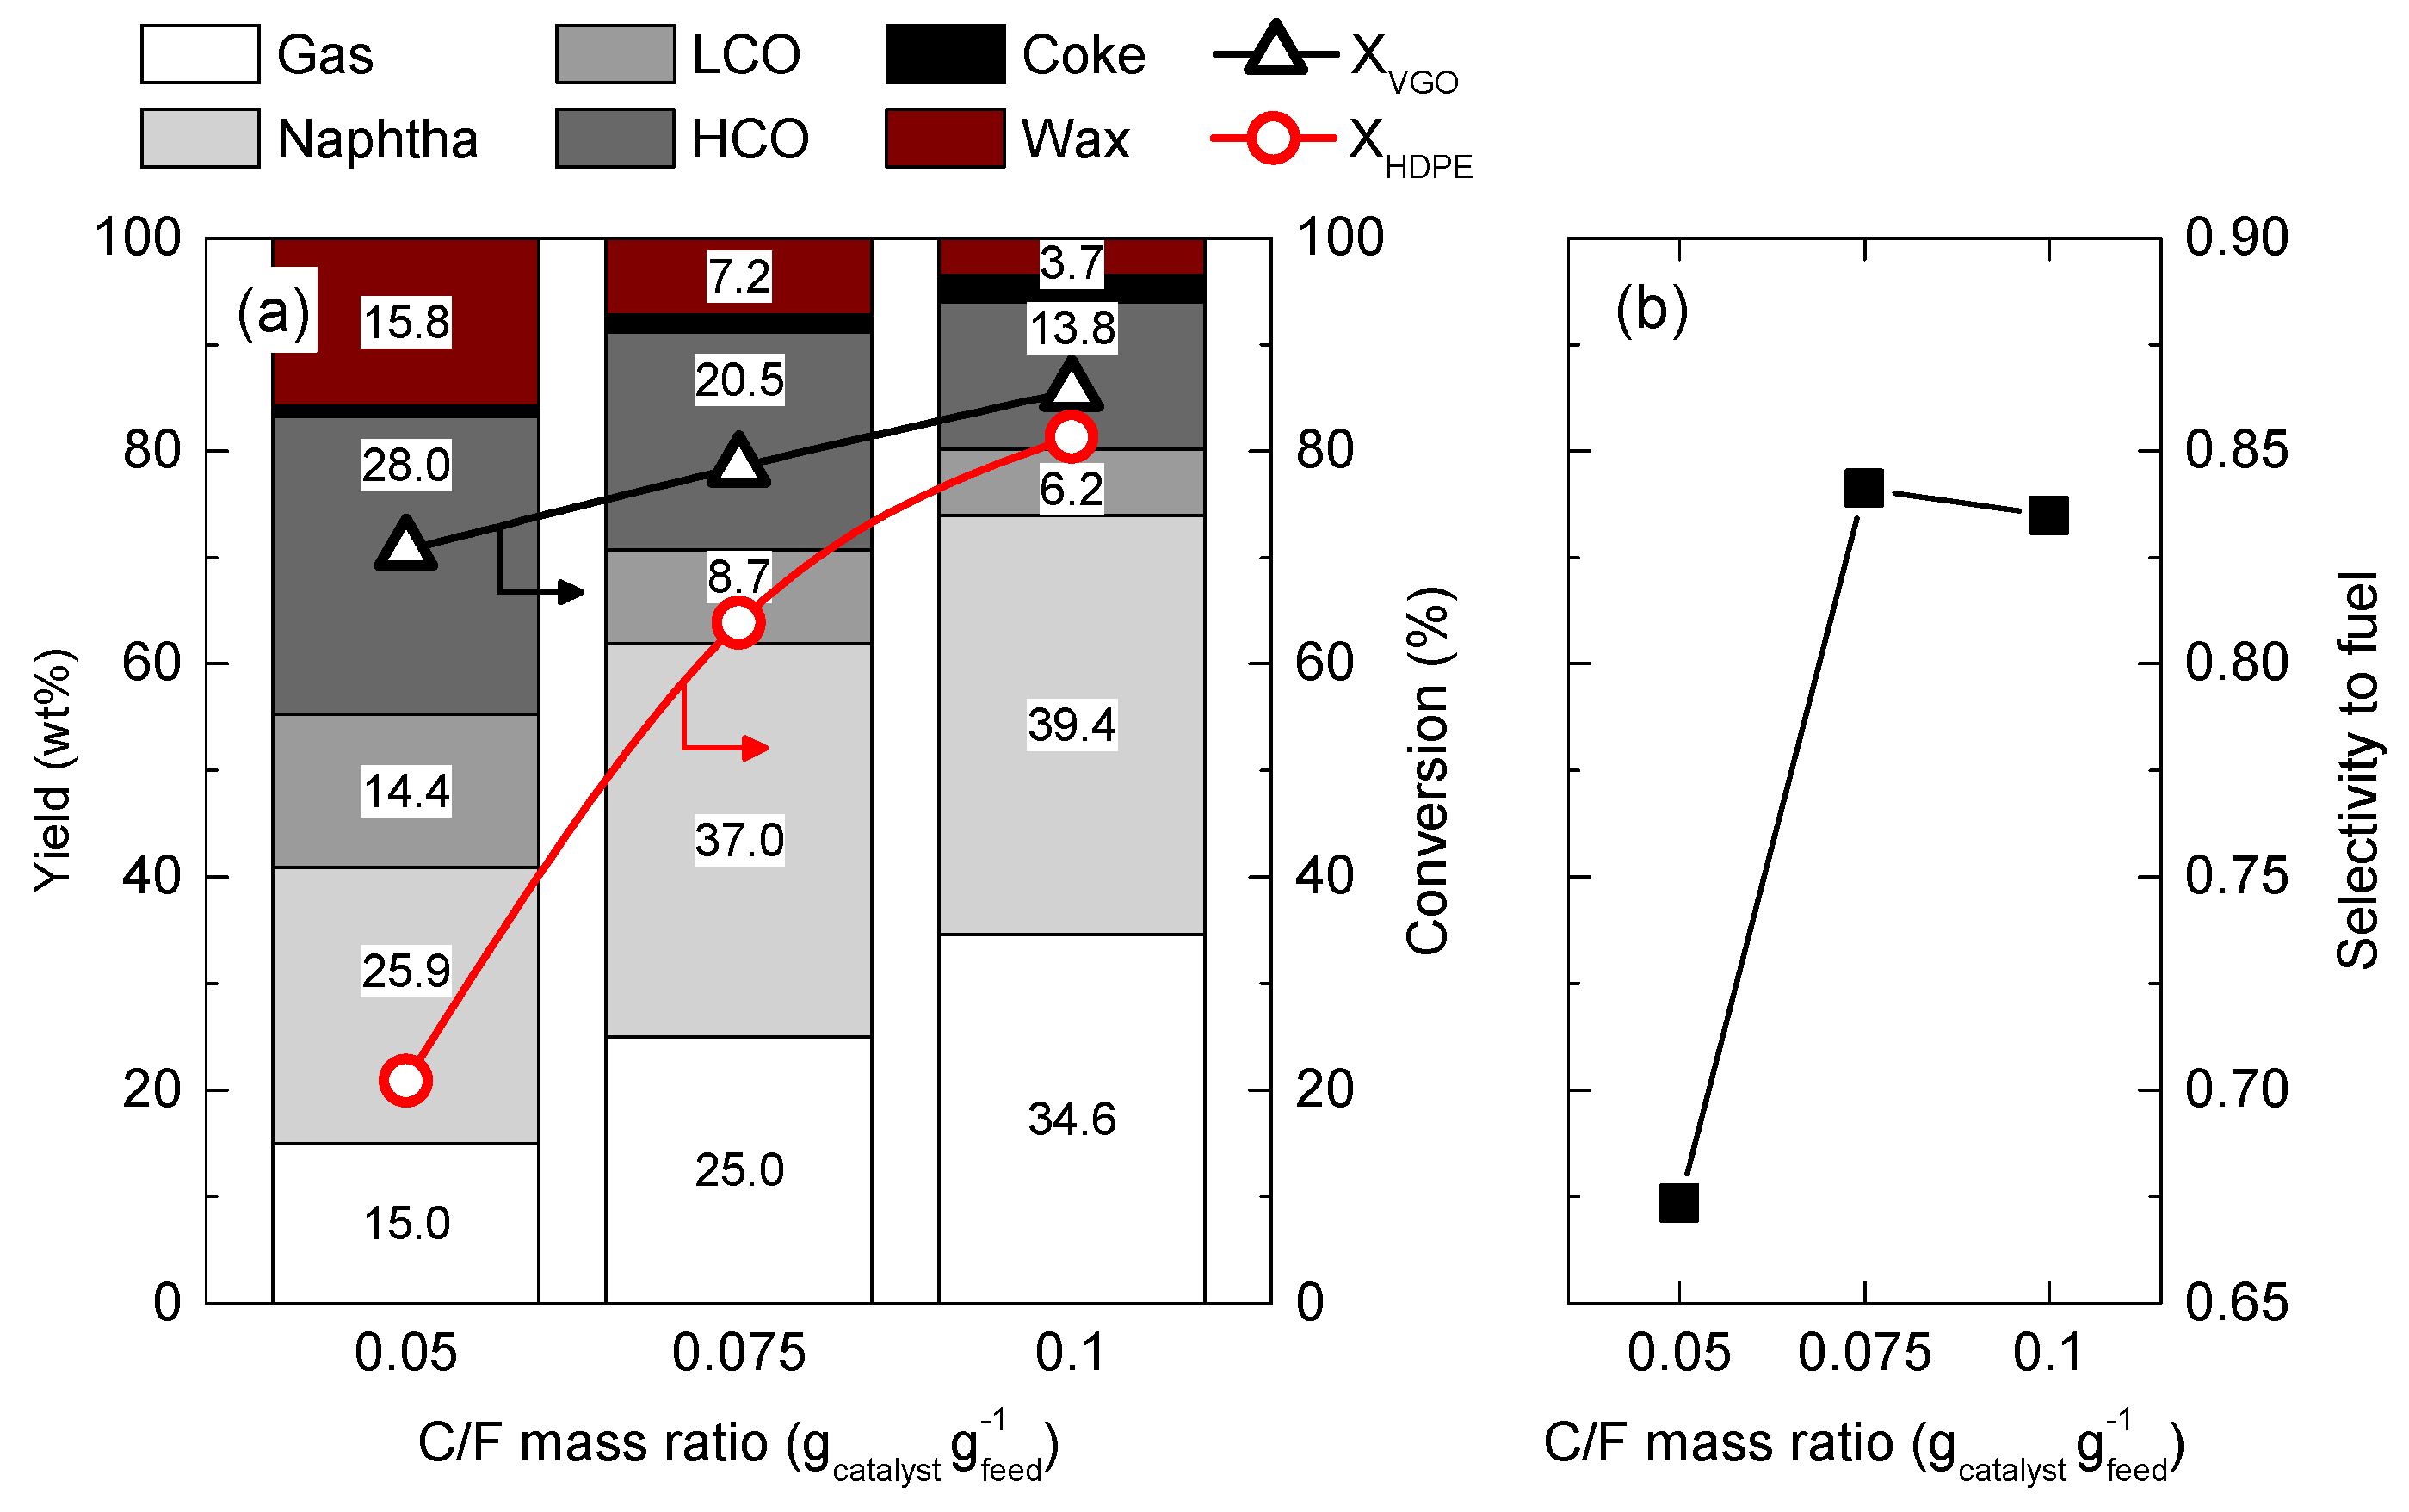
Figure 1a collects the distribution of the yields of products obtained in the hydrocracking of the HDPE/VGO blend for the three different C/F mass ratios, together with the HCO and HDPE conversions attained. Attending to the results obtained for a C/F of 0.05 gcatalyst gfeed−1, it can be seen that an HCO conversion of 70.7% was obtained, which entails a reduction in the content of HCO from 95.4 wt% in the feed to 28.0 wt%. Consequently, the naphtha fraction became the major product (yield of 25.9 wt%), followed by gas and LCO fractions (yields of 15.0 and 14.4 wt%, respectively). However, the HDPE conversion attained remained low at a value of 20.9%.
An increase in the C/F mass ratio up to 0.075 gcatalyst gfeed−1 brought a positive effect on the obtained results due to the greater availability of catalytically active sites. Consequently, both the HCO and HDPE conversions achieved increased notably, especially that of HDPE (63.9%). At the same time, the yield of HCO was reduced to 20.5 wt%, which entails an HCO conversion of 78.5%. Naphtha was the main product with a yield of 37.0 wt%, whereas the yield of the LCO fraction was sharply reduced (8.7 wt%). Nevertheless, the higher catalytic activity also provoked a higher formation of gases (25.0 wt%).
At the highest C/F mass ratio tested (0.1 gcatalyst gfeed−1), the yield of HCO was reduced, reaching a value of 13.8 wt%. This fact pushed the HCO conversion up to 85.6%. Naphtha remained as the main product (yield of 39.4 wt%) but was closely followed by the yield of gases produced (yield of 34.6 wt%). The increase in the C/F mass ratio also improved the HDPE conversion, reaching a very attractive value of 81.3%, which is almost equal to that obtained for the HCO conversion. These results are in good agreement with those previously reported by Uçar et al. [18] in the hydrocracking of a blend composed of low-density polyethylene and heavy VGO.
With regard to the formation of coke, it can be seen that the higher the C/F mass ratio used, the higher the amount of coke deposited on the catalyst. Thus, the yield of coke was of 0.9 wt% for the lowest C/F mass ratio used (0.05 gcatalyst gfeed−1), but it increased up to 2.5 wt% for a C/F mass ratio of 0.1 gcatalyst gfeed−1.
The evolution of the selectivity to fuel index (SF) depicted in Figure 1b summarizes the product distribution obtained. Thus, for a C/F mass ratio of 0.05 gcatalyst gfeed−1, the lowest selectivity to fuel was obtained (0.67). This result may be a direct consequence of (i) the low HDPE conversion (20.9%) and the moderate HCO conversion attained (70.7%); and (ii) the important gas formation (15.0 wt%). An increase in the C/F mass ratio to 0.075 gcatalyst gfeed−1 increased the selectivity to fuel to 0.84, exposing that the increase in the yield of naphtha contributed to increasing this index. However, a further increase up to 0.1 gcatalyst gfeed−1 did not entail a higher selectivity to fuel; it remained almost constant at a value of 0.83. Therefore, the higher yield of naphtha produced was counterbalanced by the gas formation and did not have a positive effect in the formation of the fractions of interest.
In order to assess the effects of the addition of the HDPE to the hydrocracking units, the results have been compared with those previously reported about the hydrocracking of neat VGO for a C/F mass ratio of 0.1 gcatalyst gfeed−1 [15]. In this regard, the HCO conversion was 91.7%, slightly higher than the one obtained for the HDPE/VGO blend (85.6%). The distribution of yields was more influenced by the addition of the HDPE, since the gas formation increased from 22.5 to 34.6 wt%, and the yield of the naphtha fraction was reduced from 59.6 to 39.4 wt%. Therefore, the addition of the HDPE modified the distribution of products since the macromolecules of HDPE react faster than the bulky polyaromatics compounds within the VGO, leading to a superior formation of gas products. Furthermore, the existence of possible synergistic effects derived from the role of dissolved HDPE macromolecules acting as hydrogen donors must be also considered. This fact was ratified with the selectivity to fuel index obtained for the VGO (2.12) that is considerably higher than that of the HDPE/VGO blend (0.83). One should note that this value is importantly affected by the conversion level attained.
2.2. Characterization of the Gas Fraction
Figure 2 displays how the composition of the gas fraction evolved with the C/F mass ratio. As it can be seen, this fraction was composed of light paraffins composed of hydrocarbons between one and four carbon atoms: methane, ethane, propane, n-butane and iso-butane. One should note that no light olefins were detected in this fraction because they are easily saturated under the tested operation conditions. By splitting the gas fraction into dry gas (C1 and C2 compounds) and liquefied petroleum gases (LPG, C3 and C4 compounds), the concentration of the latter was by far predominant as it reached values above 70 wt% for all the C/F mass ratios studied.
For a C/F mass ratio of 0.05 gcatalyst gfeed−1, the concentration of dry gas accounted for 30.2 wt%, with the concentration of ethane higher than that of methane (17.1 vs. 13.1 wt%, respectively). On the other hand, LPGs were composed of 26.7 wt% propane, 26.2 wt% iso-butane and 16.9 wt% n-butane. A similar composition of the gas fraction was reported by Metecan et al. [19] in the hydrocracking of a blend of polyolefin plastics (HDPE, LDPE and PP). When the C/F mass ratio was increased, a marked overall trend was observed. In this regard, the concentration of dry gas decreased in contrast to that of LPG, reaching values of 26.6 wt% and 73.4 wt%, respectively. With regard to the individual components, it can be seen that the concentration of methane was reduced, while that of ethane remained almost constant. Attending to the components of the LPG fraction, the concentration of propane was notably increased since it went from a value of 26.7 wt% for a C/F mass ratio of 0.05 gcatalyst gfeed−1 to a value of 52.2 wt% for a C/F mass ratio of 0.1 gcatalyst gfeed−1. This trend can be a consequence of the promotion of the over-cracking reactions that lead to an increase in the concentration of the C1–C3 products, with that of propane being especially remarkable. Furthermore, the concentration of iso-butane went from 26.2 wt% for a C/F mass ratio of 0.05 gcatalyst gfeed−1 to 13.1 wt% for a C/F mass ratio of 0.1 gcatalyst gfeed−1. Thus, it can be deduced that the mechanism that governs gas formation is the protolytic cracking instead of β-scission reactions.
The composition of the gas fraction was quite similar to that obtained in the hydrocracking of neat VGO for a C/F mass ratio of 0.1 gcatalyst gfeed−1 [15]. In that case, the yield of dry gas was slightly lower (24.3 wt% vs. 26.6 wt%), thus being higher that of LPG (75.7 wt% vs. 73.4 wt%) but without the difference between them being so remarkable. With regard to individual components, propane was also the compound with the highest yield (50.4 wt%), which was slightly lower than the one obtained with the HDPE/VGO blend (52.2 wt%).
2.3. Characterization of the Naphtha and LCO Fractions
Since the fractions of interest in hydrocracking processes are both naphtha and LCO fractions, which can be respectively assimilable by gasoline and diesel fractions of refineries, they have been analyzed in detail. Thus, the PIANO composition of these fractions for the tested C/F mass ratios is depicted in Figure 3. Focusing on the PIANO composition of the naphtha fraction (Figure 3a) in the first place, it can be seen that it is mainly aliphatic independently of the value of the C/F mass ratio. Indeed, the less aliphatic one is that obtained for a C/F mass ratio of 0.1 gcatalyst gfeed−1 (49.6 wt% of aliphatics). Attending to the distribution of n- and iso-paraffins, there is a clear predominance of the ramified ones, even though their concentration decreased with the C/F mass ratio and went from 30.2 to 21.3 wt% for an increase in the C/F mass ratio from 0.05 to 0.1 gcatalyst gfeed−1. Moreover, the concentration of linear paraffins also decreased, leading to an increase in the naphthenes that reached their maximum concentration (20.3 wt%) at 0.1 gcatalyst gfeed−1. On the other hand, the concentration of aromatics increased with the C/F mass ratio, and the maximum value of 50.4 wt% was obtained at 0.1 gcat gfeed−1. However, the aromatic fraction was mainly composed of monoaromatics, the concentration of diaromatics being inferior to 4 wt% independently of the C/F mass ratio used. Furthermore, the concentration of monoaromatics increased with the C/F mass ratio, while that of the diaromatics decreased. This result is directly related to the hydrodearomatization (HDA) of the heavy and bulky aromatics from the LCO and HCO fractions of the VGO [20]. Thus, the HDA of those high-molecular-weight molecules led to the formation of partially hydrogenated molecules within the naphtha fraction, such as tetralin-like compounds. Moreover, it should be taken into account that the formation of aromatics from the HDPE macromolecules is very unlikely to occur.
It must be also taken into account that two additional routes could have led to the formation of light aromatic compounds: (i) the cyclization of the olefins that are formed as a consequence of the cracking reactions; and (ii) the hydrogen transfer reactions that may occur within the naphthenes. Even though the aforementioned routes could occur within the narrower pores of the zeolite, their contribution to the reaction is not expected to be crucial. Nonetheless, considering the high concentration of monoaromatics in the naphtha fraction (Figure 3a), they must be also contemplated. Therefore, these reactions together with the HDA route are likely to promote the production of benzene, toluene, xylenes (BTX) and alkylbenzenes. This assumption was correlated by analyzing the aromatics present in the naphtha fraction. In this regard, the concentration of BTX increased with the C/F mass ratio from a value of 20.6 wt% for a C/F mass ratio of 0.05 gcatalyst gfeed−1 to a value of 29.2 wt% for a C/F mass ratio of 0.1 gcatalyst gfeed−1.
In order to fully characterize the naphtha fraction, the research octane number (RON) was computed for the different C/F mass ratios. To calculate it, the method developed by Anderson et al. [21], which is based on chromatographic results, was used. At the lowest C/F mass ratio (0.05 gcatalyst gfeed−1), an RON of 94 was obtained, which is a value very similar to the one required by commercial gasoline (95). This result is mainly based on the high concentration of ramified paraffins that undoubtedly boosted it. However, an increase in the C/F mass ratio up to 0.075 gcatalyst gfeed−1 brought a detriment in the RON (92.5), which continued decreasing (92.3) for the highest C/F mass ratio (0.1 gcatalyst gfeed−1). Therefore, these naphtha fractions may require to be submitted to a catalytic reforming stage to adapt their composition and be suitable for being used in the blending of commercial gasoline.
In the hydrocracking of neat VGO with a C/F mass ratio of 0.1 gcatalyst gfeed−1 [15], the naphtha fraction obtained was less aromatic (32.3 wt%) than the one obtained with the blend (50.4 wt%). These results exposed that the HDPE macromolecules interfered in the access of the molecules within the VGO to the active sites of the catalyst, thus affecting its performance. Therefore, it can be concluded that a certain degree of fouling may be caused by the degraded HDPE macromolecules that occlude the channels of the zeolite.
Focusing on the PIANO composition of the LCO fraction (Figure 3b), it can be seen that it is highly influenced by the C/F mass ratio used. The lowest C/F mass ratio (0.05 gcatalyst gfeed−1) produced an almost balanced composition between aliphatics and aromatics (49.5 and 50.5 wt%, respectively). Attending to paraffins distribution, the concentration of iso-paraffins exceeded to large extent in contrast to that of n-paraffins (38.7 wt% vs. 10.7 wt%, respectively). Likewise, diaromatics are the main compounds in the aromatics fraction (38.3 wt%), with that of mono- and polyaromatics substantially being smaller (7.5 and 4.7 wt%, respectively). An increase in the C/F mass ratio brought an increase in the paraffins and a subsequent decrease in the aromatics. Particularly, for a C/F mass ratio of 0.1 gcatalyst gfeed−1, paraffins accounted for more than 70 wt% of the compounds in the LCO fraction, where iso-paraffins predominated over n-paraffins (52.4 vs. 18.1 wt%, respectively). Consequently, the concentration of aromatics decreased notably, especially that of diaromatics (22.9 wt%). One should note also that the family of naphthenes has not been included in the results depicted in Figure 3b, since its concentration was negligible (<1 wt%) and independent of the C/F mass ratio tested.
Hence, according to these last results, it can be concluded that an increase in the C/F mass ratio resulted in (i) a promotion of the HDA capability to saturate (at least partially) the aromatics within the LCO fraction, resulting in an important reduction in the aromatics within this fraction; and (ii) a bigger amount of acidic sites becoming available, especially on the outside of zeolite crystals, for the cracking of the HDPE molecules to hydrocarbons within the LCO fraction [22].
Finally, the cetane index of the LCO fraction has been also calculated in order to obtain a full picture of the quality of this fraction. Cetane indexes were determined according to the procedure explained on the ASTM D4737 Standard. There is a marked and clear effect of the C/F mass ratio on the values of the cetane index obtained, which are a consequence of the aforementioned changes in the composition of the LCO fraction. The lower the concentration of aromatics, especially polyaromatics, in the LCO fraction, the higher the cetane index will be [23]. Thus, the cetane index increased with the C/F mass ratio, and values of 40.5, 44.7 and 54.9 were obtained for 0.05, 0.075 and 0.1 gcatalyst gfeed−1, respectively. These values are high enough for LCO to be suitable for being used in the blending of commercial diesel in refineries.
In contrast to the results obtained for the naphtha fraction, these ones improved those obtained in the hydrocracking of neat VGO with a C/F mass ratio of 0.1 gcatalyst gfeed−1 [15]. In this regard, the LCO fraction obtained from the neat VGO was more aromatic (36.2 wt%) that the LCO fraction of the blend (29.4 wt%). This result drives to conclude that the HDPE macromolecules are decomposed into long aliphatic compounds with a boiling point within the range of the LCO fraction.
2.4. Characterization of the Coke
The spent catalysts were analyzed via TPO analysis in order to obtain information about the nature and location of the coke deposited on each case. The obtained results are collected in Figure 4, where the effects that the C/F mass ratio has on the formation of this carbonaceous deposit can be seen. Attending to the shape of the TPO profiles, it can be seen that they are quite wide and that their deconvolution was encouraged to really assess the contribution of the different types of coke [24]. Thus, three different types of coke were distinguished. Coke type I, which burns at the lowest temperature range (375–435 °C) was attributed to amorphous coke with high H/C ratios [25] that presumably was deposited on the outside of catalyst particles and was mainly composed of partially degraded HDPE molecules [26]. Coke type II was composed of more developed structures (lower H/C ratio) and was mainly located in the mesopores of the zeolite, but it could be also formed in the micropores. This type of coke burnt at intermediate temperatures (435–490 °C). Finally, coke type III is ascribed to highly condensed aromatic structures (very low H/C ratio). These structures are formed within the crystalline channels of the zeolite by means of condensation and hydrogen transfer reactions that take place on the inner acidic sites of the zeolite [27]. Due to its internal location and the possible partial blocking of the micropores that it could create, the combustion of this last type of coke can be affected by diffusional restrictions. Hence, higher temperatures were required for combusting this type III of coke (490–540 °C).
For the C/F mass ratios of 0.05 and 0.075 gcatalyst gfeed−1, the TPO profiles were deconvoluted into two different peaks, meaning that just coke type I and type II were found on these samples. However, comparing the peaks of both samples, it can be seen that those obtained for a C/F mass ratio of 0.075 gcatalyst gfeed−1 shifted towards higher temperatures. In this regard, the combustion of the coke of this sample was composed of structures with a higher condensation degree, and higher temperatures were required for burning them. At the highest C/F mass ratio (0.1 gcatalyst gfeed−1), three peaks were required for deconvoluting the TPO profile. So, in this third sample, the aforementioned three types of coke were detected. Moreover, this third profile was shifted towards even higher temperatures than those required for burning the sample obtained at 0.075 gcatalyst gfeed−1. Therefore, an increase in the C/F mass ratio augmented the acidic sites available for cracking molecules but also their availability for condensing the coke precursors, obtaining more condensed structures.
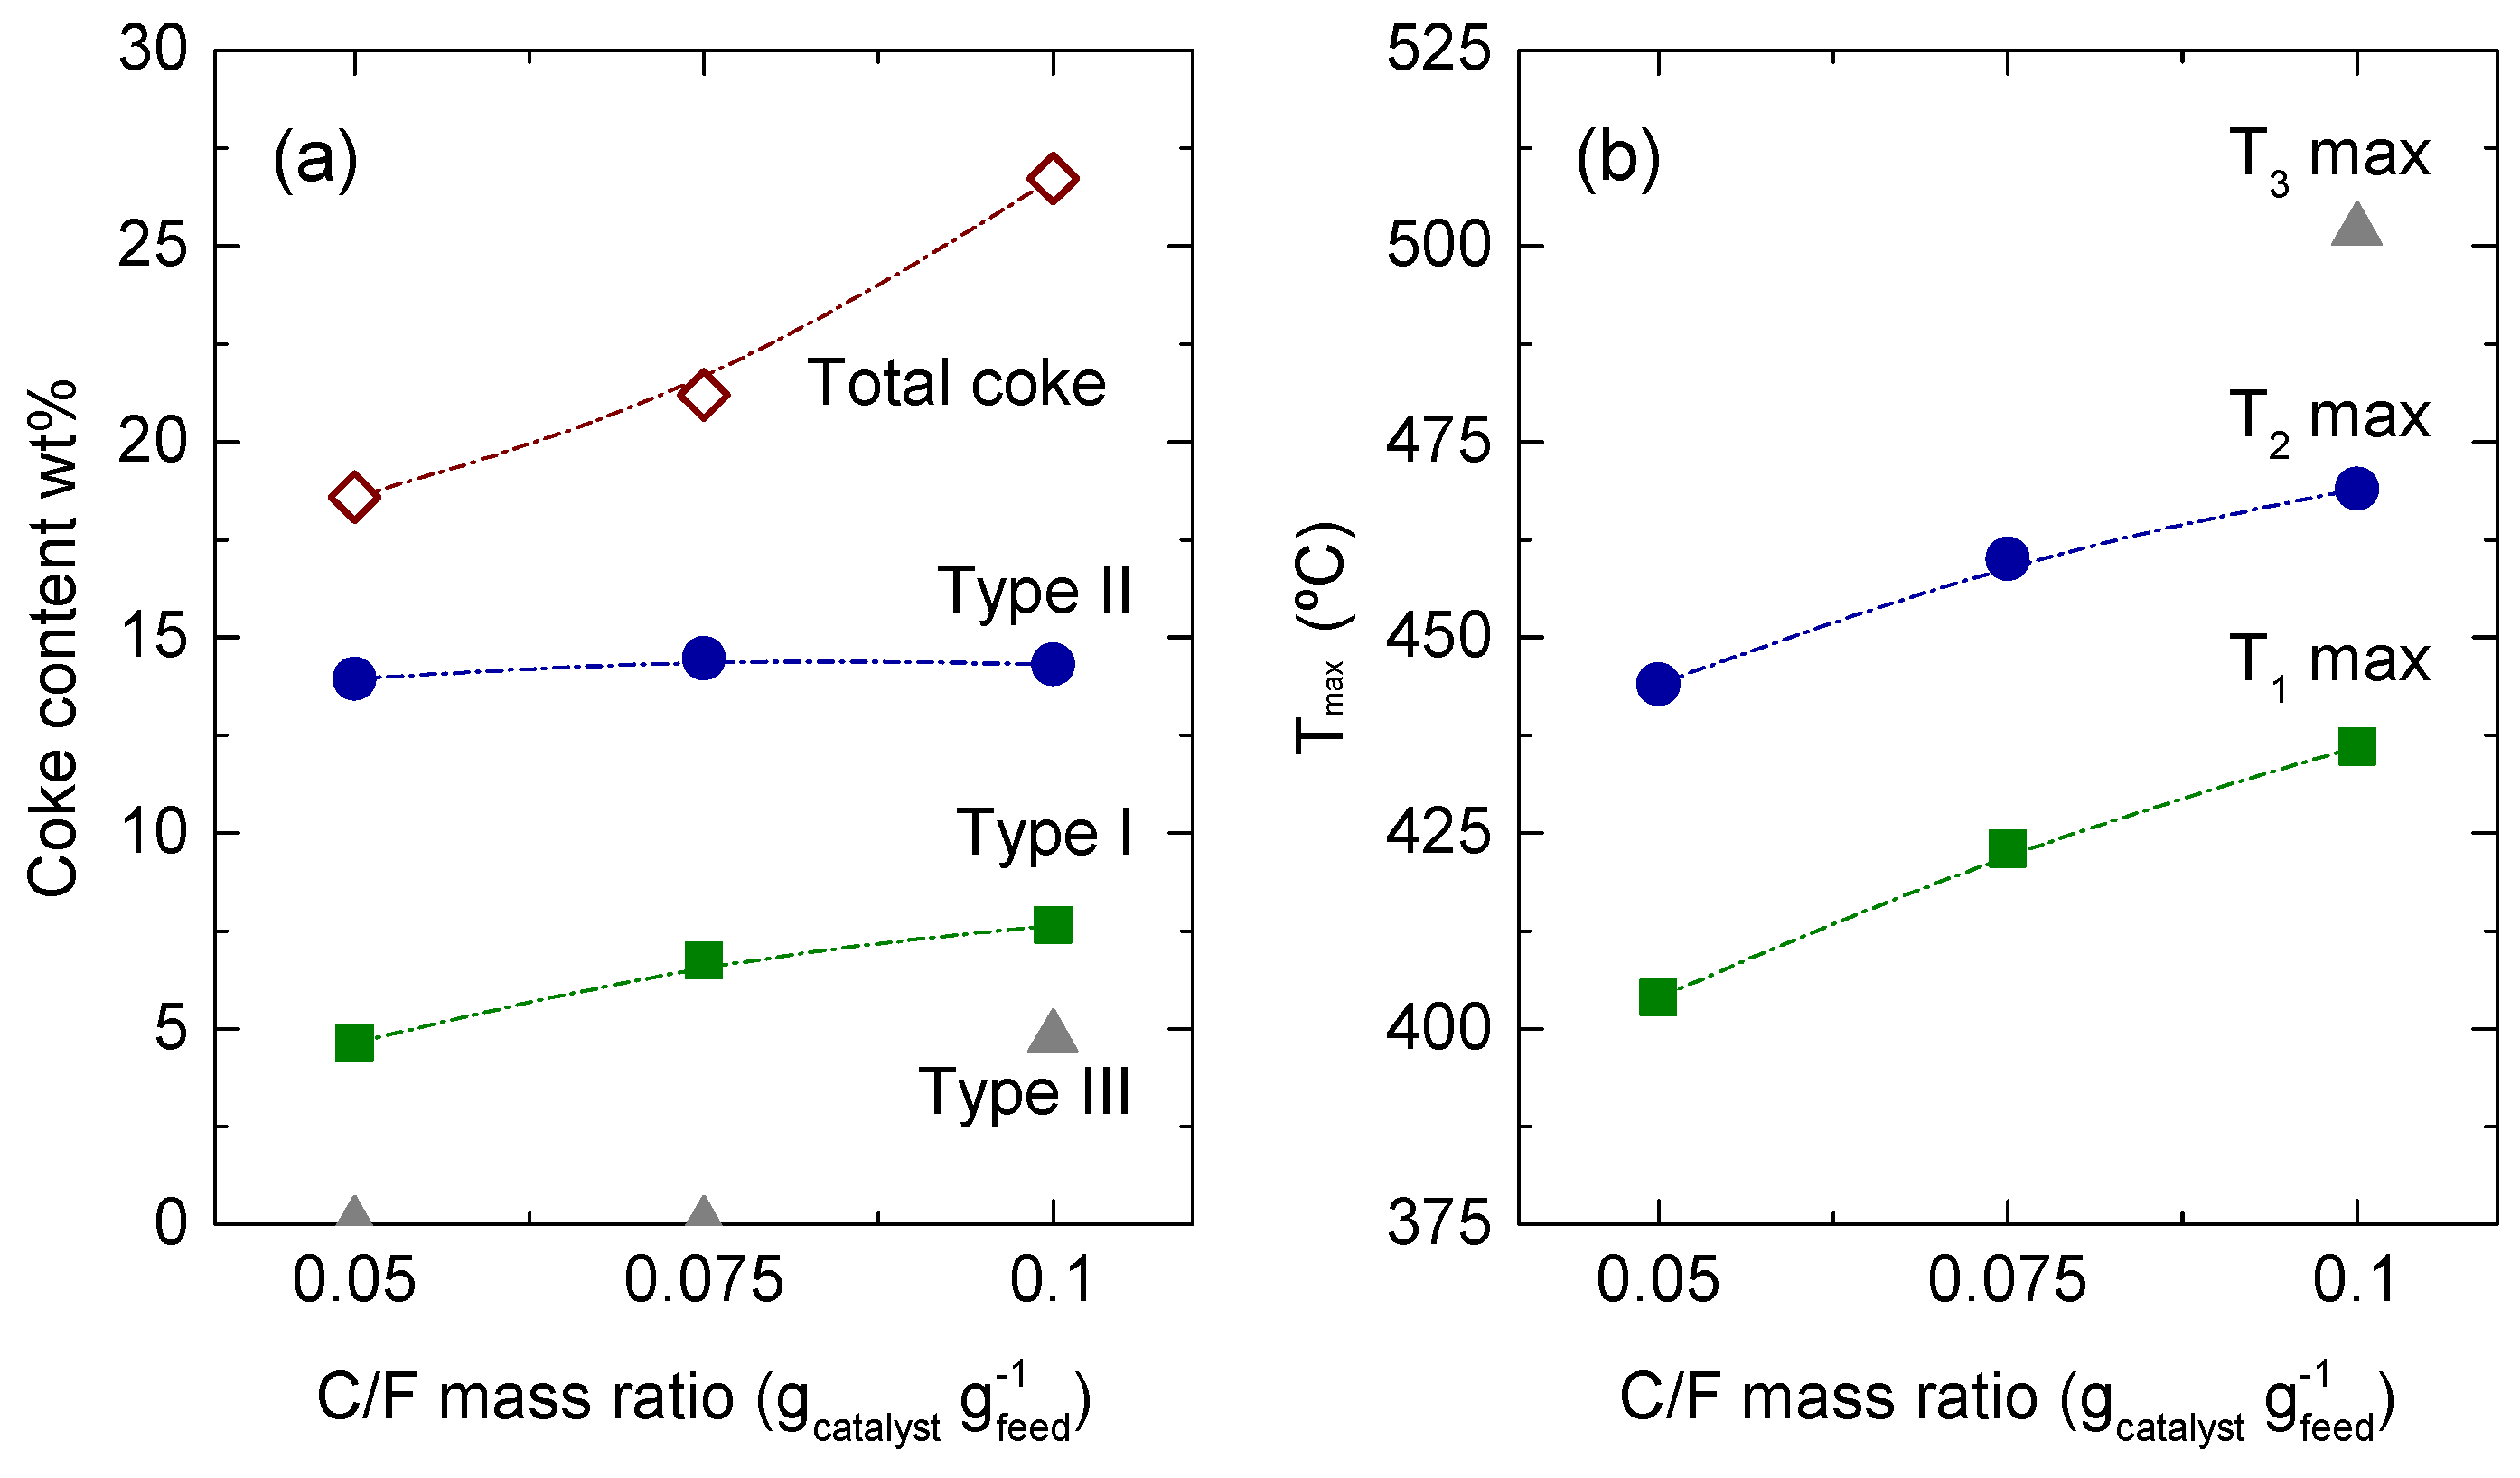
The results obtained from the deconvolution of the TPO profiles are summarized in Figure 5. In this figure, the following can be found: (i) the total amounts of coke formed for each C/F mass ratio together with the contribution of each type of coke (Figure 5a); and (ii) the maximum temperature at which each type of coke burnt (Figure 5b). With regard to the amount of coke, the C/F mass ratio had an important effect on coke formation. Hence, the higher the C/F mass ratio, the higher the amount of coke produced. It increased from 18.6 to 26.7 wt% when increasing the C/F mass ratio from 0.05 to 0.1 gcatalyst gfeed−1. Regarding coke distribution, an increase in the C/F mass ratio caused an increase in both types of coke, the increasing rate of coke type I being higher. In this regard, at 0.05 gcatalyst gfeed−1, the content of coke type I and II was 4.6 and 13.9 wt%, respectively, whereas the values obtained at 0.075 gcatalyst gfeed−1 were 6.7 and 14.5 wt%, respectively. However, as explained before, the maximum combustion temperature of each peak increased, resulting in more complex coke structures. At the highest C/F mass ratio (0.1 gcatalyst gfeed−1), the trends followed by the types of coke were similar, with the exception that coke type III was also detected. This fact meant that coke type II was capable of developing to a greater extent, leading to more condensed structures and causing its splitting into two different types of coke (coke type II and type III). In this regard, coke type I increased to a value of 7.6 wt%, while coke type II slightly decreased down to 14.3 wt%. Finally, the amount of coke III formed was 4.8 wt%.
Attending to the results collected in Figure 4 and Figure 5, the content of coke and the development degree increased with the C/F mass ratio. A greater amount of catalysts implied an enhancement of the catalytic reactions, leaving the role of thermal reactions in second place. Furthermore, the formation of coke precursors and their subsequent condensation that lead to the formation of coke were also boosted with the C/F mass ratio. Similar results were previously reported by Wang et al. [28] in the hydroprocessing of vacuum residue. They observed that thermal reactions produced smaller amounts of coke and that the coke formed through this mechanism was less developed (higher H/C ratio) than the coke produced by catalytic means. This fact is a consequence of the lack of reaction of the polyaromatics within the VGO that tended to produce bulky but poorly developed agglomerates on the external surface of the catalyst. However, when those polyaromatics were hydrocracked, leading to the production of smaller and lighter compounds, both aliphatics and aromatics could enter into the inner channels of the zeolite. There, they were condensed into complex polyaromatics molecules than ended up forming coke, which requires high temperatures to be burnt because of its condensation degree and its location in the inner channels of the zeolite.
3. Materials and Methods
3.1. Feeds
The vacuum gasoil (VGO), kindly provided by Petronor Refinery (Muskiz, Spain), consisted of a mixture of different secondary refinery streams. Even though it was mainly composed of the gasoil produced in the vacuum distillation column, certain amounts of gasoils produced in the visbreaking and coking units were also used in its formulation. In addition, it was prehydrotreated within refinery facilities, importantly affecting their physicochemical properties and composition, as it can be seen in Table S1. In short, it consisted on a low-sulfur-containing (510 ppm) and highly aromatic (50.7 wt%) stream with a boiling range of 156–519 °C.
The high-density polyethylene (HDPE) was purchased from Dow Chemical (Tarragona, Spain). Its main physicochemical properties are also collected in Table S1. Some of them, i.e., average molecular weight, density and dispersity, were directly provided by the supplier, whereas higher heating values were determined according to Dulong formula from the results obtained in the elemental analysis.
3.2. Catalyst
A Pt-Pd catalyst supported on a HY zeolite was used for the study since it offers proper catalytic behavior in hydrocracking processes [15]. It was in-house prepared following a well-established procedure [16]. In short, metals were incorporated to the support via ion exchanges followed by wet impregnation. Afterwards, it was dried and air calcined, before being sieved and tableted to the desired particle size (150–300 μm).
The catalyst contained a 1.19 wt% Pt and a 0.53 wt% Pd, according to ICP-AES analysis. The textural properties of the catalysts were measured via N2 adsorption–desorption isotherms, resulting in a specific surface area of 620 m2 g−1 and an average pore diameter of 84 Å. The acidic properties of the catalyst were measured via tert-butylamine-TPD and pyridine FTIR. From these analyses, a total acidity of 1.69 mmolt-ba g−1 and a Brønsted/Lewis acidic sites ratio of 1.53 were obtained, respectively. A more detailed explanation of the methods and procedures used for measuring these properties together with a more detailed characterization of the catalyst can be found elsewhere [17].
3.3. Hydrocracking Unit and Reaction Conditions
The reactions were performed in a 100 mL stainless steel semi-batch reactor (Parker Autoclave Engineers, Erie, PA, USA). A schematic representation of the setup is provided in Figure S1. The experiments were carried out in a semi-continuous regime, while the VGO and the HDPE were loaded at the beginning of the reaction; hydrogen was continuously fed to the reactor in order to ensure that the total pressure remained constant the whole time. A detailed explanation about the experimental procedure was already provided in a previous work [15].
Since the aim of the work was to study the effects of the catalyst-to-feed (C/F) mass ratio, the following values were tested: 0.05, 0.075 and 0.1 gcatalyst gfeed−1. The rest of the operating conditions were kept constant at 420 °C, 80 bar and 120 min since these values were established, by means of a kinetic model [29], as the optimal ones to maximize the production of the naphtha fraction. The reactor vessel was loaded with a total mass of feed of 40 g, with a HDPE-to-VGO ratio of 0.2 gHDPE gVGO−1. Furthermore, a vigorous stirring rate was used (1300 rpm) to ensure a good mixture of the phases.
At the end of the reaction, the reactor was cooled down following a heating rate of 20 °C min−1 using an open water system. The gases were collected in a sampling bag and analyzed via gas chromatography. The liquids were separated following the solvent fractionation method summarized in Figure S2. The first extraction was carried using THF as the solvent, obtaining a fraction soluble in THF that was composed of hydrocarbons and another insoluble fraction where both the wax and the catalyst remained. Afterwards, xylene was used as the solvent agent of the second extraction to separate the wax (unconverted and degraded HDPE) and the catalyst.
3.4. Analysis of the Products
The hydrocracking of the HDPE/VGO blend led to the formation of both gas and liquid products. The gases were collected from the reactor in a sampling bag once the reaction time elapsed. They were analyzed in an Agilent Technologies 6890 GC system equipped with an FID detector and an HP-PONA capillary column (50 m × 0.2 mm × 0.5 μm). To ensure the proper separation and detection of the lighter products, cryogenic temperatures (down to −30 °C) were used in the analysis. On the basis of the results obtained, the gaseous products were lumped into two different fractions: dry gas composed of C1–C2 compounds and liquefied petroleum gases (LPG) for the C3–C4 compounds.
For a proper characterization of the liquid products, they were submitted to two different analyses. Firstly, a simulated distillation analysis allowed us to lump the liquids into naphtha (C5–C12 compounds), light cycle oil (LCO, C13–C22 compounds) and heavy cycle oil (HCO, C23+ compounds). It was developed according to the procedure described in the ASTM D2887 Standard, using an Agilent Technologies 6890 GC (Santa Clara, CA, USA) system equipped with an FID detector and a DB-2887 semi-capillary column (10 m × 0.53 mm × 3 μm). Secondly, a bi-dimensional gas chromatography analysis was used for determining the PIANO composition: (i) n- paraffins (n-P); (ii) iso-paraffins (i-P); (iii) monoaromatics (A1); (iv) diaromatics (A2); (v) polyaromatics (A3+); (vi) naphthenes (N); and (vii) olefins (O). The apparatus was an Agilent Technologies 7890A Series GC system connected in line with an Agilent 5975C Series GC/MSD mass spectrometer. Furthermore, it was equipped with an FID detector and two capillary columns of different polarity connected by means of a flow modulator. The first column was a non-polar DB-5MS (30 m × 0.25 mm × 0.25 μm), whereas the second one was a polar TRB-50 HT (5 m × 0.25 mm × 0.1 μm).
As a byproduct of the hydrocracking reactions, carbonaceous deposits, commonly known as coke, were formed on the catalyst. For characterizing the coke, the spent catalyst was submitted to TPO analysis, gathering information about the location and nature of the coke. Coke combustion was carried out in a TA Instruments TGA-Q 5000 (New Castle, DE, USA) thermobalance, reaching temperatures of 550 °C to ensure the total removal of these deposits.
3.5. Reaction Indices
To analyze the extent of the reactions, different reaction indices were defined. Firstly, two different conversion indices were used depending on the part of the feed to which they relate
with (mHCO)initial and (mHCO)final representing the mass of the HCO fraction in the feed and in the products, respectively and (mHDPE)initial and (mHDPE)final representing the amount of HDPE fed and the unconverted HDPE, respectively.
Secondly, the yield of each lump (Yi) was calculated according to the following expression:
where mi is the mass of fraction i and the term in the denominator the total mass initially fed to the reactor.
Thirdly, the selectivity to fuels (SF) parameter was computed to assess the formation of the naphtha and LCO fractions [30]:
with YNaphtha, YLCO, YGas, YHCO, YWax and YCoke representing the yields of naphtha, LCO, gas, HCO, unconverted HDPE and coke, respectively.
4. Conclusions
The catalyst-to-feed mass ratio resulted in an important operating variable that affected the products distribution and their composition. Within the range of values tested (0.05–0.1 gcatalyst gfeed−1), initially, an increase in the catalyst-to-feed mas ratio favored the both the conversion of the heaviest molecules of the VGO and of the HDPE macromolecules, reaching the maximum values of 85.6 and 81.3%, respectively. Moreover, the yield of naphtha was maximized (39.4 wt%) at the expense of that of LCO (6.2 wt%). However, the naphtha fraction was highly aromatic (50.4 wt%), and an excessive formation of gases was obtained (34.6 wt%).
Therefore, operating at a catalyst-to-feed mass ratio of 0.075 gcatalyst gfeed−1 appears as a better option, even though the yield of naphtha and the conversion levels obtained were not so high. In this regard, the yield of naphtha was 37.0 wt%, with a lower content of aromatics on it (48.4 wt%). Moreover, a lower gas formation was obtained (25.0 wt%), increasing in turn the yield of LCO (8.7 wt%). A further reduction in the catalyst-to-feed mass ratio to 0.05 gcatalyst gfeed−1 reduced, to a further extent, the formation of gases (15.0 wt%), as well as the yield of the naphtha fraction (25.9 wt%). However, for such a low catalyst-to-feed mass ratio, the conversion values reached were low, especially that of HDPE (20.9%).
The amount of coke deposited on the catalyst increased with the catalyst-to-feed mass ratio from 18.6 to 26.7 wt%. Therefore, it was notably affected by the catalyst-to-feed mass ratio used. Moreover, at 0.05 and 0.075 gcatalyst gfeed−1, just two types of coke were detected that were attributed to the coke deposited on the external surface of the catalyst and on the external pores of the zeolite, respectively. Nevertheless, for the 0.1 gcatalyst gfeed−1, a third type of coke was detected, formed by highly developed structures, that was located on the inside of the micropores of the zeolite. Therefore, the coke formed with the highest value tested required higher temperatures to be burnt, temperatures that could affect more severely the physicochemical properties of the catalyst. In contrast, the coke produced at 0.075 gcatalyst gfeed−1 did not require such high temperatures. This fact could probably extend the lifespan of the catalyst when operating at an industrial scale.
Even though the addition of the HDPE worsened the results obtained in the hydrocracking of neat VGO, the quality of the naphtha and LCO fractions obtained with the blend is high enough to be used by oil refineries. Therefore, the results are promising for continuing to develop the waste refinery strategy and the possible scale-up of the strategy in order to manage waste plastic on a large scale. However, the results obtained in this work correspond to a first attempt of managing solid plastics by hydrocracking them blended with secondary refinery feeds. Therefore, more research is required using a continuous experimental unit and operating in conditions closer to those used industrially (especially higher hydrogen pressures) to guarantee the possibility of being implemented in refineries. To conclude, this strategy appears as the optimal one for being implemented in the short–mid term.
Supplementary Materials
The following supporting information can be downloaded at: https://www.mdpi.com/article/10.3390/catal14030203/s1, Figure S1: Schematic representation of the hydrocracking unit; Figure S2: Solvent fractionation method followed; Table S1: Properties of vacuum gas oil (VGO) and high-density polyethylene (HDPE).
Author Contributions
Conceptualization, R.P., J.B., J.M.A. and A.G.; formal analysis, F.J.V., R.P., J.B., J.M.A. and A.G.; investigation, methodology, and data curation, F.J.V., R.P. and A.G.; writing—original draft preparation, F.J.V., R.P. and A.G.; writing—review and editing, R.P., J.B., J.M.A. and A.G.; supervision, project administration, and funding acquisition, J.B., J.M.A. and A.G. All authors have read and agreed to the published version of the manuscript.
Funding
This work has been carried out with the following financial support: (i) grant PID2021-125255OB-I00 funded by MCIN/AEI/10.13039/501100011033 and by “ERDF A way of making Europe”; (ii) the European Union’s Horizon 2020 research and innovation program under the Marie Skłodowska-Curie Actions (grant No 823745); and (iii) the Basque Government (grant IT1645-22).
Data Availability Statement
Data is unavailable due to privacy or ethical restrictions.
Acknowledgments
The authors offer thanks for the technical and human support provided by SGIker of UPV/EHU and European funding (ERDF and ESF). The authors also acknowledge Petronor Refinery S.A. for providing the vacuum gasoil (VGO) used in this work.
Conflicts of Interest
The authors declare no conflicts of interest.
Nomenclature
| A1 | Monoaromatics |
| A2 | Diaromatics |
| A3+ | Polyaromatics |
| BTX | Benzene, toluene and xylenes |
| C/F | Catalyst-to-feed mass ratio, gcatalyst gfeed−1 |
| FCC | Fluid catalytic cracking |
| FID | Flame ionization detector |
| FTIR | Fourier-transform infrared spectroscopy |
| HCO | Heavy cycle oil |
| HDA | Hydrodearomatization |
| HDPE | High-density polyethylene |
| ICP-AES | Inductively coupled plasma atomic emission spectroscopy |
| i-P | Iso-paraffins |
| LCO | Light cycle oil |
| LDPE | Light-density polyethylene |
| LPG | Liquefied petroleum gases |
| m | Mass fraction - |
| N | Naphthenes |
| n-P | Normal paraffins |
| PIANO | Paraffins, iso-paraffins, aromatics, naphthenes and olefins |
| PP | Polypropylene |
| RON | Research octane number |
| SF | Selectivity to fuel index, - |
| TPD | Temperature programmed desorption |
| TPO | Temperature programmed oxidation |
| VGO | Vacuum gasoil |
| X | Conversion, % |
| Y | Yield, wt% |
References
- Van Geem, K.M. Plastic Waste Recycling Is Gaining Momentum. Science 2023, 381, 607–608. [Google Scholar] [CrossRef]
- Vidal, F.; van der Marel, E.R.; Kerr, R.W.F.; McElroy, C.; Schroeder, N.; Mitchell, C.; Rosetto, G.; Chen, T.T.D.; Bailey, R.M.; Hepburn, C.; et al. Designing a Circular Carbon and Plastics Economy for a Sustainable Future. Nature 2024, 626, 45–57. [Google Scholar] [CrossRef] [PubMed]
- PEMRG Plastics Europe’s Market Research and Statistics Group. Plastics—The Facts 2023. An Analysis of European Plastics Production, Demand and Waste Data; Plastics Europe: Brussels, Belgium, 2023; Available online: https://plasticseurope.org/ (accessed on 31 January 2024).
- Vuppaladadiyam, S.S.V.; Vuppaladadiyam, A.K.; Sahoo, A.; Urgunde, A.; Murugavelh, S.; Šrámek, V.; Pohořelý, M.; Trakal, L.; Bhattacharya, S.; Sarmah, A.K.; et al. Waste to Energy: Trending Key Challenges and Current Technologies in Waste Plastic Management. Sci. Total Environ. 2024, 913, 169436. [Google Scholar] [CrossRef]
- Zepa, I.; Grudde, V.Z.; Bening, C.R. Legitimising Technologies for a Circular Economy: Contested Discourses on Innovation for Plastics Recycling in Europe. Environ. Innov. Soc. Transit. 2024, 50, 100811. [Google Scholar] [CrossRef]
- Kumar, M.; Bhujbal, S.K.; Kohli, K.; Prajapati, R.; Sharma, B.K.; Sawarkar, A.D.; Abhishek, K.; Bolan, S.; Ghosh, P.; Kirkham, M.B.; et al. A Review on Value-Addition to Plastic Waste towards Achieving a Circular Economy. Sci. Total Environ. 2024, 921, 171106. [Google Scholar] [CrossRef]
- Han, X.-W.; Zhang, X.; Zhou, Y.; Maimaitiming, A.; Sun, X.-L.; Gao, Y.; Li, P.; Zhu, B.; Chen, E.Y.-X.; Kuang, X.; et al. Circular Olefin Copolymers Made de Novo from Ethylene and α-Olefins. Nat. Commun. 2024, 15, 1462. [Google Scholar] [CrossRef]
- Kim, S.W.; Kim, Y.T.; Tsang, Y.F.; Lee, J. Sustainable Ethylene Production: Recovery from Plastic Waste via Thermochemical Processes. Sci. Total Environ. 2023, 903, 166789. [Google Scholar] [CrossRef] [PubMed]
- Zhang, X.; Yang, H.; Chen, Z.; Wang, X.; Feng, H.; Zhang, J.; Yu, J.; Gao, S.; Lai, D. Sustainable Production of Aromatics via Catalytic Pyrolysis of Polyolefins towards the Carbon Cycle for Plastics. Fuel 2024, 357, 129897. [Google Scholar] [CrossRef]
- Klippel, M.S.; Martins, M.F. Physicochemical Assessment of Waxy Products Directly Recovered from Plastic Waste Pyrolysis: Review and Synthesis of Characterization Techniques. Polym. Degrad. Stab. 2022, 204, 110090. [Google Scholar] [CrossRef]
- Wu, S.; Ren, Z.; Hu, Q.; Yao, D.; Yang, H. Upcycling Plastic Waste into Syngas by Staged Chemical Looping Gasification with Modified Fe-Based Oxygen Carriers. Appl. Energy 2024, 353, 122105. [Google Scholar] [CrossRef]
- Gündüz Han, D.; Erdem, K.; Midilli, A. Investigation of Hydrogen Production via Waste Plastic Gasification in a Fluidized Bed Reactor Using Aspen Plus. Int. J. Hydrogen Energy 2023, 48, 39315–39329. [Google Scholar] [CrossRef]
- Palos, R.; Gutiérrez, A.; Vela, F.J.; Olazar, M.; Aandes, J.M.; Bilbao, J. Waste Refinery: The Valorization of Waste Plastics and End-of-Life Tires in Refinery Units. A Review. Energy Fuels 2021, 35, 3529–3557. [Google Scholar] [CrossRef]
- Trueba, D.; Palos, R.; Bilbao, J.; Arandes, J.M.; Gutiérrez, A. Product Composition and Coke Deposition in the Hydrocracking of Polystyrene Blended with Vacuum Gasoil. Fuel Process Technol. 2021, 224, 107010. [Google Scholar] [CrossRef]
- Vela, F.J.; Palos, R.; Bilbao, J.; Arandes, J.M.; Gutiérrez, A. Effect of Co-Feeding HDPE on the Product Distribution in the Hydrocracking of VGO. Catal. Today 2020, 353, 197–203. [Google Scholar] [CrossRef]
- Vela, F.J.; Palos, R.; Bilbao, J.; Arandes, J.M.; Gutiérrez, A. Hydrogen Pressure as a Key Parameter to Control the Quality of the Naphtha Produced in the Hydrocracking of an HDPE/VGO Blend. Catalysts 2022, 12, 543. [Google Scholar] [CrossRef]
- Vela, F.J.; Palos, R.; Rodríguez, S.; Azkoiti, M.J.; Bilbao, J.; Gutiérrez, A. Study on the Role of the Reaction Time in the Upcycling of HDPE by Co-Hydrocracking It with VGO. J. Anal. Appl. Pyrolysis 2023, 170, 105928. [Google Scholar] [CrossRef]
- Uçar, S.; Karagöz, S.; Karayildirim, T.; Yanik, J. Conversion of Polymers to Fuels in a Refinery Stream. Polym. Degrad. Stab. 2002, 75, 161–171. [Google Scholar] [CrossRef]
- Metecan, I.H.; Ozkan, A.R.; Isler, R.; Yanik, J.; Saglam, M.; Yüksel, M. Naphtha Derived from Polyolefins. Fuel 2005, 84, 619–628. [Google Scholar] [CrossRef]
- Karakhanov, E.; Maximov, A.; Kardasheva, Y.; Vinnikova, M.; Kulikov, L. Hydrotreating of Light Cycle Oil over Supported on Porous Aromatic Framework Catalysts. Catalysts 2018, 8, 397. [Google Scholar] [CrossRef]
- Anderson, P.C.; Sharkey, J.M.; Walsh, R.P. Calculation of the Research Octane Number of Motor Gasolines from Gas Chromatographic Data and a New Approach to Motor Gasoline Quality Control. J. Inst. Pet. 1972, 58, 83–94. [Google Scholar]
- Zhang, X.; Lei, H.; Yadavalli, G.; Zhu, L.; Wei, Y.; Liu, Y. Gasoline-Range Hydrocarbons Produced from Microwave-Induced Pyrolysis of Low-Density Polyethylene over ZSM-5. Fuel 2015, 144, 33–42. [Google Scholar] [CrossRef]
- Slezáčková, M.; Peller, A.; Mikulec, J.; Banič, M.; Blaško, J.; Hájeková, E. Catalytic Hydroprocessing of Camelina Oil/AGO Mixtures over NiMoP/γ-Al2O3 Catalysts. Catal. Today 2023, 423, 113953. [Google Scholar] [CrossRef]
- Vivas-Báez, J.C.; Servia, A.; Pirngruber, G.D.; Dubreuil, A.C.; Pérez-Martínez, D.J. Insights in the Phenomena Involved in Deactivation of Industrial Hydrocracking Catalysts through an Accelerated Deactivation Protocol. Fuel 2021, 303, 120681. [Google Scholar] [CrossRef]
- Kumar Parsapur, R.; Hengne, A.M.; Melinte, G.; Refa Koseoglu, O.; Hodgkins, R.P.; Bendjeriou-Sedjerari, A.; Lai, Z.; Huang, K. Post-synthetic Ensembling Design of Hierarchically Ordered FAU-type Zeolite Frameworks for Vacuum Gas Oil Hydrocracking. Angew. Chem. Int. Ed. 2023, 63, e202314217. [Google Scholar] [CrossRef]
- Utami, M.; Trisunaryanti, W.; Shida, K.; Tsushida, M.; Kawakita, H.; Ohto, K.; Wijaya, K.; Tominaga, M. Hydrothermal Preparation of a Platinum-Loaded Sulphated Nanozirconia Catalyst for the Effective Conversion of Waste Low Density Polyethylene into Gasoline-Range Hydrocarbons. RSC Adv. 2019, 9, 41392–41401. [Google Scholar] [CrossRef]
- Kokuryo, S.; Tamura, K.; Tsubota, S.; Miyake, K.; Uchida, Y.; Mizusawa, A.; Kubo, T.; Nishiyama, N. Coking Reduction of Cr-loaded Beta Zeolite during Polymer Cracking: Hydrocracking of Aromatics by Synergistic Effect of Cr6+ and Zeolitic Acid Sites. ChemCatChem 2023, 15, e202300461. [Google Scholar] [CrossRef]
- Wang, W.; Cai, X.; Hou, H.; Dong, M.; Li, Z.; Liu, F.; Liu, Z.; Tian, S.; Long, J. Different Mechanisms of Coke Precursor Formation in Thermal Conversion and Deep Hydroprocessing of Vacuum Residue. Energy Fuels 2016, 30, 8171–8176. [Google Scholar] [CrossRef]
- Vela, F.J.; Palos, R.; Trueba, D.; Cordero-Lanzac, T.; Bilbao, J.; Arandes, J.M.; Gutiérrez, A. A Six-Lump Kinetic Model for HDPE/VGO Blend Hydrocracking. Fuel 2023, 333, 126211. [Google Scholar] [CrossRef]
- Al-Attas, T.A.; Zahir, M.H.; Ali, S.A.; Al-Bogami, S.A.; Malaibari, Z.; Razzak, S.A.; Hossain, M.M. Novel (Co-,Ni)- p—Tert -Butylcalix [4]Arenes as Dispersed Catalysts for Heavy Oil Upgrading: Synthesis, Characterization, and Performance Evaluation. Energy Fuels 2019, 33, 561–573. [Google Scholar] [CrossRef]
Figure 1.
Products yields distribution and conversion evolution (a) obtained for the different C/F mass ratios. Evolution of the selectivity to fuel index (b) for the tested C/F mass ratios.
Figure 1.
Products yields distribution and conversion evolution (a) obtained for the different C/F mass ratios. Evolution of the selectivity to fuel index (b) for the tested C/F mass ratios.

Figure 2.
Composition of the gas fraction obtained for the different C/F mass ratio tested.

Figure 3.
PIANO composition obtained for the naphtha (a) and LCO (b) fractions for the different C/F mass ratios. Key: n-P, n-paraffins; i-P, iso-paraffins; N, naphthenes; A1, monoaromatics; A2, diaromatics and A3+, polyaromatics.
Figure 3.
PIANO composition obtained for the naphtha (a) and LCO (b) fractions for the different C/F mass ratios. Key: n-P, n-paraffins; i-P, iso-paraffins; N, naphthenes; A1, monoaromatics; A2, diaromatics and A3+, polyaromatics.

Figure 4.
TPO profiles of the combustion of the coke deposited for the studied C/F mass ratios, green, 0.05 gcatalyst gfeed−1; purple, 0.075 gcatalyst gfeed−1; orange 0.1 gcatalyst gfeed−1.
Figure 4.
TPO profiles of the combustion of the coke deposited for the studied C/F mass ratios, green, 0.05 gcatalyst gfeed−1; purple, 0.075 gcatalyst gfeed−1; orange 0.1 gcatalyst gfeed−1.

Figure 5.
Evolution of the (a) total coke, contents of the different types of coke, and the (b) maximum coke combustion temperature for the investigated C/F mass ratios.
Figure 5.
Evolution of the (a) total coke, contents of the different types of coke, and the (b) maximum coke combustion temperature for the investigated C/F mass ratios.

Disclaimer/Publisher’s Note: The statements, opinions and data contained in all publications are solely those of the individual author(s) and contributor(s) and not of MDPI and/or the editor(s). MDPI and/or the editor(s) disclaim responsibility for any injury to people or property resulting from any ideas, methods, instructions or products referred to in the content. |
© 2024 by the authors. Licensee MDPI, Basel, Switzerland. This article is an open access article distributed under the terms and conditions of the Creative Commons Attribution (CC BY) license (https://creativecommons.org/licenses/by/4.0/).
Share and Cite
MDPI and ACS Style
Vela, F.J.; Palos, R.; Bilbao, J.; Arandes, J.M.; Gutiérrez, A. Hydrocracking of a HDPE/VGO Blend: Influence of Catalyst-to-Feed Ratio on Fuel Yield and Composition. Catalysts 2024, 14, 203. https://doi.org/10.3390/catal14030203
AMA Style
Vela FJ, Palos R, Bilbao J, Arandes JM, Gutiérrez A. Hydrocracking of a HDPE/VGO Blend: Influence of Catalyst-to-Feed Ratio on Fuel Yield and Composition. Catalysts. 2024; 14(3):203. https://doi.org/10.3390/catal14030203
Chicago/Turabian StyleVela, Francisco J., Roberto Palos, Javier Bilbao, José M. Arandes, and Alazne Gutiérrez. 2024. "Hydrocracking of a HDPE/VGO Blend: Influence of Catalyst-to-Feed Ratio on Fuel Yield and Composition" Catalysts 14, no. 3: 203. https://doi.org/10.3390/catal14030203
Note that from the first issue of 2016, this journal uses article numbers instead of page numbers. See further details here.