
Disproportionation of Rosin Driven by 4,4′-Thio-bis(3-Methyl-6-Tert-Butylphenol): Kinetic Model Discrimination
FQPIMA Group, Materials and Chemical Engineering Department, Chemical Science School, Complutense University of Madrid, 28040 Madrid, Spain
*
Author to whom correspondence should be addressed.
Catalysts 2024, 14(4), 235; https://doi.org/10.3390/catal14040235
Submission received: 2 February 2024
/
Revised: 28 March 2024
/
Accepted: 29 March 2024
/
Published: 31 March 2024
(This article belongs to the Section Biomass Catalysis)
Abstract
:Herein, a phenomenological kinetic modeling of the disproportionation of rosin with a well-known antioxidant and bleaching agent, antioxidant 300, also known as 4,4′-thio-bis(3-methyl-6-tert-butylphenol) under thermal conditions adequate for rosin esterification with polyols such as glycerol or pentaerythritol, is studied. The temperature was varied in the 260–280 °C range, while the catalyst was either absent or added till a 2% w/w amount relative to rosin. The composition of the reaction liquid was followed by GC-MS to identify the rosin acids present in each sample and GC-FID to quantify them. Gas chromatography analyses indicated that abietic acids were involved in dehydrogenation, isomerization and disproportionation reactions, while pimaric acid underwent a number of isomerization reactions, dehydroabietic acid being the main product of the disproportionation process, while abietic acid almost disappeared in the more reactive conditions. Several kinetic models featuring direct hydrogenation, disproportionation, isomerization, and dehydrogenation reactions were proposed and fitted, step by step, to all relevant data. Physicochemical and statistical discrimination allowed for the selection of the most adequate model, which includes abietic, neoabietic and palustric acid dehydrogenation to dehydroabietic acid, abietic acid disproportionation to di- and dehydroabietic acid, and pimaric acid isomerization. In any case, a model with isomerization of all abietic-type acids towards abietic acid before its further transformation via dehydrogenation and disproportionation reactions seems statistically valid as well.
1. Introduction
Rosin is the non-volatile fraction of conifer exudates and particularly of pine resin after its distillation at 180 °C at atmospheric pressure. It is composed of an assortment of diverse resin acids of the abietic type (abietane diterpenoids, presenting a conjugated double bond between two adjacent 6-C cycles), abietic acid being the most abundant. About 20% of rosin in mass is composed of other resin acids of the pimaric type: pimaric acid and isopimaric acid. In 2022, over 1.2 millions of tons of rosin was produced: 781 was gum rosin, that is, rosin directly produced from exudates from living trees, while 432 million was contained in tall oil, essentially produced in the pulp and paper sector. Though rosin from tree exudate is relatively pure, rosin acids are mixed with fatty acids and neutral components (5–15% w/w) [1]. Rosin acids present a rich reactivity, so a high number of compounds and products are presently derived from rosin: resins, hardeners, pharmaceutical drugs, monomers, biocides, surfactants, polymers, and sorbents, to name a few [2]. Moreover, rosin attracts high interest for the synthesis of diverse bio-epoxy nanocomposites, as well as lignin, polyphenols, and natural rubbers [3]. In recent years, increased awareness of rosin structure, reactivity, applicability, and renewability has resulted in an exponential number of publications (from a stable number of around 50–70 till 2010 to 250–300 in 2015) [2].
Disproportionated rosin, due to the absence of the conjugated double bonds typical of abietic acid, is not prone to oxidation, so it tends to maintain an almost white to slightly yellow color, a feature much valued in most coating, adhesive, and polymer applications. Moreover, it has low brittleness, maintains a high stability towards heat, and has a high softening point (over 80–90 °C), which is another characteristic critical for its use in polymer formulation, such as ABS resin, where dehydroabietic acid is needed in proportions higher than 65% w/w and abietic acid has to be converted to avoid a concentration higher than 0.5% w/w [1,4]. Apart from their use as surfactants in the production of various classical resins (ethylene vinyl acetate plastic (EVA) and acrylonitrile–butadiene–styrene (ABS) resin), the terpenic acids present in rosin and disproportionated rosin are of high interest for the production of novel polymers via polycondensation reactions [5]. Diverse derivatives of dehydroabietic acid presenting moderate antiprotozoal activity against epimastigotes of Trypanosoma cruzi and promastigote forms of Leishmaniabraziliensis and Leishmania infantum [6], oxygenated derivatives with antiviral activity [7], N-acylhydrazone derivatives with good antibacterial activity against Staphylococcus aureus and Bacillus subtilis [8], and several thiourea α-aminophosphonates of dehydroabietic acid have shown promising antitumor activity [9]. Recently, Hao et al. reviewed in depth the biological activities, structure modifications, biotransformations, and relationships between structure and activity for dehydroabietic acid and several derivatives [10].
Rosin acid modification via disproportionation and isomerization is needed not only in the production of rosin rich in dehydroabietic acid but also in rosin esters, polymers, and adducts, most of which are produced at temperatures over 200 °C [1]. Rosin disproportionation has been historically performed using elemental sulfur as a very efficient homogeneous catalyst, with the subsequent formation of hydrogen sulfide and related environmental issues [11]. In the last decade, several solid catalysts, either novel or industrial preparations, based on Pd supported in charcoal have been tested [12,13], though the activity of this noble metal has been known for a long time [14]. Likewise, homogeneous catalysts based on iodine and sulfur have also being applied for a long time, with a preference towards sulfur derivatives due to their antioxidant, bleaching, and catalytic activities preserving the product hardness (in contrast with iodine catalysts) [15].
Disproportionated rosin chemical analyses have been performed through diverse methods: GC-FID (gas chromatography–flame ionization detection), GC-MS (gas chromatography–mass spectroscopy), HPLC (high-performance liquid chromatography), 1H-NMR (proton nuclear magnetic resonance) spectroscopy, UV-vis spectroscopy (ultraviolet-visible spectroscopy), and MALDI-TOF (matrix-assisted laser desorption/ionization–time of flight) mass spectroscopy [3,12,16,17]. Kinetic modeling is useful to understand the nature of reactions taking place in a complex reaction system in more depth, while providing information of importance to reactor design, control, and operation. Still, even considering the importance of classical and novel applications of disproportionated rosin, information on disproportionation kinetics in the literature is scarce, though isomerization, disproportionation, and dehydrogenation reactions have been identified [12,18,19]. Most of these kinetics models include first- and second-order kinetic equations for abietic- and pimaric-type reactions in the 200–250 °C range and using Pd/C as the catalyst. More recent work on kinetic modeling of rosin reactions where disproportionation plays a side role has been devoted to hydrogenation over nickel catalysts [20], showing first-order reactions to the end products, rosin esterification with pentaerythritol [21], and a kinetic model with second-order esterification reactions and first-order decarboxylation reactions. Over 250 °C, disproportionation driven by heat starts to be an important reaction, i.e., a side reaction of importance in adduct formation and rosin esterification processes. Sulfur-based antioxidants play a role not only as stabilizers towards oxidation in such conditions and in general as bleaching agents but also as catalysts for side, stabilizing, and disproportionation reactions. However, to our best knowledge, there is no information regarding the disproportionation kinetics when using these sulfur-based additives or sulfur, even if these additives are commonly used in rosin esterification, polymerization, and adduct formation [1,2].
In this research, we addressed the kinetic modeling of the disproportionation of rosin when 4,4′-thio-bis(3-methyl-6-tert-butylphenol), an antioxidant and bleaching additive commercially known as antioxidant 300 and an equivalent of Santonox TBMC, acts as a catalyst. Runs were performed from 260 °C to 280 °C, modifying the catalyst concentration from 0 to 2% w/w with respect to rosin. The retrieved data have been used to select between five kinetic models based on disproportionation, dehydrogenation, and/or isomerization reactions taking place at the same time, the most appropriate being selected through a multiparametric, multitemperature, nonlinear regression analysis.
2. Results
Reaction Scheme and Kinetic Model Selection
Several kinetic models based on disproportionation, dehydrogenation and hydrogenation reactions have been proposed, starting from the abietic and pimaric acids present in technical-grade rosin and identified by GC-MS: abietic acid, neoabietic acid and palustric acid (abietates), and pimaric acid, and in consideration of previous research [12,18,19]. Furthermore, the profile of chromatograms in GC-MS and GC-FID was identical, allowing for the immediate identification and quantification of rosin acids with both GC techniques. The kinetic models considered are collected in Table 1, and in essence are based on first-order reactions from the starting and intermediate rosin acids taking place in parallel and in series.
In model 1, all abietates isomerize to abietic acid, which is hydrogenated to dihydroabietic acid, conserving only one of the double bonds in the terpene structure, and dehydrogenated to dehydroabietic acid, one of the most stable abietates under oxidative conditions [4]. Pimaric acid isomerizes to isopimaric acid (this latter is a group of pimarates with a diverse position of the double bond in the terpene cyclic structure and is identified as a group of several peaks and compounds in the GC chromatograms).
Model 2 advocates for direct hydrogenation of an abietic acid molecule by hydrogen transfer from another abietic acid molecule, constituting a real disproportionation reaction, a fact that can explain the first-order kinetic equation used: the only compound relevant for its own transformation is abietic acid. This is in contrast to model 1, where we assumed pseudo-first-order behavior in the hydrogenation of abietic acid to dihydroabietic acid, which means a constant concentration of hydrogen in the reaction media or an excess of this reagent during hydrogenation, a set of reactions to dihydroabietic acid, and usually to tetrahydroabietic acid that takes place at high hydrogen pressures, typical in rosin hydrogenation reactions, and lower temperatures [20].
The third model is a modification of model 2 that assumes that palustric acid not only isomerizes to abietic acid but also dehydrogenates to dehydroabietic acid following a first-order reaction. Model 4 is analogous to model 3, but neoabietic acid is now the abietic isomer that suffers dehydrogenation. Finally, in model 5, abietic acid, neoabietic acid, and palustric acid transform into dehydroabietic acid directly, not considering a previous isomerization of neoabietic and palustric acid to abietic acid.
All models assume the same kinetic equation for the thermal contribution and the catalytic contribution of each reaction. The thermal contribution does not take into account the catalyst action, while the catalytic contribution is summed to the former and is proportional to the catalyst concentration.
When a multiparametric, multitemperature fit of the suggested models to all data at the same time is performed and from the perspective of the physicochemical criteria, in particular considering activation energies (Ea) of all kinetic constants, they are all in the range 50 to 400 kJ/mol for the thermal contribution and 10 to 200 kJ/mol for the catalytic contribution. As expected, for most cases, the catalyzed reaction is less dependent on temperature than the identical heat-driven reaction. This is particularly true for the palustric acid reactions, where the thermal component has very high activation energies from 350 to 400 kJ/mol, while the catalyst reaction is only slightly affected by temperature, being an isomerization or a dehydrogenation (from 7 to 10 kJ/mol).
As for the statistical fit of the models to all data, standard errors of all kinetic constants are at least one order of magnitude lower than the value of each constant and goodness-of-fit values are acceptable to very good. In the case of model 1, there is a certain lack of fit due to the need for a very similar amount of dehydroabietic acid and dihydroabietic acid, while the experimental evidence is that dehydroabietic acid molar quantity is 2–3 times higher than its hydrogenated counterpart. For the other models, the sum of residual squares (SSR) is very low, while the F-value (Fisher’s F at 95% confidence) is very high. Furthermore, the information criteria employed here (AIC or Akaike information criterion and BIC or Bayesian information criterion) were calculated, rendering negative values for all models, the lowest being those for model 5, as expected, though very close to values retrieved for model 2. Most models are adequate to explain the variation of concentration with time in terms of percentage (VE) for all acids with the exception of model 1, which explains VE slightly worse. Goodness-of-fit parameters are collected in Table 2, while Figure 1 and Figure 2 show the fitting of the models to the acid molar amounts for runs performed at 270 °C for all catalyst amounts, including the absence of catalyst (Figure 1) and for several temperatures (Figure 2). Tables S1 and S2 give details of model 5 fitting to all experimental data, including these experimental data, in Tables S3 and S4 in the Supplementary Material, where all kinetic parameters (the activation energy—Ea—and the Napierian values of the preexponential term of the Arrhenius equation of each kinetic constant) are given. All are statistically meaningful based on Student’s t-test, as the error at the 95% confidence level is notably lower than the value of the parameter. As a final statistical analysis, the calculation of the average relative error for all kinetic parameters and all models resulted in very high values for model 1 and similar values for all other models. For models 2 to 5, these average relative errors are 10.72%, 11.04%, 11.26%, and 8.76%, again indicating slightly higher confidence for the values of the kinetic parameters of model 5.
Even accepting that, for these experimental data obtained by GC-FID after sample chemical derivatization, the random overall error was near 10%. Model 5 could be selected on the basis of the statistical results, though model 2 is also adequate due to the close values of the goodness-of-fit parameters when comparing these two models. Even so, an additional F-test can be conducted to compare both models based on Equation (1), as both models have the same number of parameters (20) and the datum number is identical (1014), rendering an equal value for the degree of freedom (1014 − 20 = 996). Using the SSR of model 5 as the best one, the ANOVA p-value can be computed to test if its value is lower than 0.05. As this is not so, it can be concluded that both models are similar.
The kinetic equations and constants of the selected model (model 5) are compiled in Table 3, indicating also the relationships between the rates at which each relevant acid appears or disappears (Rj) and the rates of the reactions in which they are involved (ri). Figure 3 depicts the reaction network relative to this model featuring two kinetic terms that are added to each reaction rate: the first term is the thermal contribution, which is proportional to the acid, and the second is the catalytic term, always proportional to the catalyst and to the acid concentrations. Thus, all reaction rates are expressed following equation (2), with the catalyst concentration (Ccat) and the relevant acid concentration (Cacid) as main independent variables and kit and kic as the thermal and catalytic kinetic constants:
3. Discussion
From a statistical perspective, models 2 and 5 are the most adequate, both in terms of goodness of fit and considering the narrow intervals of error at 95% confidence for all kinetic parameters in both models. Therefore, it is complicated to select with accuracy the most adequate model on the grounds of statistics. Even if model 5 could be selected due to its having (marginally) the best fit, it is more likely that neither model alone can be chosen based on statistical results and both are adequate for fitting kinetic data if experimental error is taken into account. From a thermodynamic perspective and considering thermodynamical control of the global transformation, both neoabietic acid and palustric acid tend to isomerize at a fast rate at temperatures higher than 200 °C to the more stable abietic acid (based on the respective standard formation enthalpies −ΔHf0: −615.5, −635.0 and −686.88 kJ/mol). Afterwards, the abietic acid is transformed into dehydro- and dihydroabietic acid by dehydration and disproportionation reactions. This is the network of reactions proposed in model 2 and several authors for disproportionation and hydrogenation of rosin [18,19,20]. However, this perspective is in contrast to the fact that −ΔHf0 for the dehydroabietic acid is −631.1 kJ/mol [22], higher than for abietic acid, which suggests that dehydroabietic acid is less stable from a thermodynamic perspective than abietic acid, but more stable than both palustric and neoabietic acids. Therefore, in a situation where isomerization, dehydrogenation, and disproportionation coexist at high temperature and relatively low pressure (with the hydrogen formed probably coming from the reacting liquid), it is not impossible to hypothesize that all abietic acids react to dehydroabietic acid while only abietic acid is affected by disproportionation, as stated by model 5, suggesting kinetic control of the global reaction network. In both cases, pimaric acid (ΔHf0 = −547.1 kJ/mol) turns into isopimaric acid (ΔHf0 = −590.1 kJ/mol).
In all models, pimaric acid slowly isomerizes to isopimaric acid, while the reactions of the abietic acids to dehydro- and dihydroabietic acid proceed much faster at all temperatures. Model 5 involves dehydrogenation of abietic, neoabietic, and palustric acids towards dehydroabietic acid, while only abietic acid disproportionates to dehydro- and dihydroabietic acid, promoting the idea of a hydrogen atom transfer between two adjacent abietic acid molecules. Thiophenols can act as mediators of hydrogen transfer [23], a fact that also supports the absence of direct hydrogenation of abietic acid with molecular hydrogen and supports, at least partially, model 5. Moreover, neoabietic acid has an exocyclic double bond that is easy to hydrogenate but is also unstable, and can be included within a carbon cycle that suffers aromatization. Likewise, palustric acid is very similar in structure to abietic acid and has two conjugated double bonds in the same C6 cycle, suggesting an easy dehydrogenation to an aromatic structure. These reasons also favor model 5, the reaction network of which is shown in Figure 3.
The bleaching and antioxidant compound 4,4′-thio-bis(3-methyl-6-tert-butylphenol, commercially known as antioxidant 300 or AT 300) is a sulfide with two adjacent aromatic rings with hydroxyl (para), methyl (ortho) and tert-butyl (meta) substituents that acts as a homogeneous catalyst for rosin disproportionation. For a long time, it has been known that sulfur and selenium atoms can act as hydrogen transfer agents [24], along with sulfur-containing compounds such as thiophenol [25], inorganic sulfides [26], and aryl–alkyl sulfides [27], to name a few. Here, when comparing models 1 and 2, we can appreciate that hydrogen transfer is the mechanism behind the conversion of a certain amount of abietic acid to dihydro- and dehydroabietic acids in an equimolar quantity. Moreover, direct hydrogenation is usually performed in the presence of nickel catalysts at temperatures below 180 °C and with high hydrogen pressure [20]. Probably, in contrast to what happens when using Pd/C as a disproportionation catalyst, this is also the reason that pimaric or neoabietic acid seems not to be hydrogenated even if they have exocyclic double bonds: the aryl sulfide is not as efficient as Pd/C in the hydrogenation of such bonds, probably due to steric hindrances. Though sulfur is more efficient in this regard, hydrogen sulfide is created during the process—with concomitant environmental issues—and this is the reason that in the rosin industry, Pd/C and sulfides are now being considered as the most appropriate catalysts, even if the former is pricey and the latter’s compounds are less efficient. In any case, as dehydroabietic acid is the main target and organic sulfides are additives needed to attain an almost-white appearance by avoiding oxidation of rosin acids, these compounds are of high interest in rosin transformations performed in the 250–280 °C temperature range.
The need for bleaching agents in rosin esterification processes is due to the high temperature of such processes, usually over 260 °C and up to 290 °C. Avoiding higher temperatures limits the production of rosin oil due to the decarboxylation of rosin acids. Bleaching agents, such as AT 300, are highly effective antioxidants at reasonable prices (3000–4000 USD/ton), adequate to render a very clear rosin product, but the presence of rosin oil, which acts as a plasticizer, reduces the hardness of the product, measured as the softening temperature, lowering its commercial value. Rosin acids such as neoabietic and pimaric acids are prone to oxidation in the presence of oxygen (air contact) at temperatures as low as 80–81 °C, while dehydroabietic acid starts to react with oxygen at 125 °C, and hydrogenated rosin esters with glycerol and pentaerythritol oxidation begin to be evident at 139 °C [28]. Therefore, disproportionation and dehydrogenation are a bonus during rosin esterification, leading to rosin products with high stability toward oxidation, a key aspect of their application as soaps for emulsion polymerization of a variety of resins, such as ABS. Moreover, rosin acids are being considered as biofuel components, but careful consideration of their stability toward oxidation, much linked to their thermal stability, is a must in this case [29].
4. Conclusions
In this work, several phenomenological kinetic models were tested to fit diverse runs of disproportionation of rosin with 4,4′-thio-bis(3-methyl-6-tert-butylphenol) at temperatures of 260–280 °C and with diverse catalyst concentrations (from 0 to 2% w/w rosin). These kinetic models included disproportionation, isomerization, and dehydrogenation reactions. Diverse physicochemical and statistical criteria led to the selection of model 5, where abietic, neoabietic, and palustric acids transform into dehydroabietic acid by dehydrogenation, while abietic acid also disproportionates to di- and dehydroabietic acid and pimaric acid isomerizes to isopimaric acid. In any case, model 2, where all abietic-type acids isomerize to abietic acid before dehydration and disproportionation reactions, is also statistically valid. Thermodynamic reasons favor isomerization on the grounds of enthalpy of formation values for pimaric acid, while abietic-type acids seem to transform towards dehydroabietic acid under kinetic control favored by the segregation of the created hydrogen from the reaction liquid, thus shifting the dehydrogenation equilibria towards the products. Finally, we can conclude that even if 4,4′-thio-bis(3-methyl-6 tert-butylphenol) is less active than sulfur, it has an acceptable catalytic activity to be added to its antioxidant and bleaching action in rosin products.
5. Materials and Methods
5.1. Materials
Technical-grade rosin and UPS-grade glycerol were a gift from Luresa (Coca, Spain), while N,N-dimethylformamide dimethyl acetal 92% for gas chromatography and pure oleic acid were supplied by Sigma Aldrich (St. Louis, MO, USA). The catalyst (antioxidant AT 300) was also a present from Luresa.
5.2. Disproportionation Reactions and Chemical Analysis
The kinetic experiments were carried out at temperatures relevant for disproportionation linked to esterification or adduct formation processes that run between 260 °C and 280 °C, avoiding higher temperatures to minimize decarboxylation reactions, with a catalyst concentration between 0 and 2% w/w of rosin, thereby including reactions driven only by heat. Experimental conditions of all runs are shown in Table 4. The experiments were performed in batches in the setup depicted in Figure 4, where a 250 mL round-bottomed flask with three 14/25 necks and a 29/32 central neck was coupled with a Liebig condenser to remove volatiles. When the temperature reached 100 °C, the agitation was increased from 200 to 500 rpm and a zero-reaction sample was withdrawn before reaching 200 °C to avoid any progress of the reactions. When reaching the temperature, the reaction time was set at zero and samples were withdrawn over 30 h using clean glass pipettes and aluminum caps for each sample and letting the sample cool to room temperature. Afterwards, such samples were ground to powder and maintained tightly closed in vials at 4 °C before subjecting them to GC analysis.
For a precise quantitative analysis of the abietate and pimarate acids involved in the disproportionation process, GC-FID analysis was applied to the solid samples after a methylation derivatization with N,N-dimethylformamide dimethyl acetal using rosin acid standards to construct the calibration lines. The gas chromatograph was a HP model 5890 series II gas with a flame ionization detector, while the column was a Zebron 1 capillary column (15 m × 0.32 mm × 0.5 mm). The programmed temperature ramp started at 180 °C, heating the oven at a rate of 1 °C min−1 to reach 195 °C, increasing the heating rate by 20 °C per minute till a final temperature of 285 °C, and holding it for 5.5 min. The total analysis time per sample was 25 min. For GC-FID analysis, N2 was used as carrier gas. The injector temperature was set to 250 °C and the detector temperature to 300 °C [12].
To clearly identify the rosin acids present in the samples, which allowed us to propose the reaction schemes present in Table 2, a GC-MS analytical protocol set in a HP 6890 GC-MS chromatograph (mass detector MSD type 5973, Agilent, Santa Clara, CA, USA) was employed. The column placed in the oven was an HP-INNOWax (cross-linked PEG, Agilent, Santa Clara, CA, USA) 30 m × 0.32 mm ØI × 0.25 μm column. As eluent, we used helium of high purity (≥99.999%) and set the flow rate to 16 mL/min to maintain a constant back pressure of 24 KPa. Initially, the oven temperature was set to 150 °C for 1 min, then changed to 190 °C using a heating rate of 5 °C per minute. Immediately afterwards, the heating program changed the rate to 10 °C/min till a temperature of 240 °C was reached, maintained it for 25 min, and increased it to 249 °C during 5 min to clean the column after the analysis (post-run period). The injection port temperature was set to 210 °C, while the detector temperature was set to 250 °C. The sample injection volume was 1 μL, while the injection was performed in splitless mode and data were acquired in scan mode. Mass spectra were acquired starting from m/z 50–550 amu.
5.3. Kinetic Modeling and Simulation
To propose the kinetic models compiled in Table 2, we considered our previous paper [12], those of Wang et al. [18,19], and the results obtained by GC-MS. These kinetic models were based on first-order kinetic equations alone or mixed with second-order kinetic equations depending on the reaction being considered: disproportionation or hydrogen transfer between two abietic acid molecules, abietic acid and isomer dehydrogenation, and pimaric acid isomerization.
The experiments were run for 30 h, and a notable quantity of kinetic data was retrieved after GC-FID analysis. These data were the basis of the kinetic model discrimination via the fitting of these models to the aforementioned data. The fitting procedure was based on combining the numerical integration of the ODE of each model using a variable-step Euler method with a nonlinear regression algorithm named NL2SOL. This is a robust modification of the Levenberg–Marquardt gradient method. We used Aspen Custom Modeler v 12.1 software, in which these algorithms were implemented.
Once the statistical analysis of chemical data was performed, the selection of the kinetic model was based on the minimization of the sum of squared residuals (SSR) and a related parameter, Fisher’s F-value at 95% confidence, the latter to avoid overparameterization in the finally selected kinetic model. To select the most appropriate model, firstly physicochemical criteria were applied. Given the need for kinetic constant values to be positive and the need for the activation energies of such kinetic constants to be within certain reasonable values when chemical reactions control the overall transformation rate, which is the case in a homogeneous reacting system, activation energies (Ea) should be within the 20–200 kJ/mol range. To this end, the kinetic constants are expressed in all models as exponential functions of the absolute temperature T following a modified version of the Arrhenius equation, as indicated in Equation (3), which warrants a positive value of the kinetic constant at all temperatures, thus enforcing the first physicochemical criterion.
As a second selection set of criteria, statistical criteria included the errors of the kinetic parameters retrieved and goodness-of-fit criteria such as SSR, which should tend toward zero, and Fisher’s F-value, which should be the highest possible. These parameters are calculated with Equations (4) and (5), respectively.
where Cie refers to the experimental concentration of each compound and Cic is its calculated concentration using every proposed kinetic model, N is the total number of data points, and K is the number of parameters of the model. Equation (4) refers to the F-value at a certain level of confidence as implemented in the nonlinear regression algorithms in the Aspen Custom Modeler software. Furthermore, two information criteria were calculated from the values of SSR, N and K: the Akaike information criterion (AIC), as defined in Equation (6), valid for N/K equal to or higher than 40, and 50 in this work, and the Bayesian or Schwarz information criterion, as indicated in Equation (7). Information criterion values should be the lowest possible, even negative with a trend toward −∞, for the best model, the one that best fits the numerical data. These criteria were specifically created for model selection based on the maximum-likelihood principle of the Akaike information criterion, introduced in 1973 by Hirotugu Akaike and the first widely accepted for this purpose [30]. The Schwarz or Bayesian criterion, also widely used, has a Bayesian nature and was published in 1978 [31].
A last goodness-of-fit parameter of relevance to analyze the performance of every model to estimate the change of molar amounts with time (dC/dt) with respect to the real or experimental change is the variation of explained variable (VE). To calculate it, we applied Equation (8). More details concerning this parameter reflecting each model’s heteroscedasticity can be found in one of our previous papers [32].
In this work, we performed careful kinetic modeling of the proposed models on all experimental data, starting with the thermal data retrieved in the absence of catalyst, firstly at each temperature, and after applying linearization to the Arrhenius equation of all relevant kinetic constants, fitting the models with such constants as temperature functions to all data at the same time. Afterwards, we assume that the catalytic term will be similar to the thermal term, but including the catalyst concentration and adding data of runs where AT 300 was added, the multitemperature fitting procedure was carried out a third time to fit all proposed kinetic models to all data at the same time.
Supplementary Materials
The following supporting information can be downloaded at https://www.mdpi.com/article/10.3390/catal14040235/s1. Table S1. Experimental data of runs without catalyst together with the fitting results to model 5. Table S2. Experimental data of runs with diverse concentrations of catalyst together with the fitting results to model 5. Table S3. Kinetic constants of the thermal component. Table S4. Kinetic constants of the catalytic component. Table S5. Diverse goodness-of-fit parameters for the tested kinetic models.
Author Contributions
Conceptualization, M.L. and F.G.-O.; methodology, J.C.S., P.Y. and M.L.; software, J.C.S.; validation, M.L. and F.G.-O.; formal analysis, M.L. and F.G.-O.; investigation, J.C.S. and P.Y.; resources, M.L. and F.G.-O.; data curation, J.C.S. and M.L.; writing—original draft preparation, J.C.S. and M.L.; writing—review and editing, M.L, P.Y. and F.G.-O.; supervision, M.L. and F.G.-O.; project administration, F.G.-O.; funding acquisition, F.G.-O. All authors have read and agreed to the published version of the manuscript.
Funding
This work received funding from the European Union Horizon 2020 Research and Innovation Program under grant agreement 958174, specifically by the Spanish Agencia Estatal de Investigación through national subprojects within the M.ERA-Net Call 2021, project 9147 “Bi-oMAT4EYE”: PCI2022-132971. Furthermore, it was supported by the Spanish Science and Innovation Ministry State Research Agency through research project PID2020-114365RB-C21.
Data Availability Statement
Data on compound concentrations are included in all figures, and any original data are available upon request.
Acknowledgments
The authors also want to express their deepest gratitude to LURESA for the generous gift of industrial rosin and the antioxidant AT 300.
Conflicts of Interest
The authors declare no conflicts of interest. The funders had no role in the design of the study; in the collection, analyses, or interpretation of data; in the writing of the manuscript; or in the decision to publish the results.
References
- Soltes, E.J.; Zinkel, D.F. Chemistry of Rosin. Naval Stores: Production, Chemistry, and Utilization; Zinkel, D.F., Russell, J., Eds.; Pulp Chemical Association: New York, NY, USA, 1989. [Google Scholar]
- Kugler, S.; Ossowicz, P.; Malarczyk-Matusiak, K.; Wierzbicka, E. Advances in rosin-based chemicals: The latest recipes, applications and future trends. Molecules 2019, 24, 1651. [Google Scholar] [CrossRef] [PubMed]
- Ebrahimnezhad-Khaljiri, H.; Ghadi, A. Recent advancement in synthesizing bio-epoxy nanocomposites using lignin, plant oils, saccharides, polyphenols, and natural rubbers: A review. Int. J. Biol. Macromol. 2023, 256, 128041. [Google Scholar] [CrossRef] [PubMed]
- Gao, X.; Qiu, F.; Xie, H.; Chen, X.; Wu, C.; Chen, Y.; Liang, J.; Wang, L. Efficient catalytic hydrogenation of acrylic rosin over high-activity Pd/C catalyst under mild conditions. React. Kin. Mechan. Catal. 2024, 1–19. [Google Scholar] [CrossRef]
- Winnacker, M.; Rieger, B. Recent progress in sustainable polymers obtained from cyclic terpenes: Synthesis, properties, and application potential. ChemSusChem 2015, 8, 2455–2471. [Google Scholar] [CrossRef] [PubMed]
- Pertino, M.W.; Vega, C.; Rolón, M.; Coronel, C.; Rojas de Arias, A.; Schmeda-Hirschmann, G. Antiprotozoal activity of triazole derivatives of dehydroabietic acid and oleanolic acid. Molecules 2017, 22, 369. [Google Scholar] [CrossRef] [PubMed]
- Gonzalez, M.A.; Perez-Guaita, D.; Correa-Royero, J.; Zapata, B.; Agudelo, L.; Mesa-Arango, A.; Betancur-Galvis, L. Synthesis and biological evaluation of dehydroabietic acid derivatives. Eur. J. Med. Chem. 2010, 45, 811–816. [Google Scholar] [CrossRef] [PubMed]
- Gu, W.; Wu, R.; Qi, S.; Gu, C.; Si, F.; Chen, Z. Synthesis and antibacterial evaluation of new N-acylhydrazone derivatives from dehydroabietic acid. Molecules 2012, 17, 4634–4650. [Google Scholar] [CrossRef]
- Huang, X.C.; Wang, M.; Pan, Y.M.; Yao, G.Y.; Wang, H.S.; Tian, X.Y.; Qin, J.K.; Zhang, Y. Synthesis and antitumor activities of novel thiourea α-aminophosphonates from dehydroabietic acid. Eur. J. Med. Chem. 2013, 69, 508–520. [Google Scholar] [CrossRef]
- Hao, M.; Xu, J.; Wen, H.; Du, J.; Zhang, S.; Lv, M.; Xu, H. Recent advances on biological activities and structural modifications of dehydroabietic acid. Toxins 2022, 14, 632. [Google Scholar] [CrossRef]
- Halbrook, N.J.; Lawrence, R.V. The isolation of dehydroabietic acid from disproportionated rosin. J. Org. Chem. 1966, 31, 4246–4247. [Google Scholar] [CrossRef]
- Souto, J.C.; Yustos, P.; Ladero, M.; Garcia-Ochoa, F. Disproportionation of rosin on an industrial Pd/C catalyst: Reaction pathway and kinetic model discrimination. Bioresour. Technol. 2011, 102, 3504–3511. [Google Scholar] [CrossRef] [PubMed]
- Gu, Y.; Li, Y.; Zhang, J.; Zhang, H.; Wu, C.; Lin, J.; Zhou, J.; Fan, Y.; Murugadoss, V.; Guo, Z. Effects of pretreated carbon supports in Pd/C catalysts on rosin disproportionation catalytic performance. Chem. Eng. Sci. 2020, 216, 115588. [Google Scholar] [CrossRef]
- Song, Z.Q.; Zavarin, E.; Zinkel, D.F. On the palladium-on-charcoal disproportionate of rosin. J. Wood Chem. Technol. 1985, 5, 535–542. [Google Scholar] [CrossRef]
- Zhang, P.; Zhao, Z.; Bi, L.; Lu, Y.; Li, D. Review on colorless disproportionated rosin and its catalysts. J. Bioproc. Eng. Bioref. 2012, 1, 140–146. [Google Scholar] [CrossRef]
- Mitani, K.; Fujioka, M.; Uchida, A.; Kataoka, H. Analysis of abietic acid and dehydroabietic acid in food samples by in-tube solid-phase microextraction coupled with liquid chromatography–mass spectrometry. J. Chromatog. A 2007, 1146, 61–66. [Google Scholar] [CrossRef] [PubMed]
- Rezzi, S.; Bighelli, A.; Castola, V.; Casanova, J. Direct identification and quantitative determination of acidic and neutral diterpenes using 13 C-NMR spectroscopy: Application to the analysis of oleoresin of Pinus nigra. Appl. Spect. 2002, 56, 312–317. [Google Scholar] [CrossRef]
- Wang, L.; Chen, X.; Liang, J.; Chen, Y.; Pu, X.; Tong, Z. Kinetics of the catalytic isomerization and disproportionation of rosin over carbon-supported palladium. Chem. Eng. J. 2009, 152, 242–250. [Google Scholar] [CrossRef]
- Wang, L.; Chen, X.; Sun, W.; Liang, J.; Xu, X.; Tong, Z. Kinetic model for the catalytic disproportionation of pine oleoresin over Pd/C catalyst. Ind. Crops Prod. 2013, 49, 1–9. [Google Scholar] [CrossRef]
- Huang, Y.; Wang, L.; Chen, X.; Wei, X.; Liang, J.; Li, W. Intrinsic kinetics study of rosin hydrogenation on a nickel catalyst supported on spent equilibrium catalyst. RSC Adv. 2017, 7, 25780–25788. [Google Scholar] [CrossRef]
- Hardhianti, M.P.W.; Rochmadi Azis, M.M. Kinetic studies of esterification of rosin and pentaerythritol. Processes 2021, 10, 39. [Google Scholar] [CrossRef]
- Meyerriecks, W. Organic fuels: Composition and formation enthalpy, part I, wood derivatives, related carbohydrates, exudates and rosin. J. Pyrotech. 1998, 8, 1–17. [Google Scholar]
- Dénès, F.; Beaufils, F.; Renaud, P. Thiophenol-mediated 1, 5-hydrogen transfer for the preparation of pyrrolizidines, indolizidines, and related compounds. Org. Lett. 2007, 9, 4375–4378. [Google Scholar] [CrossRef] [PubMed]
- House, W.T.; Orchin, M. A Study of the selenium dehydrogenation of guaiol and related compounds. Selenium as a hydrogen transfer agent. J. Am. Chem. Soc. 1960, 82, 639–642. [Google Scholar] [CrossRef]
- Beaufils, F.; Dénès, F.; Becattini, B.; Renaud, P.; Schenk, K. Thiophenol-mediated 1, 5-hydrogen atom abstraction: Easy access to mono-and bicyclic compounds. Adv. Synth. Catal. 2005, 347, 1587–1594. [Google Scholar] [CrossRef]
- Wei, X.; Ogata, E.; Zong, Z.; Zhou, S.; Qin, Z.; Liu, J.; Shen, K.; Li, H. Advances in the study of hydrogen transfer to model compounds for coal liquefaction. Fuel Proc. Technol. 2000, 62, 103–107. [Google Scholar] [CrossRef]
- Del Giacco, T.; Elisei, F.; Lanzalunga, O. Photoinduced hydrogen-and electron-transfer processes between chloranil and aryl alkyl sulfides in organic solvents. Steady-state and time-resolved studies. Phys. Chem. Phys. 2000, 2, 1701–1708. [Google Scholar] [CrossRef]
- Liu, P.; Liu, X.; Saburi, T.; Kubota, S.; Huang, P.; Wada, Y. Thermal stability evaluation of resin acids and rosin modified resins. ACS Omega 2020, 5, 29102–29109. [Google Scholar] [CrossRef] [PubMed]
- Li, Y.; Chen, H.; Yan, H.; Xu, Y.; Tang, J.; Wang, R.; Yan, M.; Dai, Y.; Huang, Y.; Liu, X. Thermal stability of levopimaric acid and its oxidation products. BMC Chem. 2023, 17, 118. [Google Scholar] [CrossRef] [PubMed]
- Esteban, J.; Fuente, E.; Blanco, A.; Ladero, M.; Garcia-Ochoa, F. Phenomenological Kinetic Model of the synthesis of glycerol carbonate assisted by focused beam reflectance measurements. Chem. Eng. J. 2015, 260, 434–443. [Google Scholar] [CrossRef]
- Cavanaugh, J.E.; Neath, A.A. The Akaike information criterion: Background, derivation, properties, application, interpretation, and refinements. Wiley Interdisc. Rev. Comput. Stat. 2019, 11, e1460. [Google Scholar] [CrossRef]
- Neath, A.A.; Cavanaugh, J.E. The Bayesian information criterion: Background, derivation, and applications. Wiley Interdisc. Rev. Comput. Stat. 2012, 4, 199–203. [Google Scholar] [CrossRef]
Figure 1.
Experimental data (points) and fitting of the selected kinetic model (lines) at 270 °C and several catalyst (AT 300) concentrations: (a) no catalyst added, (b) 0.5% with respect to rosin mass, (c) 1% w/w rosin, and (d) 2% w/w rosin. (■) Dehydroabietic acid; (▲) abietic acid; (○) pimaric acid; (▶) neoabietic acid; (★) palustric acid; (◆) dihydroabietic acid.

Figure 2.
Experimental data (points) and fitting of the selected kinetic model (lines) at two catalyst concentrations and several temperature values: (a) 260 °C and no added catalyst, (b) 270 °C without added catalyst, (c) 280 °C without added catalyst, (d) 260 °C and 1% w/w rosin, (e) 270 °C and 1% w/w rosin, and (f) 280 °C and 1% w/w rosin. (■) Dehydroabietic acid; (▲) abietic acid; (○) pimaric acid; (▶) neoabietic acid; (★) palustric acid; (◆) dihydroabietic acid.
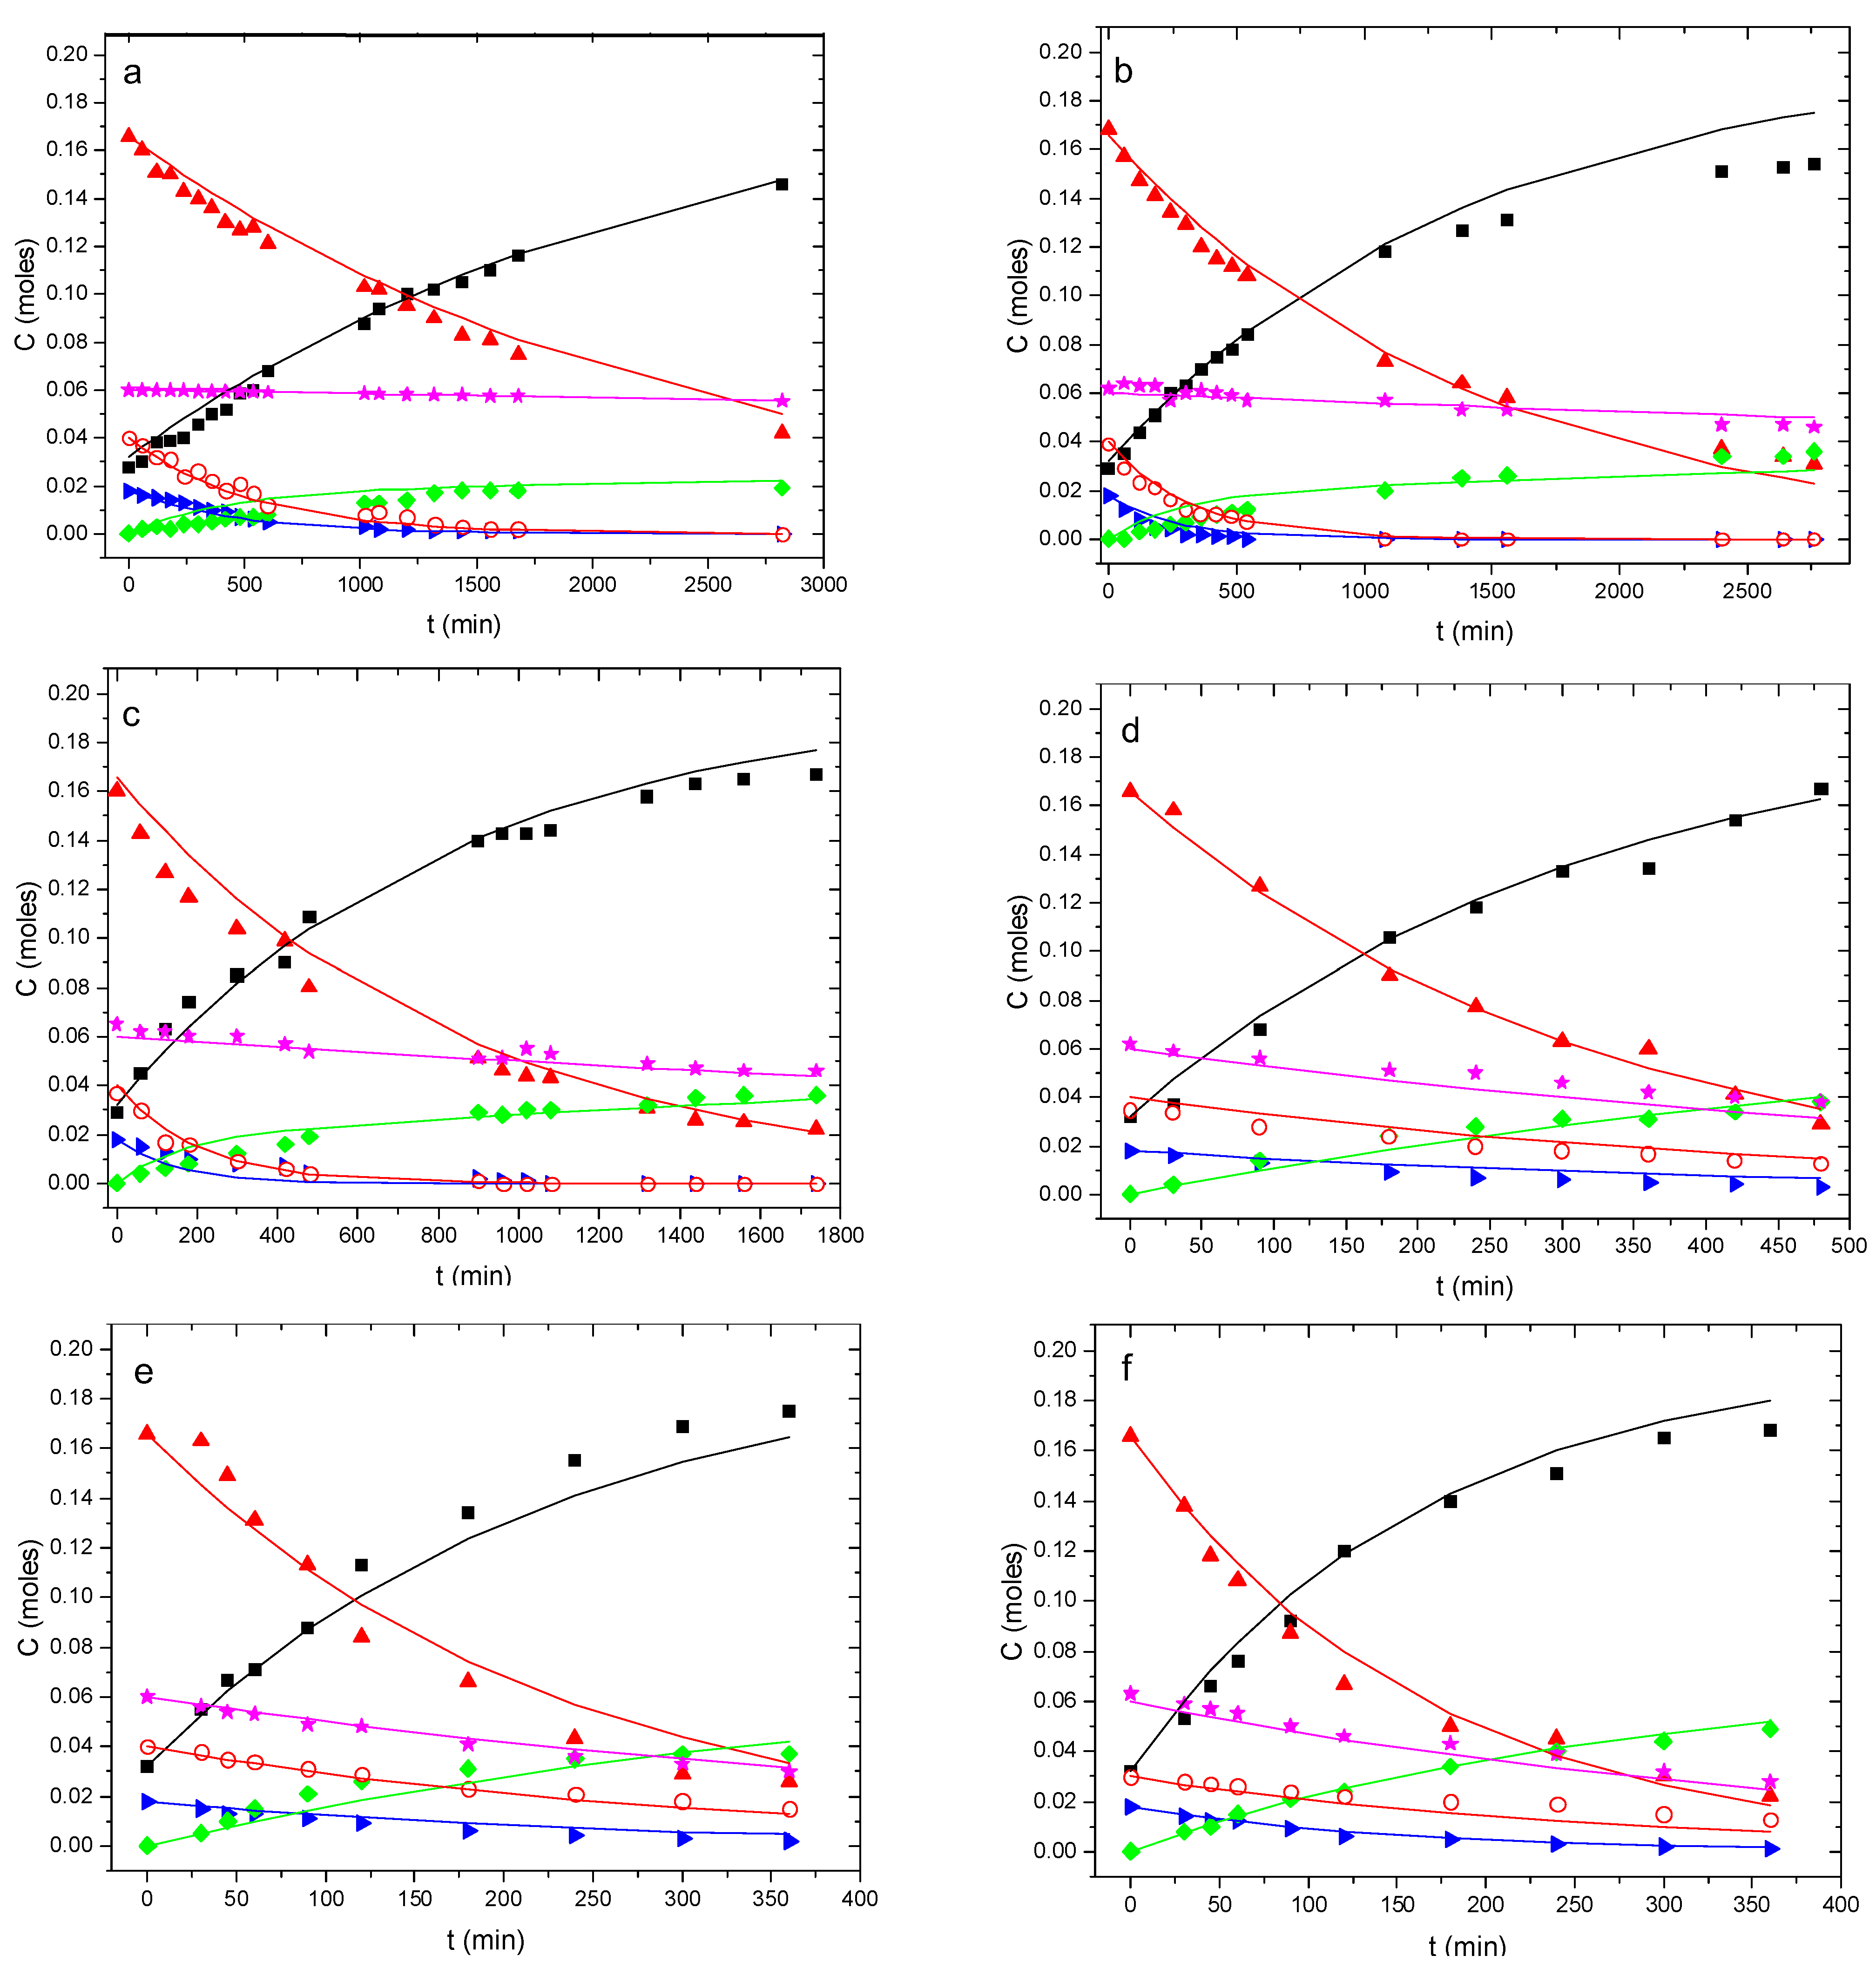
Figure 3.
Reaction network in model 5 displaying isomerization, disproportionation and dehydrogenation reactions.
Figure 3.
Reaction network in model 5 displaying isomerization, disproportionation and dehydrogenation reactions.

Figure 4.
Experimental reactor for rosin disproportionation. The reactor is provided with PID temperature and agitation–helix–control. There is a Liebig condenser to remove any rosin oil and avoid inner overpressure in the reactor.
Figure 4.
Experimental reactor for rosin disproportionation. The reactor is provided with PID temperature and agitation–helix–control. There is a Liebig condenser to remove any rosin oil and avoid inner overpressure in the reactor.


Table 1.
Kinetic models proposed to fit data retrieved in the disproportionation runs performed at several processing temperatures and catalyst (AT 300) mass concentrations (% w/w rosin) featuring several dehydrogenation, isomerization, and dehydrogenation reactions and first- and second-order kinetic equations.
| Model | Reaction Scheme and Kinetic Equations |
|---|---|
| 1 | 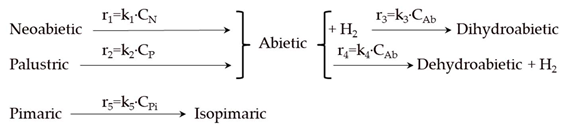 |
| 2 | 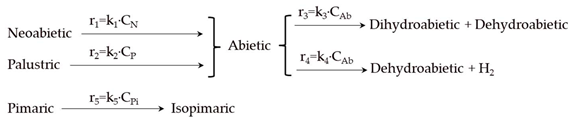 |
| 3 | 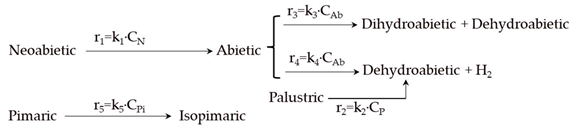 |
| 4 | 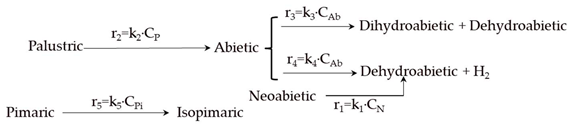 |
| 5 |  |
Note: ki refers to a kinetic constant relevant to the reaction rate i (ri), CAb is the abietic acid concentration, CP is the palustric acid concentration, CN is the neoabietic acid concentration, and CPi is the pimaric acid concentration.
Table 2.
Goodness-of-fit results of proposed kinetic models to all experimental data of disproportionation of rosin obtained at several temperatures (from 260 °C to 280 °C) using 4,4′-thio-bis(3-methyl-6-tert-butylphenol) as a homogeneous catalyst.
Table 2.
Goodness-of-fit results of proposed kinetic models to all experimental data of disproportionation of rosin obtained at several temperatures (from 260 °C to 280 °C) using 4,4′-thio-bis(3-methyl-6-tert-butylphenol) as a homogeneous catalyst.
| Statistical Parameters | Model 1 | Model 2 | Model 3 | Model 4 | Model 5 |
|---|---|---|---|---|---|
| SSR | 0.91 | 0.46 | 0.49 | 0.51 | 0.44 |
| F-value | 28,033 | 54,078 | 51,069 | 49,143 | 56,182 |
| AIC | −6.98 | −7.65 | −7.59 | −7.55 | −7.69 |
| BIC | −6.88 | −7.55 | −7.49 | −7.45 | −7.59 |
| VE (%) | 97.04 | 99.52 | 99.45 | 99.34 | 99.89 |
Note: N (data number) = 1014; K (number of parameters in model) = 20; N/K = 50.7. SSR: Sum of Squared Residuals; F-value: Fisher’s F value; AIC: Akaike’s information criterion; BIC: Bayesian or Schwarz information criterion; VE (%): percentage of variation explained.
Table 3.
Selected kinetic model and its equations for all relevant reactive species together with the kinetic constants and goodness-of-fit parameters.
Table 3.
Selected kinetic model and its equations for all relevant reactive species together with the kinetic constants and goodness-of-fit parameters.
| Component | Selected Kinetic Equations | Parameters of the Model |
|---|---|---|
| Abietic acid | ||
| Dehydroabietic acid | ||
| Palustric acid | ||
| Neoabietic acid | ||
| Dihydroabietic acid | ||
| Pimaric acid |
Note: kit and kic refer to kinetic constants for the thermal (t) component and the catalytic term (c) relevant to the reaction rate i (ri), Ccat refers to the catalyst concentration (in mass percentage), CAb is the abietic acid concentration, CDh is the dehydroabietic acid concentration, CP is the palustric acid concentration, CN is the neoabietic acid concentration, CDi is the dihydroabietic acid concentration, and CPi is the pimaric acid concentration. R refers to the observed temporal evolution rate of any of the acids present in this kinetic model.
Table 4.
Rosin disproportionation runs performed at diverse processing temperatures and catalyst (AT-300) mass concentrations (referred to as rosin mass).
Table 4.
Rosin disproportionation runs performed at diverse processing temperatures and catalyst (AT-300) mass concentrations (referred to as rosin mass).
| Run | T (°C) | % cat |
|---|---|---|
| 1 | 260 | 0 |
| 2 | 270 | 0 |
| 3 | 280 | 0 |
| 4 | 260 | 1 |
| 5 | 270 | 0.5 |
| 6 | 270 | 1 |
| 7 | 270 | 2 |
| 8 | 280 | 1 |
Disclaimer/Publisher’s Note: The statements, opinions and data contained in all publications are solely those of the individual author(s) and contributor(s) and not of MDPI and/or the editor(s). MDPI and/or the editor(s) disclaim responsibility for any injury to people or property resulting from any ideas, methods, instructions or products referred to in the content. |
© 2024 by the authors. Licensee MDPI, Basel, Switzerland. This article is an open access article distributed under the terms and conditions of the Creative Commons Attribution (CC BY) license (https://creativecommons.org/licenses/by/4.0/).
Share and Cite
MDPI and ACS Style
Souto, J.C.; Yustos, P.; Garcia-Ochoa, F.; Ladero, M. Disproportionation of Rosin Driven by 4,4′-Thio-bis(3-Methyl-6-Tert-Butylphenol): Kinetic Model Discrimination. Catalysts 2024, 14, 235. https://doi.org/10.3390/catal14040235
AMA Style
Souto JC, Yustos P, Garcia-Ochoa F, Ladero M. Disproportionation of Rosin Driven by 4,4′-Thio-bis(3-Methyl-6-Tert-Butylphenol): Kinetic Model Discrimination. Catalysts. 2024; 14(4):235. https://doi.org/10.3390/catal14040235
Chicago/Turabian StyleSouto, Juan C., Pedro Yustos, Felix Garcia-Ochoa, and Miguel Ladero. 2024. "Disproportionation of Rosin Driven by 4,4′-Thio-bis(3-Methyl-6-Tert-Butylphenol): Kinetic Model Discrimination" Catalysts 14, no. 4: 235. https://doi.org/10.3390/catal14040235
Note that from the first issue of 2016, this journal uses article numbers instead of page numbers. See further details here.