
Determination of Activation Energy from Decolorization Reactions of Synthetic Dyes by Fenton Processes Using the Behnajady–Modirshahla–Ghanbary Kinetic Model

Abstract
:1. Introduction
2. Results and Discussion
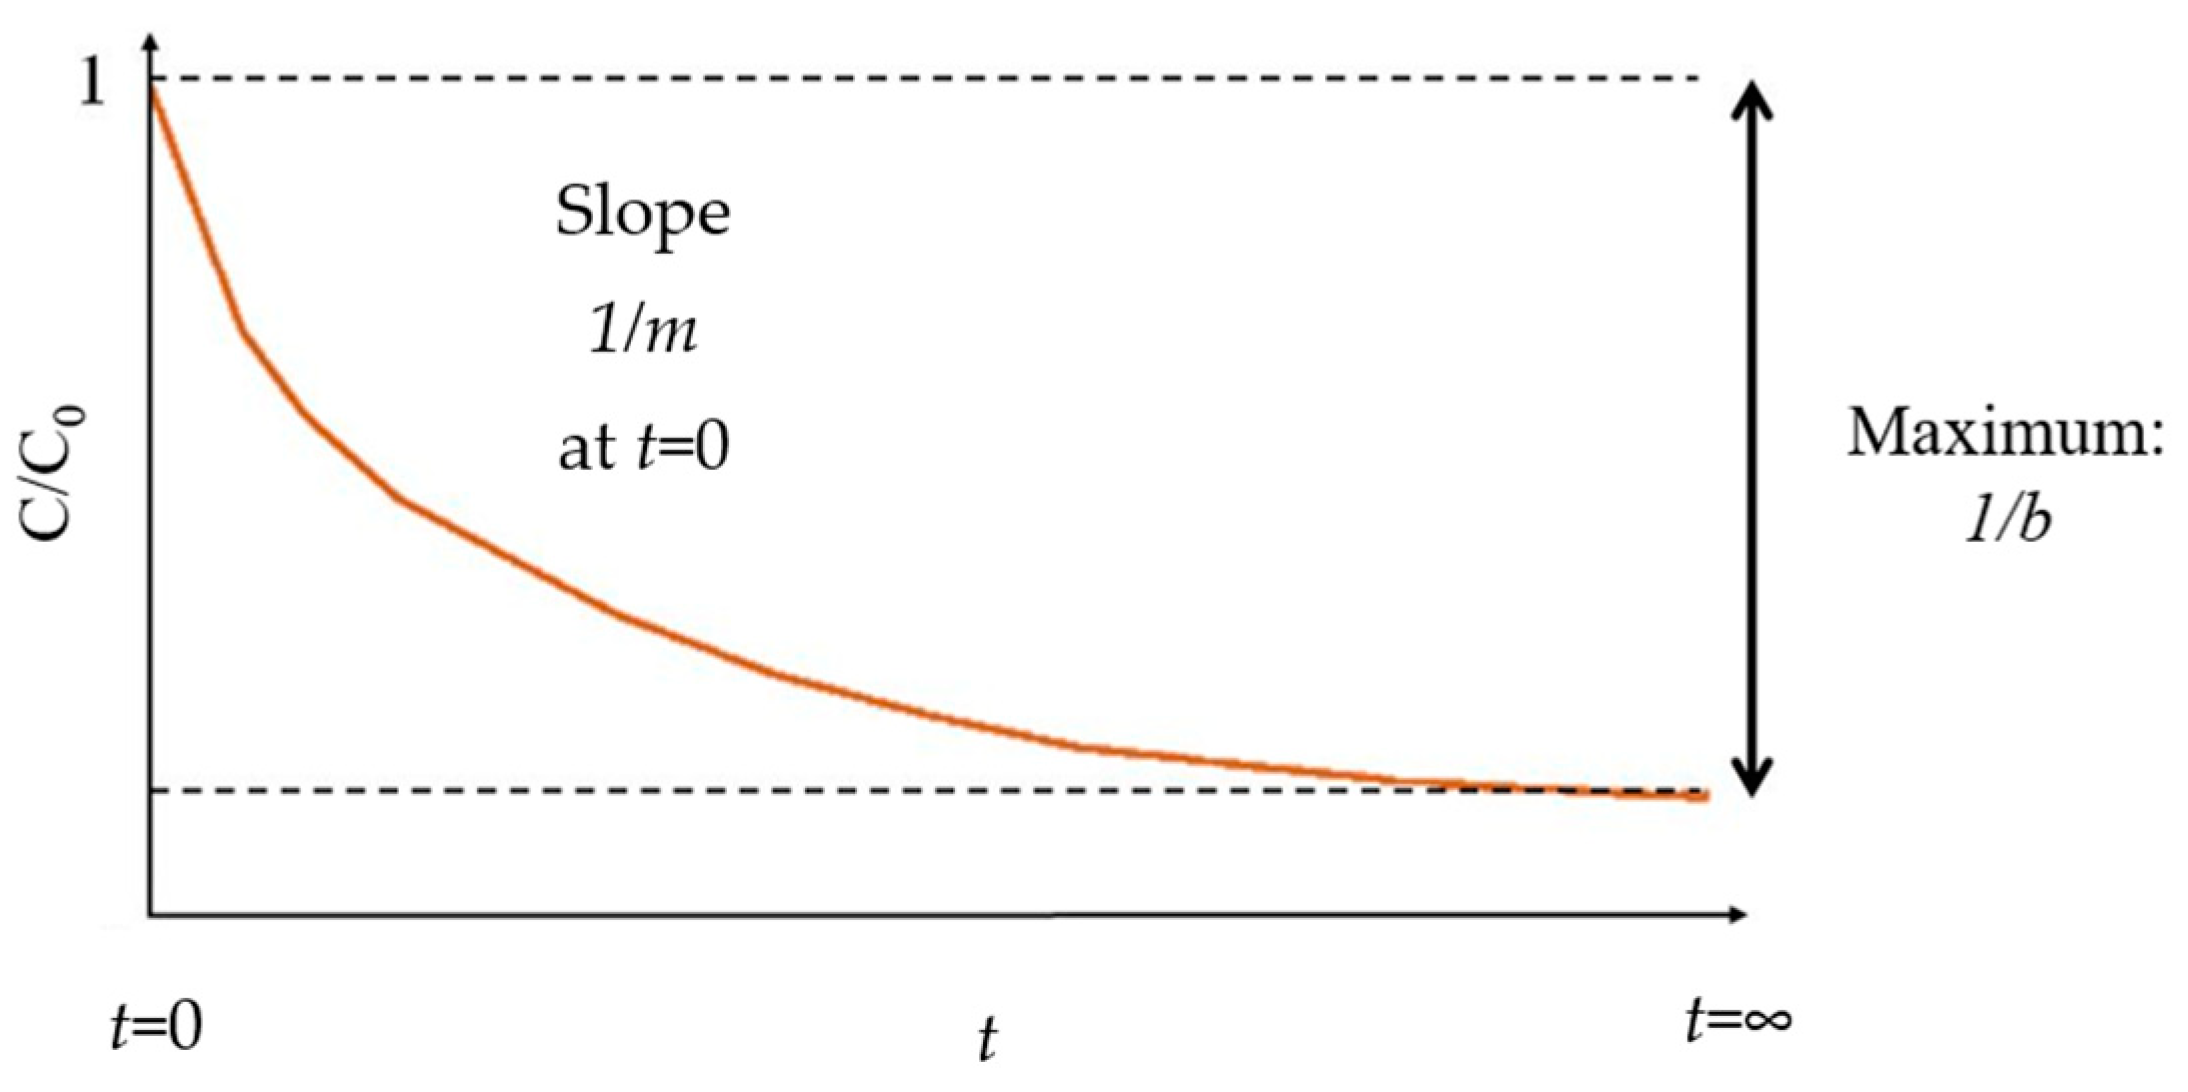
2.1. Data for 1/m from Decolorization Reactions of Different Dyes Using Fenton Processes
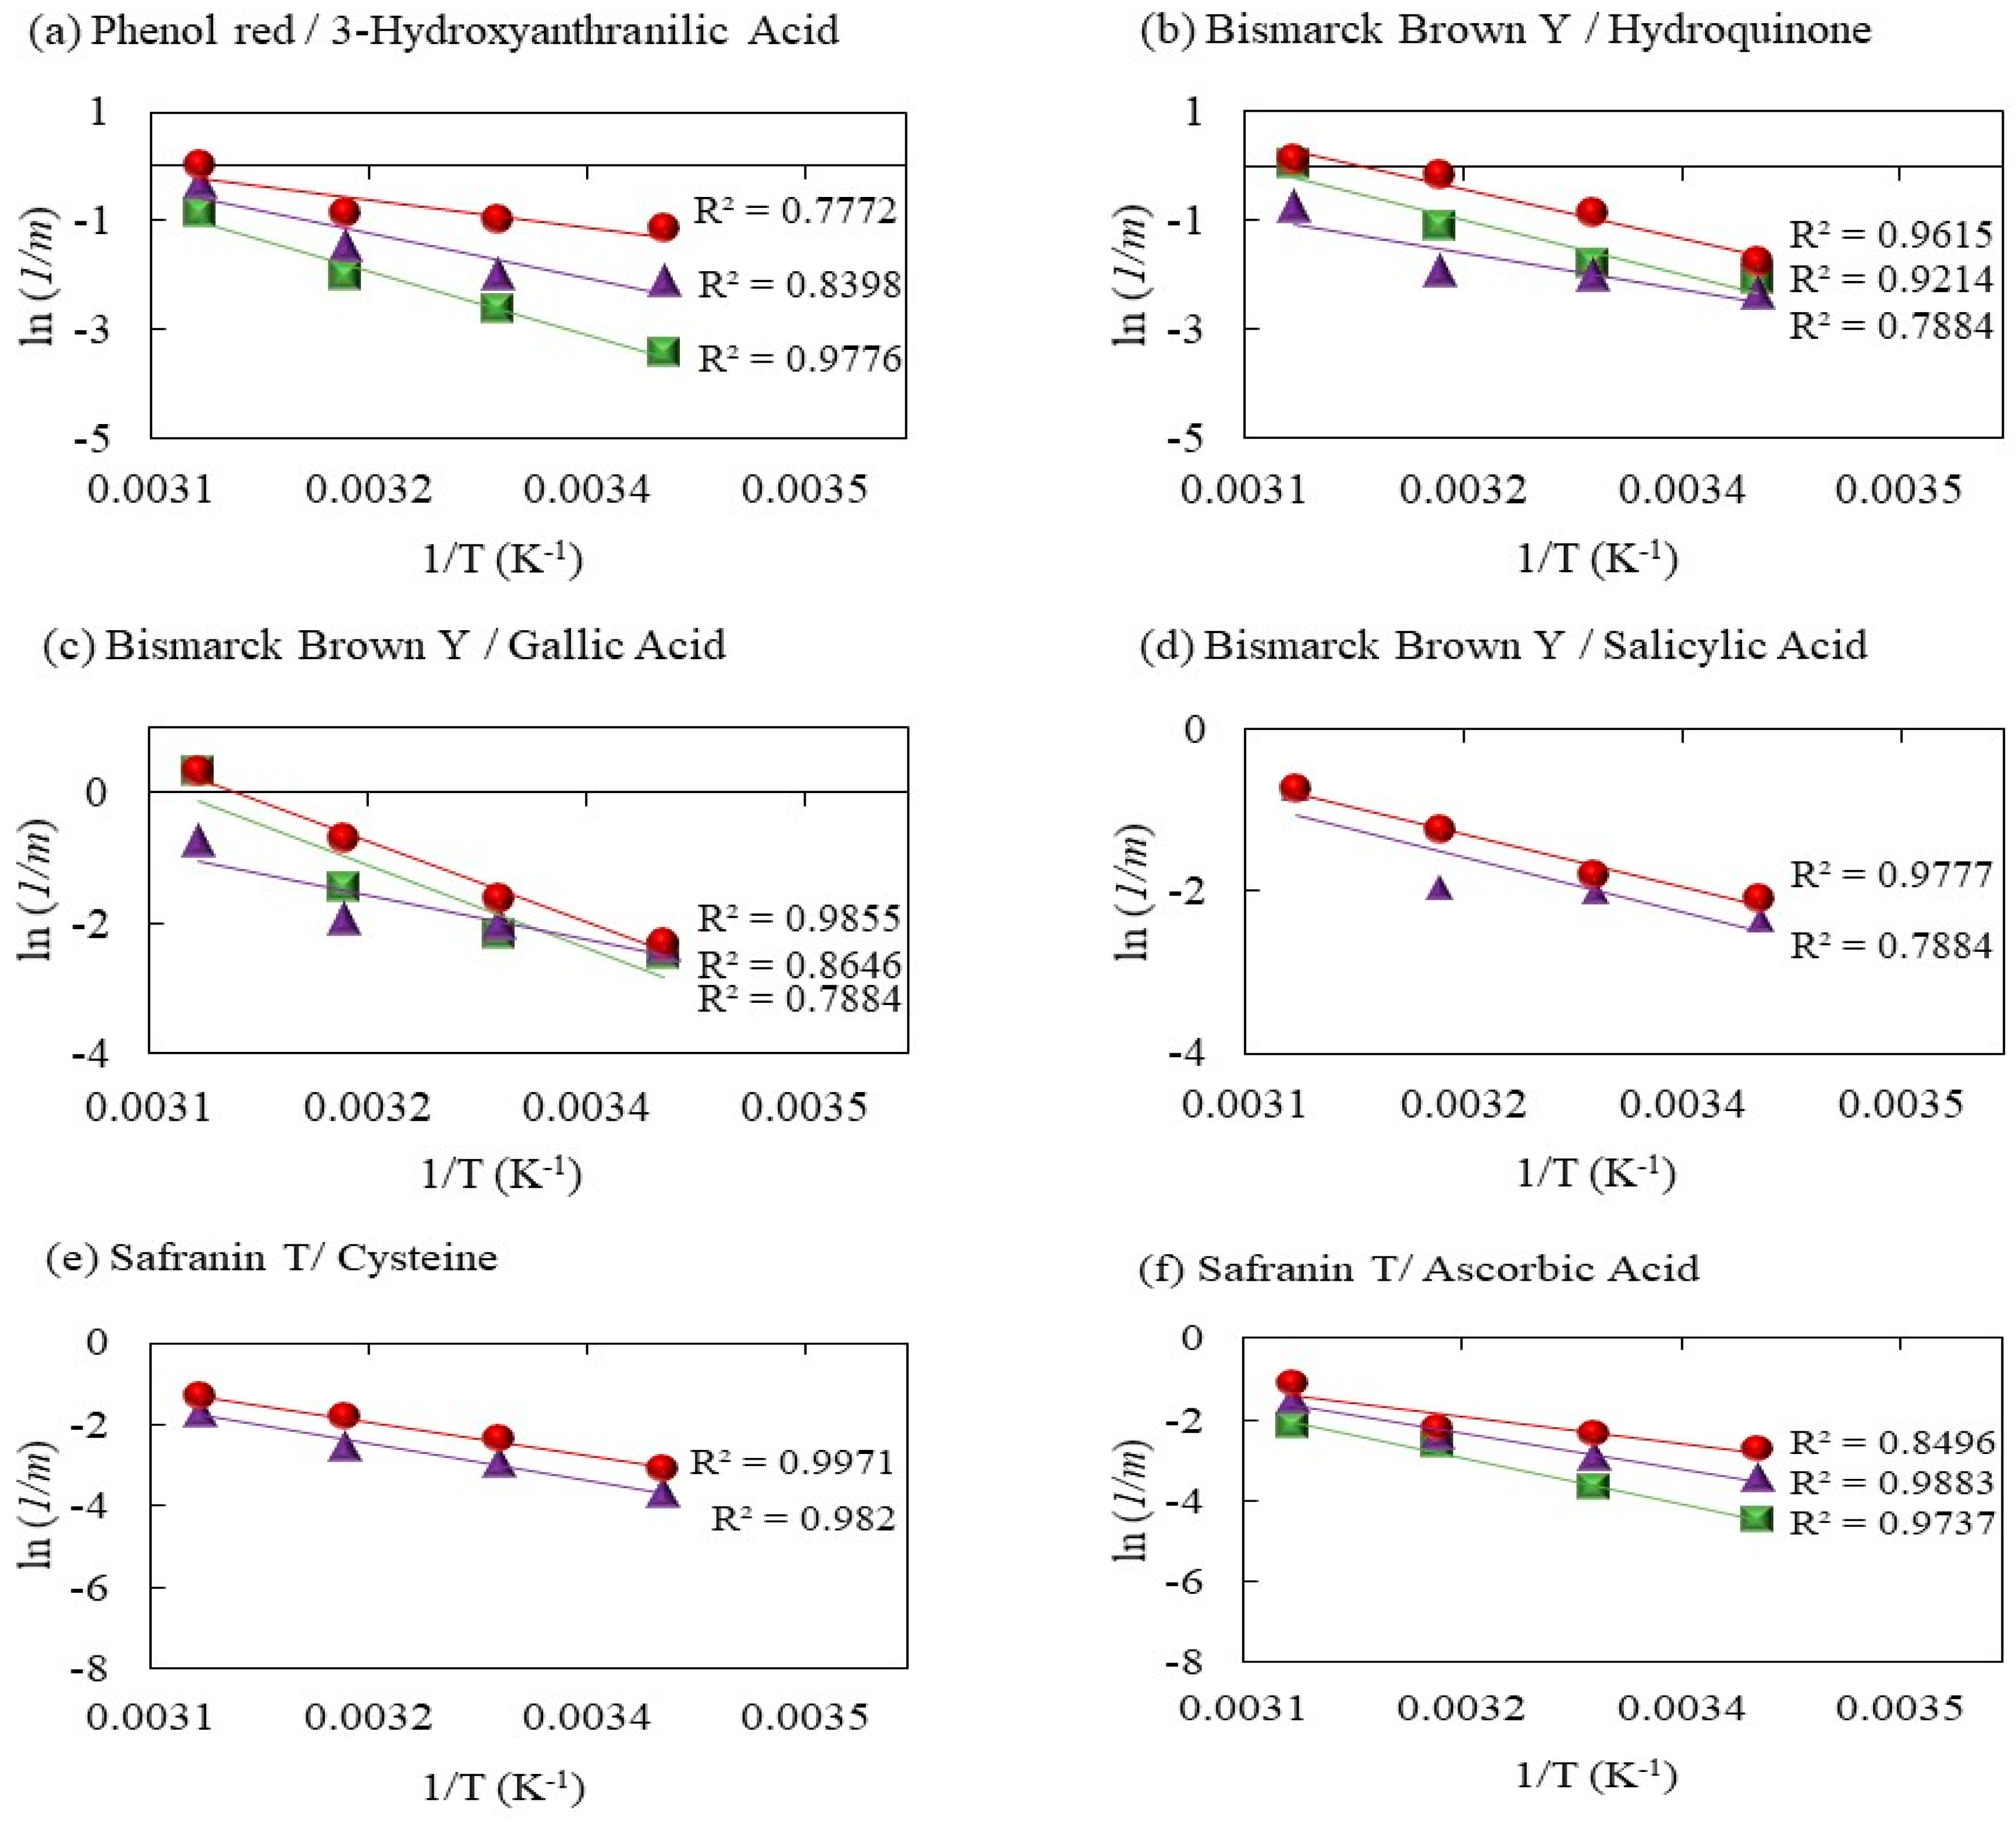
2.2. Ea Calculation
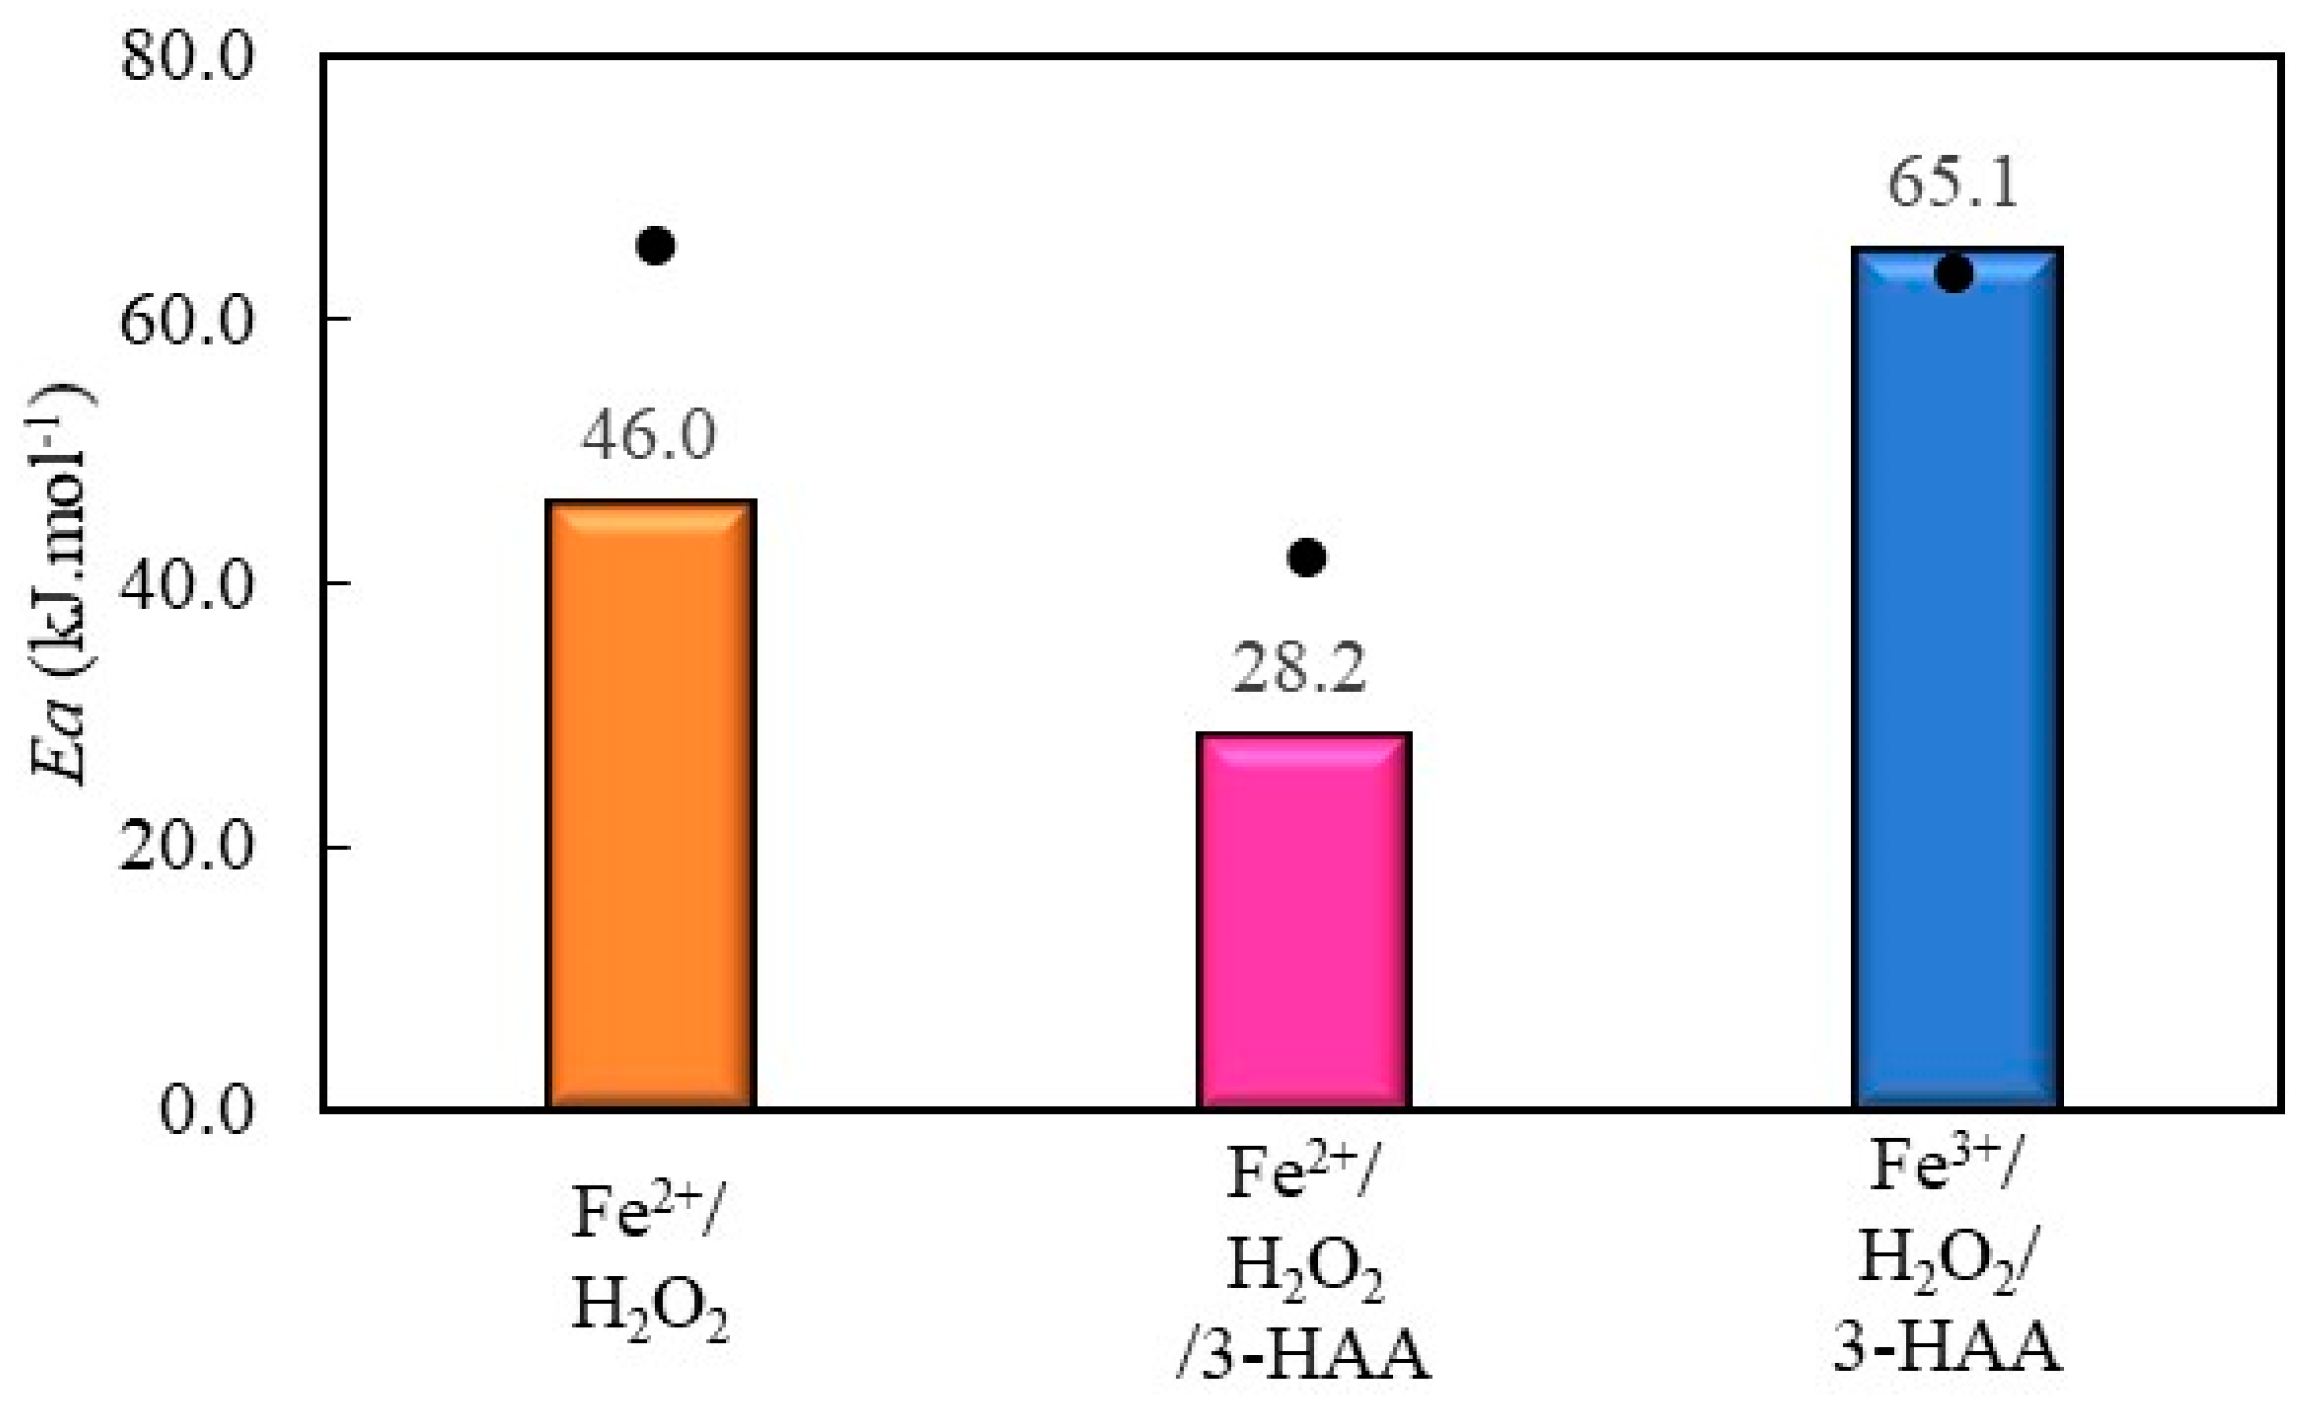
2.2.1. Phenol Red Decolorization by Fenton Processes Mediated by 3 Hydroxyanthranilic Acid
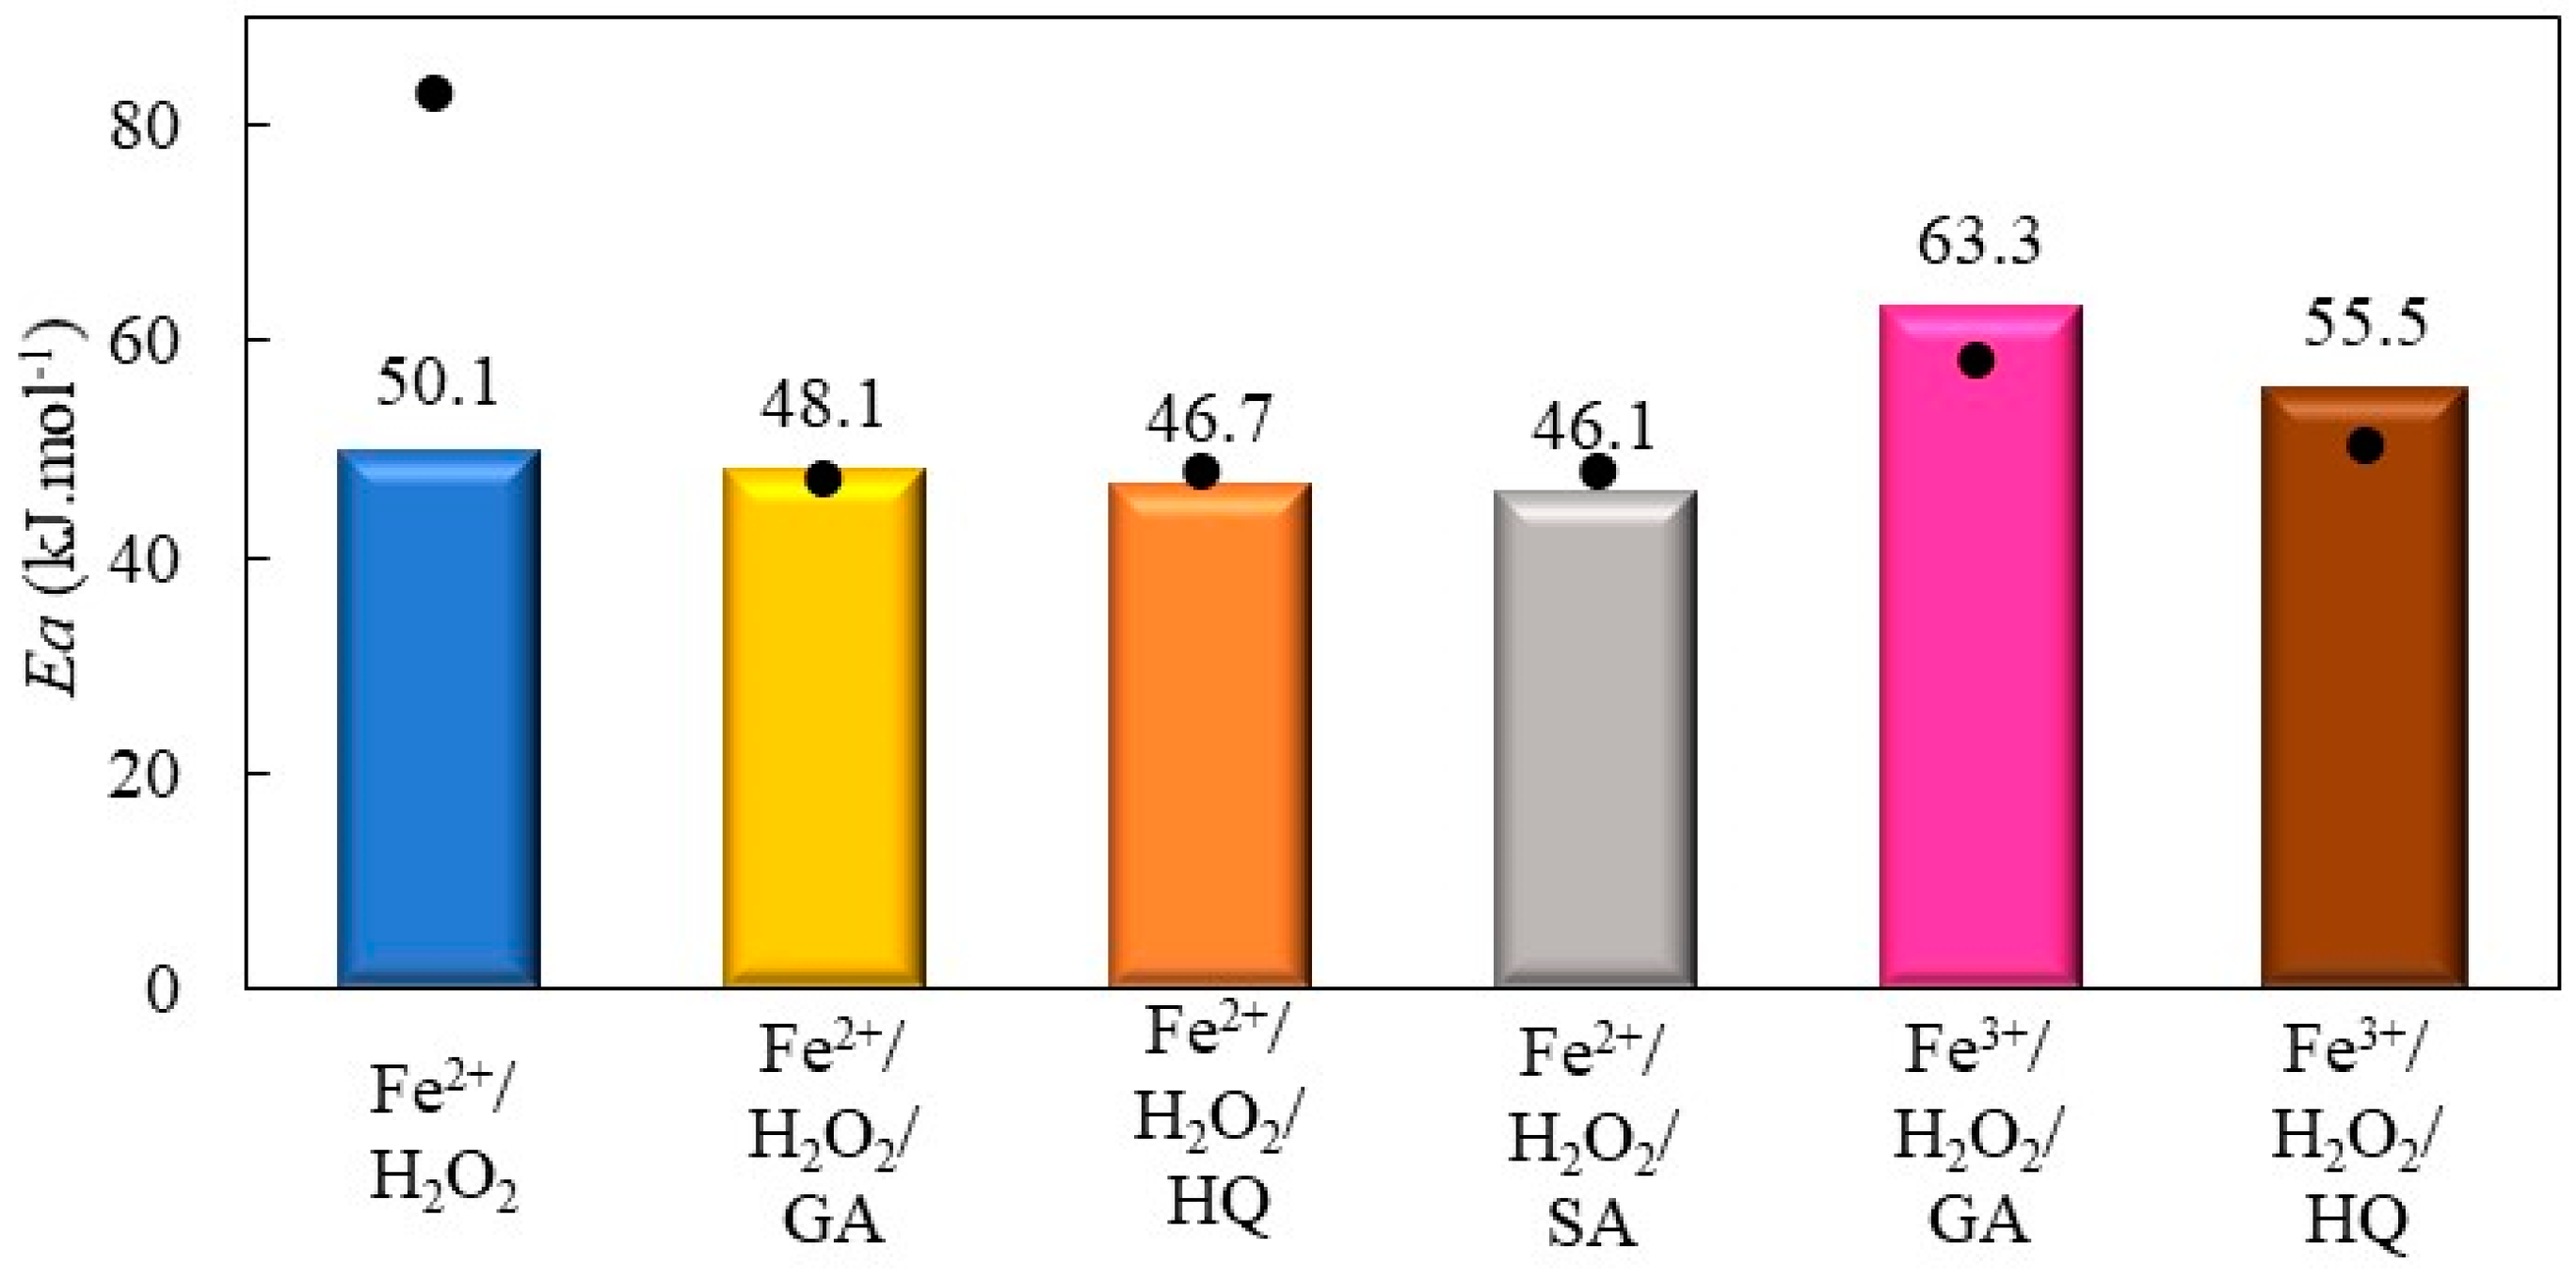
2.2.2. Decolorization of Bismarck Brown Y by Fenton Processes Mediated by Hydroquinone, Gallic Acid, and Salicylic Acid
2.2.3. Decolorization of Safranin T by Fenton Processes Mediated by Cysteine and Ascorbic Acid
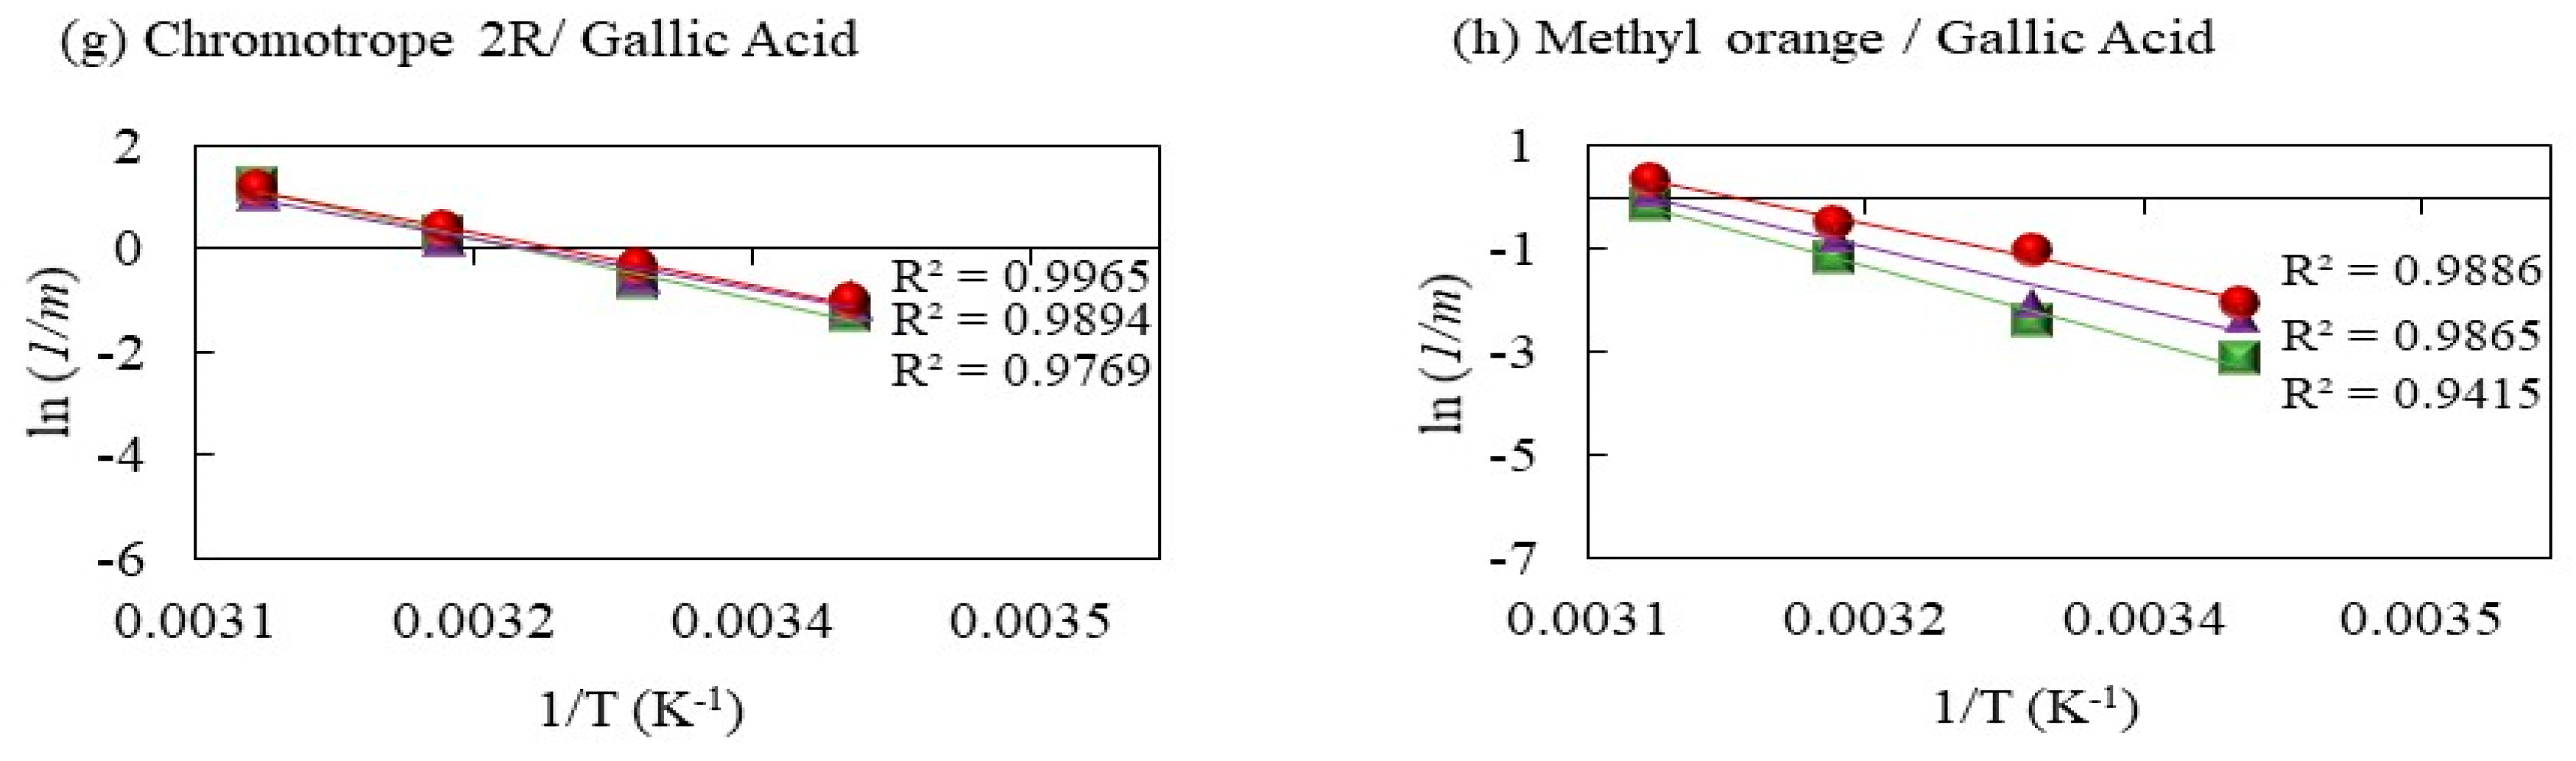
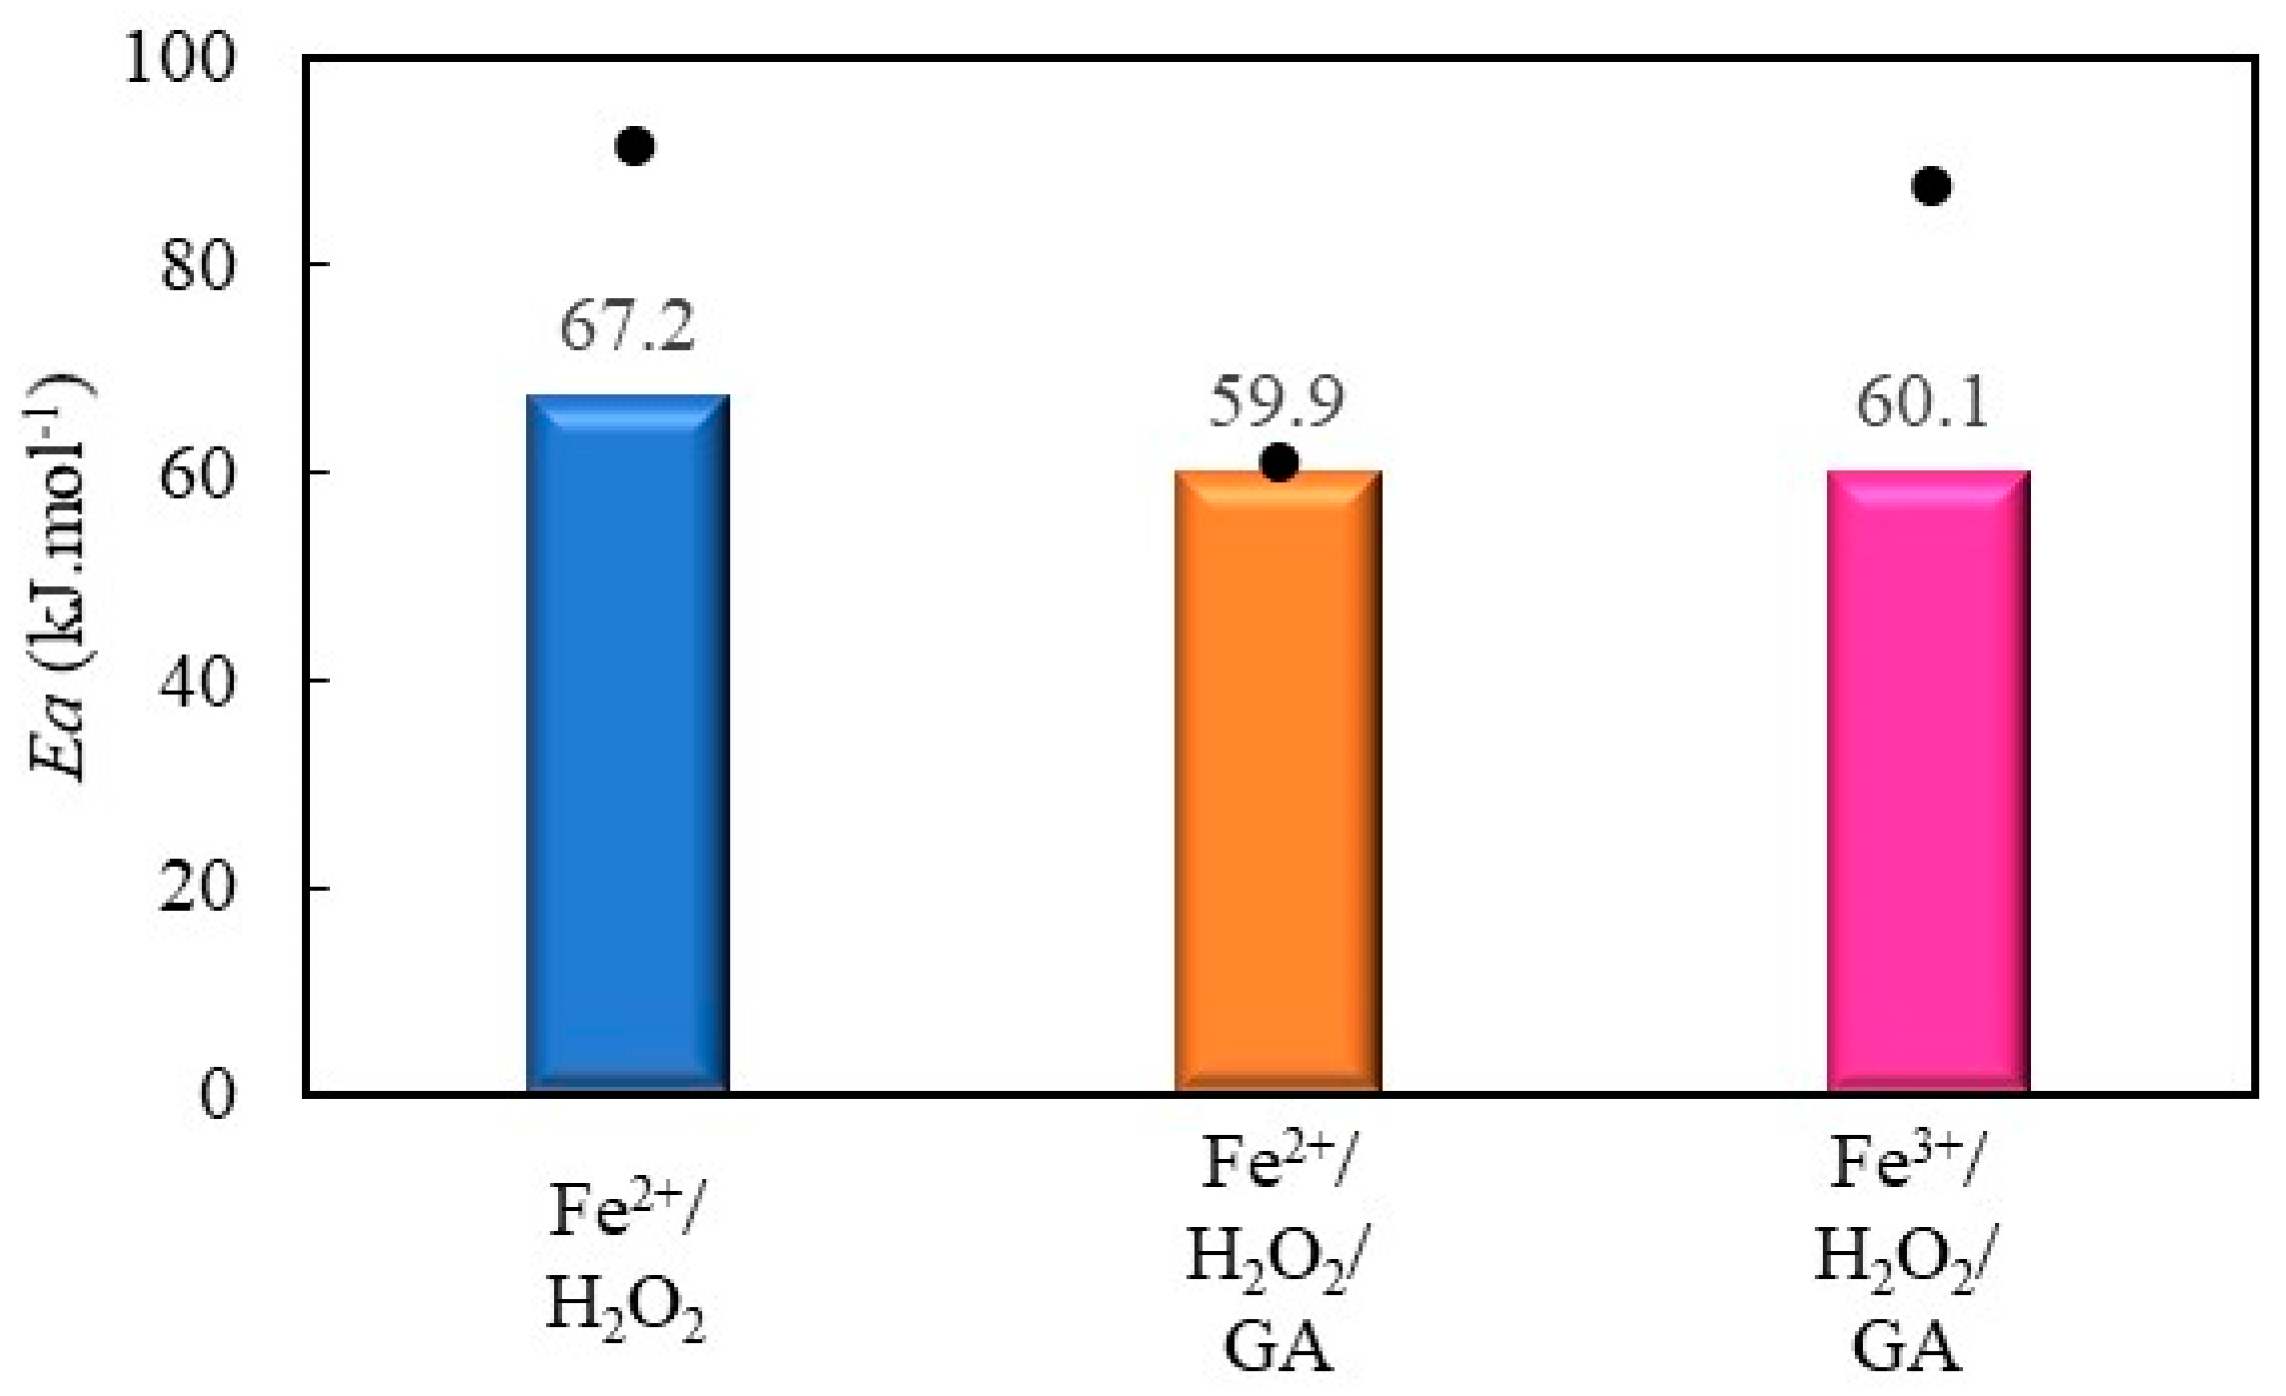
2.2.4. Decolorization of Methyl Orange by Fenton Processes Mediated by Gallic Acid
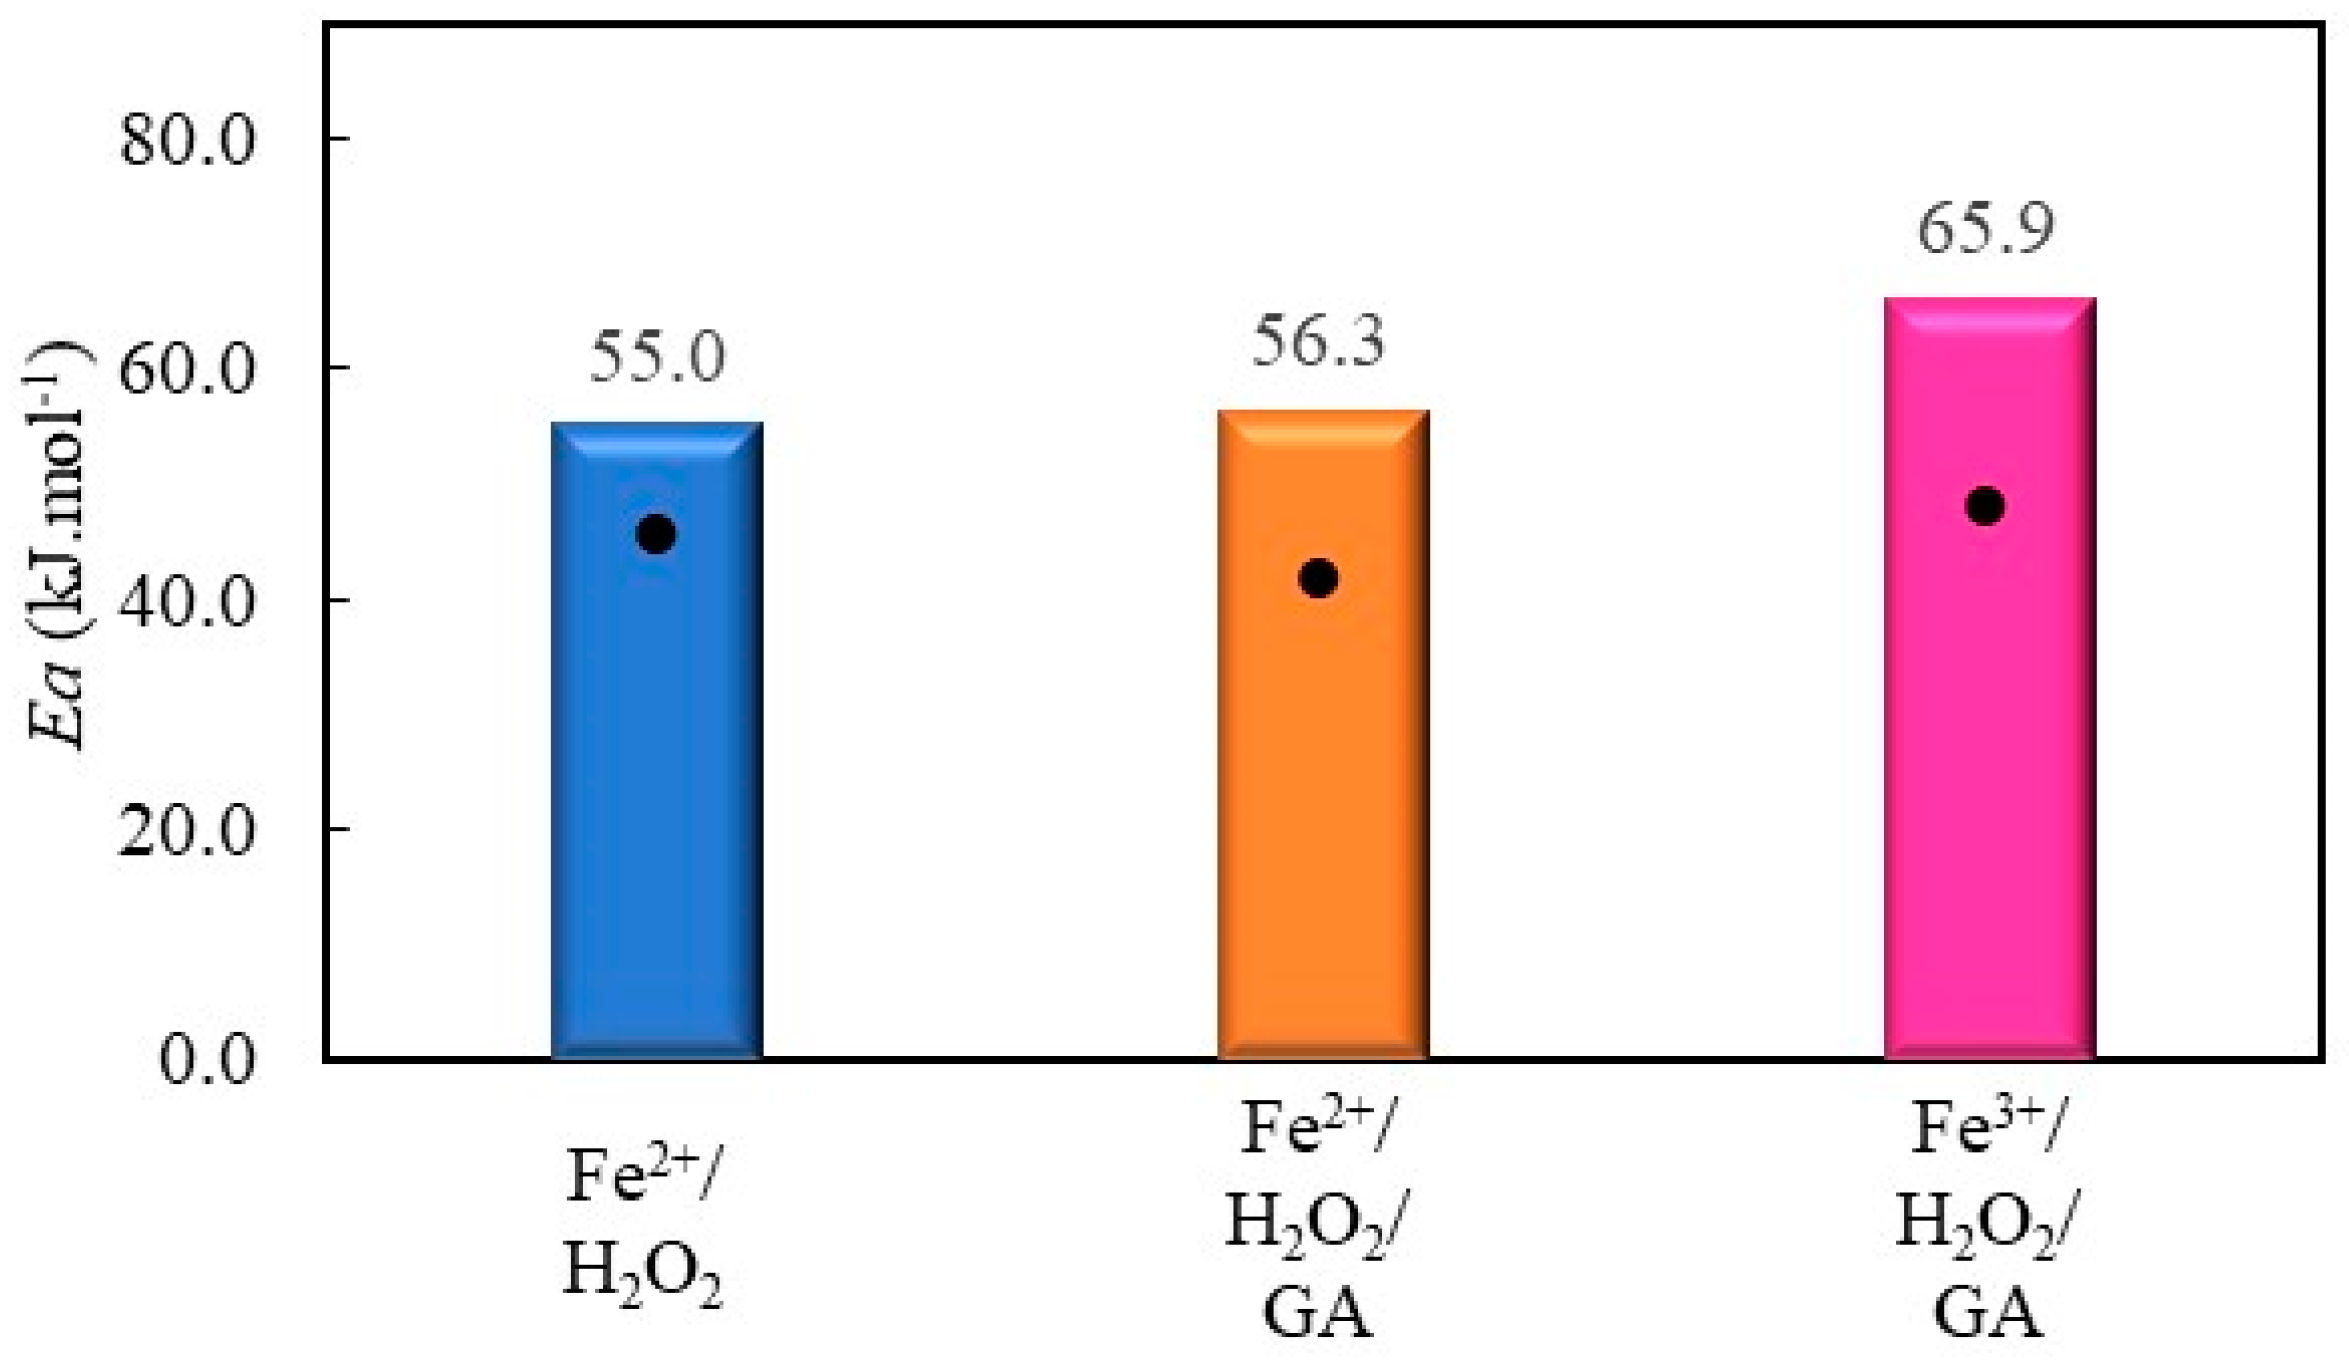
2.2.5. Decolorization of Chromotrope 2R by Gallic Acid-Mediated Fenton Processes
3. Materials and Methods
4. Conclusions
Supplementary Materials
Author Contributions
Funding
Data Availability Statement
Conflicts of Interest
References
- Ramos, M.D.N.; Lima, J.P.P.; Aquino, S.F.; Aguiar, A. A critical analysis of the alternative treatments applied to effluents from Brazilian textile industries. J. Water Process Eng. 2021, 43, 102273. [Google Scholar] [CrossRef]
- Katheresan, V.; Kansedo, J.; Lau, S.Y. Efficiency of various recent wastewater dye removal methods: A review. J. Environ. Chem. Eng. 2018, 6, 4676–4697. [Google Scholar] [CrossRef]
- Kastanek, F.; Spacilova, M.; Krystynik, P.; Dlaskova, M.; Solcova, O. Fenton reaction–unique but still mysterious. Processes 2023, 11, 432. [Google Scholar] [CrossRef]
- Holkar, C.R.; Jadhav, A.J.; Pinjari, D.V.; Mahamuni, N.M.; Pandit, A.B. A critical review on textile wastewater treatments: Possible approaches. J. Environ. Manag. 2016, 182, 351–366. [Google Scholar] [CrossRef] [PubMed]
- Al-Tohamy, R.; Ali, S.S.; Li, F.; Okasha, K.M.; Mahmoud, Y.A.G.; Elsamahy, T.; Jiao, H.; Fu, Y.; Sun, J. A critical review on the treatment of dye-containing wastewater: Ecotoxicological and health concerns of textile dyes and possible remediation approaches for environmental safety. Ecotoxicol. Environ. Saf. 2022, 231, 113160. [Google Scholar] [CrossRef] [PubMed]
- Argun, M.E.; Karatas, M. Application of Fenton process for decolorization of Reactive Black 5 from synthetic wastewater: Kinetics and thermodynamics. Environ. Prog. Sustain. Energy 2011, 30, 540–548. [Google Scholar] [CrossRef]
- Tony, M.A.; Mansour, S.A. Removal of the commercial reactive dye Procion Blue MX-7RX from real textile wastewater using the synthesized Fe2O3 nanoparticles at different particle sizes as a source of Fenton’s reagent. Nanoscale Adv. 2019, 1, 1362. [Google Scholar] [CrossRef] [PubMed]
- Li, Y.; Cheng, H. Chemical kinetic modeling of organic pollutant degradation in Fenton and solar photo-Fenton processes. J. Taiwan Inst. Chem. Eng. 2021, 123, 175–184. [Google Scholar] [CrossRef]
- Kamenická, B.; Weidlich, T. A Comparison of different reagents applicable for destroying halogenated anionic textile dye Mordant Blue 9 in polluted aqueous streams. Catalysts 2023, 13, 460. [Google Scholar] [CrossRef]
- Aguiar, A.; Ferraz, A. Fe3+- and Cu2+-reduction by phenol derivatives associated with Azure B degradation in Fenton-like reactions. Chemosphere 2007, 66, 947–954. [Google Scholar] [CrossRef]
- Zhang, M.H.; Dong, H.; Zhao, L.; Wang, D.X.; Meng, D. A review on Fenton process for organic wastewater treatment based on optimization perspective. Sci. Total Environ. 2019, 670, 110–121. [Google Scholar] [CrossRef]
- Ramos, M.D.N.; Santana, C.S.; Velloso, C.C.V.; Silva, A.H.M.; Magalhães, F.; Aguiar, A. A review on the treatment of textile industry effluents through Fenton processes. Process Saf. Environ. Prot. 2021, 155, 366–386. [Google Scholar] [CrossRef]
- Bello, M.M.; Abdul, R.; Abdul, A.; Asghar, A. A review on approaches for addressing the limitations of Fenton oxidation for recalcitrant wastewater treatment. Process Saf. Environ. Prot. 2019, 126, 119–140. [Google Scholar] [CrossRef]
- Chen, F.; Ma, W.; He, J.; Zhao, J. Fenton degradation of malachite green catalyzed by aromatic additives. J. Phys. Chem. A 2002, 106, 9485–9490. [Google Scholar] [CrossRef]
- Pan, Y.; Qin, R.; Hou, M.; Xue, J.; Zhou, M.; Xu, L.; Zhang, Y. The interactions of polyphenols with Fe and their application in Fenton/Fenton-like reactions. Sep. Purif. Technol. 2022, 300, 121831. [Google Scholar] [CrossRef]
- Farooq, U.; Wang, F.; Shang, J.; Shahid, M.Z.; Akram, W.; Wang, X. Heightening effects of cysteine on degradation of trichloroethylene in Fe3+/SPC process. Chem. Eng. J. 2023, 454, 139996. [Google Scholar] [CrossRef]
- Han, X.; Wang, N.; Zhang, W.; Liu, X.; Yu, Q.; Lei, J.; Zhou, L.; Xiu, G. Ascorbic acid promoted sulfamethoxazole degradation in MIL-88B (Fe)/H2O2 Fenton-like system. J. Environ. Chem. Eng. 2023, 11, 109144. [Google Scholar] [CrossRef]
- Sun, H.; Xie, G.; He, D.; Zhang, L. Ascorbic acid promoted magnetite Fenton degradation of alachlor: Mechanistic insights and kinetic modeling. Appl. Catal. B Environ. 2020, 267, 118383. [Google Scholar] [CrossRef]
- Yuan, Y.; Chen, S.; Yao, B.; Chen, A.; Peng, L.; Luo, S.; Zhou, Y. Fe3+-cysteine enhanced persulfate Fenton-like process for quinclorac degradation: A wide pH tolerance and reaction mechanism. Environ. Res. 2023, 224, 115447. [Google Scholar] [CrossRef] [PubMed]
- Santana, C.S.; Ramos, M.D.N.; Velloso, C.C.V.; Aguiar, A. Kinetic evaluation of dye decolorization by Fenton processes in the presence of 3-hydroxyanthranilic acid. Int. J. Environ. Res. Public Health 2019, 16, 1602. [Google Scholar] [CrossRef] [PubMed]
- Tabelini, C.H.B.; Lima, J.P.P.; Aguiar, A. Gallic acid influence on azo dyes oxidation by Fenton processes. Environ. Technol. 2022, 43, 3390–3940. [Google Scholar] [CrossRef]
- Ramos, M.D.N.; Sousa, L.A.; Aguiar, A. Effect of cysteine using Fenton processes on decolorizing different dyes: A kinetic study. Environ. Technol. 2022, 43, 70–82. [Google Scholar] [CrossRef] [PubMed]
- Ramos, M.D.N.; Silva, G.L.S.; Lessa, T.L.; Aguiar, A. Study of kinetic parameters related to dyes oxidation in ascorbic acid-mediated Fenton processes. Process Saf. Environ. Prot. 2022, 168, 1131–1141. [Google Scholar] [CrossRef]
- Lima, J.P.P.; Tabelini, C.H.B.; Ramos, M.D.N.; Aguiar, A. Kinetic evaluation of Bismarck Brown Y azo dye oxidation by Fenton processes in the presence of aromatic mediators. Wat. Air Soil Pollut. 2021, 232, 321. [Google Scholar] [CrossRef]
- Chan, K.H.; Chu, W. Modeling the reaction kinetics of Fenton’s process on the removal of atrazine. Chemosphere 2003, 51, 305–311. [Google Scholar] [CrossRef] [PubMed]
- Behnajady, M.A.; Modirshahla, N.; Ghanbary, F. A kinetic model for the decolorization of C.I. Acid Yellow 23 by Fenton process. J. Hazard Mater. 2007, 148, 98–102. [Google Scholar] [CrossRef] [PubMed]
- Tunç, S.; Duman, O.; Gürkan, T. Monitoring the decolorization of Acid Orange 8 and Acid Red 44 from aqueous solution using Fenton’s reagents by online spectrophotometric method: Effect of operation parameters and kinetic study. Ind. Eng. Chem. Res. 2013, 52, 1414–1425. [Google Scholar] [CrossRef]
- Ou, X.; Wang, C.; Zhang, F.; Sun, H.; Wu, Y. Degradation of methyl violet by Fenton’s reagent: Kinetic modeling and effects of parameters. Desalin. Water Treat. 2013, 51, 2536–2542. [Google Scholar] [CrossRef]
- León, G.; Miguel, B.; Manzanares, L.; Saavedra, M.I.; Guzmán, M.A. Kinetic study of the ultrasound effect on Acid Brown 83 dye degradation by hydrogen peroxide oxidation processes. ChemEngineering 2021, 5, 52. [Google Scholar] [CrossRef]
- Li, F.; Choong, T.S.Y.; Soltani, S.; Abdullah, L.C.; Jamil, M.; Ain, S.N. Kinetic study of Fenton-like degradation of methylene blue in aqueous solution using calcium peroxide. Pertanika J. Sci. Technol. 2022, 30, 1087–1102. [Google Scholar] [CrossRef]
- Kumar, J.E.; Mulai, T.; Kharmawphlang, W.; Sharan, R.N.; Sahoo, M.K. The efficiency of Fenton, Fenton/MW and UV/oxidant processes in the treatment of a mixture of higher concentrations of azo dyes. Chem. Eng. J. Adv. 2023, 15, 100515. [Google Scholar] [CrossRef]
- Xu, H.Y.; Shi, T.N.; Wu, L.C.; Qi, S.Y. Discoloration of methyl orange in the presence of schorl and H2O2: Kinetics and mechanism. Wat. Air Soil Pollut. 2013, 224, 1740. [Google Scholar] [CrossRef]
- Levenspiel, O. Chemical Reaction Engineering, 3rd ed.; Wiley: Hoboken, NJ, USA, 1998. [Google Scholar]
- Santos, M.S.F.; Alves, A.; Madeira, L.M. Paraquat removal from water by oxidation with Fenton’s reagent. J. Chem. Eng. 2011, 175, 279–290. [Google Scholar] [CrossRef]
- Zazo, J.A.; Pliego, G.; Blasco, S.; Casas, J.A.; Rodriguez, J.J. Intensification of the Fenton process by increasing the temperature. Ind. Eng. Chem. Res. 2011, 50, 866–870. [Google Scholar] [CrossRef]
- Carbajo, J.; Silveira, J.E.; Pliego, G.; Zazo, J.A.; Casas, J.A. Increasing Photo-Fenton process Efficiency: The effect of high temperatures. Sep. Purif. Technol. 2021, 271, 118876. [Google Scholar] [CrossRef]
- Xu, H.; Yu, T.; Wang, J.; Wu, F.; Xu, A. Kinetics study of Fenton degradation of acid yellow g by online spectrometry technology. Nat. Environ. Pollut. Technol. 2016, 15, 991–996. [Google Scholar]
- Bouasla, C.; Ismail, F.; Samar, M.E.H. Effects of operator parameters, anions and cations on the degradation of AY99 in an aqueous solution using Fenton’s reagent. Optimization and kinetics study. Int. J. Ind. Chem. 2012, 3, 15. [Google Scholar] [CrossRef]
- Arts, A.; Schmuhl, R.; de Groot, M.T.; van der Schaaf, J. Fast initial oxidation of formic acid by the Fenton reaction under industrial conditions. J. Water Process Eng. 2021, 40, 101780. [Google Scholar] [CrossRef]
- Akram, M.; Chakrabarti, S. Mechanism and kinetic model of the oxidative degradation of Rhodamine B dye in aqueous solution by ultrasound-assisted Fenton’s process. Int. J. Environ. Waste Manag. 2022, 29, 80–94. [Google Scholar] [CrossRef]
- Kumar, V.; Pandey, N.; Dharmadhikari, S.; Ghosh, P. Degradation of mixed dye via heterogeneous Fenton process: Studies of calcination, toxicity evaluation, and kinetics. Water Environ. Res. 2019, 92, 211–221. [Google Scholar] [CrossRef] [PubMed]
- Göçenoğlu, A.; Pazarlioglu, N. Cinnabarinic acid: Enhanced production from Pycnoporus cinnabarinus, characterization, structural and functional properties. Hacet. J. Biol. Chem. 2014, 42, 281–290. [Google Scholar] [CrossRef]
- Takagi, H.; Ohtsu, I. L-Cysteine metabolism and fermentation in microorganisms. In Amino Acid Fermentation; Yokota, A., Ikeda, M., Eds.; Springer: Tokyo, Japan, 2017; pp. 129–151. [Google Scholar]
- Li, T.; Zhao, Z.; Wang, Q.; Xie, P.; Ma, J. Strongly enhanced Fenton degradation of organic pollutants by cysteine: An aliphatic amino acid accelerator outweighs hydroquinone analogues. Water Res. 2016, 105, 479–486. [Google Scholar] [CrossRef] [PubMed]
- Bremus, C.; Herrmann, U.; Bringer-Meyer, S.; Sahm, H. The use of microorganisms in L-ascorbic acid production. J. Biotech. 2006, 124, 196–205. [Google Scholar] [CrossRef] [PubMed]
- Bolobajev, J.; Trapido, M.; Goi, A. Improvement in iron activation ability of alachlor Fenton-like oxidation by ascorbic acid. J. Chem. Eng. 2015, 281, 566–574. [Google Scholar] [CrossRef]
- Lima, J.P.P.; Tabelini, C.H.B.; Aguiar, A. A Review of gallic acid-mediated Fenton processes for degrading emerging pollutants and dyes. Molecules 2023, 28, 1166. [Google Scholar] [CrossRef] [PubMed]
- Abdelmalek, F.; Ghezzar, M.R.; Belhajd, M.; Addou, A.; Brisset, J. Bleaching and degradation of textile dyes by nonthermal plasma process at atmospheric pressure. Ind. Eng. Chem. Res. 2006, 45, 23–29. [Google Scholar] [CrossRef]
- Magureanu, M.; Mandache, N.B.; Parvulescu, V.I. Degradation of organic dyes in water by electrical discharges. Plasma Chem. Plasma Process 2007, 27, 589–598. [Google Scholar] [CrossRef]
- Sousa, J.L.; Aguiar, A. Influence of aromatic additives on Bismarck Brown Y dye color removal treatment by Fenton processes. Environ. Sci. Pollut. Res. 2017, 24, 26734–26743. [Google Scholar] [CrossRef] [PubMed]


| [Dye] | Dye’s Chemical Structure | λmax (nm) | [H2O2] (μmol·L−1) | [FeSO4] or [Fe(NO3)3] (μmol·L−1) | [H2SO4] (mmol·L−1) | [Reducer] | Reducer’s Chemical Structure | Reference |
|---|---|---|---|---|---|---|---|---|
| 30 μmol·L−1 Phenol red |  | 435 | 300 | 30 | 1 | 10 μmol·L−1 3-Hydroxyanthranilic Acid |  | [20] |
| 30 μmol·L−1 Bismarck Brown Y |  | 450 | 450 | 30 | 1 | 10 μmol·L−1 Hydroquinone | 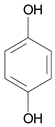 | [24] |
| 10 μmol·L−1 Gallic Acid |  | |||||||
| 10 μmol·L−1 Salicylic Acid |  | |||||||
| 40 μmol·L−1 Safranin T | 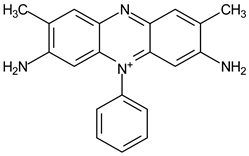 | 519 | 300 | 30 | 1 | 10 μmol·L−1 Cysteine | 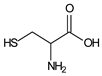 | [22] |
| 10 μmol·L−1 Ascorbic Acid |  | [23] | ||||||
| 40 μmol·L−1 Methyl Orange |  | 508 | 450 | 30 | 1 | 10 μmol·L−1 Gallic Acid | 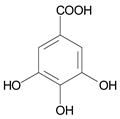 | [21] |
| 40 μmol·L−1 Chromotrope 2R |  | 513 |
Disclaimer/Publisher’s Note: The statements, opinions and data contained in all publications are solely those of the individual author(s) and contributor(s) and not of MDPI and/or the editor(s). MDPI and/or the editor(s) disclaim responsibility for any injury to people or property resulting from any ideas, methods, instructions or products referred to in the content. |
© 2024 by the authors. Licensee MDPI, Basel, Switzerland. This article is an open access article distributed under the terms and conditions of the Creative Commons Attribution (CC BY) license (https://creativecommons.org/licenses/by/4.0/).
Share and Cite
Ramos, M.D.N.; Lima, J.P.P.; Aguiar, A. Determination of Activation Energy from Decolorization Reactions of Synthetic Dyes by Fenton Processes Using the Behnajady–Modirshahla–Ghanbary Kinetic Model. Catalysts 2024, 14, 273. https://doi.org/10.3390/catal14040273
Ramos MDN, Lima JPP, Aguiar A. Determination of Activation Energy from Decolorization Reactions of Synthetic Dyes by Fenton Processes Using the Behnajady–Modirshahla–Ghanbary Kinetic Model. Catalysts. 2024; 14(4):273. https://doi.org/10.3390/catal14040273
Chicago/Turabian StyleRamos, Márcio Daniel Nicodemos, Juan Pablo Pereira Lima, and André Aguiar. 2024. "Determination of Activation Energy from Decolorization Reactions of Synthetic Dyes by Fenton Processes Using the Behnajady–Modirshahla–Ghanbary Kinetic Model" Catalysts 14, no. 4: 273. https://doi.org/10.3390/catal14040273