
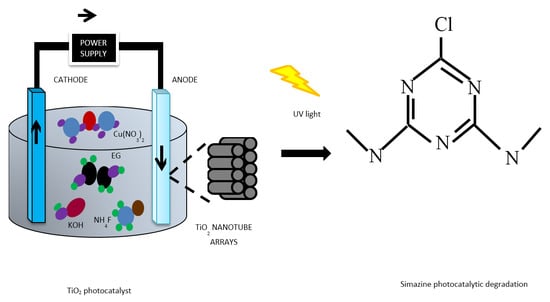
TiO2 Nanotubes Supported Cu Nanoparticles for Improving Photocatalytic Degradation of Simazine under UV Illumination

 ,
,
Abstract
:
1. Introduction
2. Results and Discussion
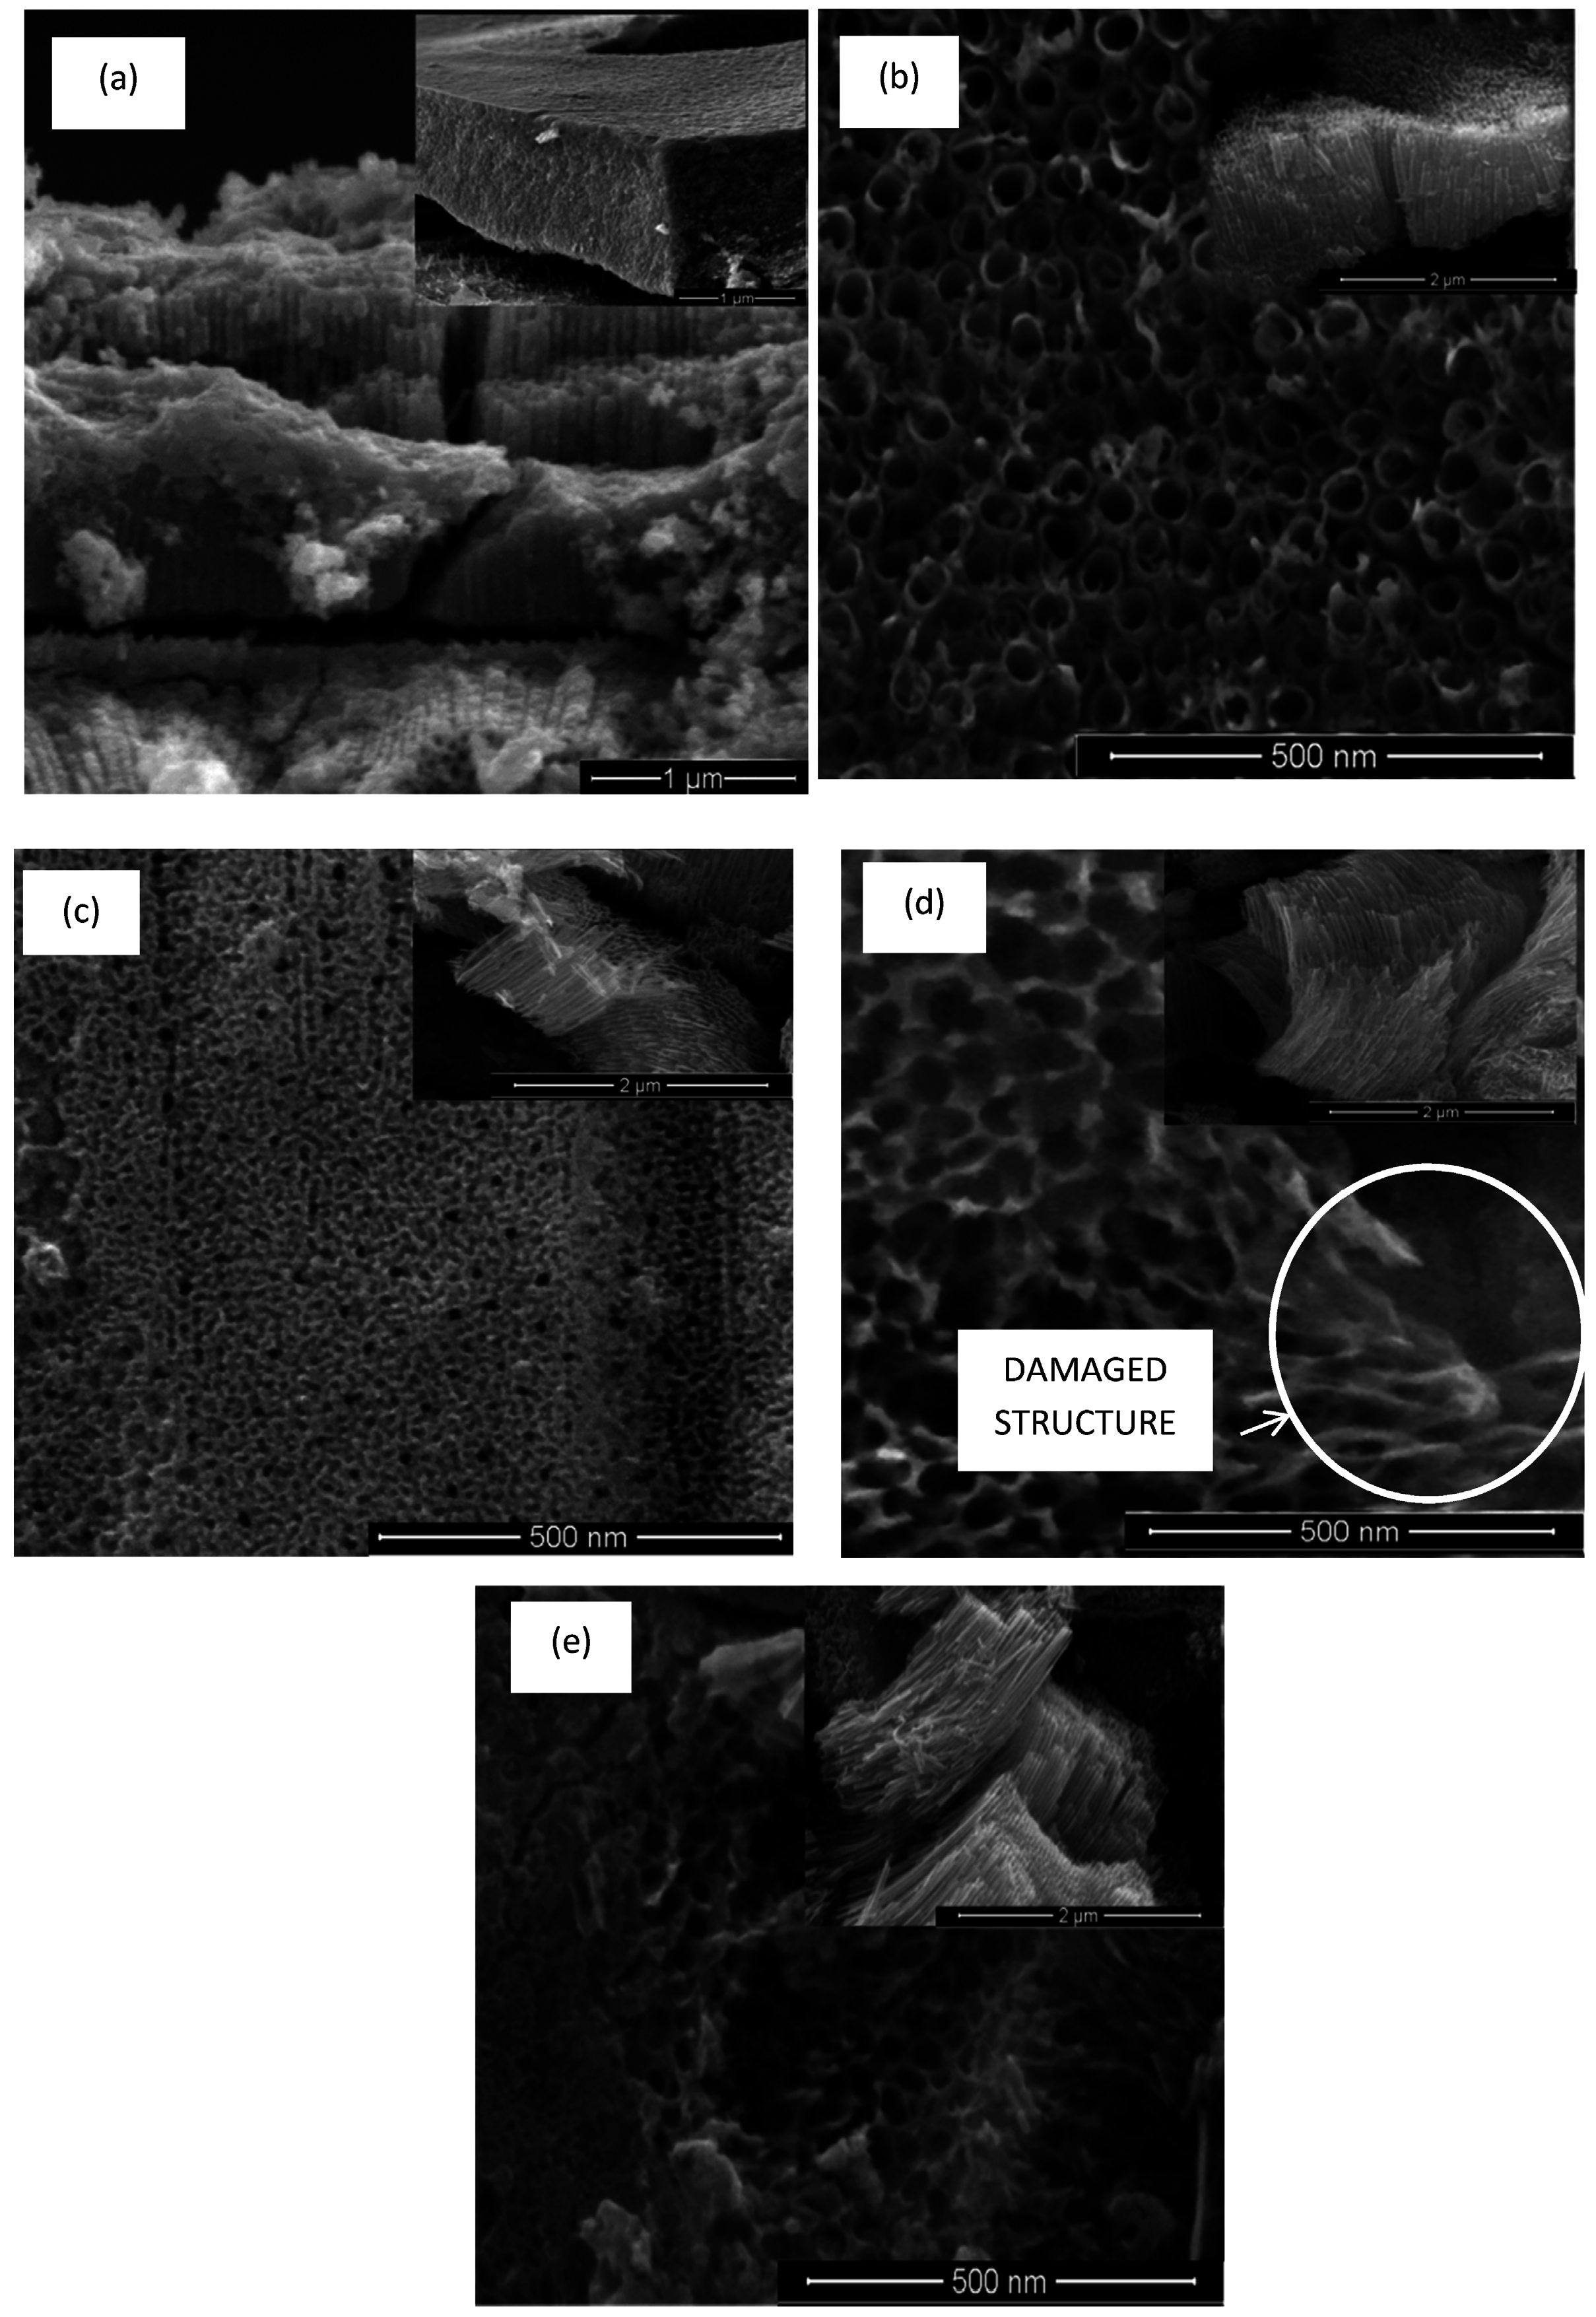
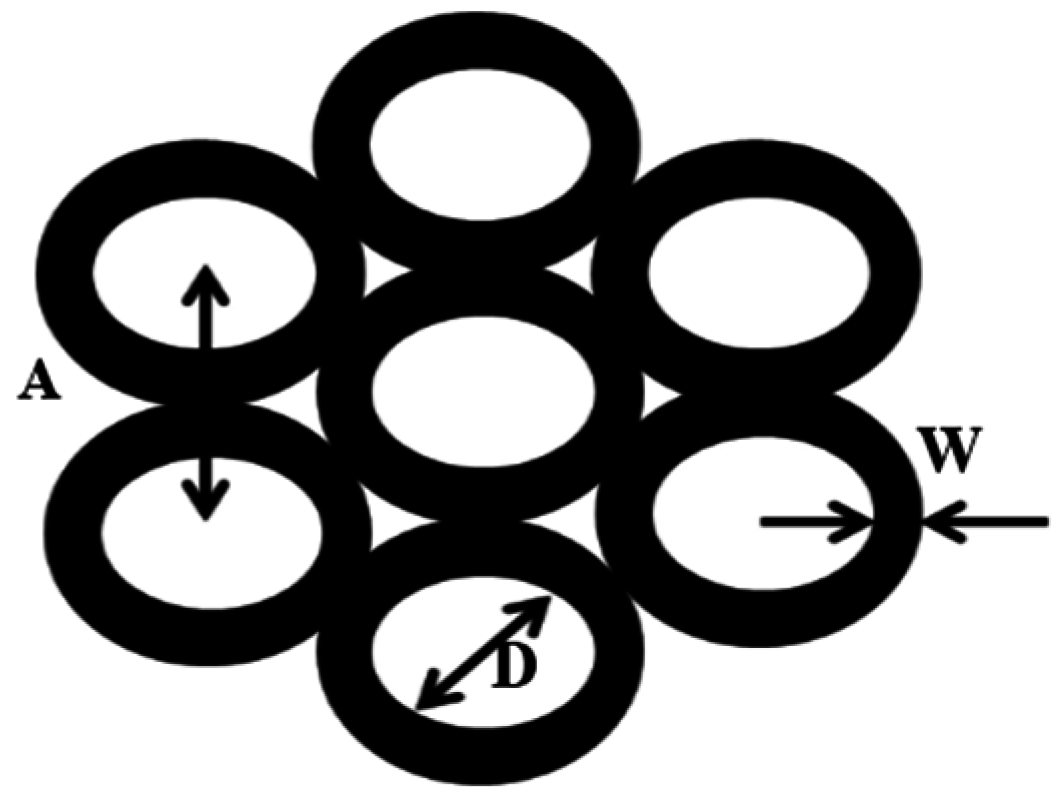
2.1. SEM Analysis
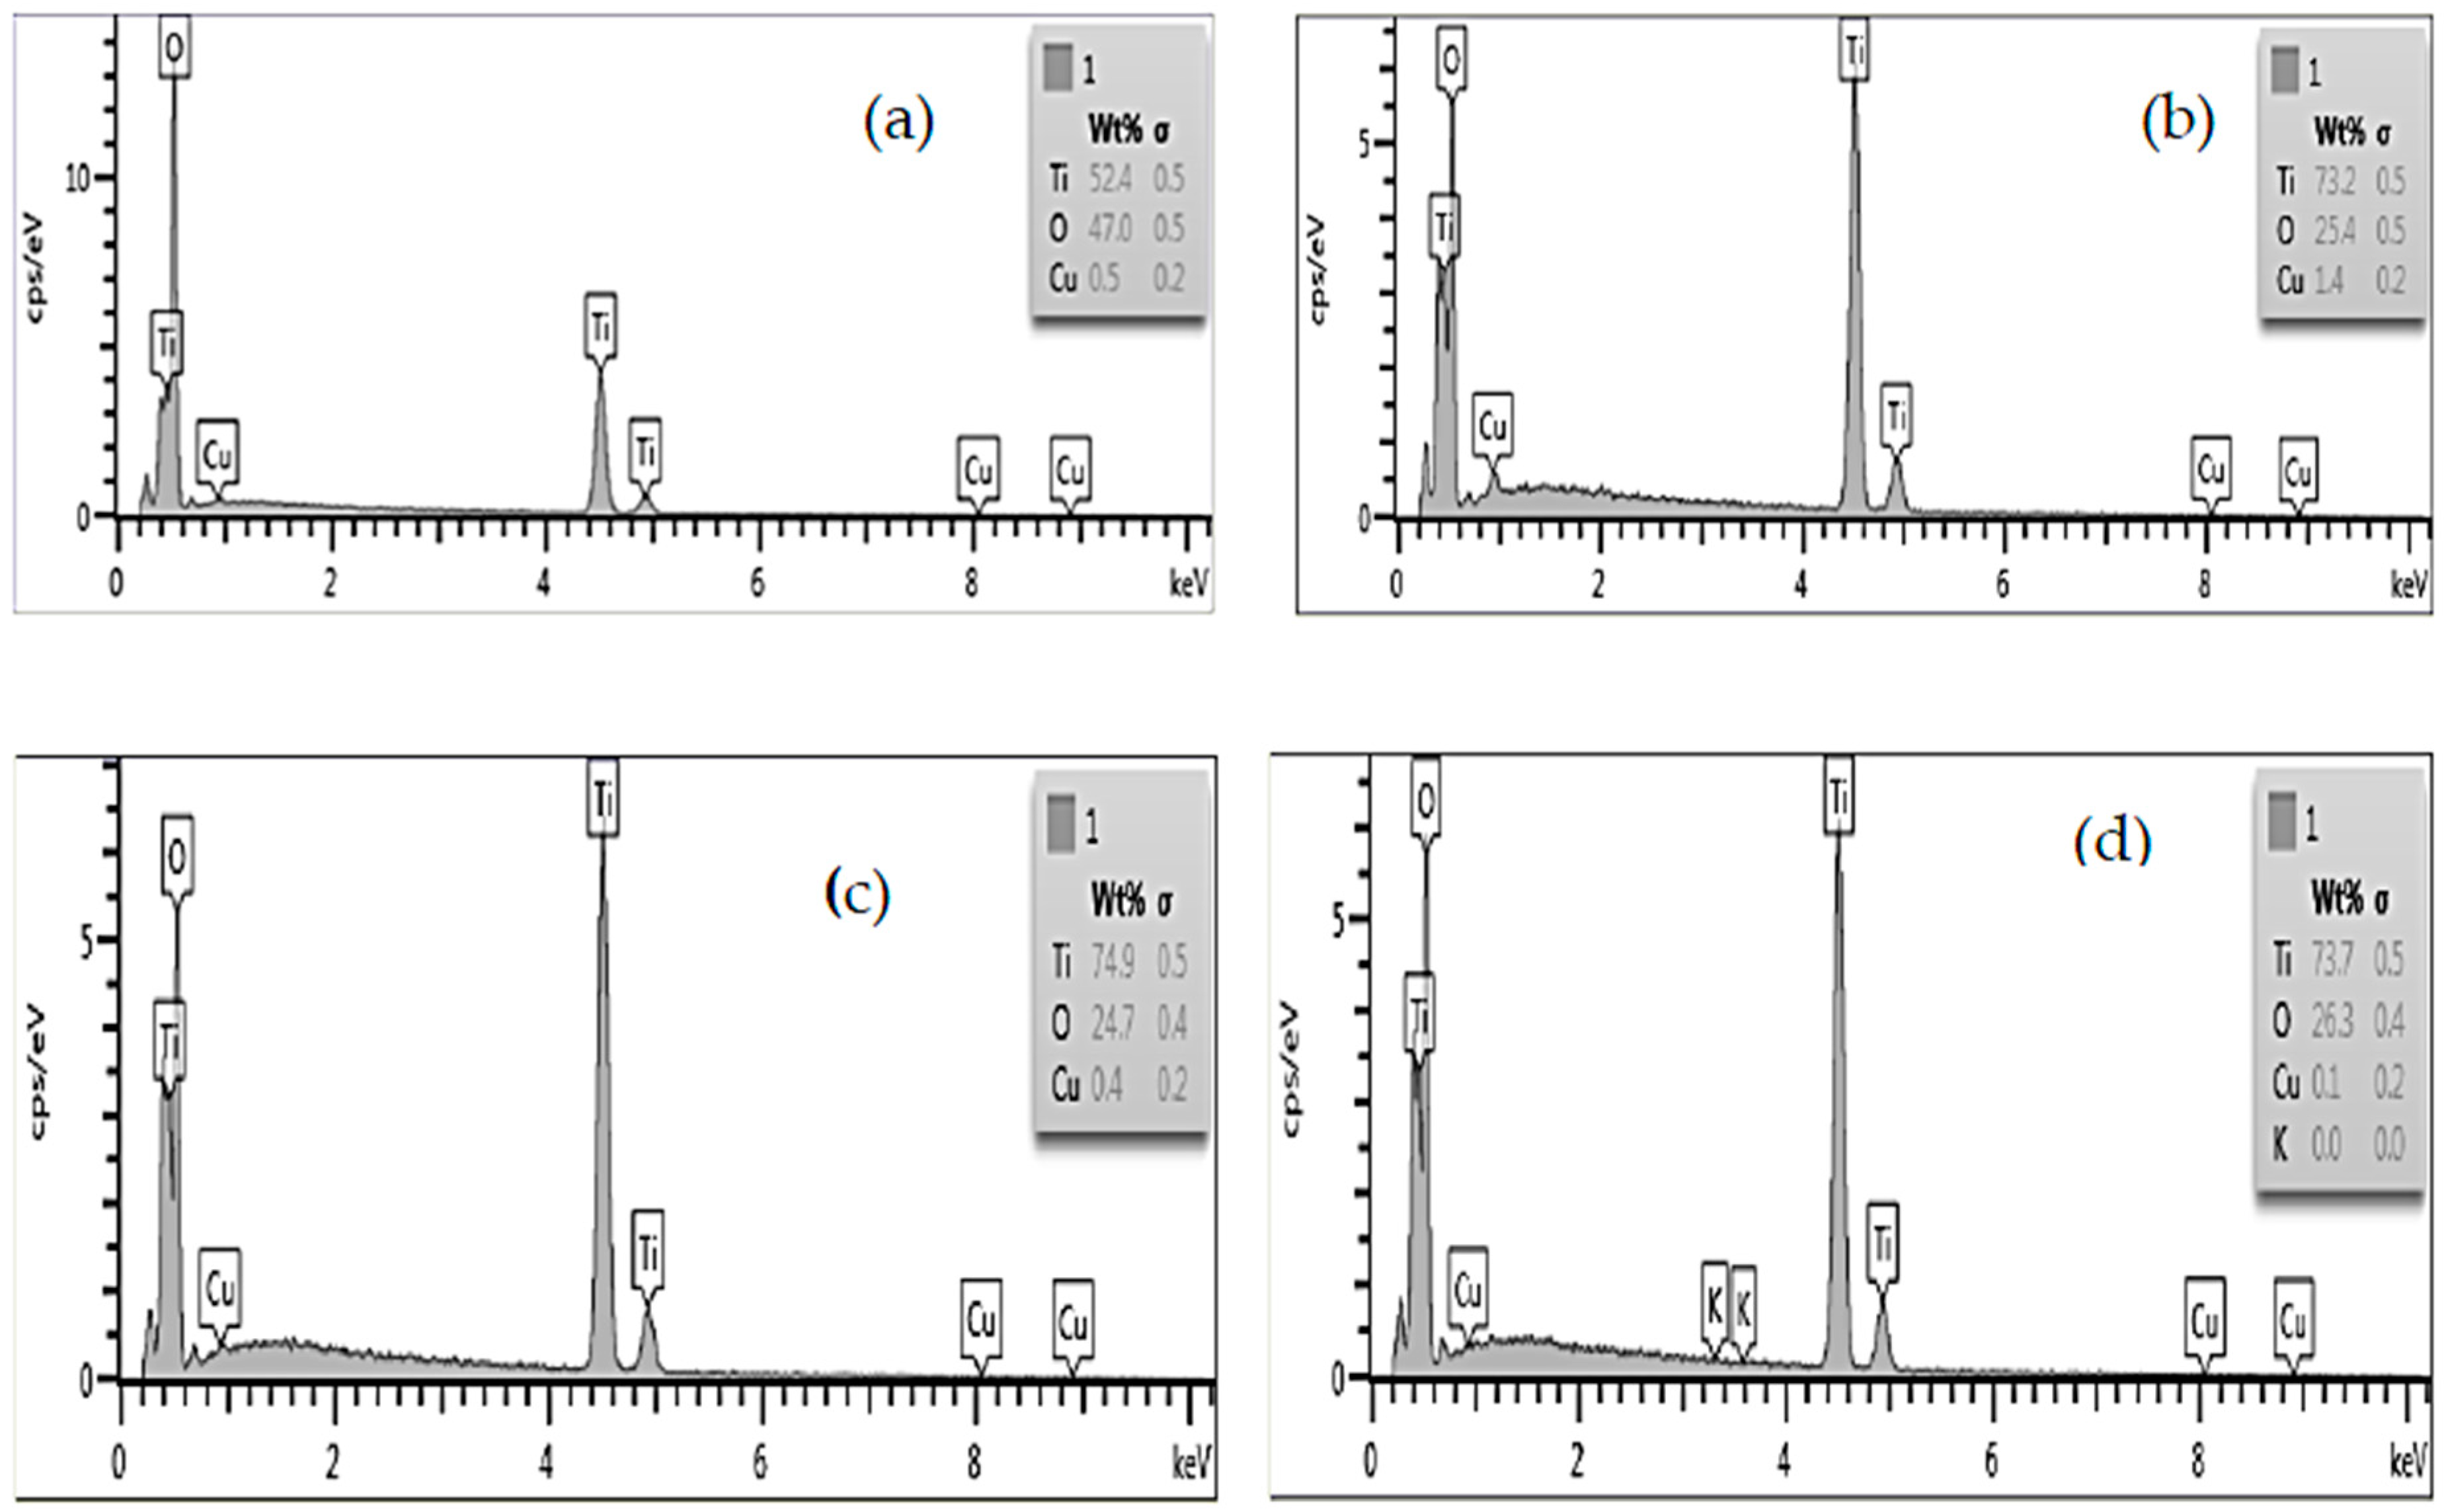
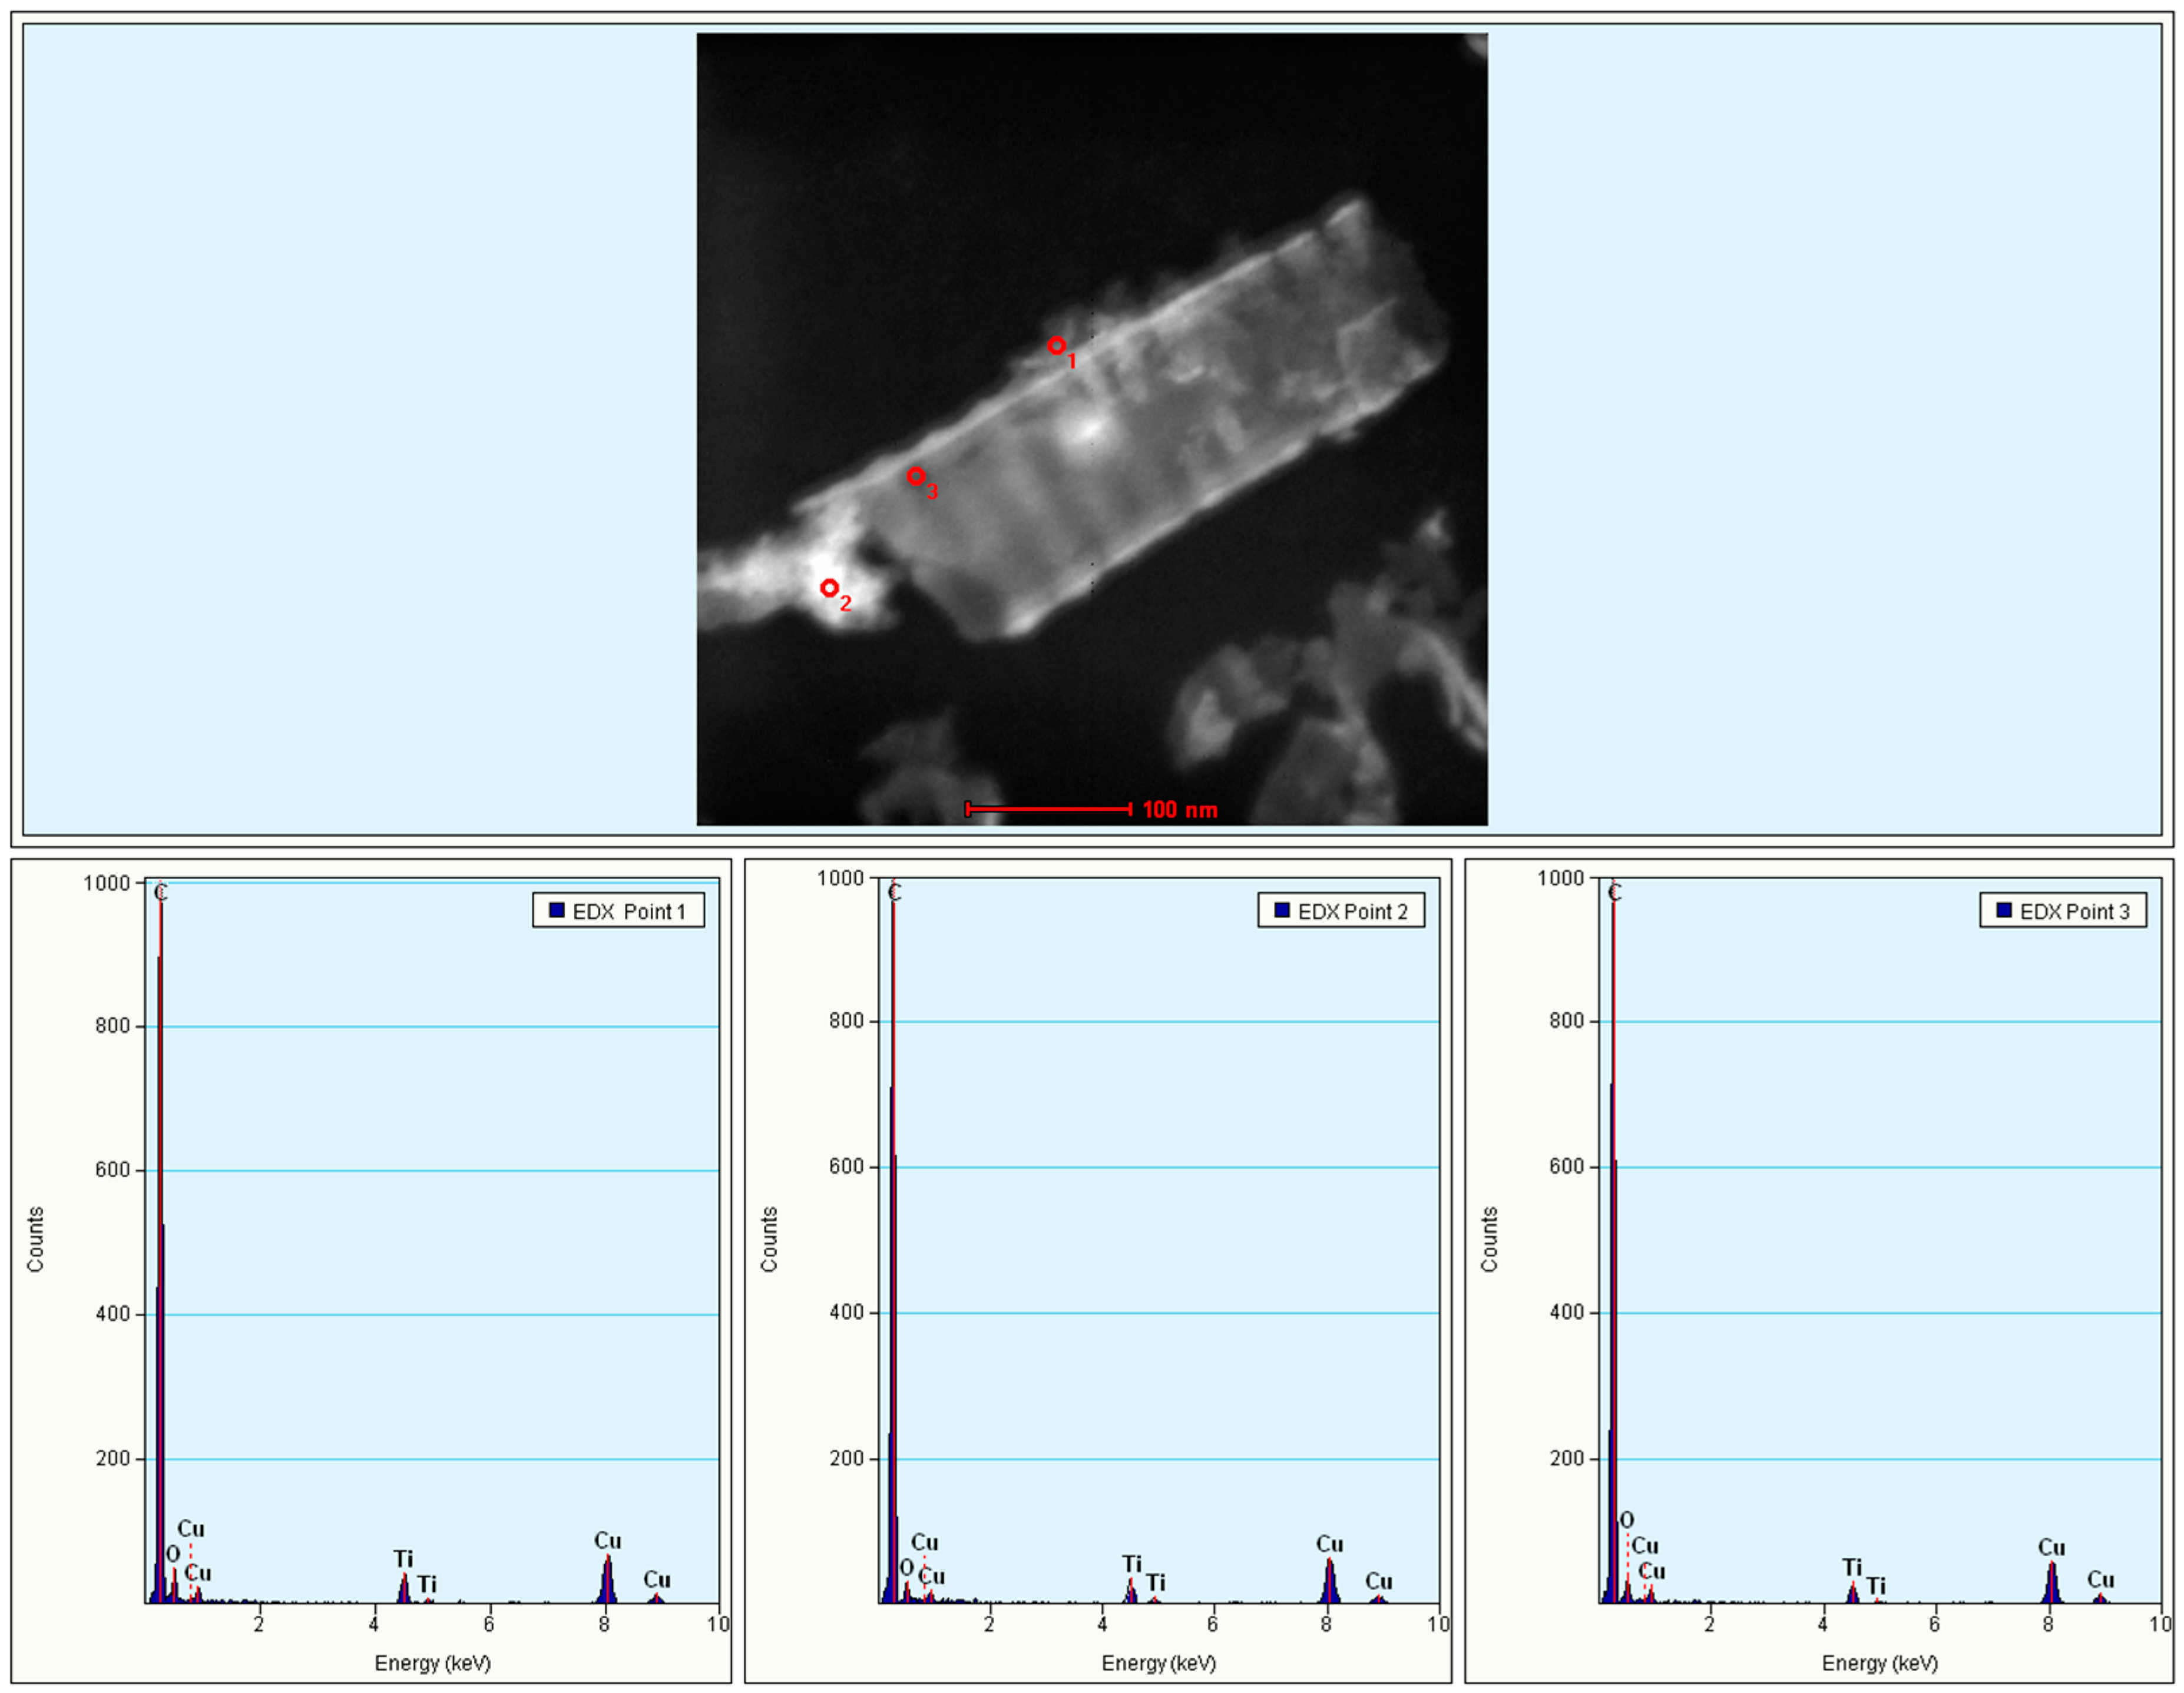
2.2. Elemental Analysis
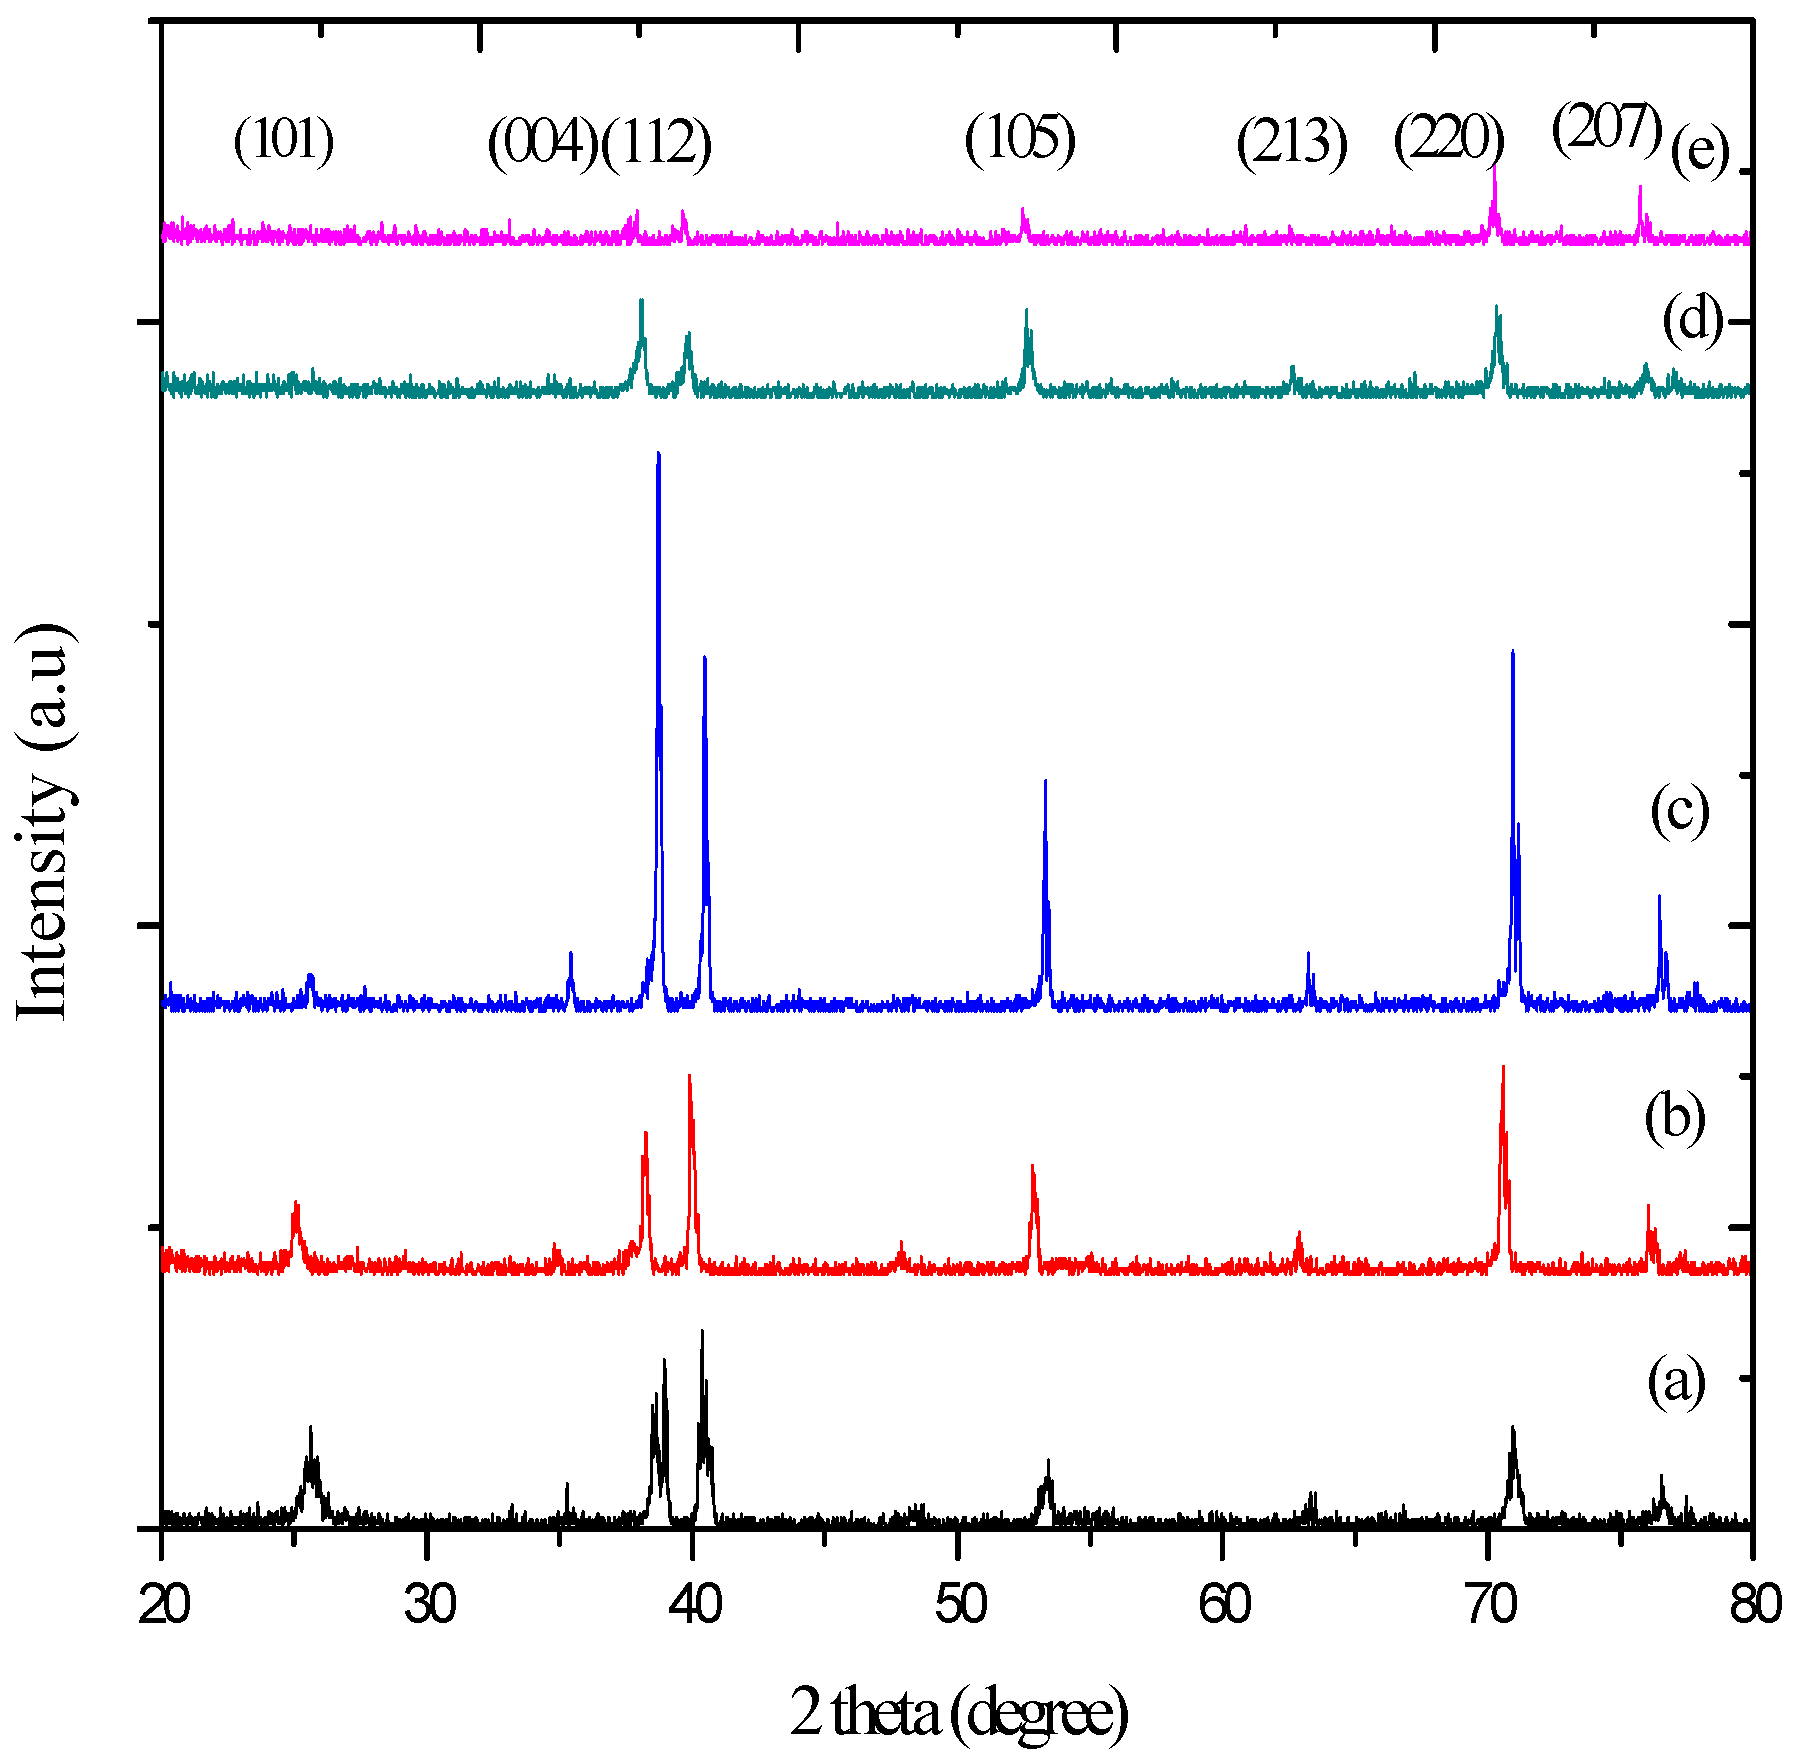
2.3. XRD Analysis
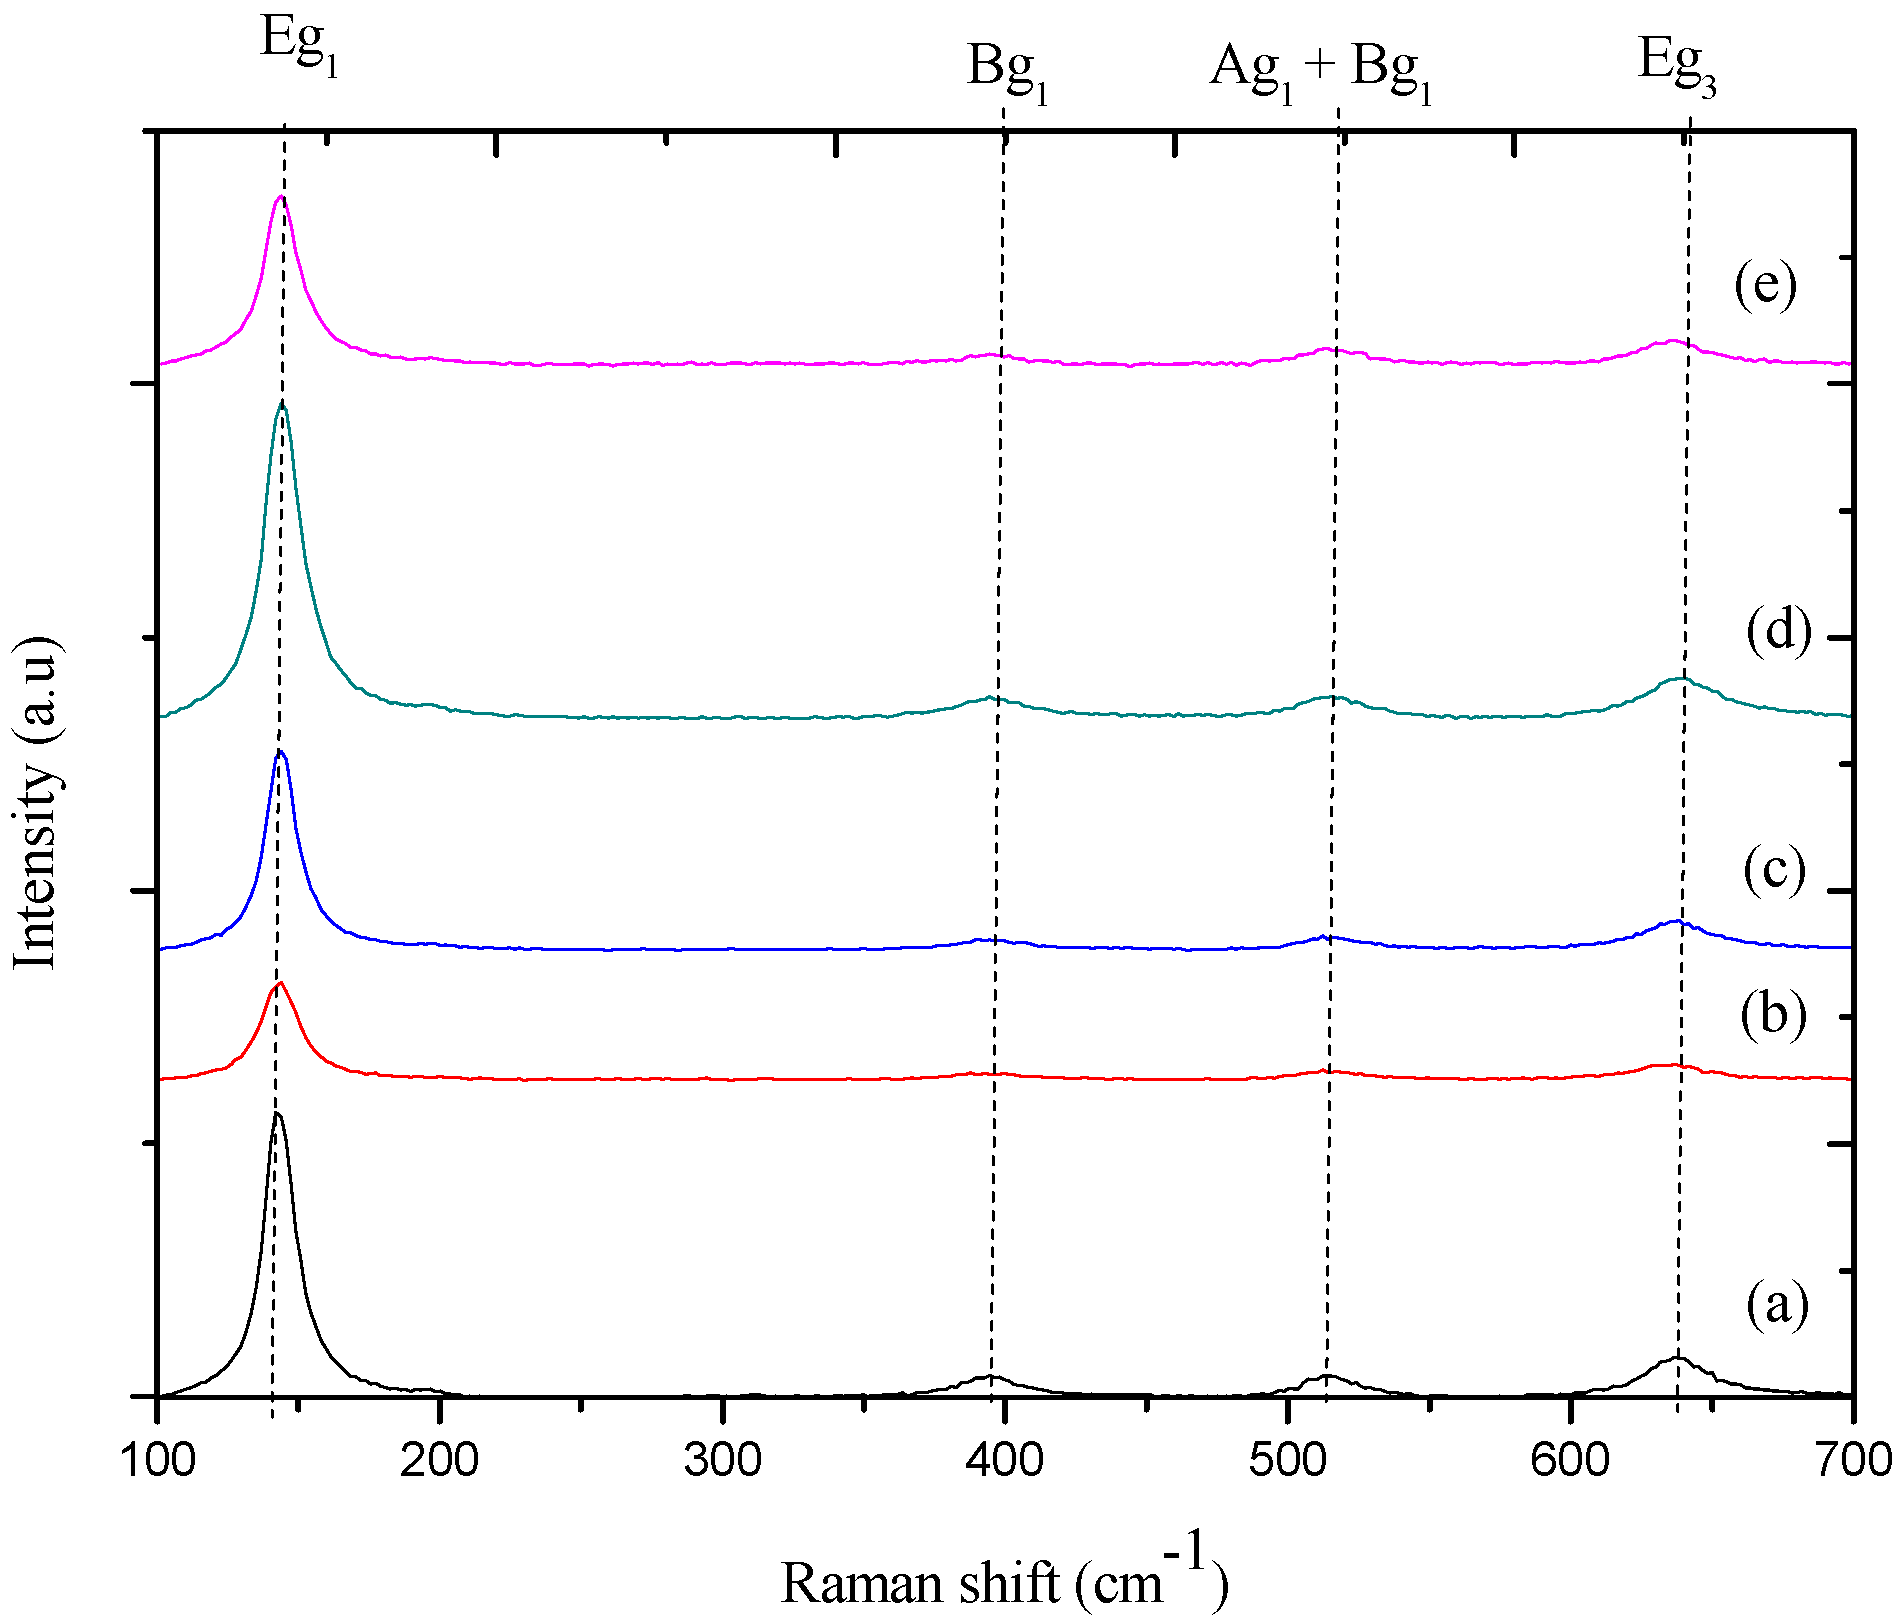
2.4. Raman Analysis
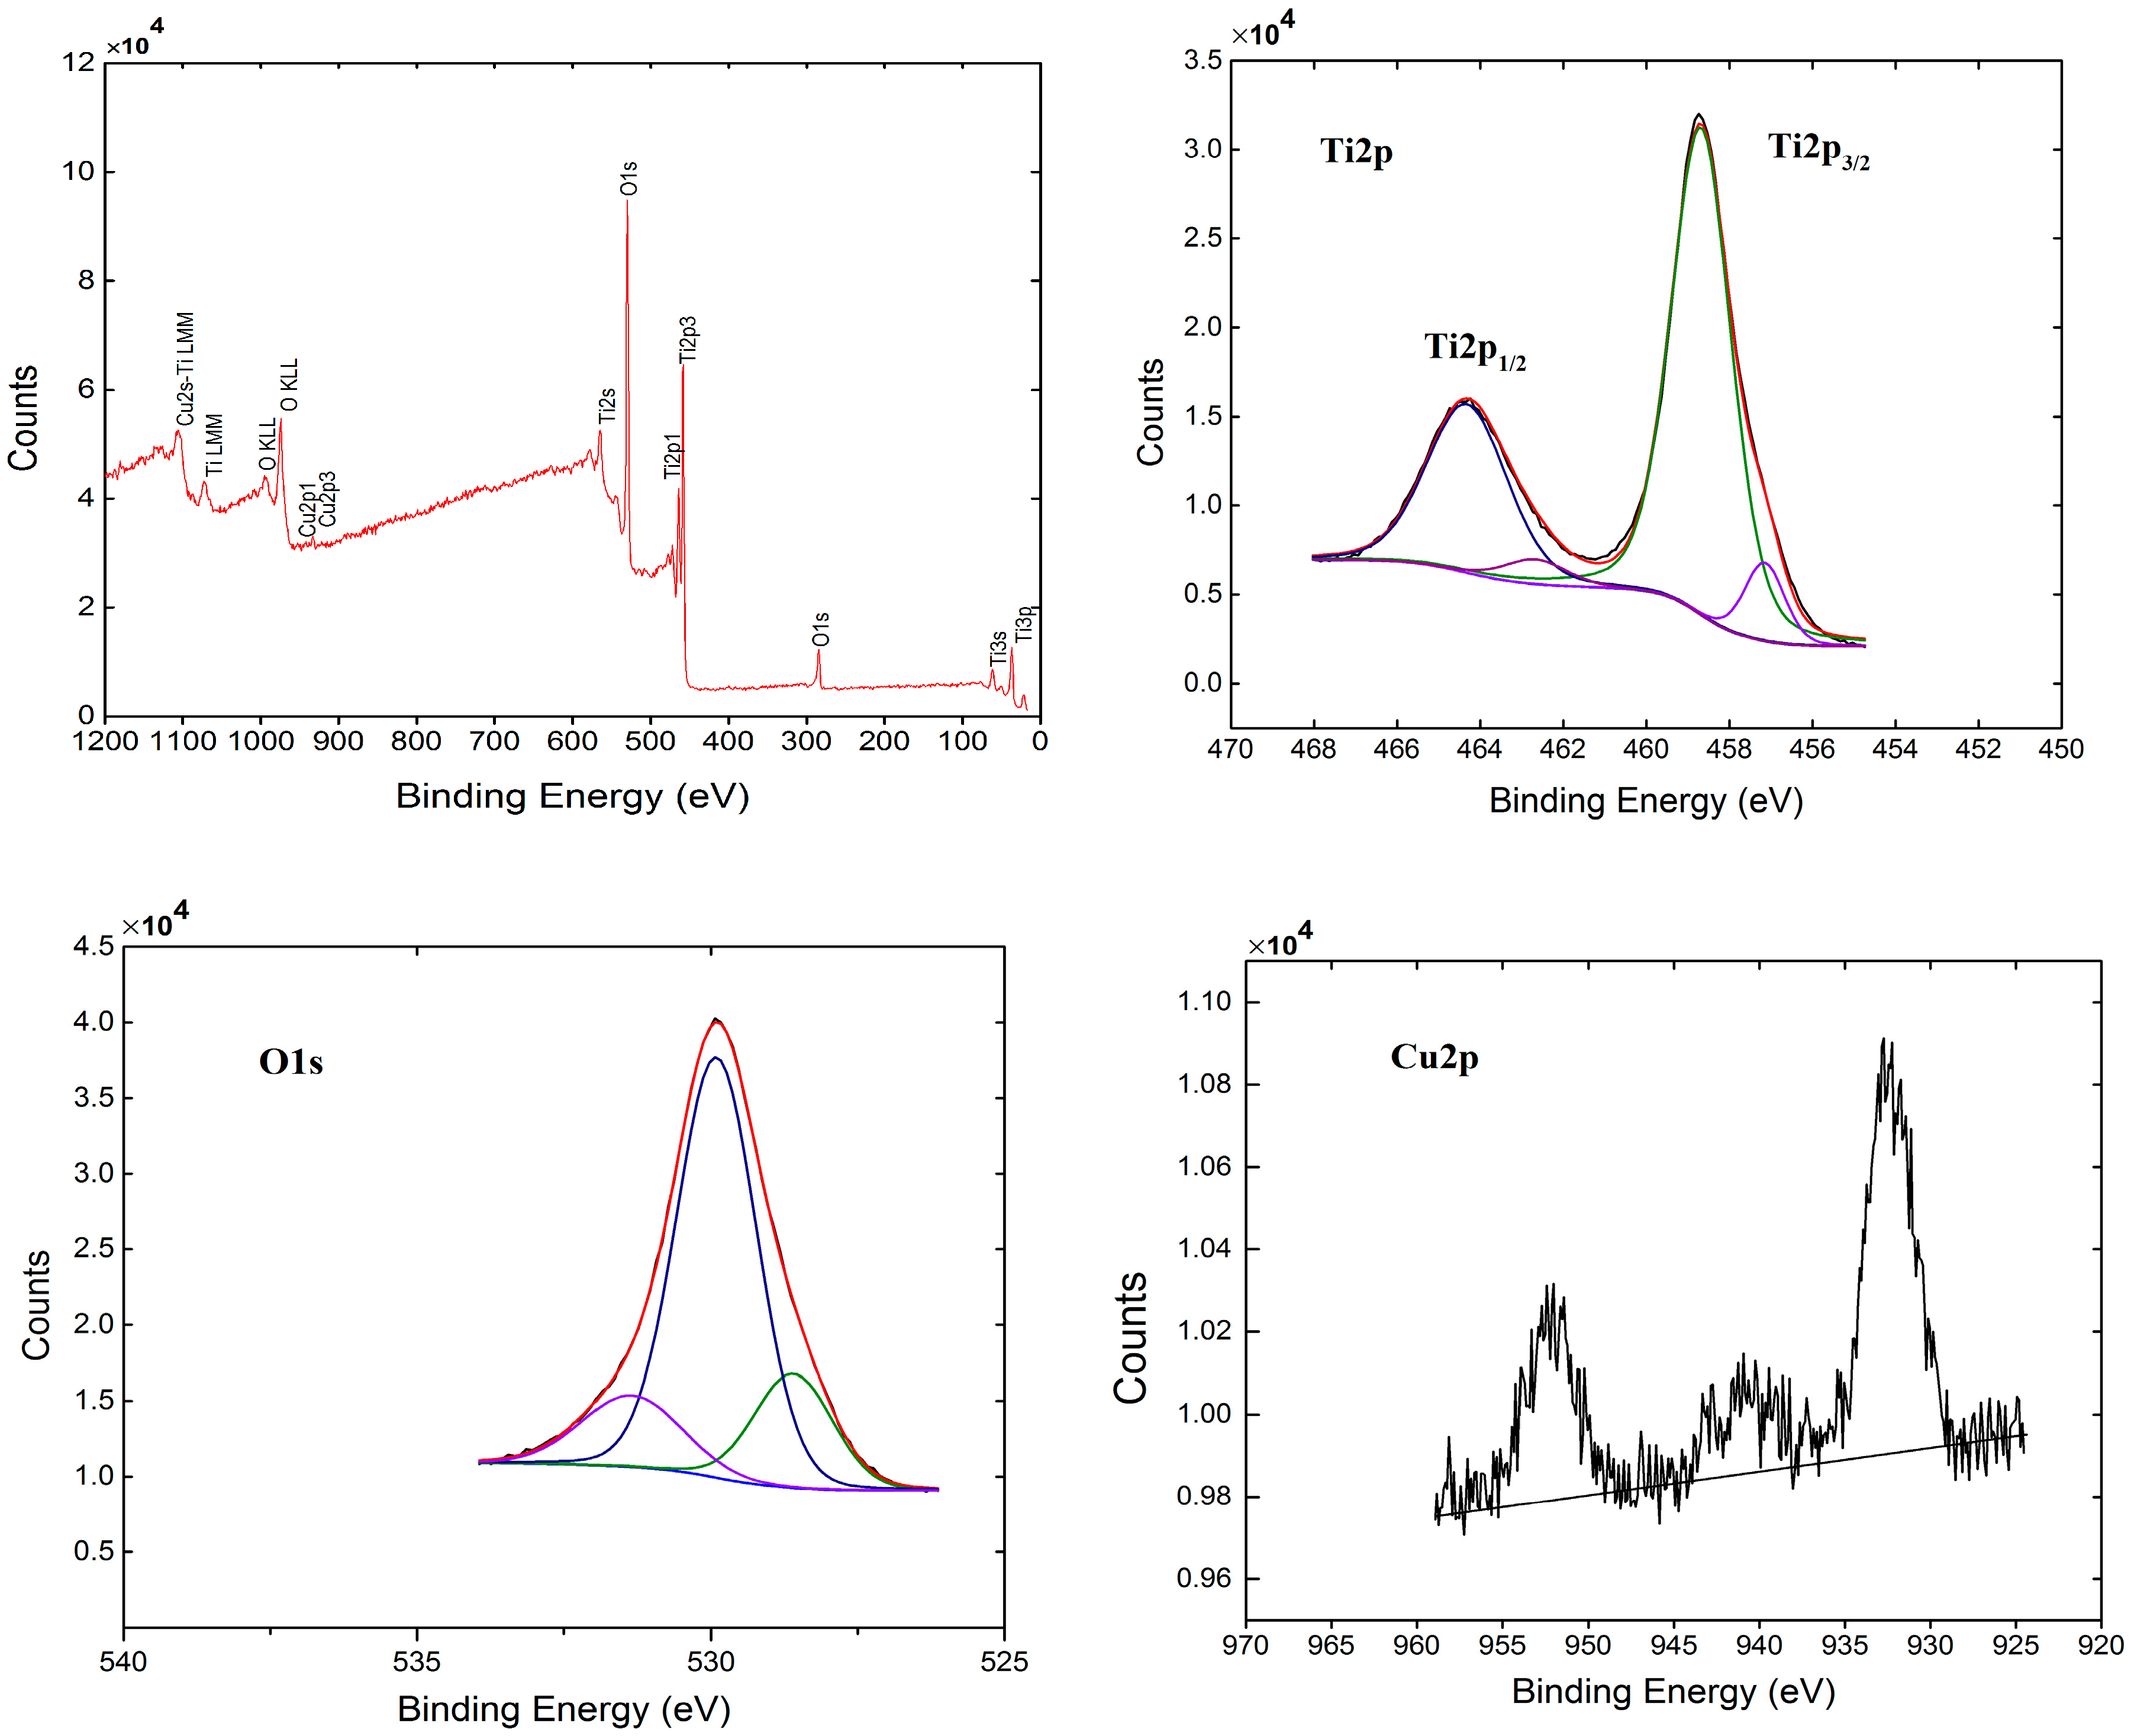
2.5. XPS Analysis
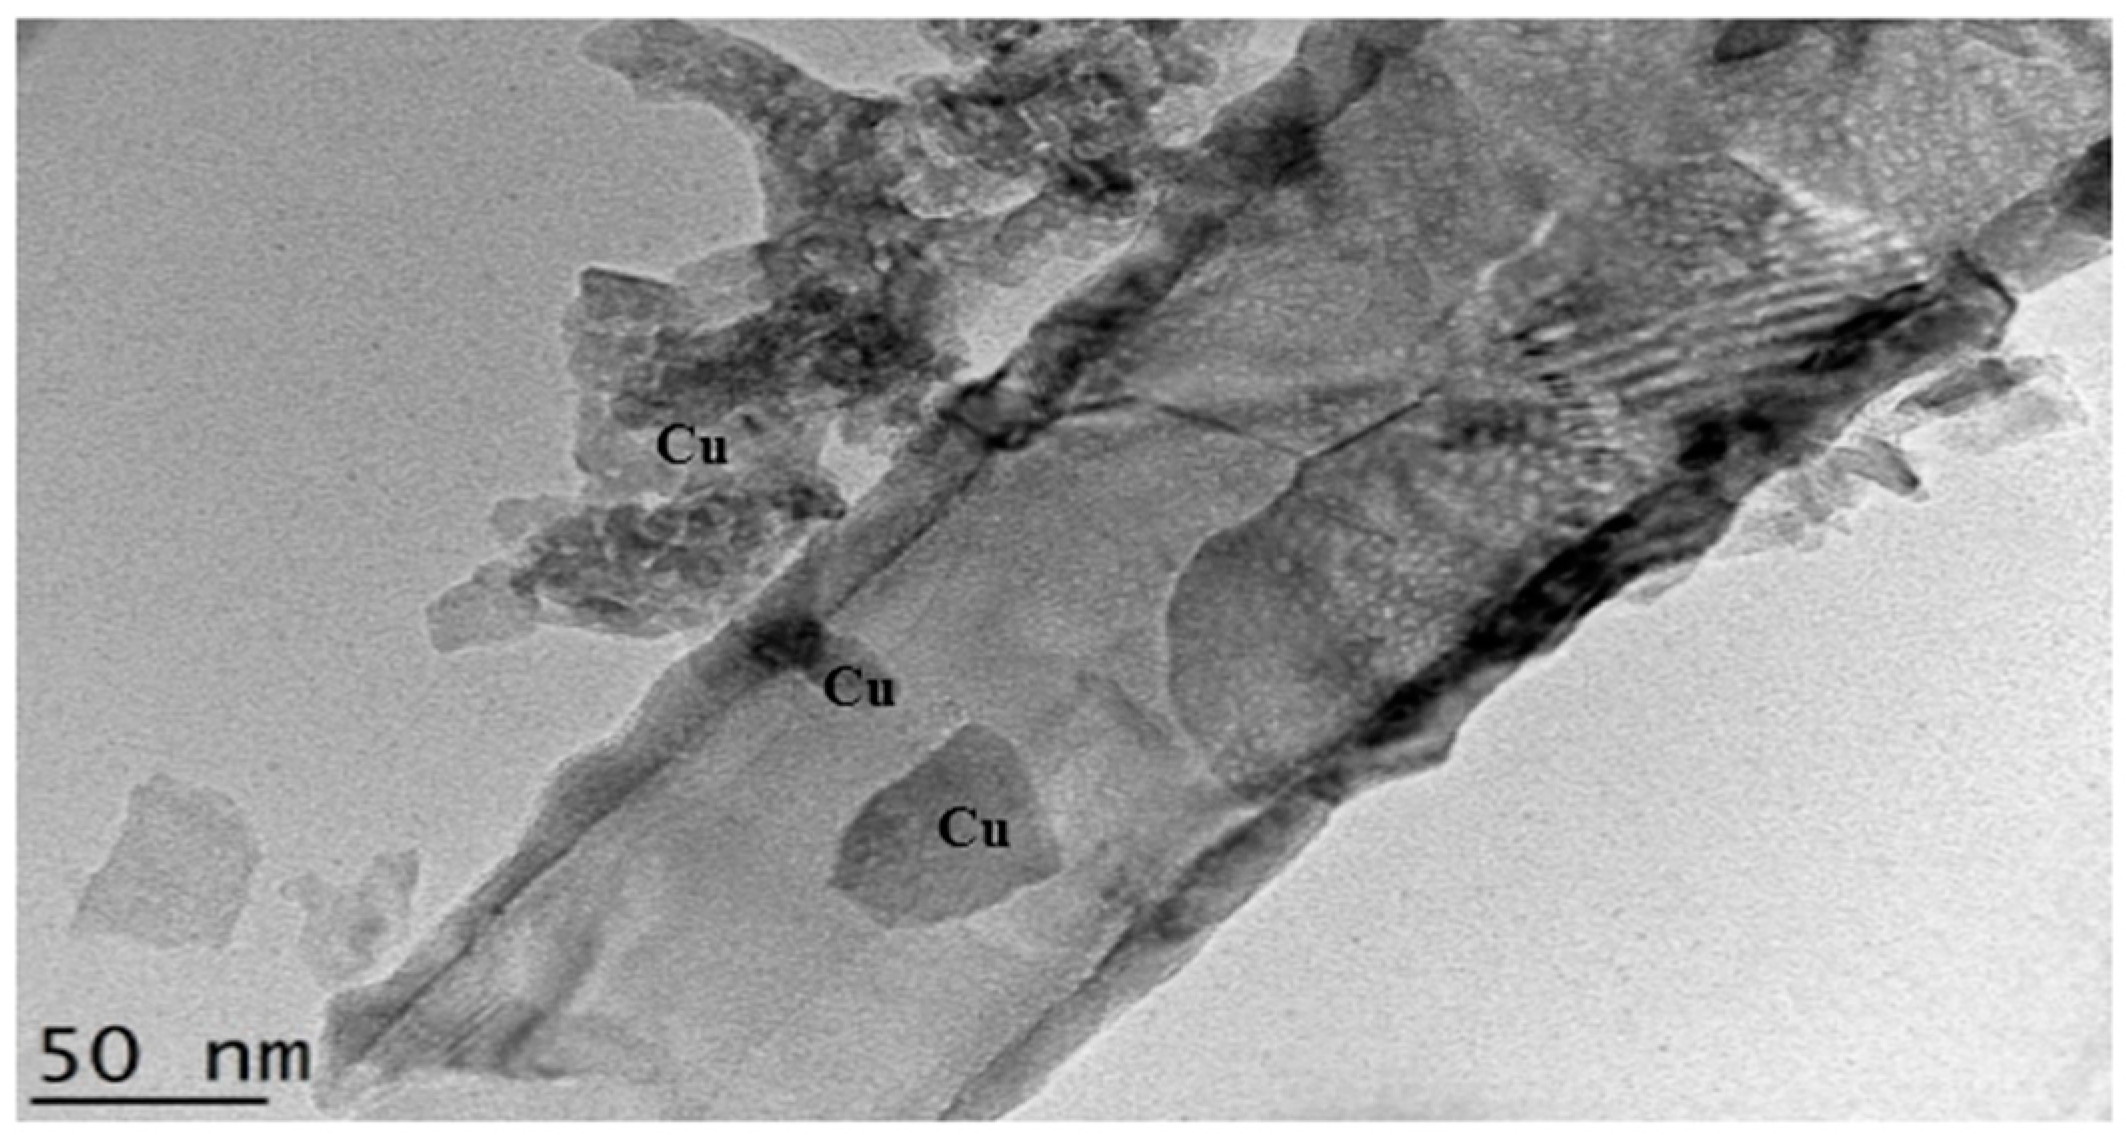
2.6. TEM Analysis
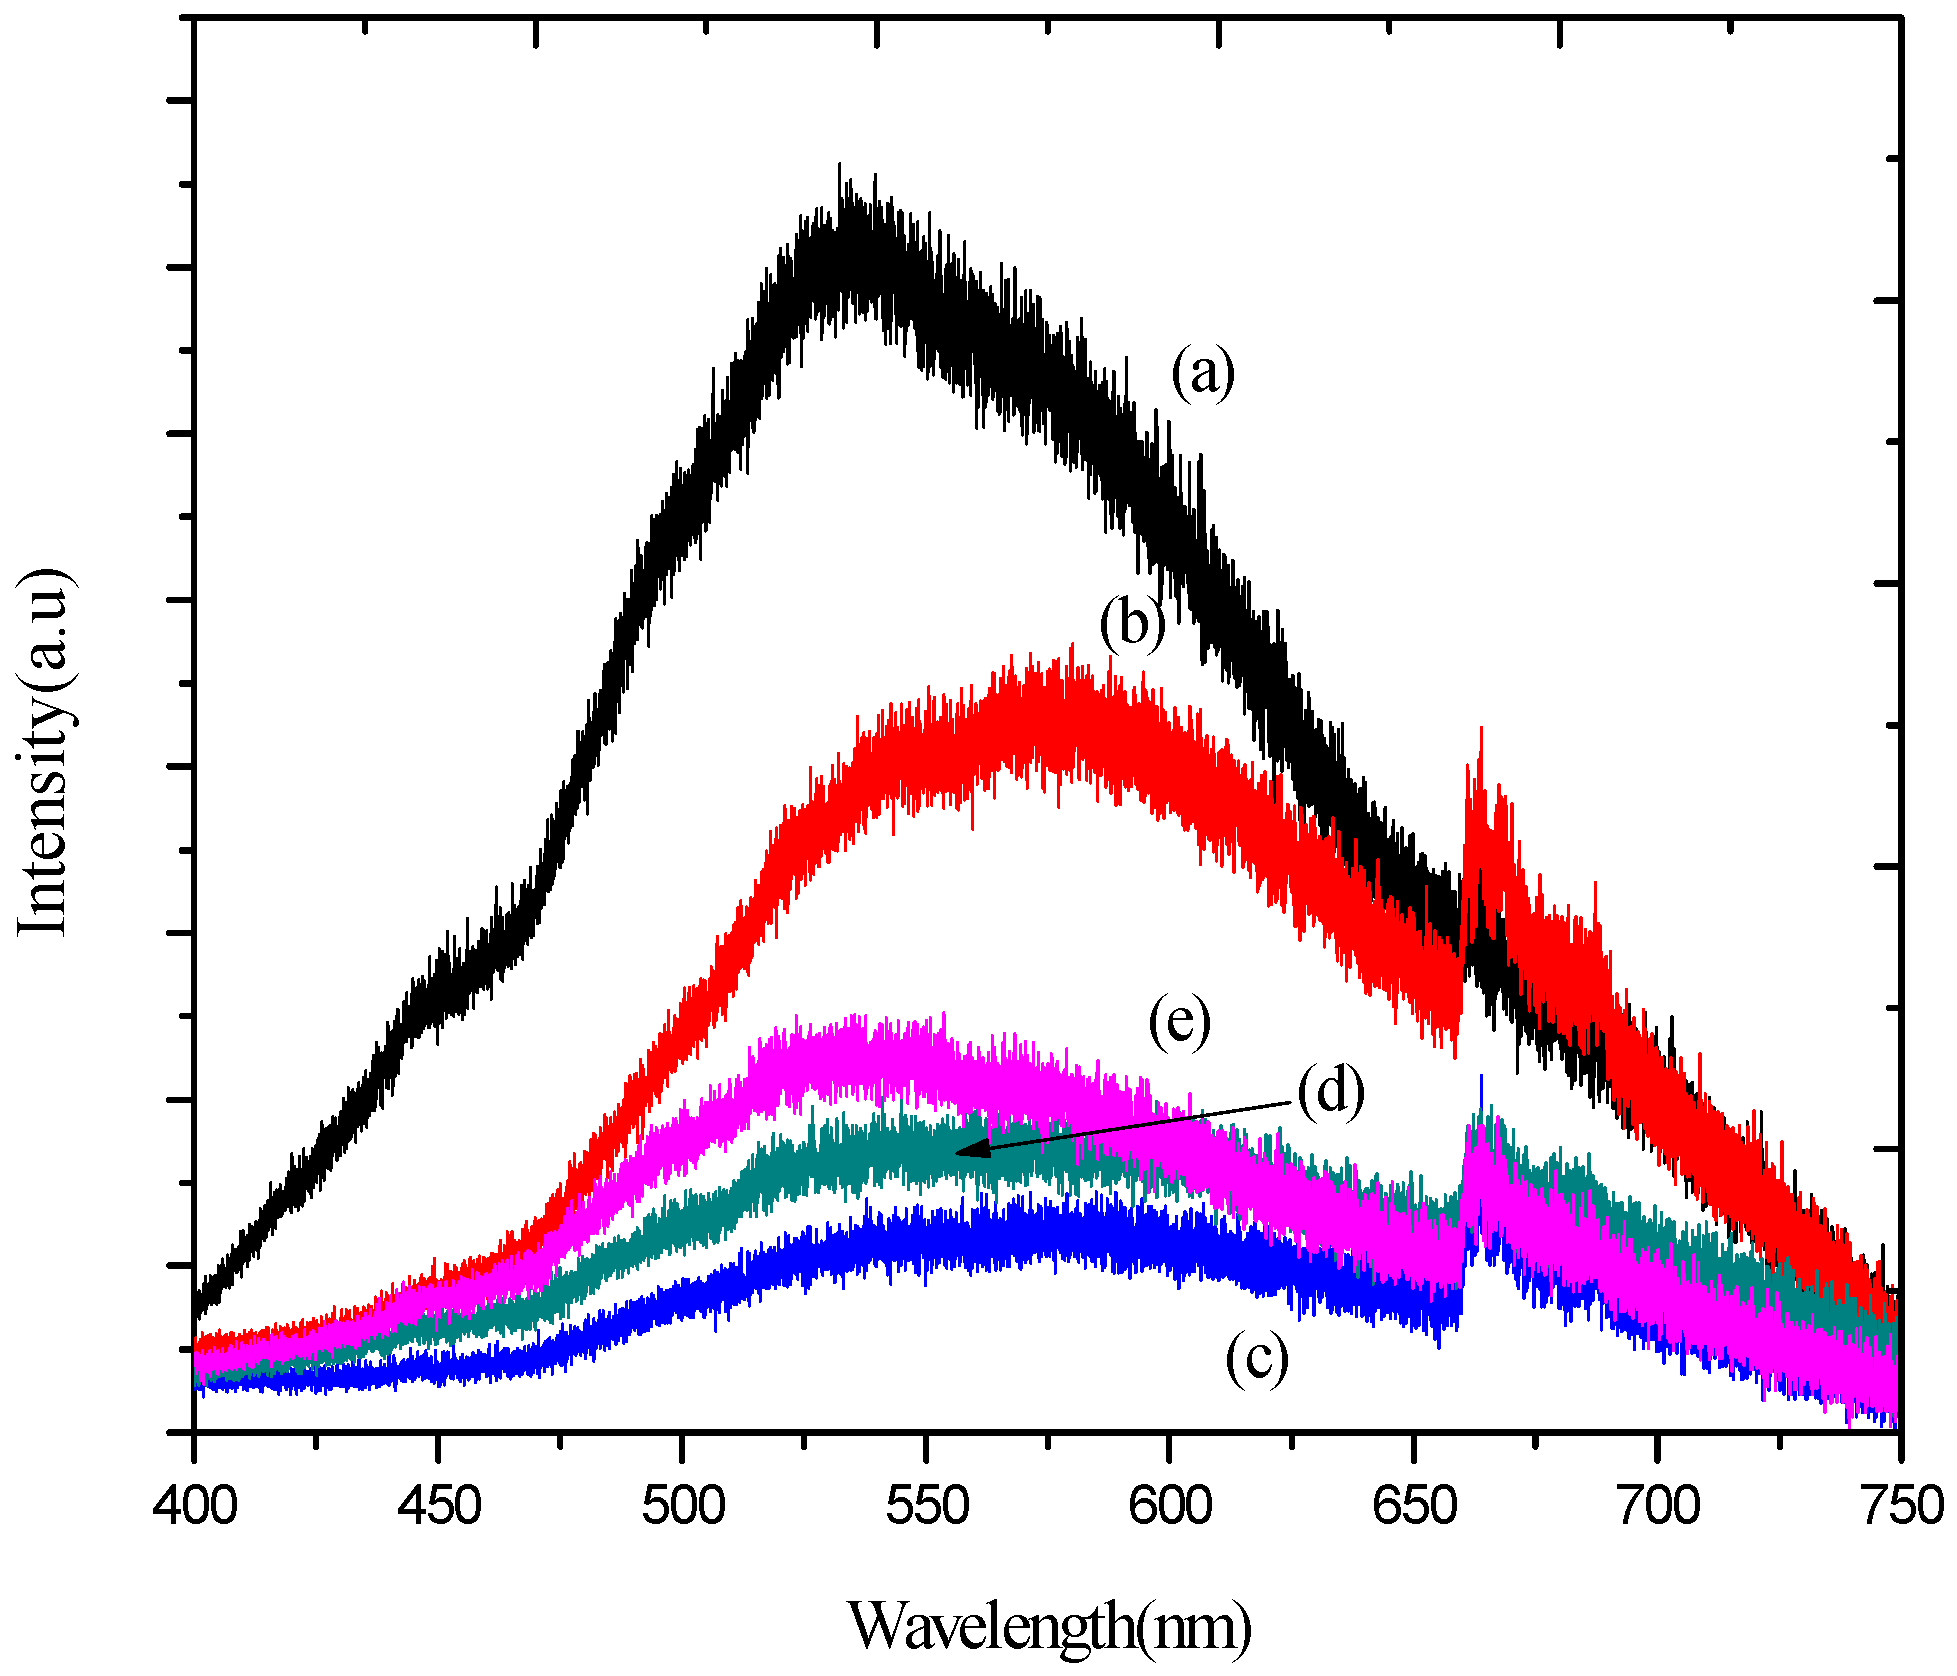
2.7. Photoluminescence (PL) Analysis
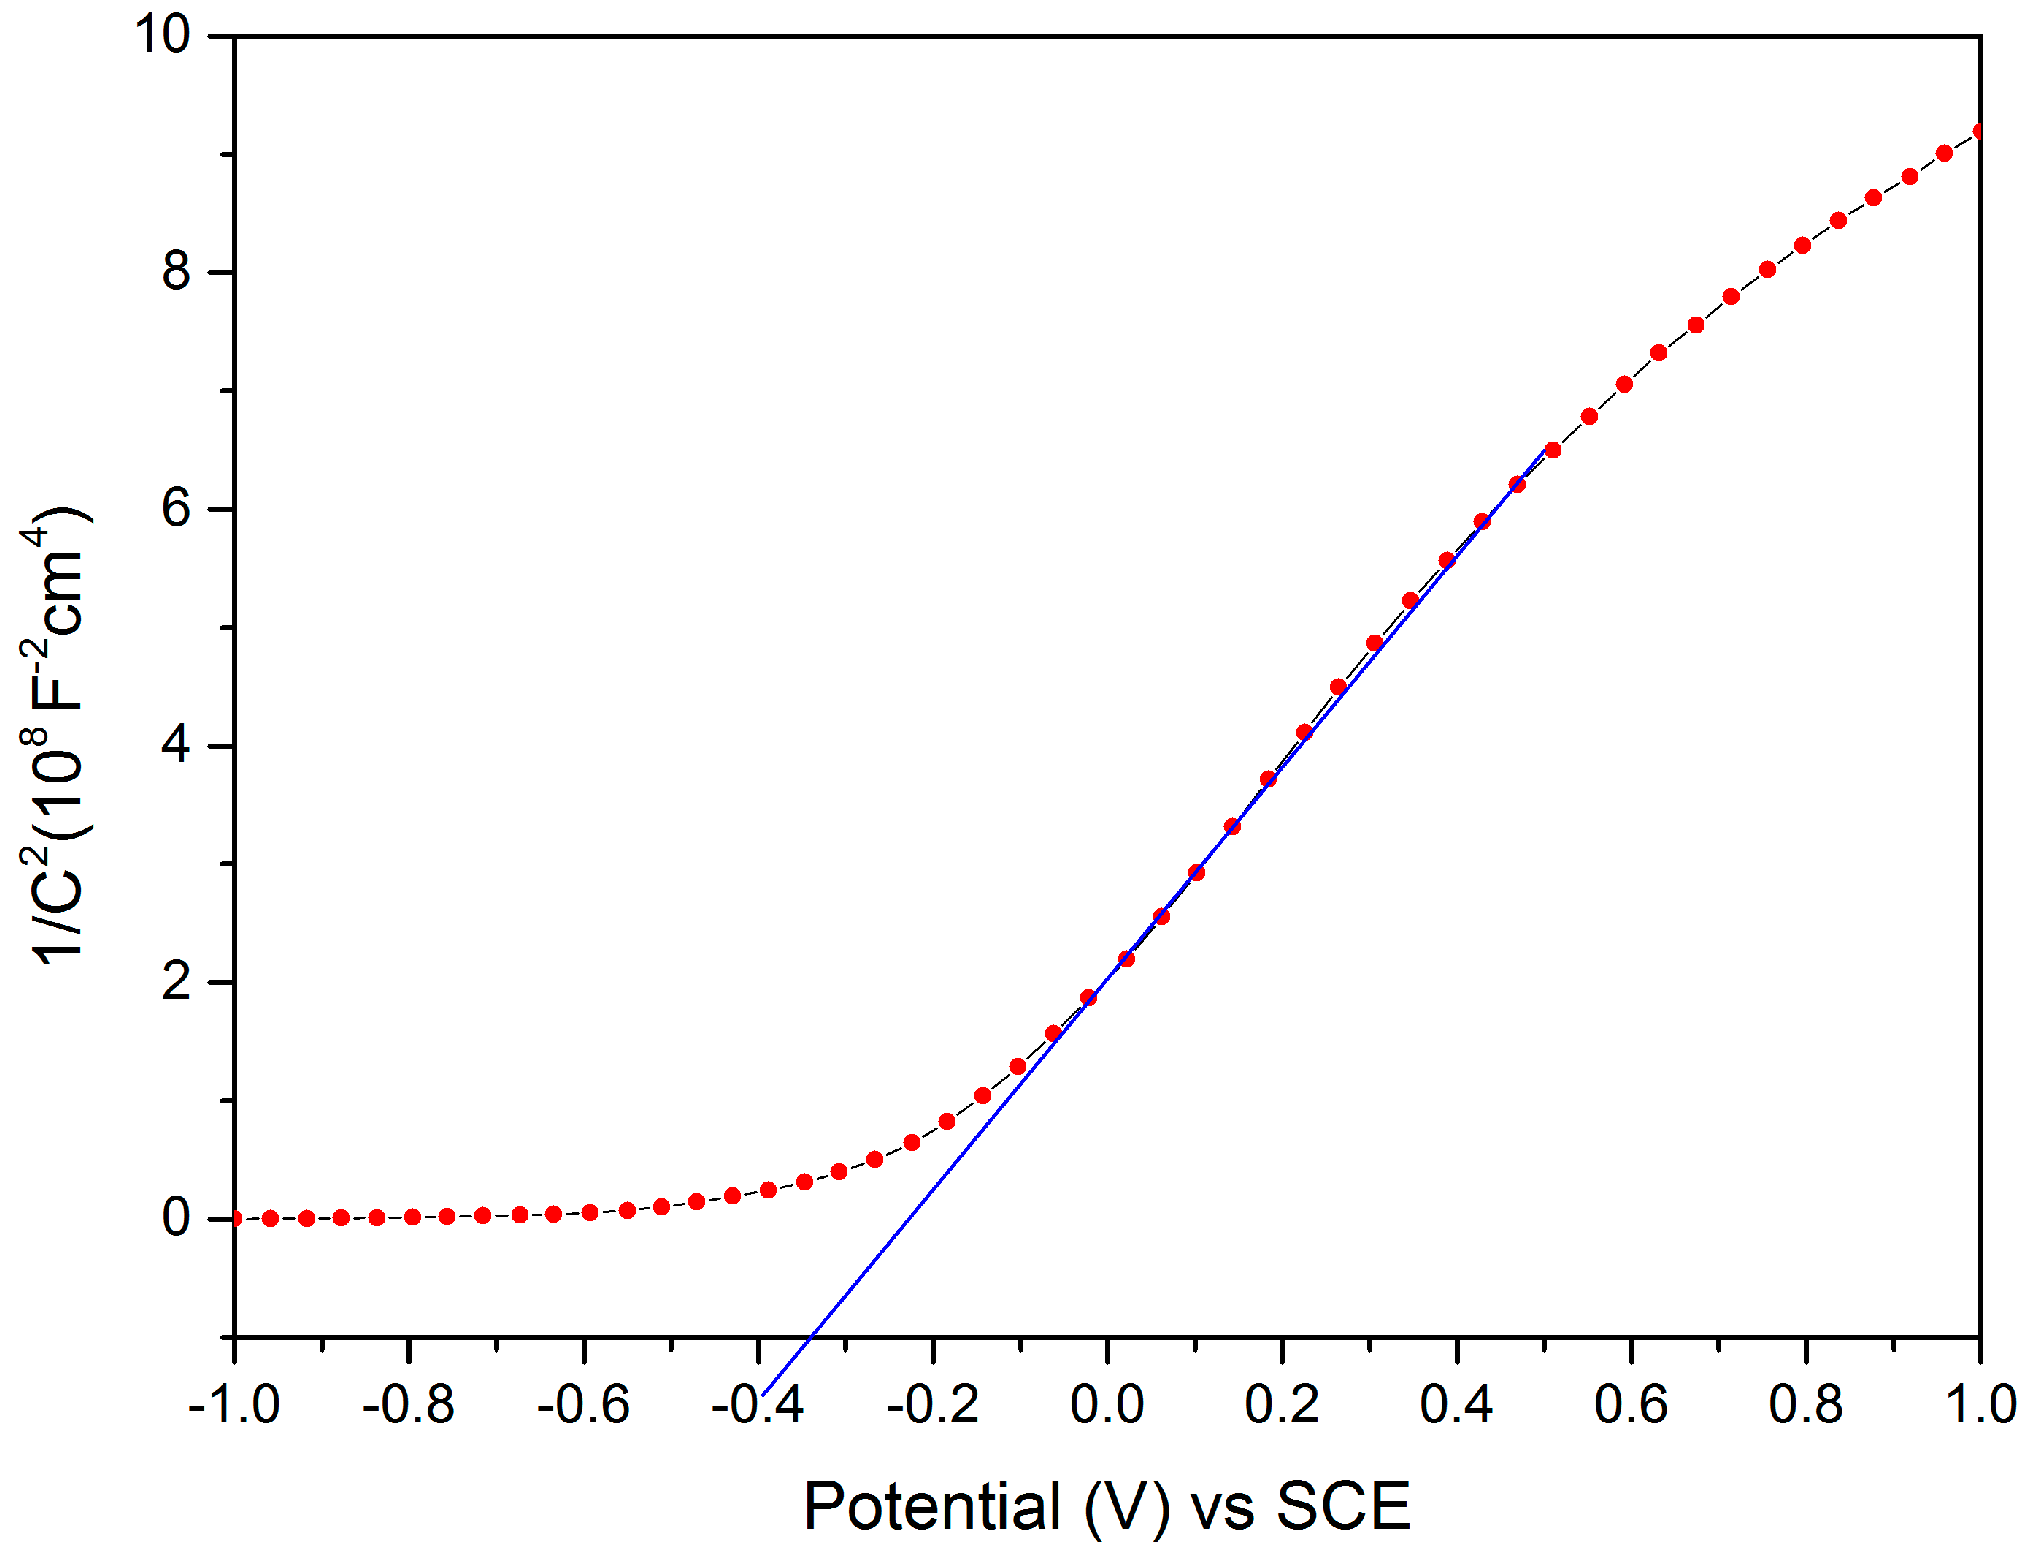
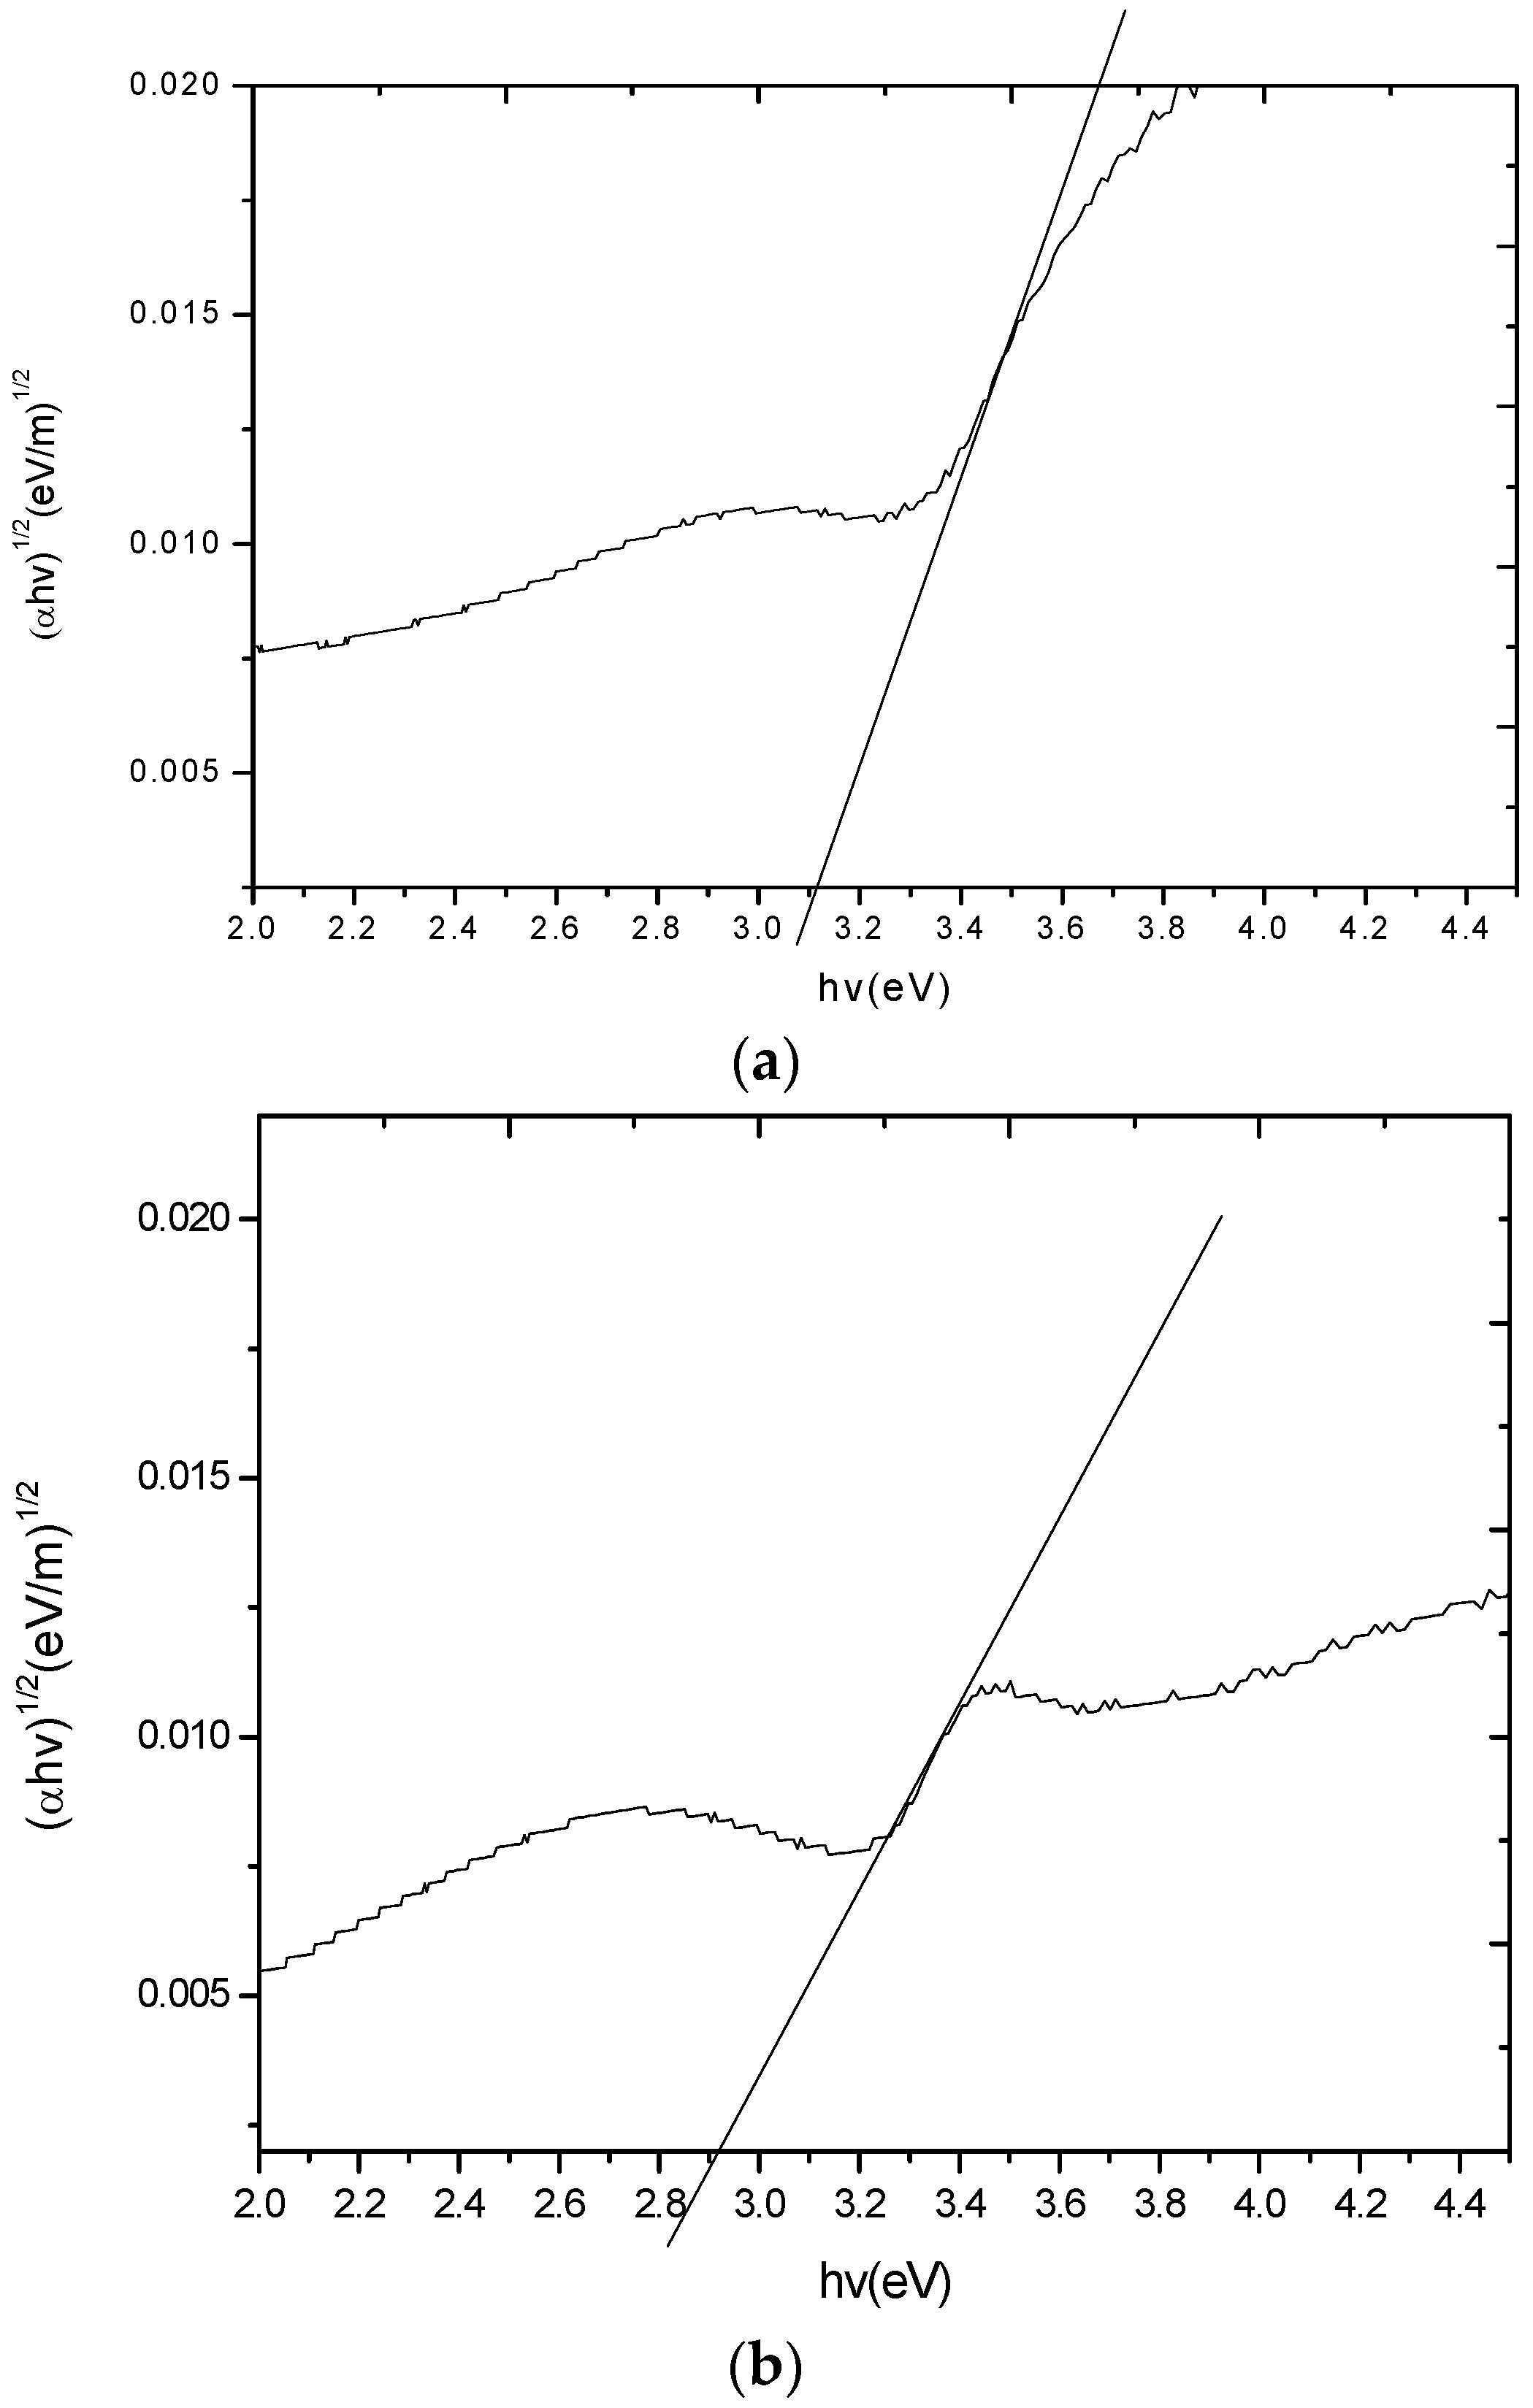
2.8. Mott-Schottky Analysis
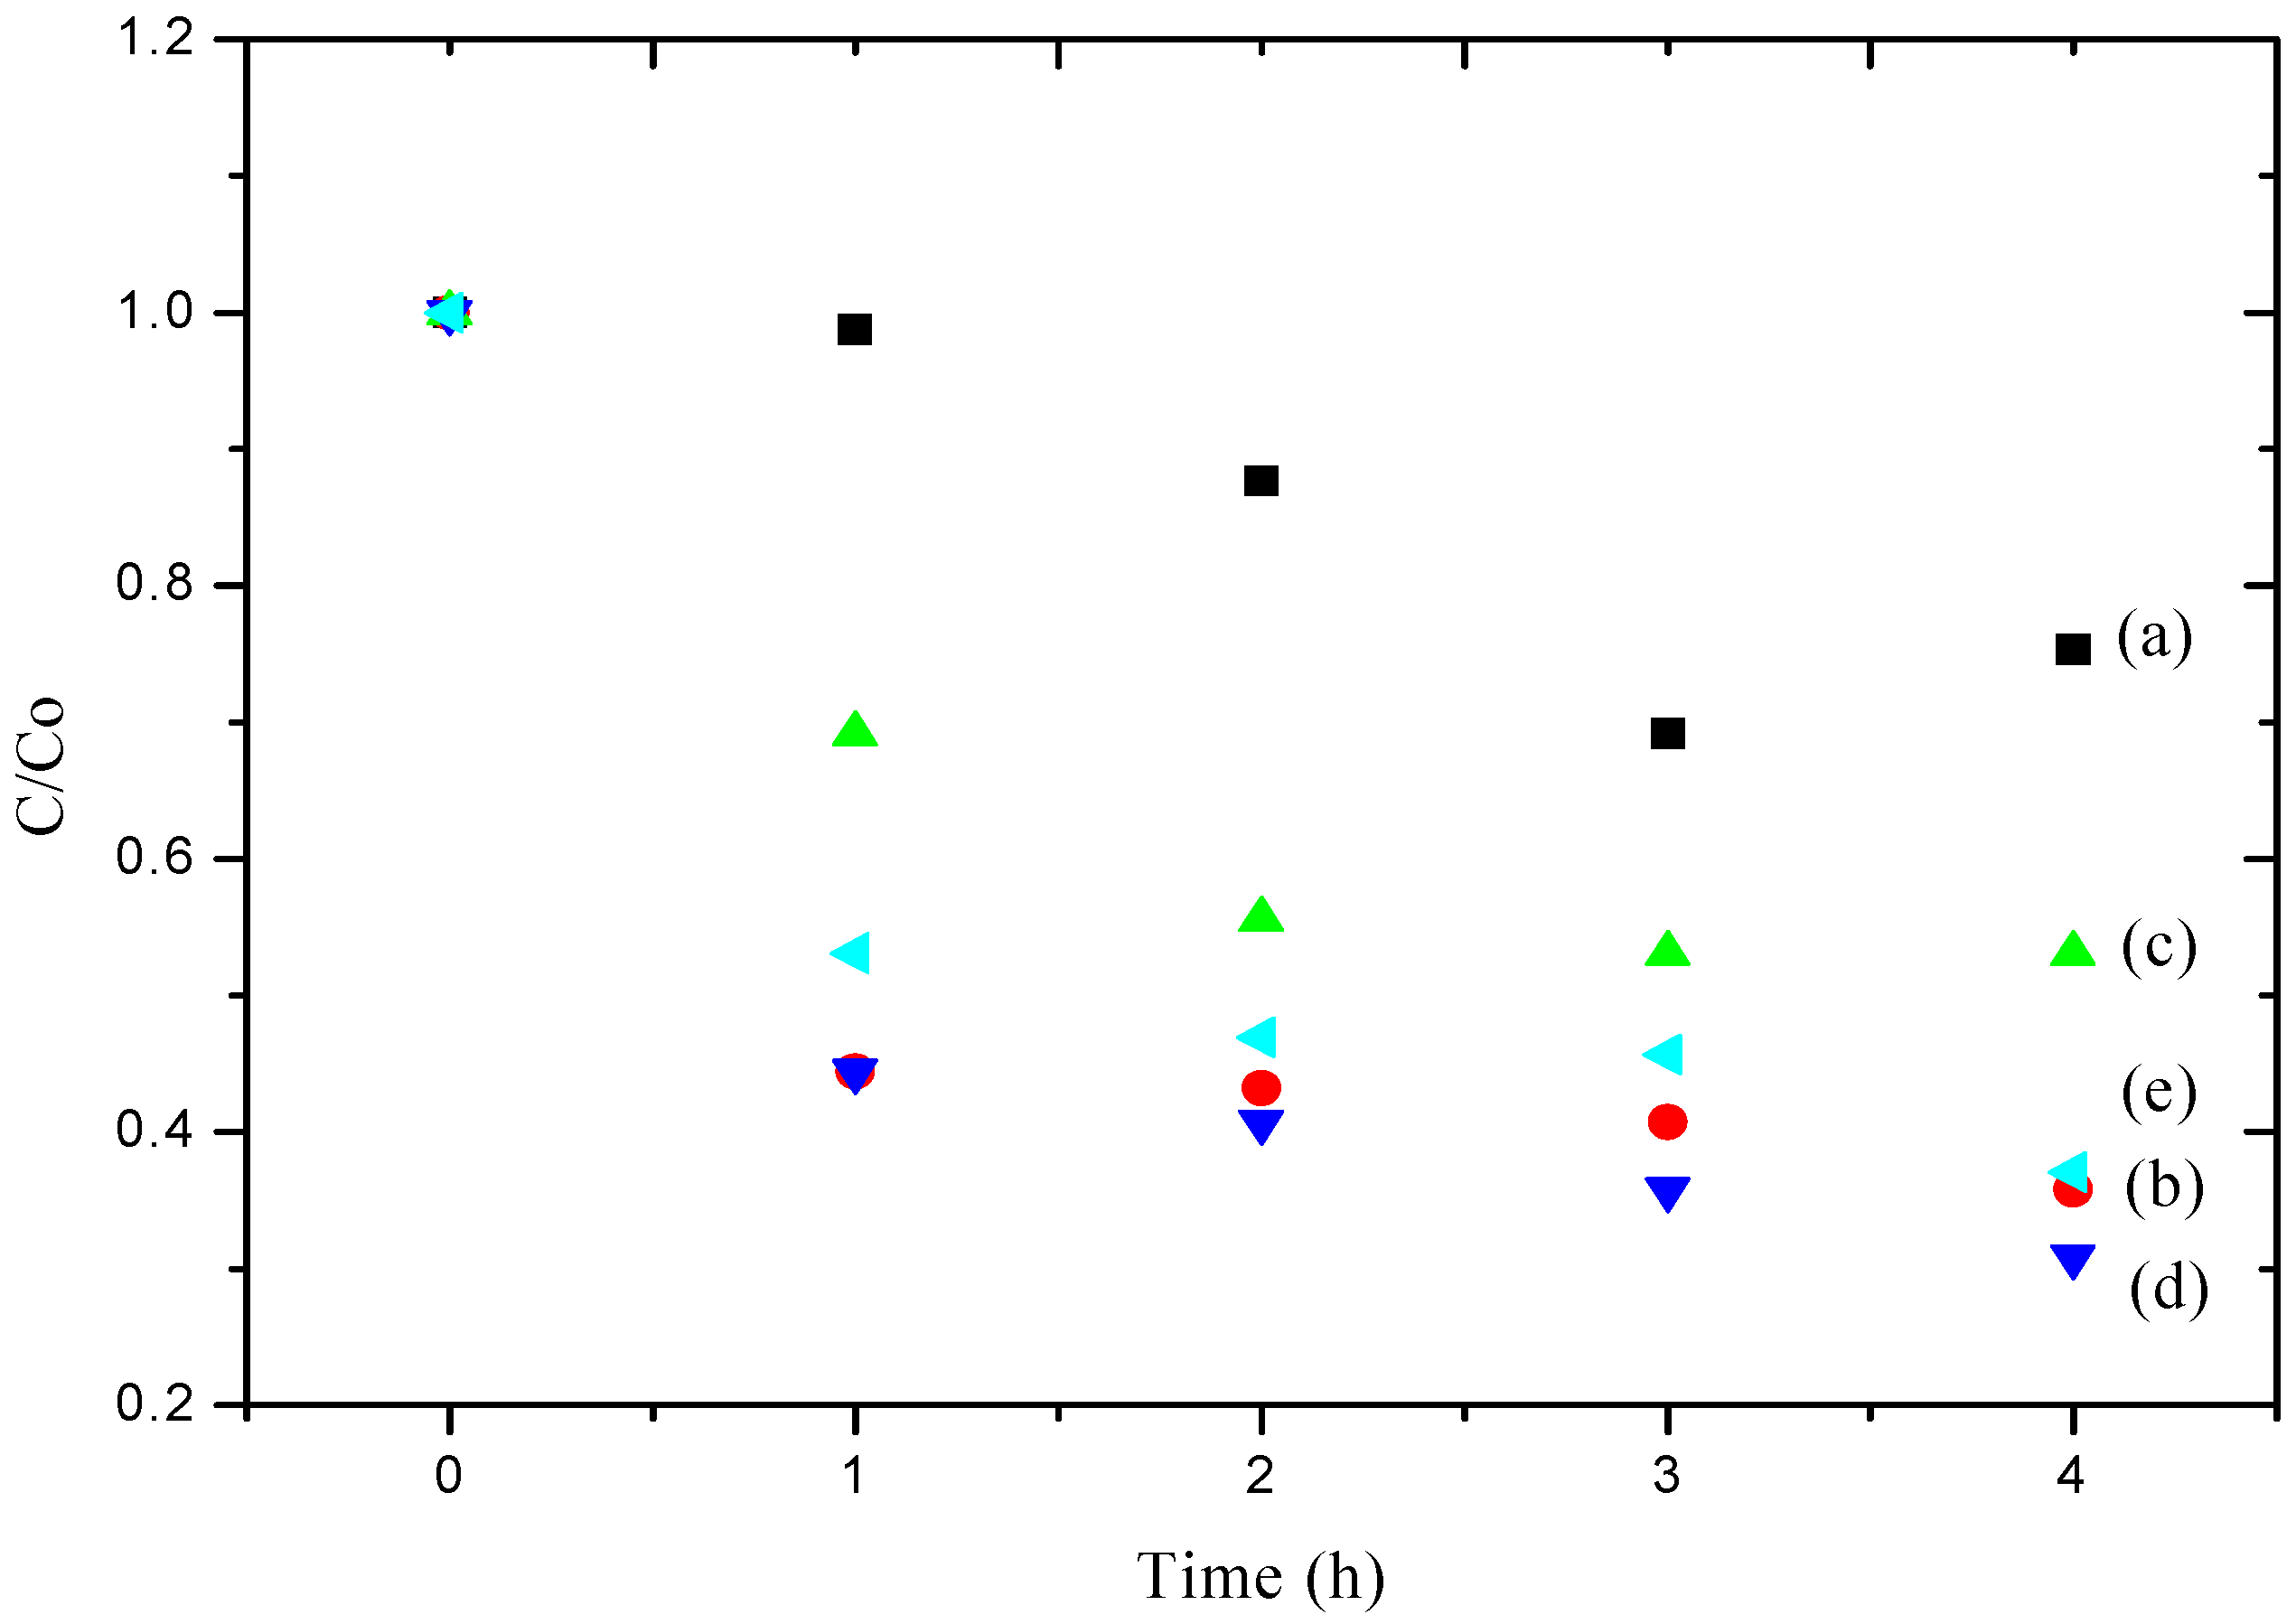
2.9. Simazine Photodegradation Analysis
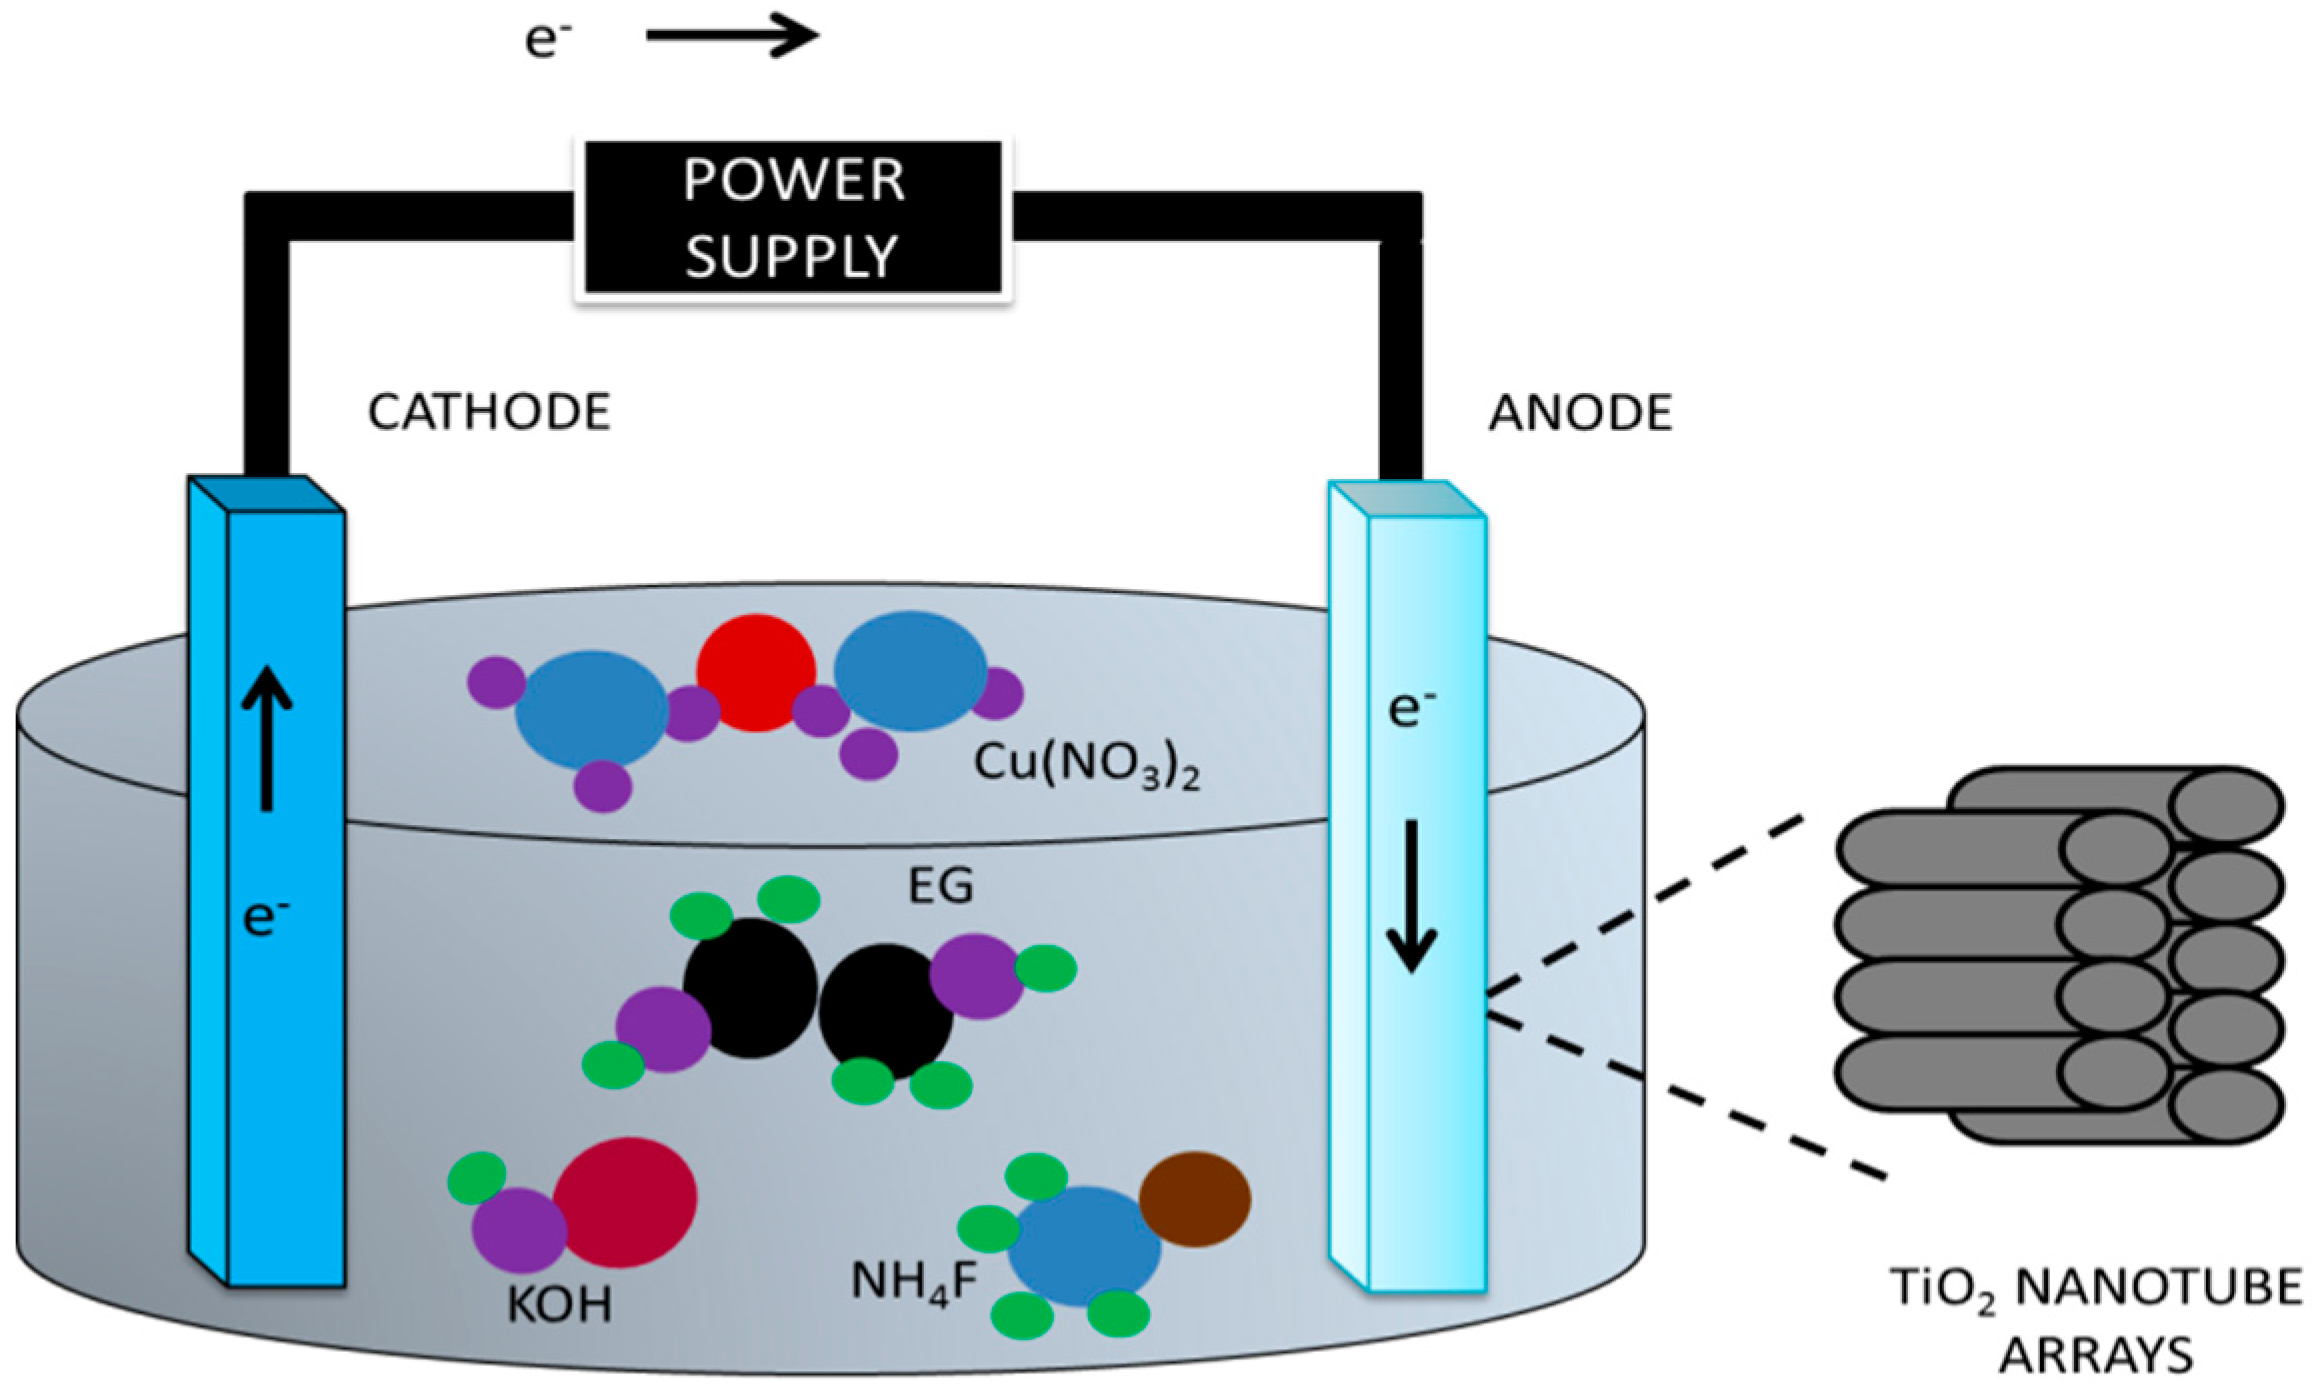
3. Experimental Techniques
4. Conclusions
Acknowledgments
Author Contributions
Conflicts of Interest
References
- Hallberg, G.R. From hoes to herbicides agriculture and groundwater quality. J. Soil Water Conserv. 1986, 41, 357–364. [Google Scholar]
- Rivas, F.; Navarrete, V.; Beltrán, F.J.; Garcı́a-Araya, J.F. Simazine Fenton’s oxidation in a continuous reactor. Appl. Catal. B Environ. 2004, 48, 249–258. [Google Scholar] [CrossRef]
- Sanderson, J.T.; Seinen, W.; Giesy, J.P.; van den Berg, M. 2-Chloro-s-triazine herbicides induce aromatase (CYP19) activity in H295R human adrenocortical carcinoma cells: A novel mechanism for estrogenicity? Toxicol. Sci. 2000, 54, 121–127. [Google Scholar] [CrossRef] [PubMed]
- Chu, W.; Rao, Y.; Hui, W. Removal of simazine in a UV/TiO2 heterogeneous system. J. Agric. Food Chem. 2009, 57, 6944–6949. [Google Scholar] [CrossRef] [PubMed]
- Evgenidou, E.; Fytianos, K. Photodegradation of triazine herbicides in aqueous solutions and natural waters. J. Agric. Food Chem. 2002, 50, 6423–6427. [Google Scholar] [CrossRef] [PubMed]
- Vanderborght, J.; Tiktak, A.; Boesten, J.J.; Vereecken, H. Effect of pesticide fate parameters and their uncertainty on the selection of ‘worst-case’scenarios of pesticide leaching to groundwater. Pest Manag. Sci. 2011, 67, 294–306. [Google Scholar] [CrossRef] [PubMed]
- Sathishkumar, P.; Mangalaraja, R.V.; Mansilla, H.D.; Gracia-Pinilla, M.; Anandan, S. Sonophotocatalytic (42 kHz) degradation of Simazine in the presence of Au–TiO2 nanocatalysts. Appl. Catal. B Environ. 2014, 160, 692–700. [Google Scholar] [CrossRef]
- Gaya, U.I.; Abdullah, A.H. Heterogeneous photocatalytic degradation of organic contaminants over titanium dioxide: A review of fundamentals, progress and problems. J. Photochem. Photobiol. C Photochem. Rev. 2008, 9, 1–12. [Google Scholar] [CrossRef] [Green Version]
- Zhang, P.; Scrudato, R.J.; Germano, G. Solarcatalytic inactivation of Escherichia coli in aqueous solutions using TiO2 as catalyst. Chemosphere 1994, 28, 607–611. [Google Scholar] [CrossRef]
- Tatsuma, T.; Saitoh, S.; Ohko, Y.; Fujishima, A. TiO2-WO3 photoelectrochemical anticorrosion system with an energy storage ability. Chem. Mater. 2001, 13, 2838–2842. [Google Scholar] [CrossRef]
- Yang, T.-Y.; Lin, H.-M.; Wei, B.-Y.; Wu, C.-Y.; Lin, C.-K. UV enhancement of the gas sensing properties of nano-TiO2. Rev. Adv. Mater. Sci. 2003, 4, 48–54. [Google Scholar]
- Blackwood, D.; Greef, R.; Peter, L. An ellipsometric study of the growth and open-circuit dissolution of the anodic oxide film on titanium. Electrochim. Acta 1989, 34, 875–880. [Google Scholar] [CrossRef]
- López-Muñoz, M.; Aguado, J.; Revilla, A. Photocatalytic removal of s-triazines: Evaluation of operational parameters. Catal. Today 2011, 161, 153–162. [Google Scholar] [CrossRef]
- Wang, M.; Sun, L.; Lin, Z.; Cai, J.; Xie, K.; Lin, C. p–n Heterojunction photoelectrodes composed of Cu2 O-loaded TiO2 nanotube arrays with enhanced photoelectrochemical and photoelectrocatalytic activities. Energy Environ. Sci. 2013, 6, 1211–1220. [Google Scholar] [CrossRef]
- Rao, Y.; Chu, W. Visible Light-Induced Photodegradation of Simazine in Aqueous TiO2 Suspension. Ind. Eng. Chem. Res. 2013, 52, 13580–13586. [Google Scholar] [CrossRef]
- Mishra, S.; Du, D.; Jeanneau, E.; Dappozze, F.; Guillard, C.; Zhang, J.; Daniele, S. A Facile Molecular Precursor-based Synthesis of Ag2Se Nanoparticles and Its Composites with TiO2 for Enhanced Photocatalytic Activity. Chem. Asian J. 2016, 11, 1658–1663. [Google Scholar] [CrossRef] [PubMed]
- Gao, B.; Yap, P.S.; Lim, T.M.; Lim, T.-T. Adsorption-photocatalytic degradation of Acid Red 88 by supported TiO2: Effect of activated carbon support and aqueous anions. Chem. Eng. J. 2011, 171, 1098–1107. [Google Scholar] [CrossRef]
- Fanun, M. The Role of Colloidal Systems in Environmental Protection; Elsevier: Amsterdam, The Netherlands, 2014. [Google Scholar]
- Kathalingam, A.; Ambika, N.; Kim, M.; Elanchezhiyan, J.; Chae, Y.; Rhee, J. Chemical bath deposition and characterization of nanocrystalline ZnO thin films. Mater. Sci. Pol. 2010, 28, 513–522. [Google Scholar]
- Krengvirat, W.; Sreekantan, S.; Noor, A.-F.M.; Kawamura, G.; Muto, H.; Matsuda, A. Single-step growth of carbon and potassium-embedded TiO2 nanotube arrays for efficient photoelectrochemical hydrogen generation. Electrochim. Acta 2013, 89, 585–593. [Google Scholar] [CrossRef]
- Morawski, A.; Grzechulska, J.; Kałucki, K. A new method for preparation of potassium-pillared layered titanate applied in photocatalysis. J. Phys. Chem. Solids 1996, 57, 1011–1017. [Google Scholar] [CrossRef]
- Cai, Q.; Paulose, M.; Varghese, O.K.; Grimes, C.A. The effect of electrolyte composition on the fabrication of self-organized titanium oxide nanotube arrays by anodic oxidation. J. Mater. Res. 2005, 20, 230–236. [Google Scholar] [CrossRef]
- Raymundo-Pinero, E.; Azais, P.; Cacciaguerra, T.; Cazorla-Amorós, D.; Linares-Solano, A.; Béguin, F. KOH and NaOH activation mechanisms of multiwalled carbon nanotubes with different structural organisation. Carbon 2005, 43, 786–795. [Google Scholar] [CrossRef]
- Heldebrant, D.J.; Jessop, P.G. Liquid poly(ethylene glycol) and supercritical carbon dioxide: A benign biphasic solvent system for use and recycling of homogeneous catalysts. J. Am. Chem. Soc. 2003, 125, 5600–5601. [Google Scholar] [CrossRef] [PubMed]
- Luo, C.; Zhang, Y.; Zeng, X.; Zeng, Y.; Wang, Y. The role of poly(ethylene glycol) in the formation of silver nanoparticles. J. Colloid Interface Sci. 2005, 288, 444–448. [Google Scholar] [CrossRef] [PubMed]
- Ghicov, A.; Schmuki, P. Self-ordering electrochemistry: A review on growth and functionality of TiO2 nanotubes and other self-aligned MOx structures. Chem. Commun. 2009, 2791–2808. [Google Scholar] [CrossRef] [PubMed]
- Chaudhary, V.; Srivastava, A.K.; Kumar, J. On the Sol-gel Synthesis and Characterization of titanium oxide nanoparticles. In Proceedings of the MRS Spring Meeting and Exhibit, San Francisco, CA, USA, 25–29 April 2011; Cambridge Univsity Press: Cambridge, UK, 2011. [Google Scholar]
- Zhang, J.; Li, M.; Feng, Z.; Chen, J.; Li, C. UV Raman spectroscopic study on TiO2. I. Phase transformation at the surface and in the bulk. J. Phys. Chem. B 2006, 110, 927–935. [Google Scholar] [CrossRef] [PubMed]
- Di Valentin, C.; Pacchioni, G.; Selloni, A.; Livraghi, S.; Giamello, E. Characterization of paramagnetic species in N-doped TiO2 powders by EPR spectroscopy and DFT calculations. J. Phys. Chem. B 2005, 109, 11414–11419. [Google Scholar] [CrossRef] [PubMed]
- Sarra-Bournet, C.; Haberl, B.; Charles, C.; Boswell, R. Characterization of nanocrystalline nitrogen-containing titanium oxide obtained by N2/O2/Ar low-field helicon plasma sputtering. J. Phys. D Appl. Phys. 2011, 44, 455202. [Google Scholar] [CrossRef]
- Chen, X.; Liu, L.; Peter, Y.Y.; Mao, S.S. Increasing solar absorption for photocatalysis with black hydrogenated titanium dioxide nanocrystals. Science 2011, 331, 746–750. [Google Scholar] [CrossRef] [PubMed]
- Lazarus, M.; Sham, T. X-ray photoelectron spectroscopy (XPS) studies of hydrogen reduced rutile (TiO2-x) surfaces. Chem. Phys. Lett. 1982, 92, 670–674. [Google Scholar] [CrossRef]
- Biesinger, M.C.; Lau, L.W.; Gerson, A.R.; Smart, R.S.C. Resolving surface chemical states in XPS analysis of first row transition metals, oxides and hydroxides: Sc, Ti, V, Cu and Zn. Appl. Surf. Sci. 2010, 257, 887–898. [Google Scholar] [CrossRef]
- Ding, J.; Yuan, Y.; Xu, J.; Deng, J.; Guo, J. TiO2 nanopowder Co-doped with iodine and Boron to enhance visible-light photocatalytic activity. J. Biomed. Nanotechnol. 2009, 5, 521–527. [Google Scholar] [CrossRef] [PubMed]
- Kandjani, A.E.; Sabri, Y.M.; Periasamy, S.R.; Zohora, N.; Amin, M.H.; Nafady, A.; Bhargava, S.K. Controlling core/shell formation of nanocubic p-Cu2O/n-ZnO toward enhanced photocatalytic performance. Langmuir 2015, 31, 10922–10930. [Google Scholar] [CrossRef] [PubMed]
- Pauly, N.; Tougaard, S.; Yubero, F. Determination of the Cu 2p primary excitation spectra for Cu, Cu2O and CuO. Surf. Sci. 2014, 620, 17–22. [Google Scholar] [CrossRef]
- Li, G.; Dimitrijevic, N.M.; Chen, L.; Rajh, T.; Gray, K.A. Role of surface/interfacial Cu2+ sites in the photocatalytic activity of coupled CuO− TiO2 nanocomposites. J. Phys. Chem. C 2008, 112, 19040–19044. [Google Scholar] [CrossRef]
- Zhang, W.; Zou, L.; Lewis, R.; Dionysio, D. A Review of Visible-Light Sensitive TiO2 Synthesis via Sol-Gel N-Doping for the Degradation of Dissolved Organic Compounds in Wastewater Treatment. J. Mater. Sci. Chem. Eng. 2014, 2, 28. [Google Scholar]
- Kumar, M.K.; Bhavani, K.; Srinivas, B.; Kumar, S.N.; Sudhakar, M.; Naresh, G.; Venugopal, A. Nano structured bismuth and nitrogen co-doped TiO2 as an efficient light harvesting photocatalyst under natural sunlight for the production of H2 by H2O splitting. Appl. Catal. A Gen. 2016, 515, 91–100. [Google Scholar] [CrossRef]
- Memesa, M.; Lenz, S.; Emmerling, S.G.; Nett, S.; Perlich, J.; Müller-Buschbaum, P.; Gutmann, J.S. Morphology and photoluminescence study of titania nanoparticles. Colloid Polym. Sci. 2011, 289, 943–953. [Google Scholar] [CrossRef] [PubMed]
- Hafez, H.; Lan, Z.; Li, Q.; Wu, J. High efficiency dye-sensitized solar cell based on novel TiO2 nanorod/nanoparticle bilayer electrode. Nanotechnol. Sci. Appl. 2010, 3, 45–51. [Google Scholar] [CrossRef] [PubMed]
- Pavasupree, S.; Ngamsinlapasathian, S.; Nakajima, M.; Suzuki, Y.; Yoshikawa, S. Synthesis, characterization, photocatalytic activity and dye-sensitized solar cell performance of nanorods/nanoparticles TiO2 with mesoporous structure. J. Photochem. Photobiol. A Chem. 2006, 184, 163–169. [Google Scholar] [CrossRef]
- Park, H.; Park, Y.; Kim, W.; Choi, W. Surface modification of TiO2 photocatalyst for environmental applications. J. Photochem. Photobiol. C Photochem. Rev. 2013, 15, 1–20. [Google Scholar] [CrossRef]


| Year | Preparations | Results | References |
|---|---|---|---|
| Methods | |||
| Materials | |||
| Light Source | |||
| 2011 | Photolysis SMZ concentration (5 ppm), TiO2 concentration (0.05 to 0.25 g/L) Mercury lamp | No full mineralization of SMZ was achieved 25% SMZ degradation after 1 h Cyanuric acid present as final product Pseudo first order | Munoz et al. [25] |
| 2014 | Sonocatalytic, Photocatalytic, Sonophotocatalytic SMZ concentration (5 ppm), Au-TiO2 concentration (0.2 g/L to 3.0 g/L) Visible light | Order if degradation of SMZ after 7 h degradation (Sonophotocatalysis, 43% > Sonocatalysis, 31% > Photocatalysis, 26%) 1.5 g/L is the optimum Au-TiO2 concentration Pseudo first order | Sathishkumar et al. [7] |
| 2013 | Ultrasonication-assisted sequential chemical bath deposition 0.14 g Copper acetate Cu2O loaded TiO2 Visible light | Rhodamine B degradation After 19 min, 24.96% Cu2O/TiO2 of RhB degraded Photoelectrocatalysis, 84.29% > electrocatalysis, 41.07% > photocatalysis, 5.00% > selfdegradation, 1.45% Pseudo first order | Wang et al. [17] |
| 2013 | SMZ concentration (0.06 ppm) Degussa P25 (0.05 to 0.80 g/L) H2O2 (4 mM) Visible light | Optimum condition (pH 6.5, TiO2 0.1 g/L, [H2O2] 4 mM, 0.5 mM Cr(VI) In 20 min, >97% of SMZ degraded with the presence of Cr(VI), 120 min to achieve without Cr(VI) | Rao et al. [14] |
| 2009 | SMZ concentration (0.025 mM), Degussa P25 (0.1 g/L) UV light | Optimum condition (pH 9, TiO2 0.1 g/L) Pseudo first order | Chu et al. [4] |
| Parameters | Cu-00 | Cu-01 | Cu-02 | Cu-03 | Cu-04 |
|---|---|---|---|---|---|
| Length of tube, L (nm) | 1288.0 | 1220.0 | 667.0 | 556.0 | 334.0 |
| Pore Size, D (nm) | 37.5 | 68.7 | 49.0 | 48.0 | 44.5 |
| Wall thickness, W (nm) | 33.4 | 7.3 | 10.3 | 8.5 | 4.4 |
| Interpore distance, A (nm) | 77.2 | 72.5 | 73.3 | 68.6 | 49.5 |
| Aspect ratio, R | 12.3 | 14.6 | 9.6 | 8.6 | 6.3 |
| Geometric surface area factor, G | 61.9 | 97.9 | 60.2 | 54.9 | 42.7 |
| Sample | Element | wt % | atomic % |
|---|---|---|---|
| Cu-00 | Ti | 56.62 | 30.35 |
| O | 43.38 | 69.95 | |
| Cu-01 | Ti | 52.45 | 27.08 |
| O | 47.04 | 72.72 | |
| Cu | 0.51 | 0.20 | |
| Cu-02 | Ti | 73.20 | 48.73 |
| O | 25.36 | 50.55 | |
| Cu | 1.43 | 0.72 | |
| Cu-03 | Ti | 74.90 | 50.18 |
| O | 24.75 | 49.64 | |
| Cu | 0.36 | 0.18 | |
| Cu-04 | Ti | 73.66 | 48.33 |
| O | 26.28 | 51.63 | |
| Cu | 0.06 | 0.03 |
| Sample | Kinetic Rate (h−1) |
|---|---|
| Cu-00 | 0.0124 |
| Cu-01 | 0.0135 |
| Cu-02 | 0.0062 |
| Cu-03 | 0.0135 |
| Cu-04 | 0.0106 |
| Label | Fabrication Electrolyte |
|---|---|
| Cu-00 | TiO2 |
| Cu-01 | TiO2 + Cu (0.45 wt %) |
| Cu-02 | TiO2 + Cu (0.90 wt %) |
| Cu-03 | TiO2 + Cu (1.35 wt %) |
| Cu-04 | TiO2 + Cu (1.80 wt %) |
© 2016 by the authors; licensee MDPI, Basel, Switzerland. This article is an open access article distributed under the terms and conditions of the Creative Commons Attribution (CC-BY) license (http://creativecommons.org/licenses/by/4.0/).
Share and Cite
Meriam Suhaimy, S.H.; Abd Hamid, S.B.; Lai, C.W.; Hasan, M.R.; Johan, M.R. TiO2 Nanotubes Supported Cu Nanoparticles for Improving Photocatalytic Degradation of Simazine under UV Illumination. Catalysts 2016, 6, 167. https://doi.org/10.3390/catal6110167
Meriam Suhaimy SH, Abd Hamid SB, Lai CW, Hasan MR, Johan MR. TiO2 Nanotubes Supported Cu Nanoparticles for Improving Photocatalytic Degradation of Simazine under UV Illumination. Catalysts. 2016; 6(11):167. https://doi.org/10.3390/catal6110167
Chicago/Turabian StyleMeriam Suhaimy, Syazwan Hanani, Sharifah Bee Abd Hamid, Chin Wei Lai, Md. Rakibul Hasan, and Mohd Rafie Johan. 2016. "TiO2 Nanotubes Supported Cu Nanoparticles for Improving Photocatalytic Degradation of Simazine under UV Illumination" Catalysts 6, no. 11: 167. https://doi.org/10.3390/catal6110167