Article

Gold-Iron Oxide Catalyst for CO Oxidation: Effect of Support Structure

1
Key Laboratory for Colloid and Interface Chemistry, Key Laboratory of Special Aggregated Materials, School of Chemistry and Chemical Engineering, Shandong University, Jinan 250100, China
2
Key Laboratory of Interfacial Physics and Technology, Shanghai Synchrotron Radiation Facility, Shanghai Institute of Applied Physics, Chinese Academy of Sciences, Shanghai 201204, China
*
Authors to whom correspondence should be addressed.
Catalysts 2016, 6(3), 37; https://doi.org/10.3390/catal6030037
Submission received: 26 November 2015 / Revised: 11 January 2016 / Accepted: 26 January 2016 / Published: 7 March 2016
(This article belongs to the Special Issue Surface Chemistry and Catalysis)

Abstract

:
Gold-iron oxide (Au/FeOx) is one of the highly active catalysts for CO oxidation, and is also a typical system for the study of the chemistry of gold catalysis. In this work, two different types of iron oxide supports, i.e., hydroxylated (Fe_OH) and dehydrated iron oxide (Fe_O), have been used for the deposition of gold via a deposition-precipitation (DP) method. The structure of iron oxide has been tuned by either selecting precipitated pH of 6.7–11.2 for Fe_OH or changing calcination temperature of from 200 to 600 °C for Fe_O. Then, 1 wt. % Au catalysts on these iron oxide supports were measured for low-temperature CO oxidation reaction. Both fresh and used samples have been characterized by multiple techniques including transmission electron microscopy (TEM) and high-resolution TEM (HRTEM), X-ray diffraction (XRD), X-ray photoelectron spectroscopy (XPS), X-ray absorption near edge structure (XANES) and temperature-programmed reduction by hydrogen (H2-TPR). It has been demonstrated that the surface properties of the iron oxide support, as well as the metal-support interaction, plays crucial roles on the performance of Au/FeOx catalysts in CO oxidation.

1. Introduction

Since the 1990s, nanosized gold interacting with oxide supports have been reported to be active for diverse redox reactions, among those low temperature oxidation of carbon monoxide is the most studied [1,2,3]. Such unique catalytic properties were found to be strongly dependent on electronic structure and local coordination environment of Au atoms. During the last two decades, different reducible metal oxides such as titanium oxide (TiO2) [4], cerium oxide (CeOx) [5,6] and iron oxide (FeOx) [7] have been proven to be active supports for deposition of gold. Although a full mechanism of this catalytic process still needs to be established, careful studies on strong metal-support interaction by the aid of various characterization techniques may provide further mechanistic insight [8,9,10,11]. For instance, Hutchings group reported that the delayered Au structure that was determined by high-angle annular dark-field scanning transmission electron microscopy (HAADF-STEM) characterization plays crucial roles in the CO oxidation reaction [8].
As one of the important functional materials, iron oxide (FeOx) has been extensively investigated in heterogeneous catalysis for its potential applications in CO oxidation [12,13], water-gas shift [14,15,16,17] and preferential oxidation of CO reaction [18,19,20]. The general FeOx supports include two different types: hydrated (Fe_OH), such as goethite or lepidocrocite FeOOH, and dehydrated (Fe_O), such as hematite α-Fe2O3, maghemite γ-Fe2O3 or magnetite Fe3O4. These complexities in composition and crystal periodicity provide rich structural models for gold deposition. On the other hand, various synthetic approaches, including so-gel method [21,22], hydrothermal method [23,24] and precipitation method [10,25], have been applied to control the size and shape of the iron oxide itself, aiming to delicately tune the interaction between metal and oxide matrix, as well as the local structure of active metals. Among them, the precipitation method is simple and easy to operate. It can easily control the synthesis parameters and achieve larger surface area. Furthermore, the precipitating conditions of Fe2+ or Fe3+ precursor has been identified as one of the key factors governing the structure and texture of the FeOx products. Focusing on synthesis, the final pH value of the stock solution and the calcination temperature of the as-dried materials, which have not been widely studied so far [26,27], could be very important parameters for the preparation of high-quality iron oxide support.
Different techniques, including X-ray diffraction (XRD) [25], X-ray absorption fine structure (XAFS) [16], X-ray photoelectron spectroscopy (XPS) [16] and transmission electron microscopy (TEM) [28], have been used to characterize both bulk and surface structure of gold-iron oxide catalysts and further study the related active site for the low-temperature CO oxidation. Due to the complicated crystal and local structures in bulk and microdomain, the combination of multiple characterization skills, rather than a single means, is extremely important to obtain the real structural information.
Therefore, in the present work, we try to broadly explore the relationship between the nature of the oxide matrix and the catalytic reactivity of Au/FeOx via deposition-precipitation with two series of iron oxides, namely hydrated (Fe_OH) and dehydrated (Fe_O) supports, to fully investigate the importance of preparation parameters such as precipitating pH values and calcination temperature in synthesis of FeOx, and to deeply study the “structure-activity” relationship in Au/FeOx system for the low-temperature CO oxidation reaction.

2. Results and Discussion

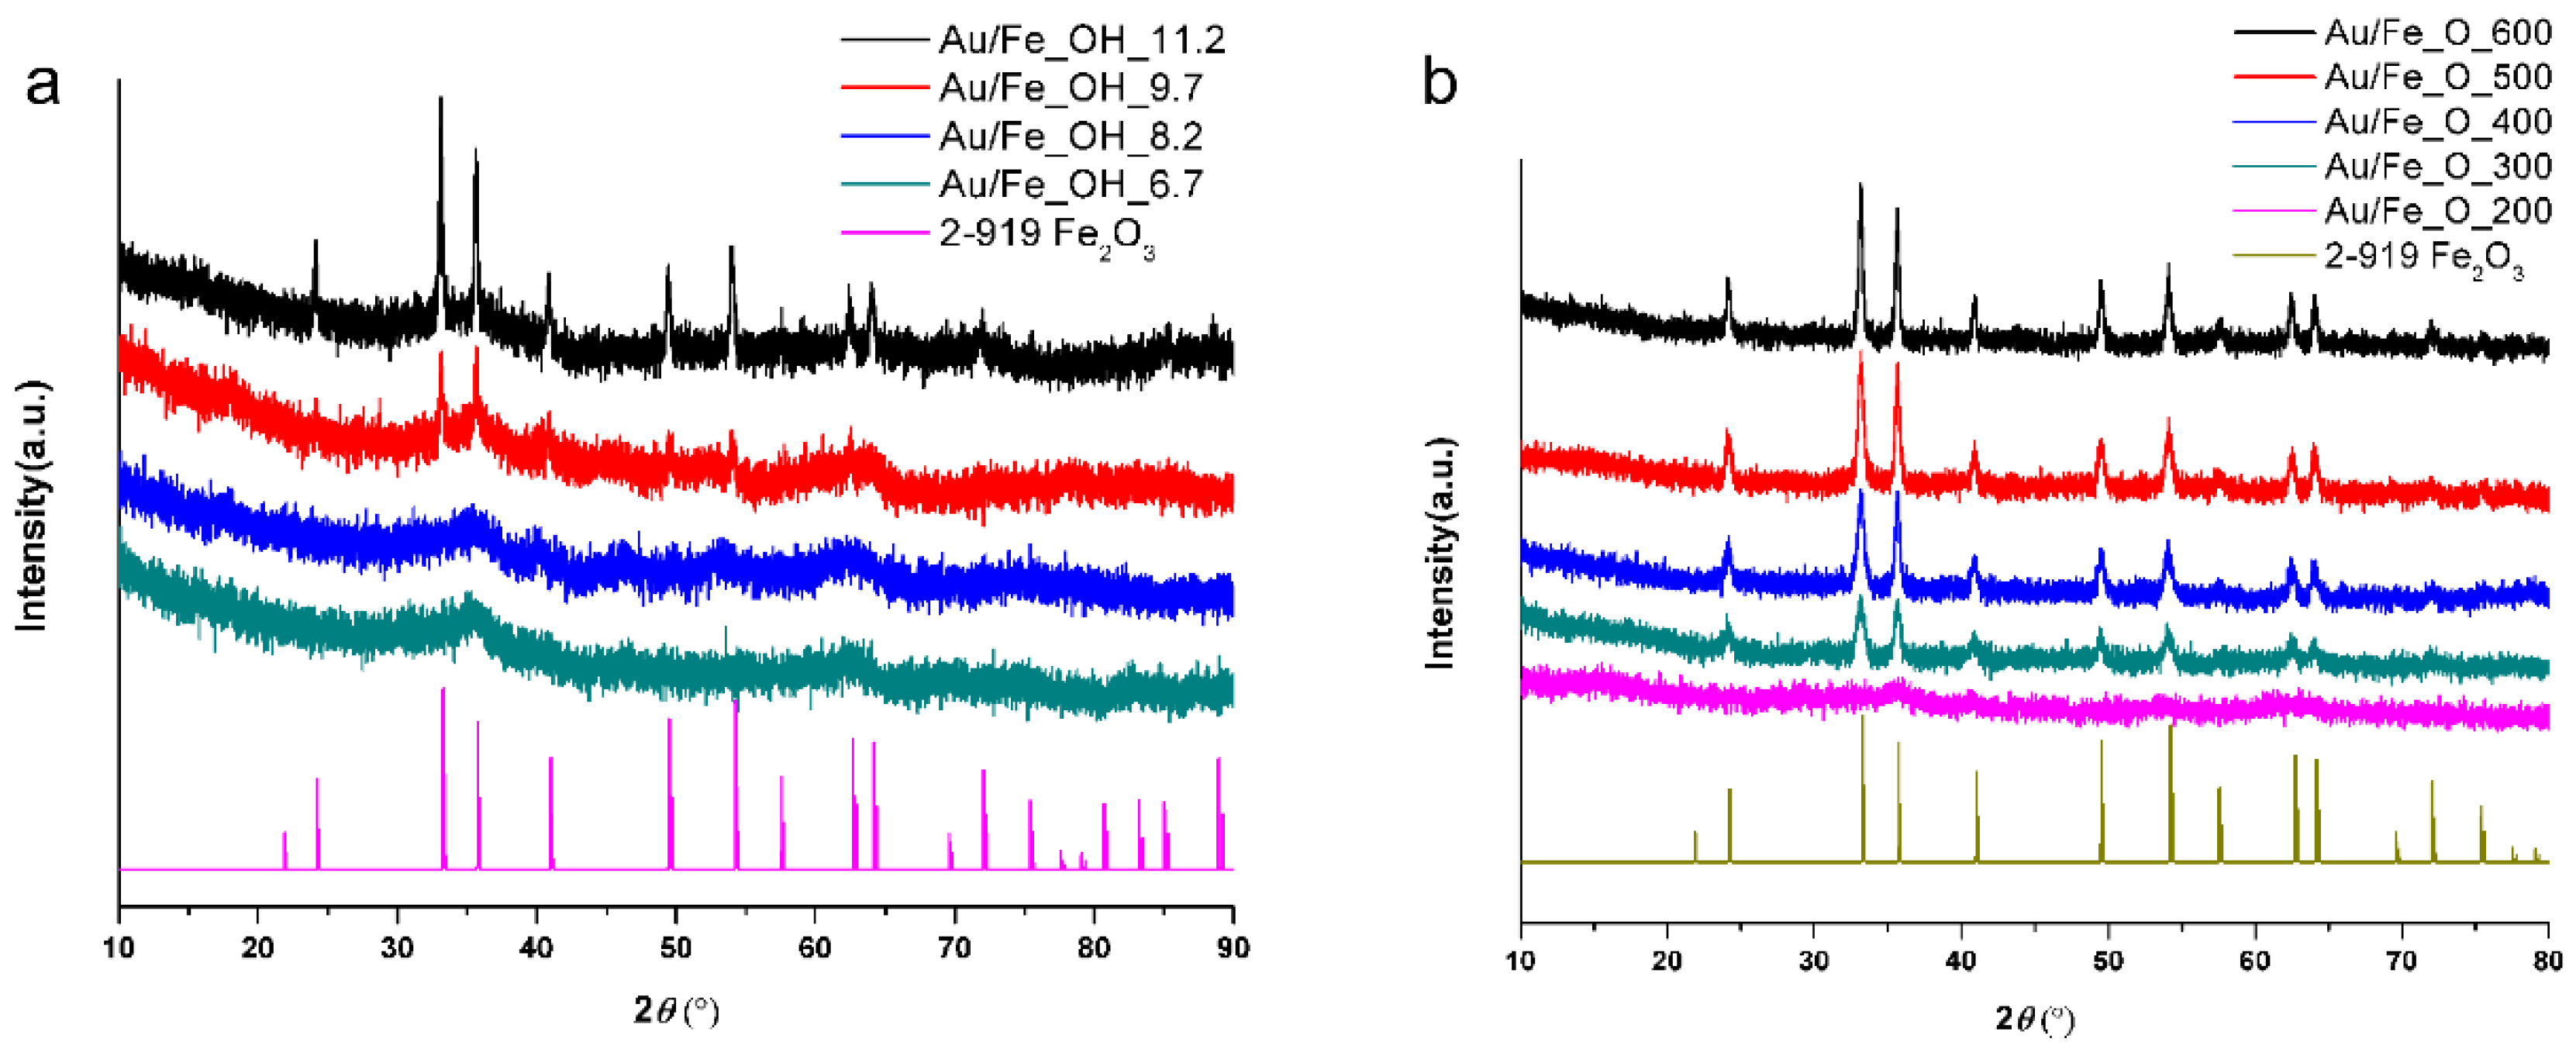
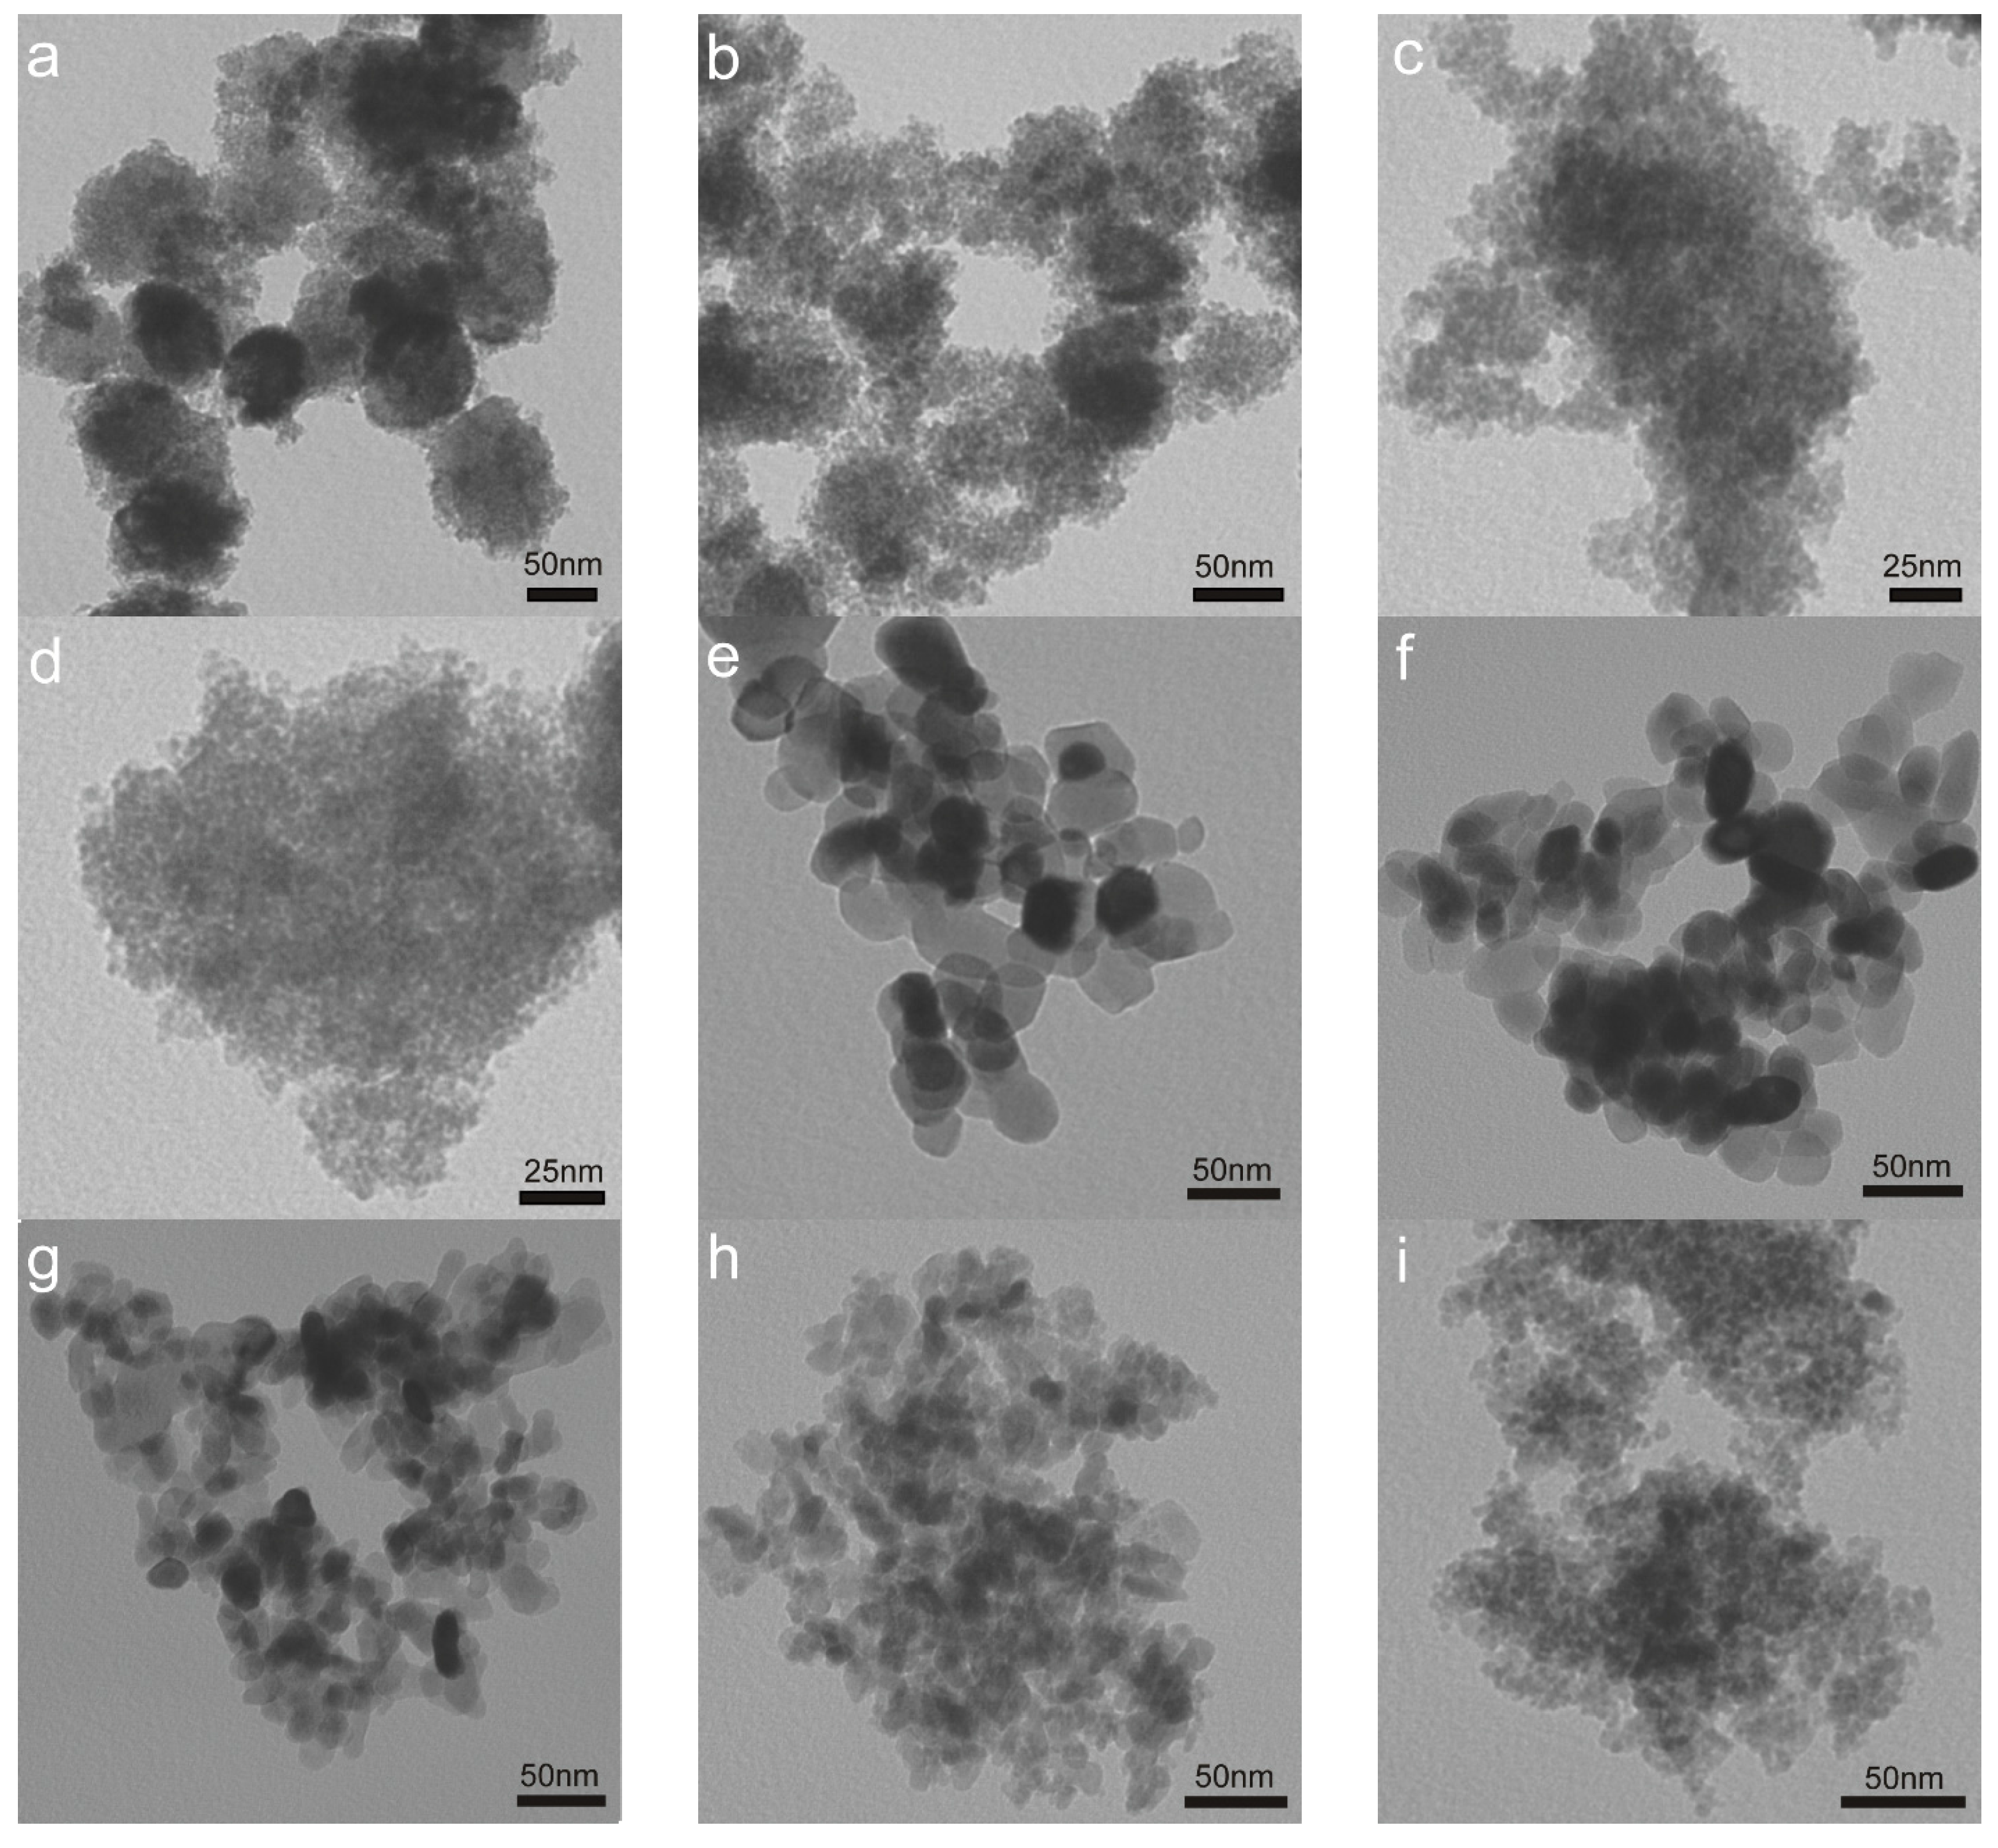
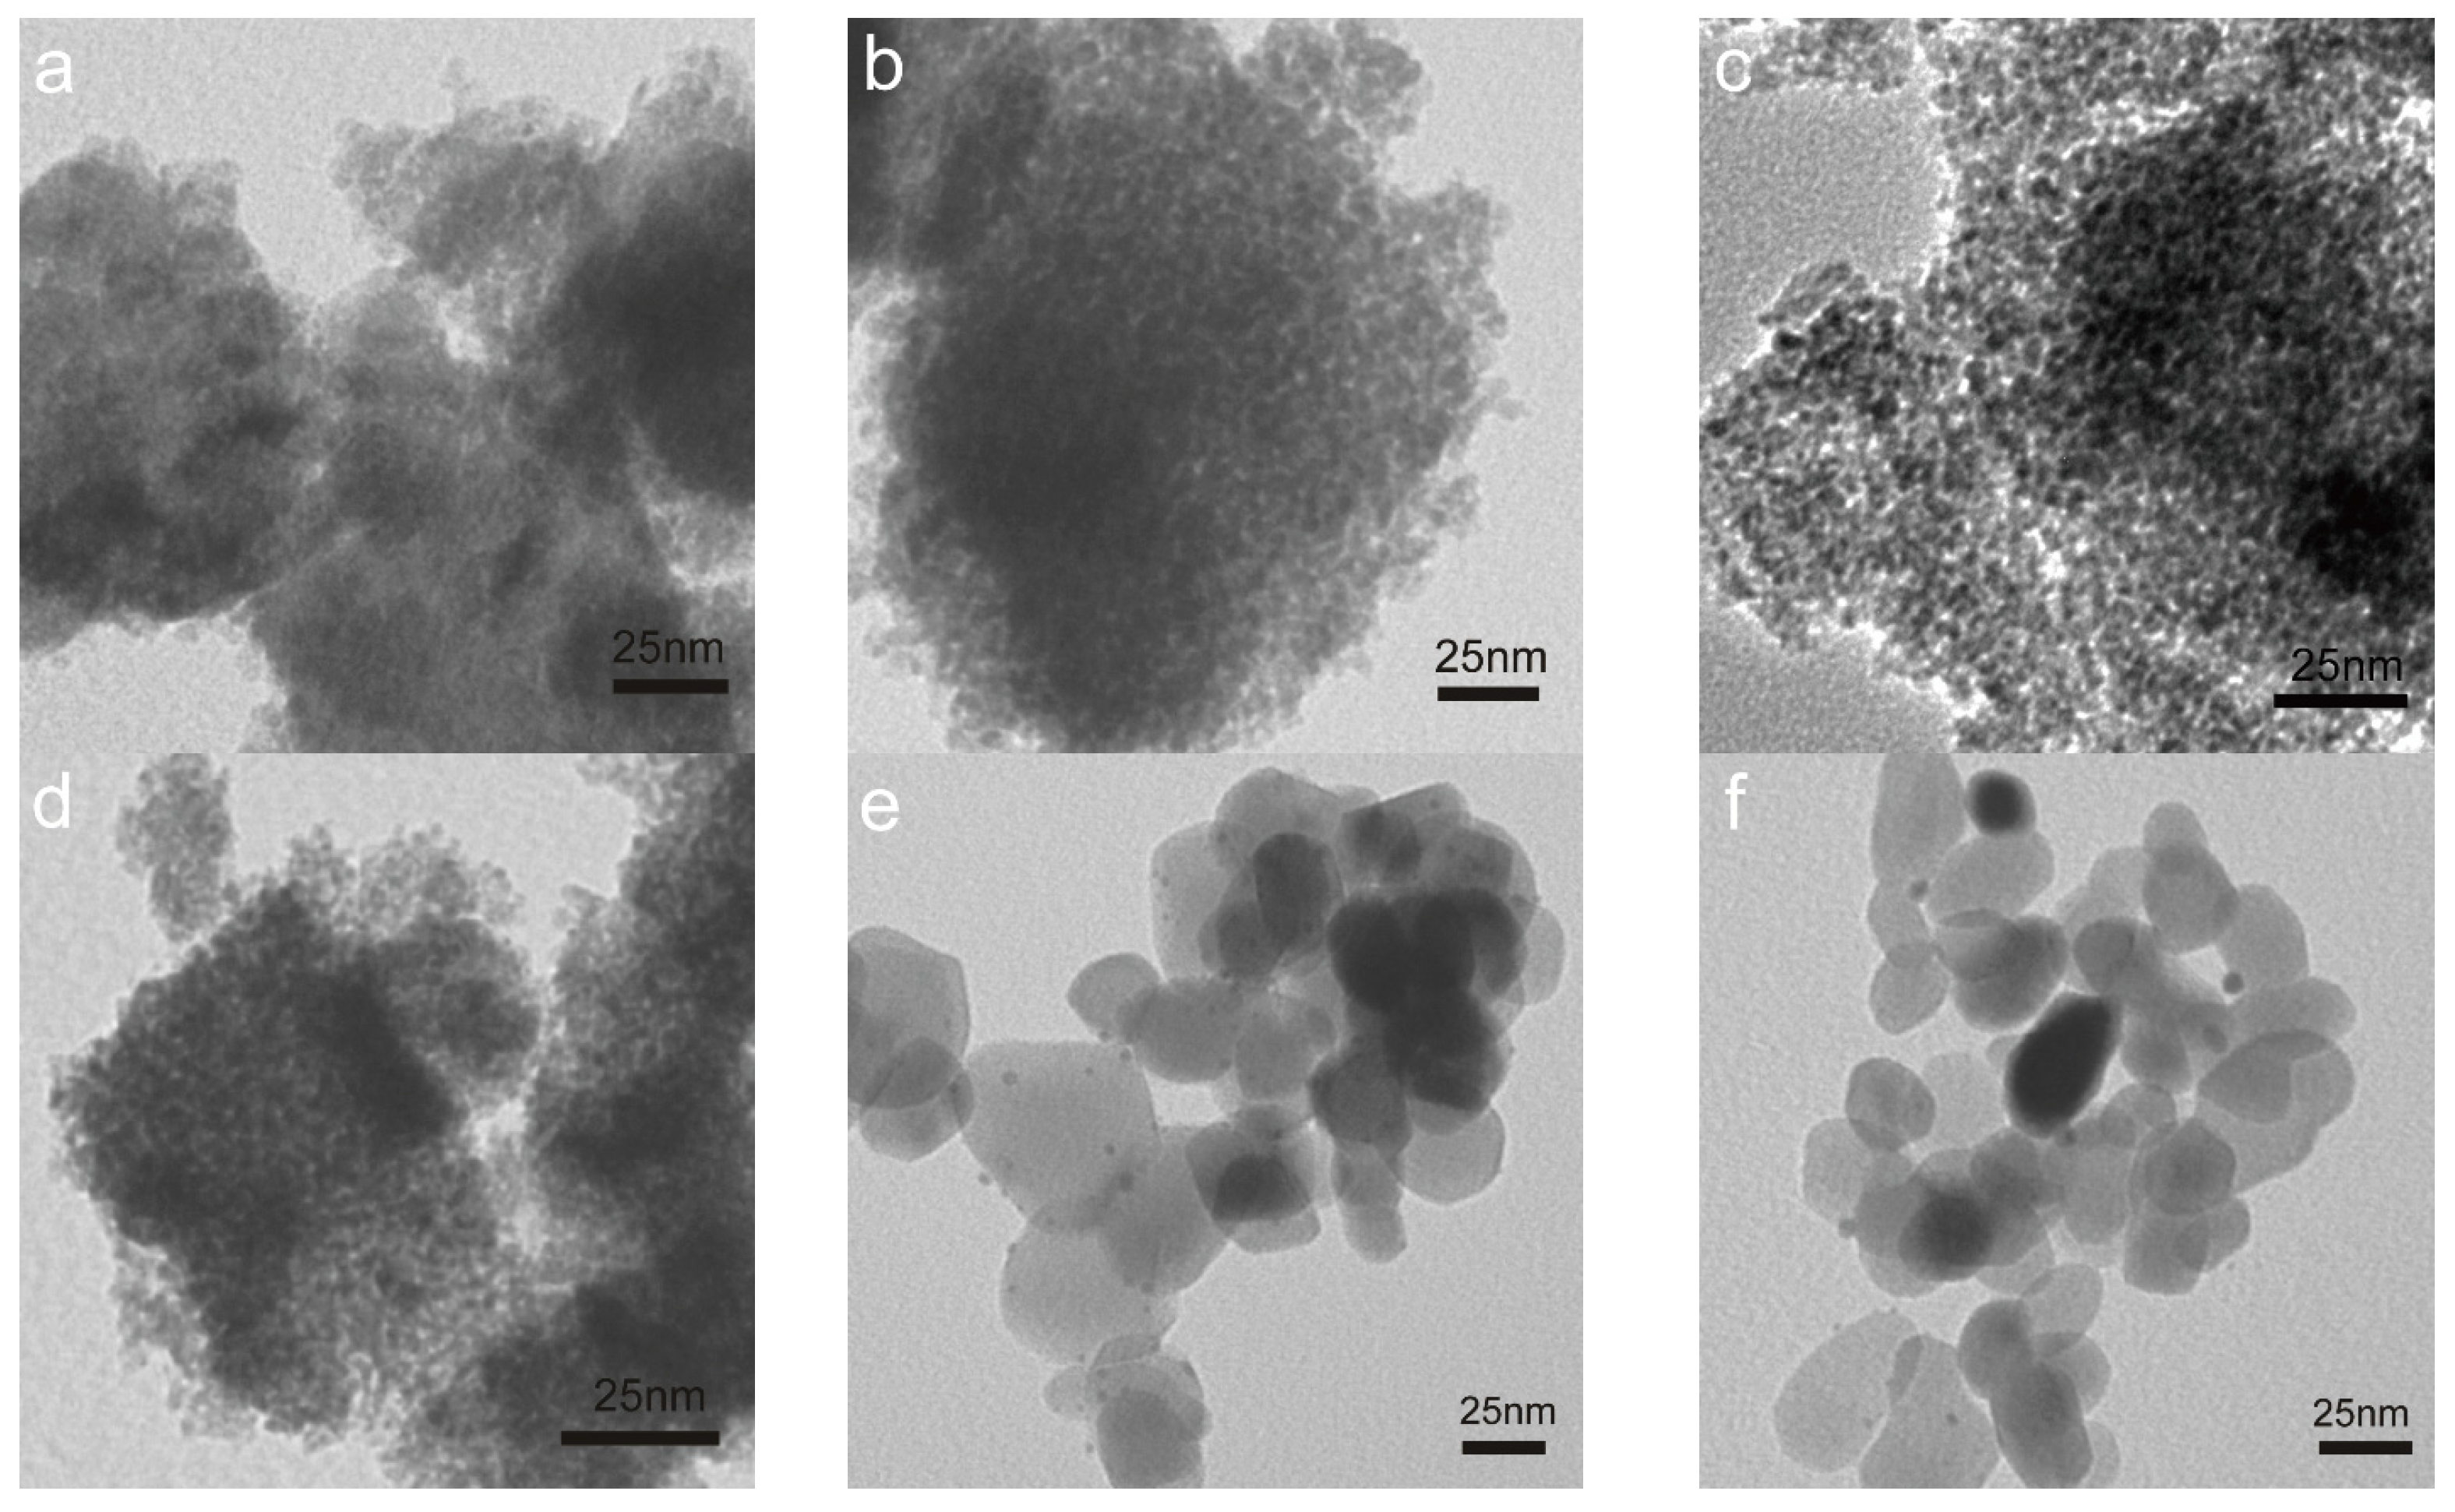
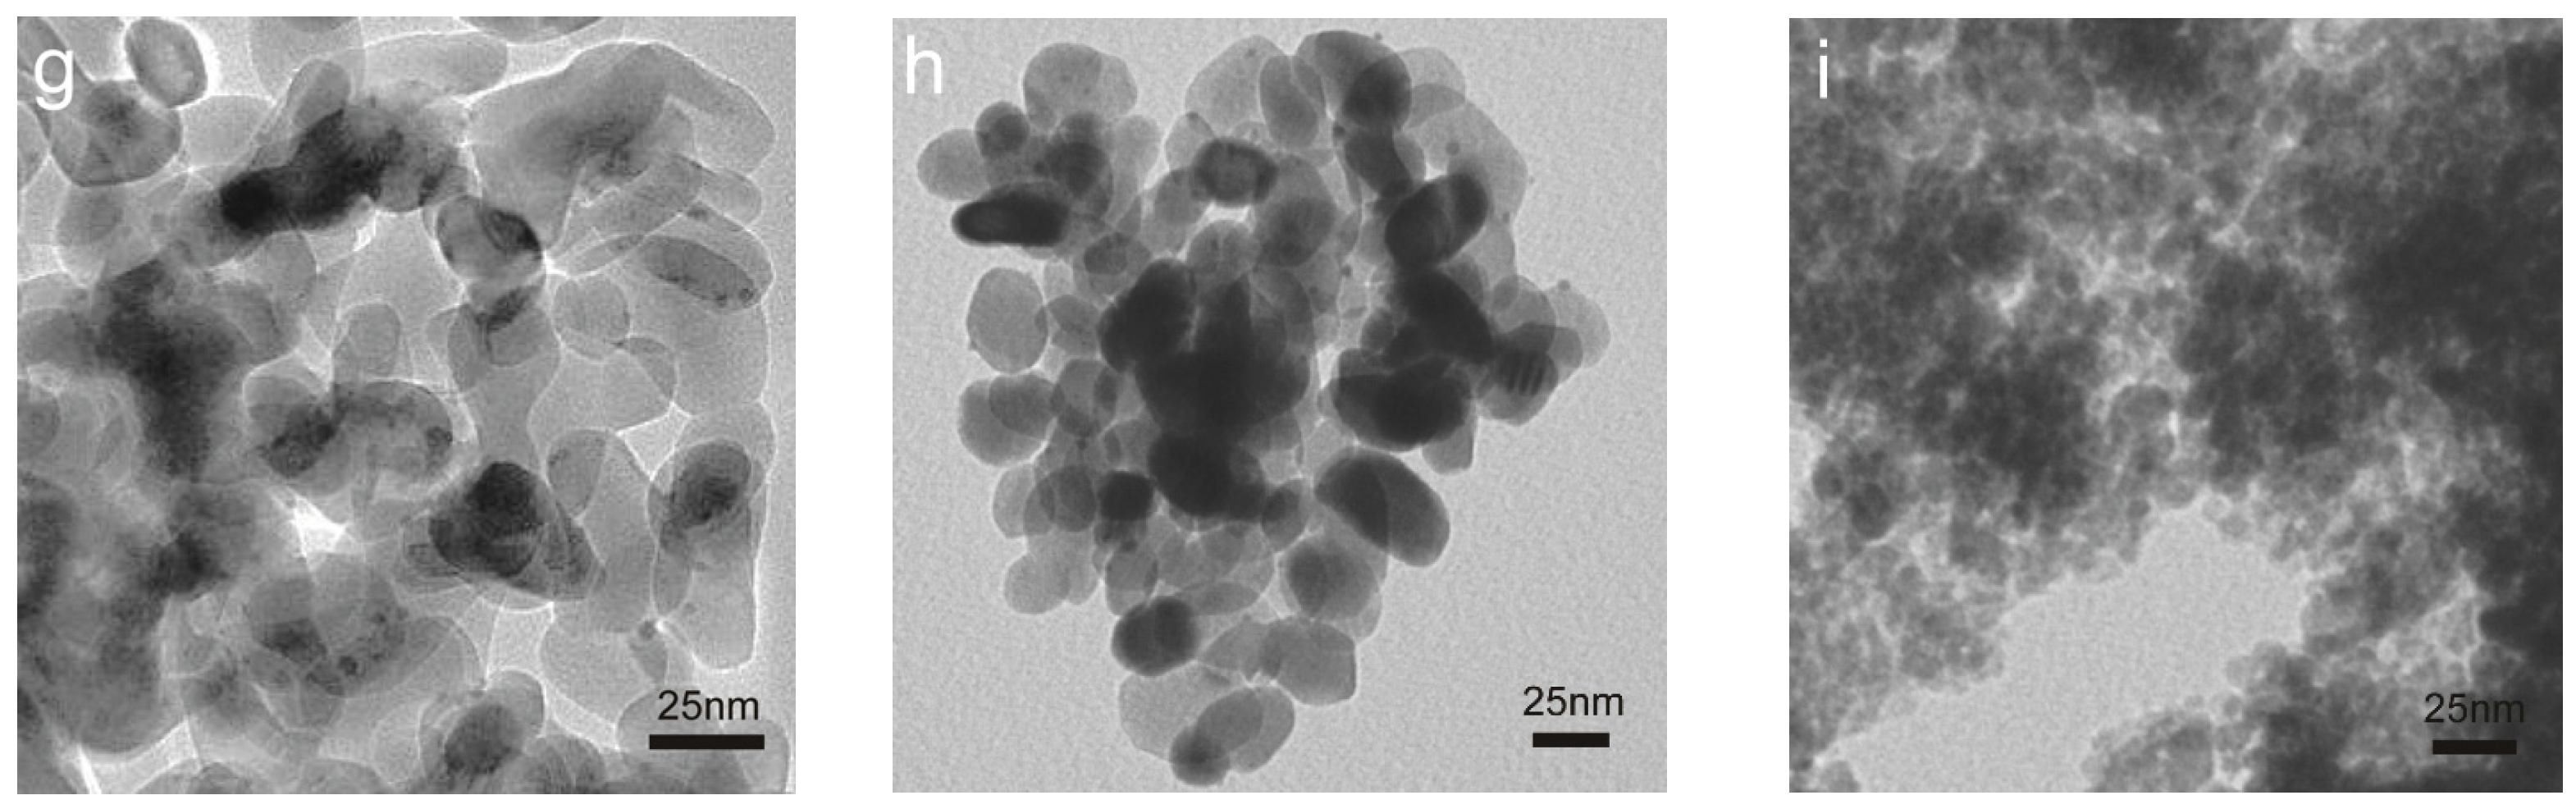
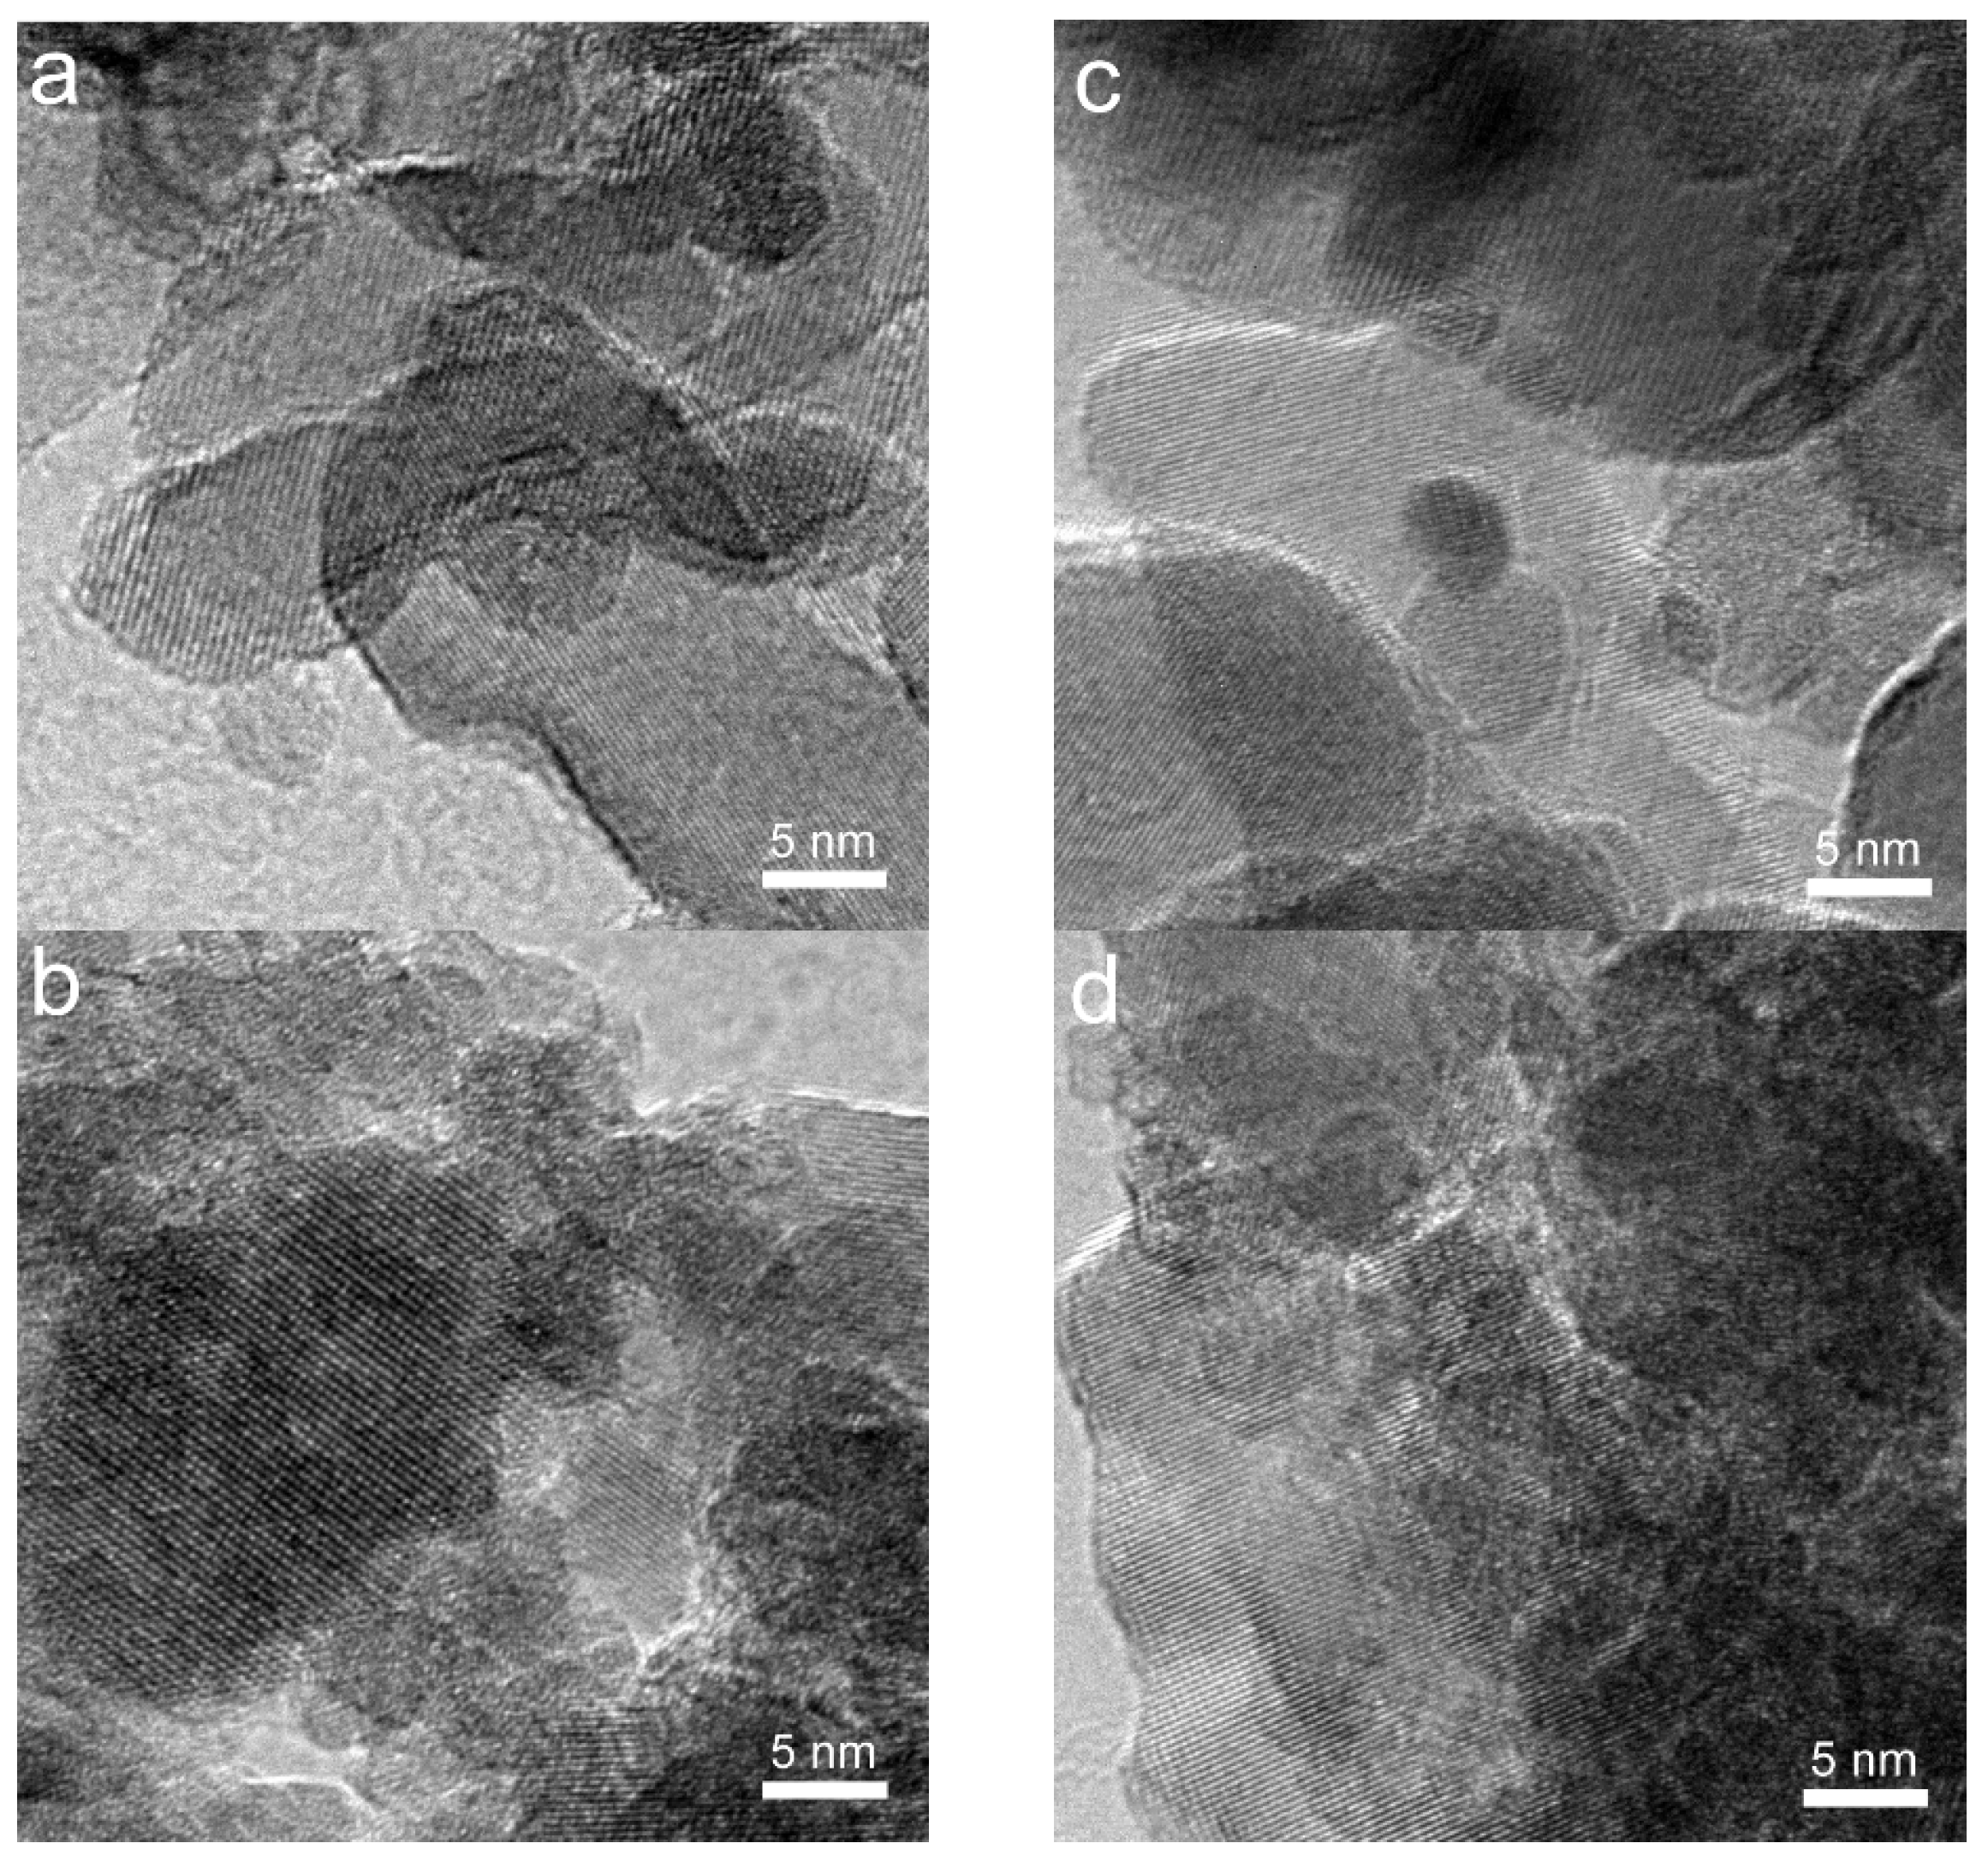
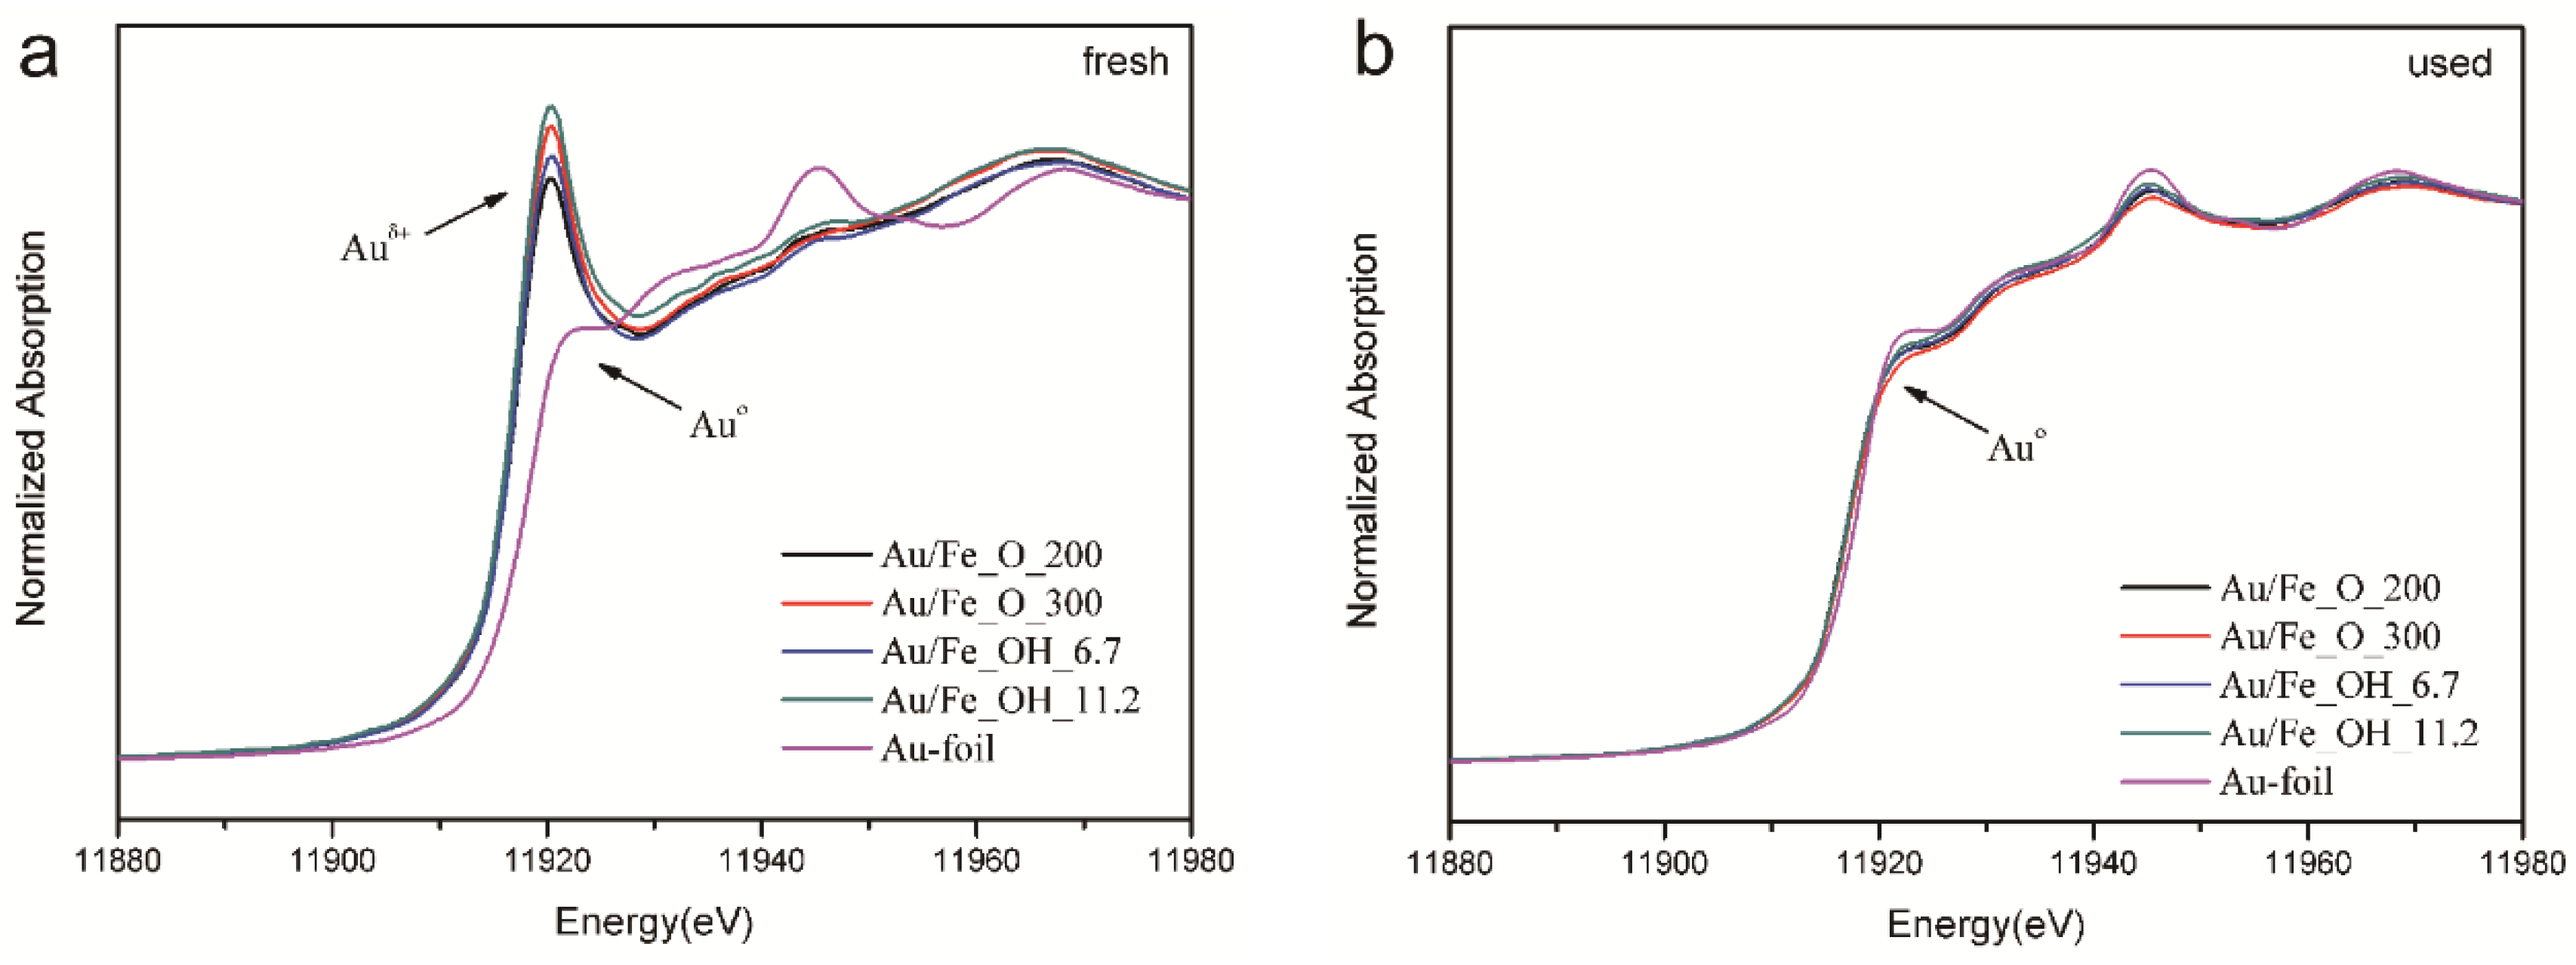
2.1. Structure and Texture of Gold-Iron Oxide Catalyst

The inductively coupled plasma atomic emission spectroscopy (ICP-AES) characterization was conducted to identify the gold loadings in both Fe_OH and Fe_O supports. Table 1 shows that the experimental bulk Au concentrations (Aubulk) in all the measured samples are in good agreement with the target value (0.54 at. %), revealing no gold loss in DP synthesis. The BET specific surface areas (SBET) of the fresh Au/FeOx catalysts are summarized in Table 1. Since the hydrated iron oxide (Fe_OH) supports were uncalcined, the corresponding SBET values for Au/Fe_OH (151–212 m2/g) are distinctly higher than those for Au/Fe_O (27–136 m2/g), in which the dehydrated iron oxide (Fe_O) supports were calcined at different temperatures in the range of 200–600 °C. For Au/Fe_OH series, the SBET number decreases with the increase of precipitating pH value of Fe_OH from 6.7 to 11.2, possibly indicating better crystallinity of iron oxide support with more hydroxyls used in preparation. For Au/Fe_O series, the SBET number decreases with the increase of calcination temperature of Fe_O from 200 to 600 °C, giving hints on the elimination of surface OH groups during the heat-treatment process. Thus, the textural properties of iron oxide supports, as well as the final Au/FeOx catalysts, are strongly dependent by the synthetic parameters used in experiments.
XRD was carried out to determine the crystal structure of the fresh Au/FeOx catalysts. Figure 1a displays an amorphous phase for Au/Fe_OH_6.7 and Au/Fe_OH_8.2, or partially crystallized structure of Au/Fe_OH_9.7 and Au/Fe_OH_11.2 with further increasing on the applied pH value. The corresponding crystal phase is hematite α-Fe2O3 (JCPDS card No: 2-919), consistent with previous reports on gold-iron oxide catalysts [28]. Comparable to the above characterization results on surface area, the precipitating pH significantly affected the crystallinity of Fe_OH support, and further modified the structural properties of Au/Fe_OH catalyst. Figure 1b exhibits that the crystallinity of Au/Fe_O was clearly enhanced by applying higher calcination temperature on Fe_O support, while the crystal phase was kept as hematite α-Fe2O3. We also noticed that all measured samples were fully crystallized if the iron oxide support was calcined above 200 °C, which is in good agreement with the previous findings [28]. However, no Au diffraction peaks can be identified in Figure 1 due to the presence of gold in the form of amorphous or the low Au concentrations (~0.54 at. %).
TEM was conducted to identify the morphology of fresh Au/FeOx catalysts, i.e., the size and shape for gold or iron oxide support. No Au nanoparticles have been observed in all the pictures in Figure 2, confirming that gold was still in the form of atoms or ultra-fine (<2 nm) clusters for the as-dried (60 °C) samples. This was also in good agreement with our previous results on Au/FeOx [28]. For the iron oxide support, it can be seen from the TEM images that small-size (<5 nm) aggregates were observed for amorphous Fe_OH, Au/Fe_OH_6.7 (Figure 2d), Au/Fe_OH_8.2 (Figure 2c) and Au/Fe_O_200 (Figure 2i); big-size particles (10–50 nm) were identified for fully crystallized Au/Fe_O_600 (Figure 2e), Au/Fe_O_500 (Figure 2f), Au/Fe_O_400 (Figure 2g) and Au/Fe_O_300 (Figure 2h); and a mixture of small aggregates and big particles was confirmed for partially crystallized Au/Fe_OH_11.2 (Figure 2a) and Au/Fe_OH_9.7 (Figure 2b). These results were well consistent with the related XRD data.
For the used catalysts, we found from Figure 3 that the morphologies of iron oxide supports were maintained for all the tested samples under the mild reaction conditions (up to 300 °C and less than 1.5 h). Gold particles with size of ca. 2 nm can be identified for gold on the fully crystallized Fe_O supports (Figure 3e–h). However, gold species cannot be distinguished clearly in Au/Fe_OH catalysts due to the amorphous state of Fe_OH particles, so the structure of gold in Au/Fe_OH is to be investigated using other techniques such as XPS and XAFS (these will be mentioned later). HRTEM was used to determine the crystallinity of iron oxide supports. Figure 4a–d exhibits the highly crystallized nature of Fe_O for Au/Fe_O_300 and Au/Fe_O_200, either fresh or used in CO oxidation.

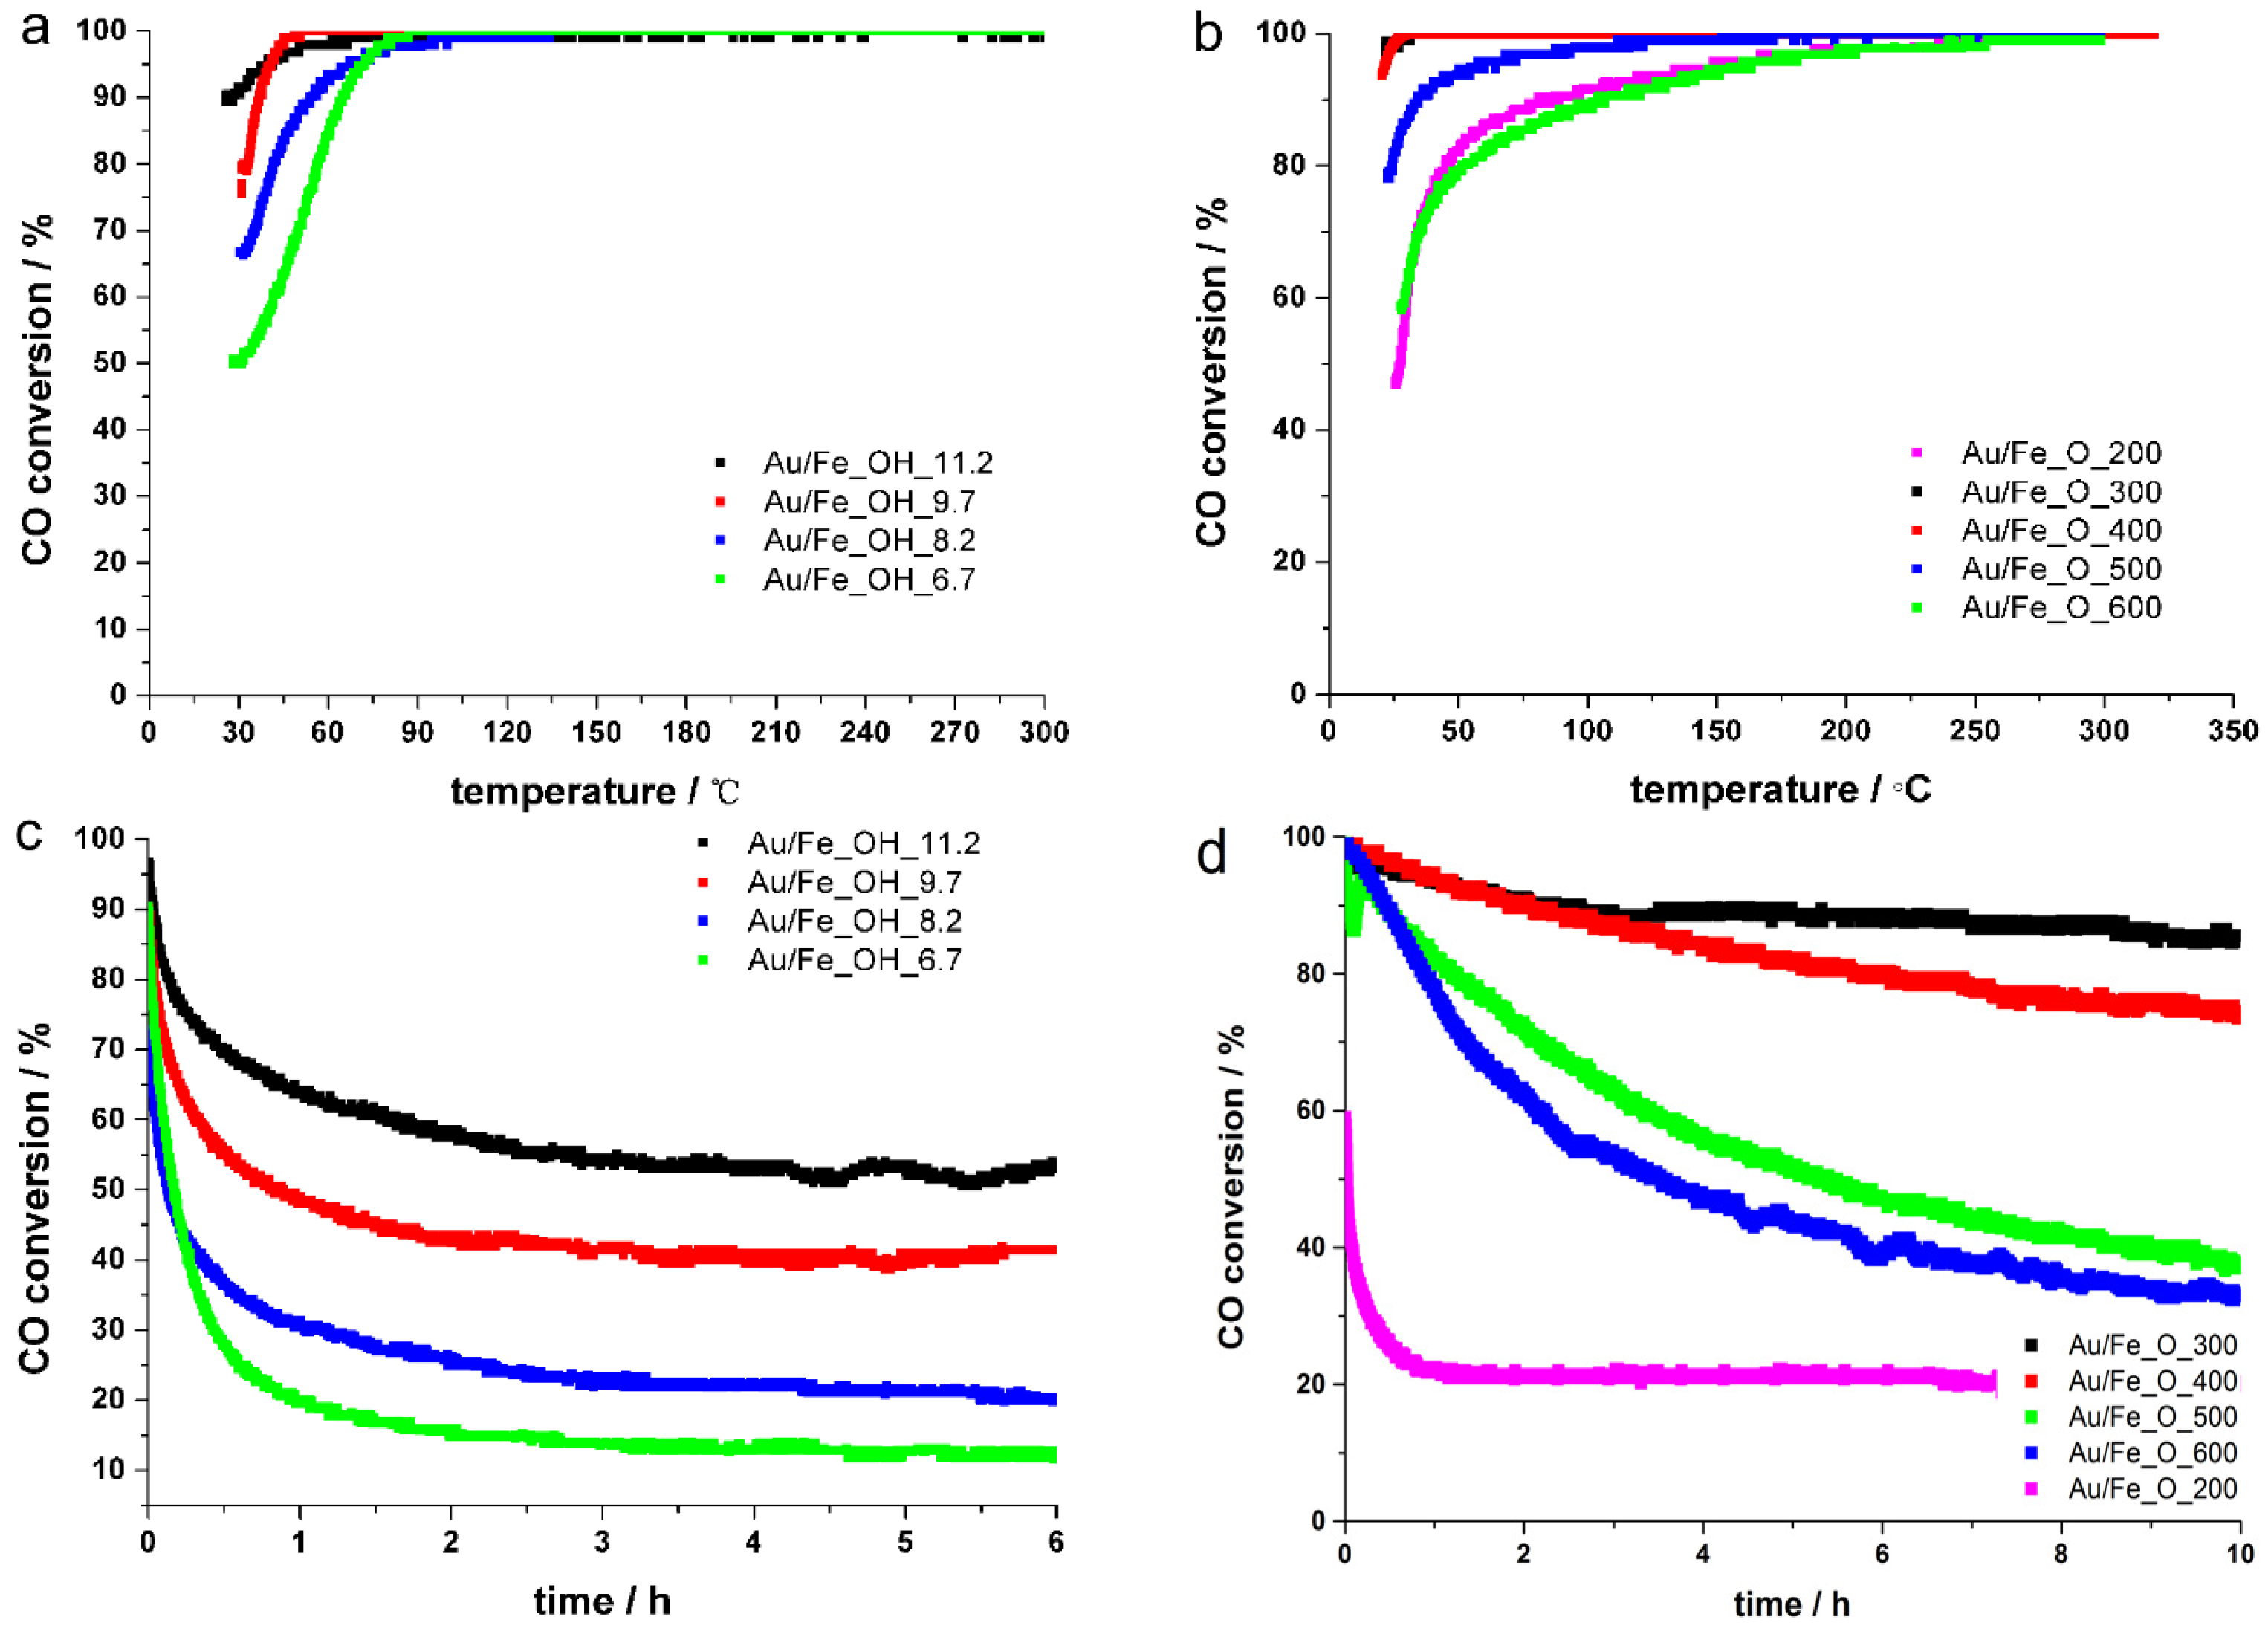
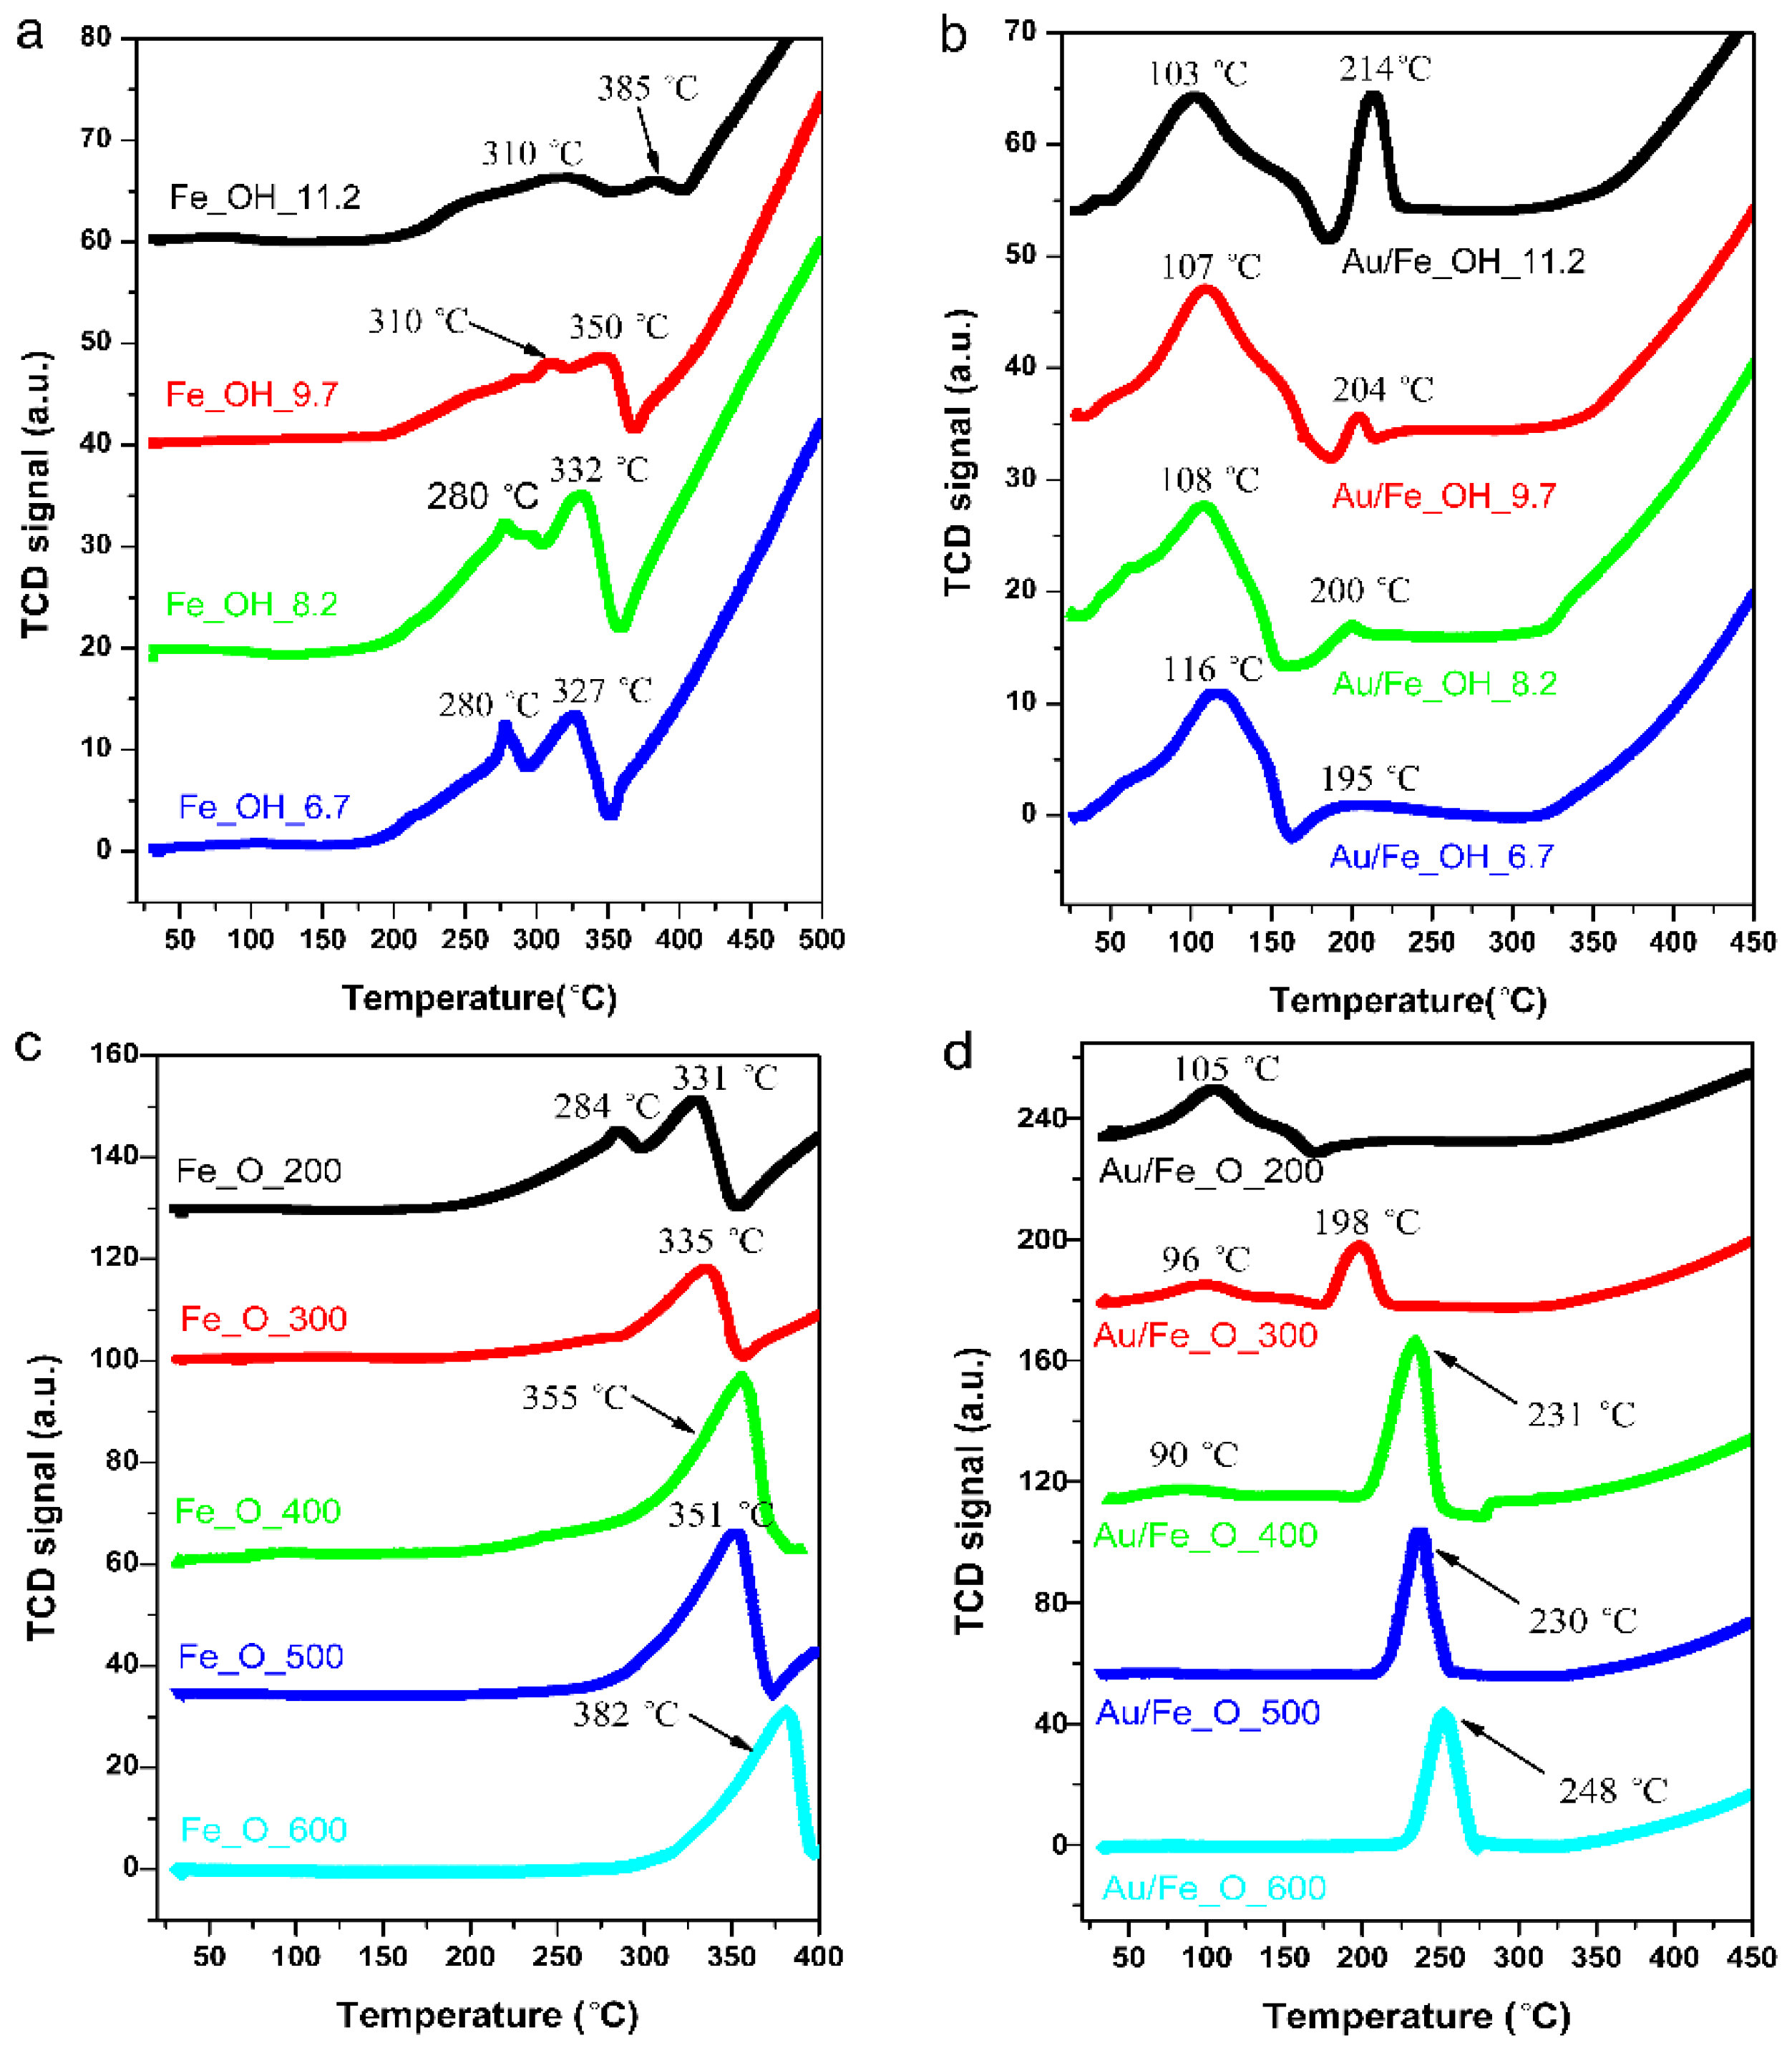
2.2. Catalytic Performance and Reducibility of Gold-Iron Oxide Catalyst

The catalytic performance of the Au/FeOx catalysts was evaluated for the low-temperature CO oxidation. The transient profiles in Figure 5a reveal a lower “light off” temperature or a higher activity for gold on hydrated iron oxide support synthesized with an increasing pH value. The 90% CO conversion temperature (T90) was 62 °C for Au/Fe_OH_6.7, while it was 25 °C for Au/Fe_OH_11.2. The corresponding “steady-state” experiments in Figure 5c confirmed that the long-term CO conversions at 30 °C after 6 h were stabilized at 53%, 41%, 20% and 11% for the Fe_OH precipitating pH value of 11.2, 9.7, 8.2 and 6.7, respectively. All of the above demonstrate the following sequence of catalytic reactivity on Au/Fe_OH for the CO oxidation reaction: Au/Fe_OH_11.2 > Au/Fe_OH_9.7 > Au/Fe_OH_8.2 > Au/Fe_OH_6.7. In our previous work, pH = 8.2 was applied to prepare Fe_OH [28], which was based on reported synthesis [8,12]. It is noticed that the long-term stability of Au/Fe_OH_8.2 in final CO conversion was lower than that reported previously [28]. We repeated the catalytic tests at 30 °C several times and found that the deactivation behavior varied with the testing periods. Thus, we selected the catalytic data collected during the same periods between different gold-iron samples. The current results shown in Figure 5 justifies the optimized pH value is 11.2 for the hydrated iron oxide support, and thus the catalytic reactivity can be enhanced by tuning the precipitation pH values in the synthesis of Fe_OH supports.
For gold on dehydrated iron oxide support, the related CO oxidation transient profiles are shown in Figure 5b. Here, we need to control the CO conversion at the modest level and select the pH value of 8.2 for the preparation of initial Fe_OH. This can effectively avoid the too small differences on the reactivity of CO oxidation when we investigate the effect of calcination temperature towards the Fe_O support. Clearly, Au/Fe_O_300 was superior to Au/Fe_O_200, displaying distinct lower T90 (20 °C vs. 85 °C). Au/Fe_O_400 was almost identical to Au/Fe_O_300, while the reactivity of Au/Fe_O_500 and Au/Fe_O_600 dropped quickly with higher T90 of 35 °C and 103 °C, respectively. The long-term “steady-state” experiments in Figure 5d verify a similar trend for Au/Fe_O series. At a constant temperature of 30 °C, the stabilized CO conversions after 6–10 h on stream were 85%, 70%, 40%, 32% and 20% for the Fe_O calcination temperature of 300, 400, 500, 600 and 200 °C, respectively. All of the above demonstrate the following sequence of catalytic reactivity on Au/Fe_O for the CO oxidation reaction: Au/Fe_O_300 > Au/Fe_O_400 > Au/Fe_O_500 > Au/Fe_O_600 > Au/Fe_O_200. Previously, air-calcination at 400 °C was chosen to obtain the Fe_O support [28] which is also the optimized parameter according to our present work.
To correlate the catalytic reactivity of CO oxidation with the structure of gold-iron oxide, we carried out the H2-TPR tests on both fresh Au/Fe_OH or Au/Fe_O catalysts and the corresponding Fe_OH or Fe_O supports. For the Au/Fe_OH series, the reduction of Fe_OH supports (Figure 6a) can be divided into two parts. The low-temperature reduction peaks between 180–220 °C and 350–400 °C can be attributed to the transformation of Fe_OH→Fe3O4 (first Fe_OH→Fe2O3 and then Fe2O3→Fe3O4) [29], and the hydrogen consumption amount as shown in Table 2 clearly decreased from Fe_OH_6.7 to Fe_OH_11.2, probably due to less surface hydroxyls for the high precipitating pH value. The onset of high-temperature reduction peak, assigned to the conversion of Fe3O4→FeO or Fe [29], was located at 350–400 °C.
By the introduction of gold, Figure 6b exhibits that the reduction of Fe3O4→FeO or Fe was almost maintained. However, the reduction of Fe_OH→Fe3O4 was significantly shifted to lower temperature range of 30–230 °C, and included a broad peak around 30–180 °C (Fe_OH→Fe2O3) and a sharp reduction centered at 195–214 °C (Fe2O3→Fe3O4). This shift originated from the Au activation [30], or the strong interaction between gold and iron oxide support delivered by the structure of Au–OH–Fe or Au–O–Fe [31]. It can also be seen from Figure 6b that the transformation of Fe_OH→Fe2O3 (Au–OH–Fe) was kept the same, while the conversion of Fe2O3→Fe3O4 (Au–O–Fe) was distinctly promoted with the increasing pH value in Fe_OH synthesis. This reveals a much stronger Au–O–Fe interaction in Au/Fe_OH_11.2 than in Au/Fe_OH_6.7, which could account for its better catalytic performance on the CO oxidation reaction.
Similarly, for the Au/Fe_O series, the reduction of Fe_O supports (Figure 6c) can be divided into two parts. The low-temperature reduction peaks between 200–300 °C and 350–400 °C can be attributed to the transformation of Fe_O (or Fe2O3)→Fe3O4 [30,32], while the onset of high-temperature reduction peak, assigned to the conversion of Fe3O4→FeO or Fe [32], was located at 350–400 °C. Again, by the gold doping, Figure 6d exhibits that the reduction of Fe3O4→FeO or Fe was kept the same, but the reduction of Fe2O3→Fe3O4 was obviously shifted to lower temperatures below 270 °C, possibly due to the presence of Au–O–Fe interaction [31]. This reduction temperature was increased with the calcination temperature of iron oxide support from 200 to 600 °C. The corresponding hydrogen consumption amount (Table 2) was raised from Au/Fe_200 to Au/Fe_400 and remained constant if the calcination temperature was further higher (400–600 °C). It hints that the strong interaction of Au–O–Fe reached a spike at Au/Fe_400. Besides, a minor peak below 170 °C can be identified for the transformation of Fe_OH→Fe2O3 for Au/Fe_200, Au/Fe_300 and Au/Fe_400, while it disappeared for Au/Fe_500 and Au/Fe_600 since the higher calcination temperature on Fe_O can effectively remove the surface hydroxyls.

2.3. Effect of Iron Oxide Support

Previously, we utilized in-situ XAFS and XRD techniques to investigate the gold-iron oxide catalysts obtained by deposition-precipitation, and reported that metal–support interaction (Au–O–Fe) is key factor to govern the CO oxidation reactivity of Au/FeOx [28]. In this work, we focused on the effect of iron oxide support and optimized the synthetic parameters for the Fe_OH and Fe_O preparation. To further study the reaction mechanism in Au-Fe-O system, we selected four typical samples to reveal the “structure–activity” relationship by different characterization methods. Two of them were gold on hydrated iron oxide (Au/Fe_OH) with higher (Au/Fe_OH_11.2) and lower reactivity (Au/Fe_OH_6.7); another two were gold on dehydrated iron oxide (Au/Fe_O) with higher (Au/Fe_O_300) and lower reactivity (Au/Fe_200).
In Section 2.1, using TEM/HRTEM, we found that ~2 nm Au particles formed during the CO oxidation reaction, whether on Fe_OH (see Figure 4a,b) or on Fe_O (see Figure 4c,d). Since no such gold structure has been detected for the corresponding fresh samples, the transformation of Au species under the reaction conditions is crucial to the explanation for the different reactivity of the Au/FeOx catalysts. In Section 2.2, using H2-TPR, the strong interaction between metal (Au) and support (Fe_OH or Fe_O) has been demonstrated for the structural evolution of Fe_OH→Fe3O4 and Fe2O3→Fe3O4, respectively. This could be the main reason for the origin of high activity for Au/Fe_OH_11.2 and Au/Fe_O_300. However, the information on gold chemistry, especially oxidation state and short-range local structure around Au, in the active Au/FeOx catalysts is still unknown.
XPS was conducted to determine the surface Au concentrations (Ausurf), and the related analysis results have been included in Table 1. Most of the Ausurf values in the gold-iron oxide catalysts are close to the corresponding Aubulk numbers, except for the used Au/Fe_OH_11.2 (1.20 at.%) and Au/Fe_O_300 (0.74 at. %) samples, in which their surfaces were obviously Au-richer compared with that in the corresponding fresh catalysts. Thus, the larger fraction of gold on the surface of iron oxide support during the catalytic tests can be attributed to the promotion in reactivity.
Furthermore, the XPS spectra of Fe 2p in Figure 7a,b clearly demonstrate that the oxidation state of iron was kept the same as Fe3+ [33,34] for all the measured samples before and after the CO oxidation reaction. This reveals that the oxidized iron species were very stable during the catalytic measurements, even with the introduction of reducing gas (CO). The XPS spectra of Au 4f in Figure 7c,d distinctly confirm that the oxidation state of gold was more ionic, exhibiting higher binding energies (also see Table 1), in all the fresh catalysts (Au/Fe_OH_11.2, Au/Fe_OH_6.7, Au/Fe_O_300, and Au/Fe_O_200) than after reaction. This indicates that CO reduced Au to form metallic species, which was in good agreement with the TEM/HRTEM results.
Therefore, XAFS technique was used to investigate the electronic structure in the gold-iron oxide catalysts before and after the CO oxidation reaction. The related white line in the XANES profiles distinctly changes with the structural evolution on Au (Au0 and Auδ+) [28]. Compared to XPS, XANES test can be conducted under milder ambient conditions and exclude the effect of ultra-high vacuum level. Thus, we selected the XANES approach to identify the oxidation states of gold in this work.
The Au L3-edge XANES spectrum of Au/FeOx catalysts is compared with that of Au foil in Figure 8. For the fresh samples (see Figure 8a), the Au L3 edges were obviously shifted to higher energies, if compared to that of Au° standard, confirming their Auδ+ nature. Meanwhile, strong white line was clearly observed, which verifies that the ionic gold species were dominant in the fresh catalysts [35,36]. Interestingly, according to the height of white line in Figure 8a, the oxidation state of Au in each gold-iron oxide sample follows this sequence: Au/Fe_OH_11.2 > Au/Fe_O_300 > Au/Fe_OH_6.7 > Au/Fe_O_200. This was well consistent with the catalytic reactivity order: Au/Fe_OH_11.2 > Au/Fe_OH_6.7 and Au/Fe_O_300 > Au/Fe_O_200.
However, after the reaction, gold in all the used Au/FeOx catalysts was reduced to almost pure Au° species based on the XANES profiles in Figure 8b. This was in good agreement with the TEM/HRTEM and XPS data. Therefore, the different Au oxidation states in the fresh samples were crucial for the significant differences in reactivity between gold supported on various Fe_OH and Fe_O matrices.

3. Experimental Section

3.1. Catalyst Preparation

3.1.1. Preparation of Fe_OH with Different pH Values [8]

Na2CO3·10H2O (99.9%) and Fe(NO3)3·6H2O (99%) were purchased from Tianjin Kermal Chemical Reagent Factory (Tianjin, China). Typically, 0.25 mol·L−1 Na2CO3 aqueous solution was added drop wisely to 200 mL of 0.1 mol·L−1 Fe(NO3)3 aqueous solution under stirring at 80 °C until specific pH value (6.7, 8.2, 9.7, and 11.2) was reached. The stock solution was aged under stirring at 80 °C for another 1 h, and then the as-formed precipitate was collected by filtration. The solid product was washed with deionized (DI) water at 80 °C several times until the final pH was neutral. This powder was dried at 120 °C in still air for 12 h to generate the Fe_OH supports, marked as Fe_OH_6.7, Fe_OH_8.2, Fe_OH_9.7 and Fe_OH_11.2.

3.1.2. Preparation of Fe_O with Different Calcination Temperatures

The Fe_OH_8.2 supports were ground into fine powders, and calcined at different temperatures (200, 300, 400, 500 and 600 °C) for 2 h (rate of 5 °C·min−1) to generate the Fe_O supports, marked as Fe_O_200, Fe_O_300, Fe_O_400, Fe_O_500, and Fe_O_600.

3.1.3. Deposition of Gold onto Fe_OH or Fe_O

For the sequential deposition-precipitation process, 0.5 g Fe_OH or Fe_O support powders were suspended in 23 mL Millipore water (18.25 MΩ) under stirring. Then, 2 mL of 0.0125 mol·L−1 HAuCl4 aqueous solution was added to the above solution at 60 °C. After 30 min, 25 mL of aqueous solution containing 0.5 g of urea was quickly added into the stock solution. Thereafter, the stock solution was heated up to 80 °C under vigorously stirring and the temperature was kept for 3 h. The pH value of this solution was raised from 4.0 to 8.6, resulting in the full decomposition of urea. The stock solution was further aged at room temperature for another 20 h. The as-prepared product was collected by filtration, and washed with Millipore water at 60 °C several times until the final pH value was neutral. After being dried at 60 °C overnight in still air, the fresh Au/Fe_OH and Au/Fe_O catalysts were obtained. The designed gold concentration in each sample was fixed at 1 wt. %, calculated as Au/Fe(OH)3, or 0.54 at. %, calculated as Au/(Au + Fe). HAuCl4·4H2O (99.9%) were purchased from National Chemicals (Shanghai, China).

3.2. Characterization

The actual gold loadings of catalysts were determined by inductively coupled plasma atomic emission spectroscopy (ICP-AES) on an IRIS Intrepid II XSP instrument (Thermo Electron Corporation, Waitham, MA, USA).
The nitrogen adsorption-desorption measurements were performed on a NOVA 4200e instrument (Quantachrome Corporation, Boynton Beach, FL, USA) at 77 K. The samples were outgassed at 120 °C for 12 h under vacuum prior to measurements. The BET specific surface areas (SBET) were calculated from the adsorption data in the relative pressure range between 0.05 and 0.30.
X-ray photoelectron spectroscopy (XPS) analysis was performed on an Axis Ultra XPS spectrometer (Kratos, UK) with 225 W of Al Kα radiation. The C 1s line at 284.8 eV was used to calibrate the binding energies. The surface gold concentrations (Ausurf in at. %) were determined by integrating the areas of Au 4f and Fe 2p peaks.
X-ray Diffraction (XRD) was operated on a Bruker D8 Advance diffractometer (Bruker-AXS; Karlsruhe, Germany, 40 kV, 40 mA), using Cu Kα radiation (λ = 0.15406 nm). The powder catalyst after grinding was placed inside a quartz-glass sample holder before test.
X-ray absorption near edge structure (XANES) spectra at Au K-edge (E0 = 11,919 eV) were performed at BL14W1 beam line of Shanghai Synchrotron Radiation Facility (SSRF) operated at 3.5 GeV under “top-up” mode with a constant current of 240 mA. The XAFS data were recorded under fluorescence mode with 32-element Ge solid-state detector. The energy was calibrated accordingly to the absorption edge of pure Au foil. Athena codes were used to extract the data. The experimental absorption coefficients as function of energies μ(E) were processed by background subtraction and normalization procedures, and reported as “normalized absorption”. Based on the normalized XANES profiles, the oxidation state of Au in each catalyst can be determined.
Transmission electron microscopy (TEM) was conducted on a field emission TEM (JEOL 2100F, Tokyo, Japan) machine equipped with a 2k × 2k CCD camera at 200 kV. High-resolution TEM (HRTEM) and the related energy dispersive X-ray analysis (EDAX) was carried out on a Philips Tecnai G2 F20 instrument (FEI Company, Hillsboro, TX, USA) at 200 kV. All the tested sample powders were suspended in ethanol before deposition on an ultra-thin carbon film-coated copper grid.
Temperature-programmed reduction by hydrogen (H2-TPR) was carried out in a Builder PCSA-1000 instrument (Beijing, China) equipped with a thermal conductivity detector (TCD) to detect H2 consumption. The sieved catalysts (20–40 mesh, 30 mg) were heated (5 °C·min−1) from room temperature to 400 °C in a 20% H2/Ar (30 mL·min−1) gas mixture. Before the measurements were taken, the fresh samples were pretreated in pure O2 at 300 °C for 30 min.

3.3. Catalytic Test

CO oxidation activities of Au/FeOx catalysts were evaluated in a plug flow reactor using 50 mg of sieved (20–40 mesh) catalyst in a gas mixture of 1 vol. % CO, 20 vol. % O2, and 79 vol. % N2 (99.997% purity from Deyang Gas Company, Jinan, China), at a flow rate of 67 mL·min−1, corresponding to a space velocity of 80,000 mL·h−1·gcat−1. Prior to the test, the catalysts were pretreated in air at 300 °C for 30 min for activation. After the catalysts cooled down to room temperature under a flow of pure N2 gas, reactant gases were passed through the reactor. The catalytic tests in “transient” mode were carried out in the reactant atmosphere by ramping the catalyst temperature (5 °C·min−1) from room temperature to 300 °C. The outlet gas compositions of CO and CO2 were monitored online by a non-dispersive IR spectroscopy (Gasboard-3500, Wuhan Sifang Company, Wuhan, China). A typical “steady-state” experiment (30 °C) was conducted in the same gas-mixture at 30 °C for more than 10 h.

4. Conclusions

In summary, we have prepared two series of gold-iron oxide catalysts, Au/Fe_OH and Au/Fe_O, by depositing Au onto hydrated and dehydrated supports, and further investigated their catalytic performance for the low-temperature CO oxidation reaction. Based on the related activity test results, we have demonstrated that the precipitating pH value and the calcination temperature for the iron oxide support are two key factors governing the gold catalysis. By multiple characterization techniques, including XRD, N2 adsorption, TEM/HRTEM, XPS, XAFS and H2-TPR, we have found that the metallic Au strongly interacting with the oxide support is the active site for CO oxidation.

Acknowledgments

Financial support from the National Science Foundation of China (NSFC) (grant Nos. 21373259 and 21301107), the Hundred Talents project of the Chinese Academy of Sciences, the Strategic Priority Research Program of the Chinese Academy of Sciences (grant No. XDA09030102), fundamental research funding of Shandong University (grant No. 2014JC005), the Taishan Scholar project of Shandong Province (China), and open funding from Beijing National Laboratory for Molecular Science and Key Laboratory of Interfacial Physics and Technology, Chinese Academy of Sciences are greatly appreciated.

Author Contributions

C.-J.J. and R.S. conceived and designed the project. H.-Z.C. and Y.G. performed the catalyst preparation, characterization and catalytic tests. X.W. conducted the XAFS and HRTEM measurements. R.S., C.-J.J. and H.-Z.C. wrote the manuscript.

Conflicts of Interest

The authors declare no conflict of interest.

References

  1. Haruta, M.; Tsubota, S.; Kobayashi, T.; Kageyama, H.; Genet, M.J.; Delmon, B. Low-temperature oxidation of CO over gold supported on TiO2, α-Fe2O3, and Co3O4. J. Catal. 1993, 144, 175–192. [Google Scholar] [CrossRef]
  2. Haruta, M.; Kobayashi, T.; Sano, H.; Yamada, N. Novel gold catalysts for the oxidation of carbon monoxide at a temperature far below 0 °C. Chem. Lett. 1987, 16, 405–408. [Google Scholar] [CrossRef]
  3. Hashmi, A.S.K.; Hutchings, G.J. Gold catalysis. Angew. Chem. Int. Ed. 2006, 45, 7896–7936. [Google Scholar] [CrossRef] [PubMed]
  4. Valden, M.; Lai, X.; Goodman, D.W. Onset of catalytic activity of gold clusters on titania with the appearance of nonmetallic properties. Science 1998, 281, 1647–1650. [Google Scholar] [CrossRef] [PubMed]
  5. Widmann, D.; Leppelt, R.; Behm, R.J. Activation of an Au/CeO2 catalyst for the CO oxidation reaction by surface oxygen removal/oxygen vacancy formation. J. Catal. 2007, 251, 437–442. [Google Scholar] [CrossRef]
  6. Camellone, M.F.; Fabris, S. Reaction mechanisms for the CO oxidation on Au/CeO2 catalysts: Activity of substitutional Au3+/Au+ cations and deactivation of supported Au+ Adatoms. J. Am. Chem. Soc. 2009, 131, 10473–10483. [Google Scholar] [CrossRef] [PubMed]
  7. Haruta, M.; Yamada, N.; Kobayashi, T.; Iijima, S. Gold catalysts prepared by coprecipitation for low-temperature oxidation of hydrogen and of carbon monoxide. J. Catal. 1989, 115, 301–309. [Google Scholar] [CrossRef]
  8. Herzing, A.A.; Kiely, C.J.; Carley, A.F.; Landon, P.; Hutchings, G.J. Identification of active gold nanoclusters on iron oxide supports for CO oxidation. Science 2008, 321, 1331–1335. [Google Scholar] [CrossRef] [PubMed]
  9. Daniells, S.T.; Overweg, A.R.; Makkee, M.; Moulijn, J.A. The mechanism of low-temperature CO oxidation with Au/Fe2O3 catalysts: A combined Mössbauer, FT-IR, and TAP reactor study. J. Catal. 2005, 230, 52–65. [Google Scholar] [CrossRef]
  10. Hutchings, G.J.; Hall, M.S.; Carley, A.F.; Landon, P.; Solsona, B.E.; Kiely, C.J.; Herzing, A.; Makkee, M.; Moulijn, J.A.; Overweg, A.; et al. Role of gold cations in the oxidation of carbon monoxide catalyzed by iron oxide-supported gold. J. Catal. 2006, 242, 71–81. [Google Scholar] [CrossRef]
  11. Li, L.; Wang, A.-Q.; Qiao, B.-T.; Lin, J.; Huang, Y.-Q.; Wang, X.-D.; Zhang, T. Origin of the high activity of Au/FeOx for low-temperature CO oxidation: Direct evidence for a redox mechanism. J. Catal. 2013, 299, 90–100. [Google Scholar] [CrossRef]
  12. Liu, Y.; Jia, C.-J.; Yamasaki, J.; Terasaki, O.; Schuth, F. Highly active iron oxide supported gold catalysts for CO oxidation: How small must the gold nanoparticles be? Angew. Chem. Int. Ed. 2010, 49, 5771–5775. [Google Scholar] [CrossRef] [PubMed]
  13. Zhong, Z.-Y.; Ho, J.; Teo, J.; Shen, S.-C.; Gedanken, A. Synthesis of porous α-Fe2O3 nanorods and deposition of very small gold particles in the pores for catalytic oxidation of CO. Chem. Mater. 2007, 19, 4776–4782. [Google Scholar] [CrossRef]
  14. Andreeva, D. Low temperature water gas shift over gold catalysts. Good Bull. 2002, 35, 82–88. [Google Scholar] [CrossRef]
  15. Boccuzzi, F.; Chiorino, A.; Manzoli, M.; Andreeva, D.; Tabakova, T. FTIR study of the low-temperature water-gas shift reaction on Au/Fe2O3 and Au/TiO2 catalysts. J. Catal. 1999, 188, 176–185. [Google Scholar] [CrossRef]
  16. Silberova, B.A.A.; Mul, G.; Makkee, M.; Moulijn, J.A. DRIFTS study of the water-gas shift reaction over Au/Fe2O3. J. Catal. 2006, 243, 171–182. [Google Scholar]
  17. Andreevaa, D.; Tabakovaa, T.; Idakieva, V.; Christova, P.; Giovanolib, R. Au/α-Fe2O3 catalyst for water-gas shift reaction prepared by deposition-precipitation. Appl. Catal. A 1998, 169, 9–14. [Google Scholar] [CrossRef]
  18. Schubert, M.M.; Venugopal, A.; Kahlich, M.J.; Plzak, V.; Behm, R.J. Influence of H2O and CO2 on the selective CO oxidation in H2-rich gases over Au/α-Fe2O3. J. Catal. 2004, 222, 32–40. [Google Scholar] [CrossRef]
  19. Shodiya, T.; Schmidt, O.; Peng, W.; Hotz, N. Novel nano-scale Au/α-Fe2O3 catalyst for the preferential oxidation of CO in biofuel reformate gas. J. Catal. 2013, 300, 63–69. [Google Scholar] [CrossRef]
  20. Landon, P.; Ferguson, J.; Solsona, B.E.; Garcia, T.; Sayari, S.A.; Carley, A.F.; Herzing, A.A.; Kiely, C.J.; Makkee, M.; Moulijn, J.A.; et al. Selective oxidation of CO in the presence of H2, H2O and CO2 utilizing Au/α-Fe2O3 catalysts for use in fuel cells. J. Mater. Chem. 2006, 16, 199–208. [Google Scholar] [CrossRef]
  21. Ozaki, M.; Kratohvil, S.; Matijević, E. Formation of monodispersed spindle-type hematite particles. J. Colloid Interface Sci. 1984, 102, 146–151. [Google Scholar] [CrossRef]
  22. Sugimoto, T.; Sakata, K. Preparation of monodisperse pseudocubic α-Fe2O3 particles from condensed ferric hydroxide gel. J. Colloid Interface Sci. 1992, 152, 587–590. [Google Scholar] [CrossRef]
  23. Jia, C.-J.; Sun, L.-D.; Yan, Z.-G.; You, L.-P.; Luo, F.; Han, X.-D.; Pang, Y.-C.; Zhang, Z.; Yan, C.-H. Single-crystalline iron oxide nanotubes. Angew. Chem. Int. Ed. 2005, 117, 4402–4407. [Google Scholar] [CrossRef]
  24. Jia, C.-J.; Sun, L.-D.; Luo, F.; Han, X.-D.; Heyderman, L.J.; Yan, Z.-G.; Yan, C.-H.; Zheng, K.; Zhang, Z.; Takano, M.; et al. Large-scale synthesis of single-crystalline iron oxide magnetic nanorings. J. Am. Chem. Soc. 2008, 130, 16968–16977. [Google Scholar] [CrossRef] [PubMed]
  25. Finch, R.M.; Hodge, N.A.; Hutchings, G.J.; Meagher, A.; Pankhurst, Q.A.; Siddiqui, M.R.H.; Wagnerc, F.E.; Whyman, R. Identification of active phases in Au-Fe catalysts for low-temperature CO oxidation. Phys. Chem. Chem. Phys. 1999, 1, 485–489. [Google Scholar] [CrossRef]
  26. Qian, K.; Zhang, W.-H.; Sun, H.-X.; Fang, J.; He, B.; Ma, Y.-S.; Jiang, Z.-Q.; Wei, S.-Q.; Yang, J.-L.; Huang, W.-X. Hydroxyls-induced oxygen activation on “inert” Au nanoparticles for low-temperature CO oxidation. J. Catal. 2011, 277, 95–103. [Google Scholar] [CrossRef]
  27. Hodge, N.A.; Kiely, C.J.; Whyman, R.; Siddiqui, M.R.H.; Hutchings, G.J.; Pankhurst, Q.A.; Wagner, F.E.; Rajaram, R.R.; Golunski, S.E. Microstructural comparison of calcined and uncalcined gold/iron-oxide catalysts for low-temperature CO oxidation. Catal. Today 2002, 72, 133–144. [Google Scholar] [CrossRef]
  28. Guo, Y.; Gu, D.; Jin, Z.; Du, P.-P.; Si, R.; Tao, J.; Xu, W.-Q.; Huang, Y.-Y.; Senanayake, S.; Song, Q.-S.; et al. Uniform 2 nm gold nanoparticles supported on iron oxides as active catalysts for CO oxidation reaction: Structure-activity relationship. Nanoscale 2015, 7, 4920–4928. [Google Scholar] [CrossRef] [PubMed]
  29. Venugopal1, A.; Scurrell, M.S. Low temperature reductive pretreatment of Au/Fe2O3 catalysts, TPR/TPO studies and behaviour in the water-gas shift reaction. Appl. Catal. A 2004, 258, 241–249. [Google Scholar] [CrossRef]
  30. Wang, D.-H.; Hao, Z.-P.; Cheng, D.-Y.; Shi, X.-C. Influence of the calcination temperature on the Au/FeOx/Al2O3 catalyst. J. Chem. Technol. Biotechnol. 2006, 81, 1246–1251. [Google Scholar] [CrossRef]
  31. Deng, W.-L.; Carpenter, C.; Yia, N.; Stephanopoulos, M.F. Comparison of the activity of Au/CeO2 and Au/Fe2O3 catalysts for the CO oxidation and the water-gas shift reactions. Top. Catal. 2007, 44, 199–208. [Google Scholar] [CrossRef]
  32. Kadkhodayan, A.; Brenner, A. Temperature-programmed reduction and oxidation of metals supported on γ-alumina. J. Catal. 1989, 117, 311–321. [Google Scholar] [CrossRef]
  33. Huang, J.; Dai, W.-L.; Fan, K.-N. Remarkable support crystal phase effect in Au/FeOx catalyzed oxidation of 1,4-butanediol to c-butyrolactone. J. Catal. 2009, 266, 228–235. [Google Scholar] [CrossRef]
  34. Yamashita, T.; Hayes, P. Analysis of XPS spectra of Fe2+ and Fe3+ ions in oxide materials. Appl. Surf. Sci. 2008, 254, 2441–2449. [Google Scholar] [CrossRef]
  35. Deng, W.-L.; Frenkel, A.I.; Si, R.; Flytzani-Stephanopoulos, M. Reaction-Relevant Gold Structures in the Low Temperature Water-Gas Shift Reaction on Au-CeO2. J. Phys. Chem. C 2008, 112, 12834–12840. [Google Scholar] [CrossRef]
  36. Zanella, R.; Giorgio, S.; Shin, C.H.; Henry, C.R.; Louis, C. Characterization and reactivity in CO oxidation of gold nanoparticles supported on TiO2 prepared by deposition-precipitation with NaOH and urea. J. Catal. 2004, 222, 357–367. [Google Scholar] [CrossRef]
Figure 1. XRD patterns of fresh Au/FeOx catalysts: (a) Au/Fe_OH and (b) Au/Fe_O.
Catalysts 06 00037 g001
Figure 2. TEM images of fresh Au/FeOx catalysts: (a) Au/Fe_OH_11.2; (b) Au/Fe_OH_9.7; (c) Au/Fe_OH_8.2; (d) Au/Fe_OH_6.7; (e) Au/Fe_O_600; (f) Au/Fe_O_500; (g) Au/Fe_O_400; (h) Au/Fe_O_300; and (i) Au/Fe_OH_200.
Catalysts 06 00037 g002
Figure 3. TEM images of used Au/FeOx catalysts: (a) Au/Fe_OH_11.2; (b) Au/Fe_OH_9.7; (c) Au/Fe_OH_8.2; (d) Au/Fe_OH_6.7; (e) Au/Fe_O_600; (f) Au/Fe_O_500; (g) Au/Fe_O_400; (h) Au/Fe_O_300; and (i) Au/Fe_O_200.
Catalysts 06 00037 g003aCatalysts 06 00037 g003b
Figure 4. HRTEM images (ad) of Au/FeOx catalysts: (a) Au/Fe_O_300, fresh; (b) Au/Fe_O_200, fresh; (c) Au/Fe_O_300, used; and (d) Au/Fe_O_200 used.
Catalysts 06 00037 g004
Figure 5. CO conversions of fresh Au/FeOx catalysts for the low-temperature CO oxidation reaction: (a) Au/Fe_OH, transient; (b) Au/Fe_O, transient; (c) Au/Fe_OH, stability at 30 °C; and (d) Au/Fe_O, stability at 30 °C. Reaction conditions: 1% CO/20% O2/79% N2, 80,000 mL·h−1·gcat−1.
Catalysts 06 00037 g005
Figure 6. H2-TPR profiles of fresh Au/FeOx catalysts: (a) Fe_OH; (b) Au/Fe_OH; (c) Fe_O; and (d) Au/Fe_O.
Catalysts 06 00037 g006
Figure 7. XPS spectra of Au/FeOx catalysts: (a) Fe 2p, fresh; (b) Fe 2p, used; (c) Au 4f, fresh; and (d) Au 4f, used.
Catalysts 06 00037 g007
Figure 8. XANES profiles of Au L3 edge for Au/FeOx catalysts: (a) fresh and (b) used.
Catalysts 06 00037 g008
Table 1. Bulk Au concentrations (Aubulk), surface Au concentrations (Ausurf), BET (Brunner-Emmet-Teller) specific surface areas (SBET) and Au 4f XPS peak positions of gold-iron oxide catalysts.
SampleAubulk (at. %) aAusurf (at. %) bSBET (m2·g−1) cAu 4f (eV)
Au/Fe_OH_11.20.530.67 (1.20)15184.55 (84.2), 88.15 (87.9)
Au/Fe_OH_9.70.54-198-
Au/Fe_OH_8.20.52-203-
Au/Fe_OH_6.70.530.55 (0.42)21284.6 (84.0), 88.15 (87.7)
Au/Fe_O_6000.53-27-
Au/Fe_O_5000.52-42-
Au/Fe_O_4000.53-58-
Au/Fe_O_3000.520.68 (0.74)9784.7 (84.15), 88.4 (87.85)
Au/Fe_O_2000.530.63 (0.54)13684.35 (84.2), 88.05 (87.85)
a Determined by ICP-AES; b Determined by XPS. The numbers in brackets are for the used catalysts; c Calculated from the adsorption branch.
Table 2. Hydrogen consumption (H2-consump.) of gold catalysts.
SampleReduction Peak (°C)Experimental H2-consump. (μmol·g−1)Theoretical H2-consump. a (μmol·g−1)
DP_Au/Fe_OH_11.2102 °C, 214 °C6271300
DP_Au/Fe_OH_9.7107 °C, 204 °C5491300
DP_Au/Fe_OH_8.2108 °C, 200 °C4861300
DP_Au/Fe_OH_6.7116 °C, 195 °C4521300
DP_Au/Fe_O_200105 °C7231510
DP_Au/Fe_O_30096 °C, 198 °C7781510
DP_Au/Fe_O_40090 °C, 231 °C14381510
DP_Au/Fe_ O_500230 °C8611510
DP_Au/Fe_ O_600248 °C8941510
a Calculated according to Fe_OH→Fe3O4 or Fe2O3→Fe3O4.

