1. Introduction
The removal of NO
x under lean conditions according to the NO
x Storage-Reduction (NSR) technique is a viable approach for both diesel and lean gasoline fueled engines [
1]. In this process NO
x conversion is based on a cyclic engine operation alternating between fuel lean and rich conditions: NO
x (NO+NO
2) are adsorbed on the catalyst surface during lean operations, while the surface of the trap is regenerated under the fuel rich environment. The NO
x adsorption step involves oxidation sites (generally provided by noble metals like Pt, Pd or Rh) and alkali or alkaline-earth oxides storage sites (Ba, K, Sr), whereas the reduction stage involves reduction sites provided by the noble metals. All these components are deposited over a high surface area support like γ-Al
2O
3.
The operation of NSR catalysts (also known as Lean NO
x Traps, LNTs) reduces NO
x mainly to N
2 although undesired by-products like NH
3 or N
2O may also be generated. NH
3 is not generally a concern since an ammonia Selective Catalytic Reaction (SCR) catalyst can be placed downstream of the NSR system, such as in the case of combined NO
x storage and NH
3-SCR catalytic systems [
2]. At variance, N
2O is a highly undesired by-product in view of its very high global warming potential (nearly 300 times that of CO
2). Over fully formulated catalysts, it has been shown that N
2O formation is apparent both upon switch from lean to rich mode but also during the alternation from rich to lean regime [
3,
4,
5,
6,
7,
8]. It has been suggested that N
2O formation at the lean to rich transition occurs at the regeneration front, upon reduction of the stored NO
x over not fully reduced Platinum-Group-Metal (PGM) sites. On the other hand, N
2O formation upon the rich to lean transition originates from reaction between residual surface NO
x with reductive species (like NCO, CO or NH
3) in an adsorbed state [
3,
4,
7]. This N
2O peak can be reduced if a neutral or slightly lean phase is inserted between the rich and the lean phase, since a more complete regeneration of the catalyst can be attained [
9].
In order to provide further insights on the pathway involved in N
2O formation, a fundamental study was carried out on a model Pt-BaO/Al
2O
3 catalyst under simplified and controlled reaction conditions [
10]. Accordingly the reactivity of gaseous NO alone and in the presence of various reducing agents like H
2, NH
3, and CO was analyzed by micro-reactor transient reactivity experiments and
operando Fourier transform infrared (FT-IR) spectroscopy, to provide a complementary overview on the pathway of N
2O evolution. It has been shown that N
2O is formed from gaseous NO provided that a proper oxidation degree of the Pt sites is attained [
10]. Accordingly the N
2O evolution was observed only in a narrow temperature range corresponding to the PtO to Pt transformation, determined by the reactivity of the reducing agents (H
2 > NH
3 > CO).
In this study the investigation previously carried out over the model Pt-BaO/Al
2O
3 sample has been extended to a Rh-containing sample. Since Rh is generally considered to play an important role in the reduction of NO
x [
11], it is of interest to analyze the role of this component in the pathways involved in N
2O formation. For this purpose the reduction of gaseous NO in the presence of various reductants (H
2, NH
3) was investigated by transient microreactor experiments and
operando FT-IR spectroscopy to combine gas-phase data with surface species analysis. To point out the role of NO
x surface species (nitrates) in the formation of N
2O, experiments were also performed with the same reductants after adsorption of NO
x on the catalyst surface.
2. Results and Discussion
2.1. NO-Temperature Programmed Reaction (NO-TPR)
The reactivity of NO over the reduced Pt-BaO/Al
2O
3 and Rh-BaO/Al
2O
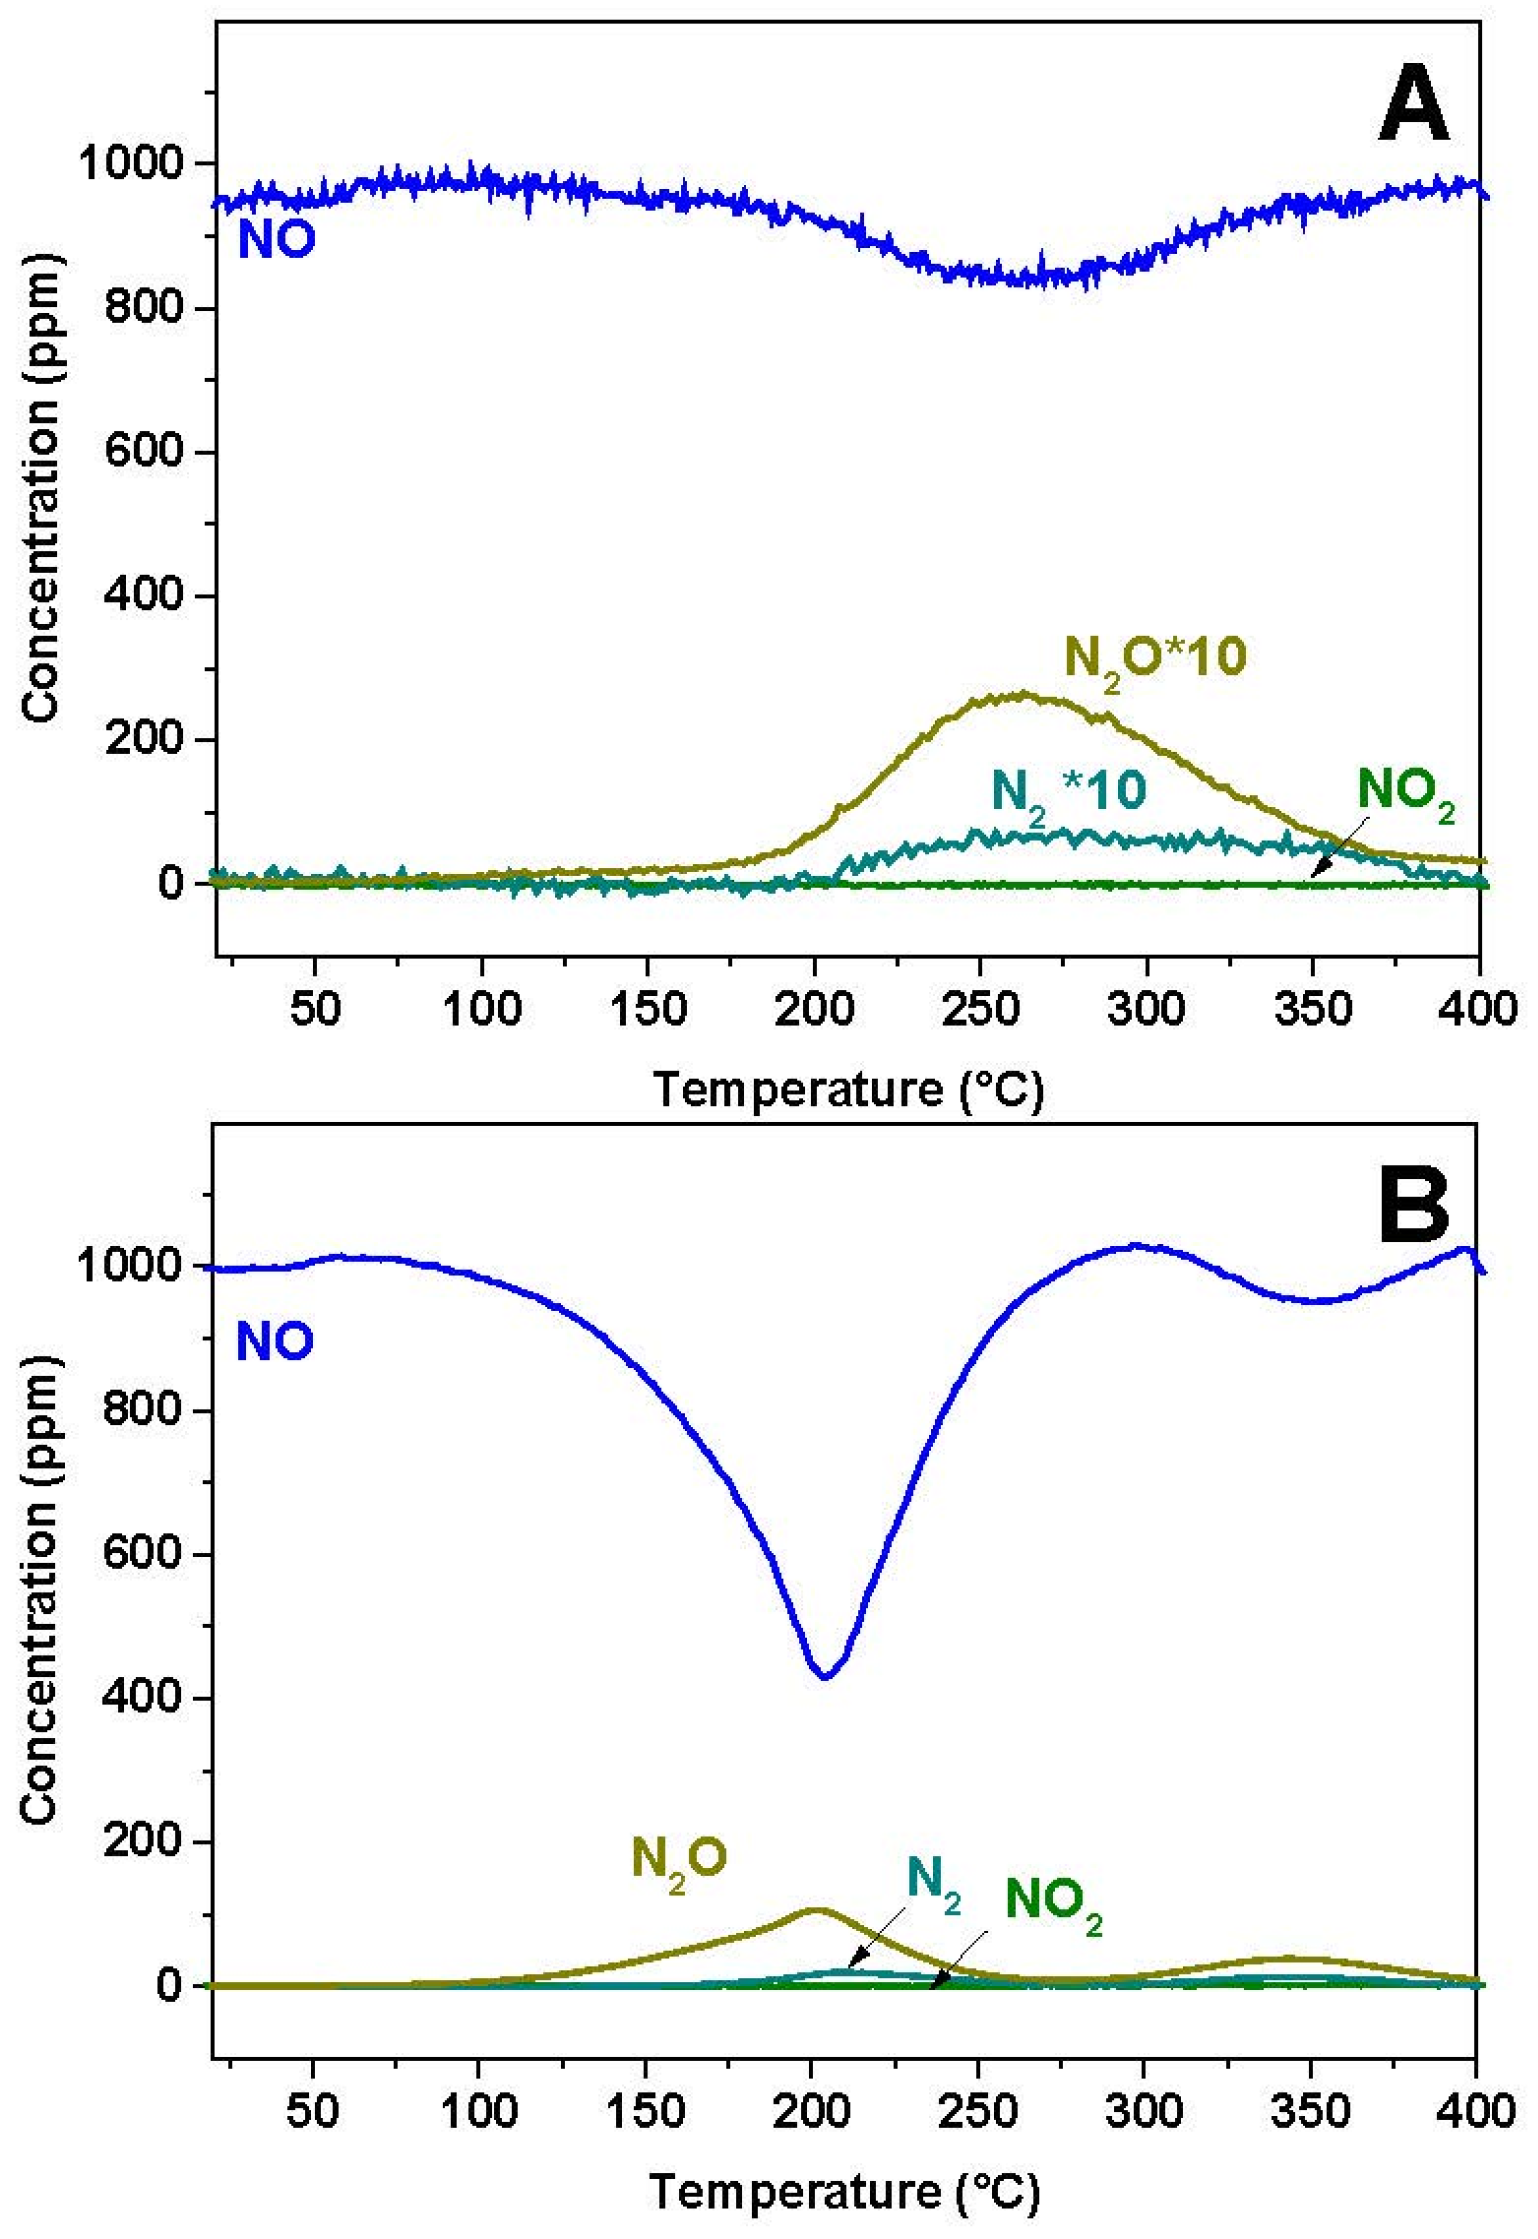
3 was investigated at first. The results of the gas phase analysis are shown in
Figure 1A,B for the Rh-BaO/Al
2O
3 and Pt-BaO/Al
2O
3 catalyst, respectively. In both cases a NO consumption peak is observed, with a minimum in NO concentration centered near 250 and 200 °C for Rh-BaO/Al
2O
3 and Pt-BaO/Al
2O
3, respectively. The NO consumption is more evident in the case of the Pt-BaO/Al
2O
3 catalyst sample; in both cases it is accompanied by evolution of N
2O and of minor amounts of N
2. Notably, the NO consumption is not balanced by the evolution of N
2O (and of N
2), indicating the build up of N-containing species on the catalyst surface.
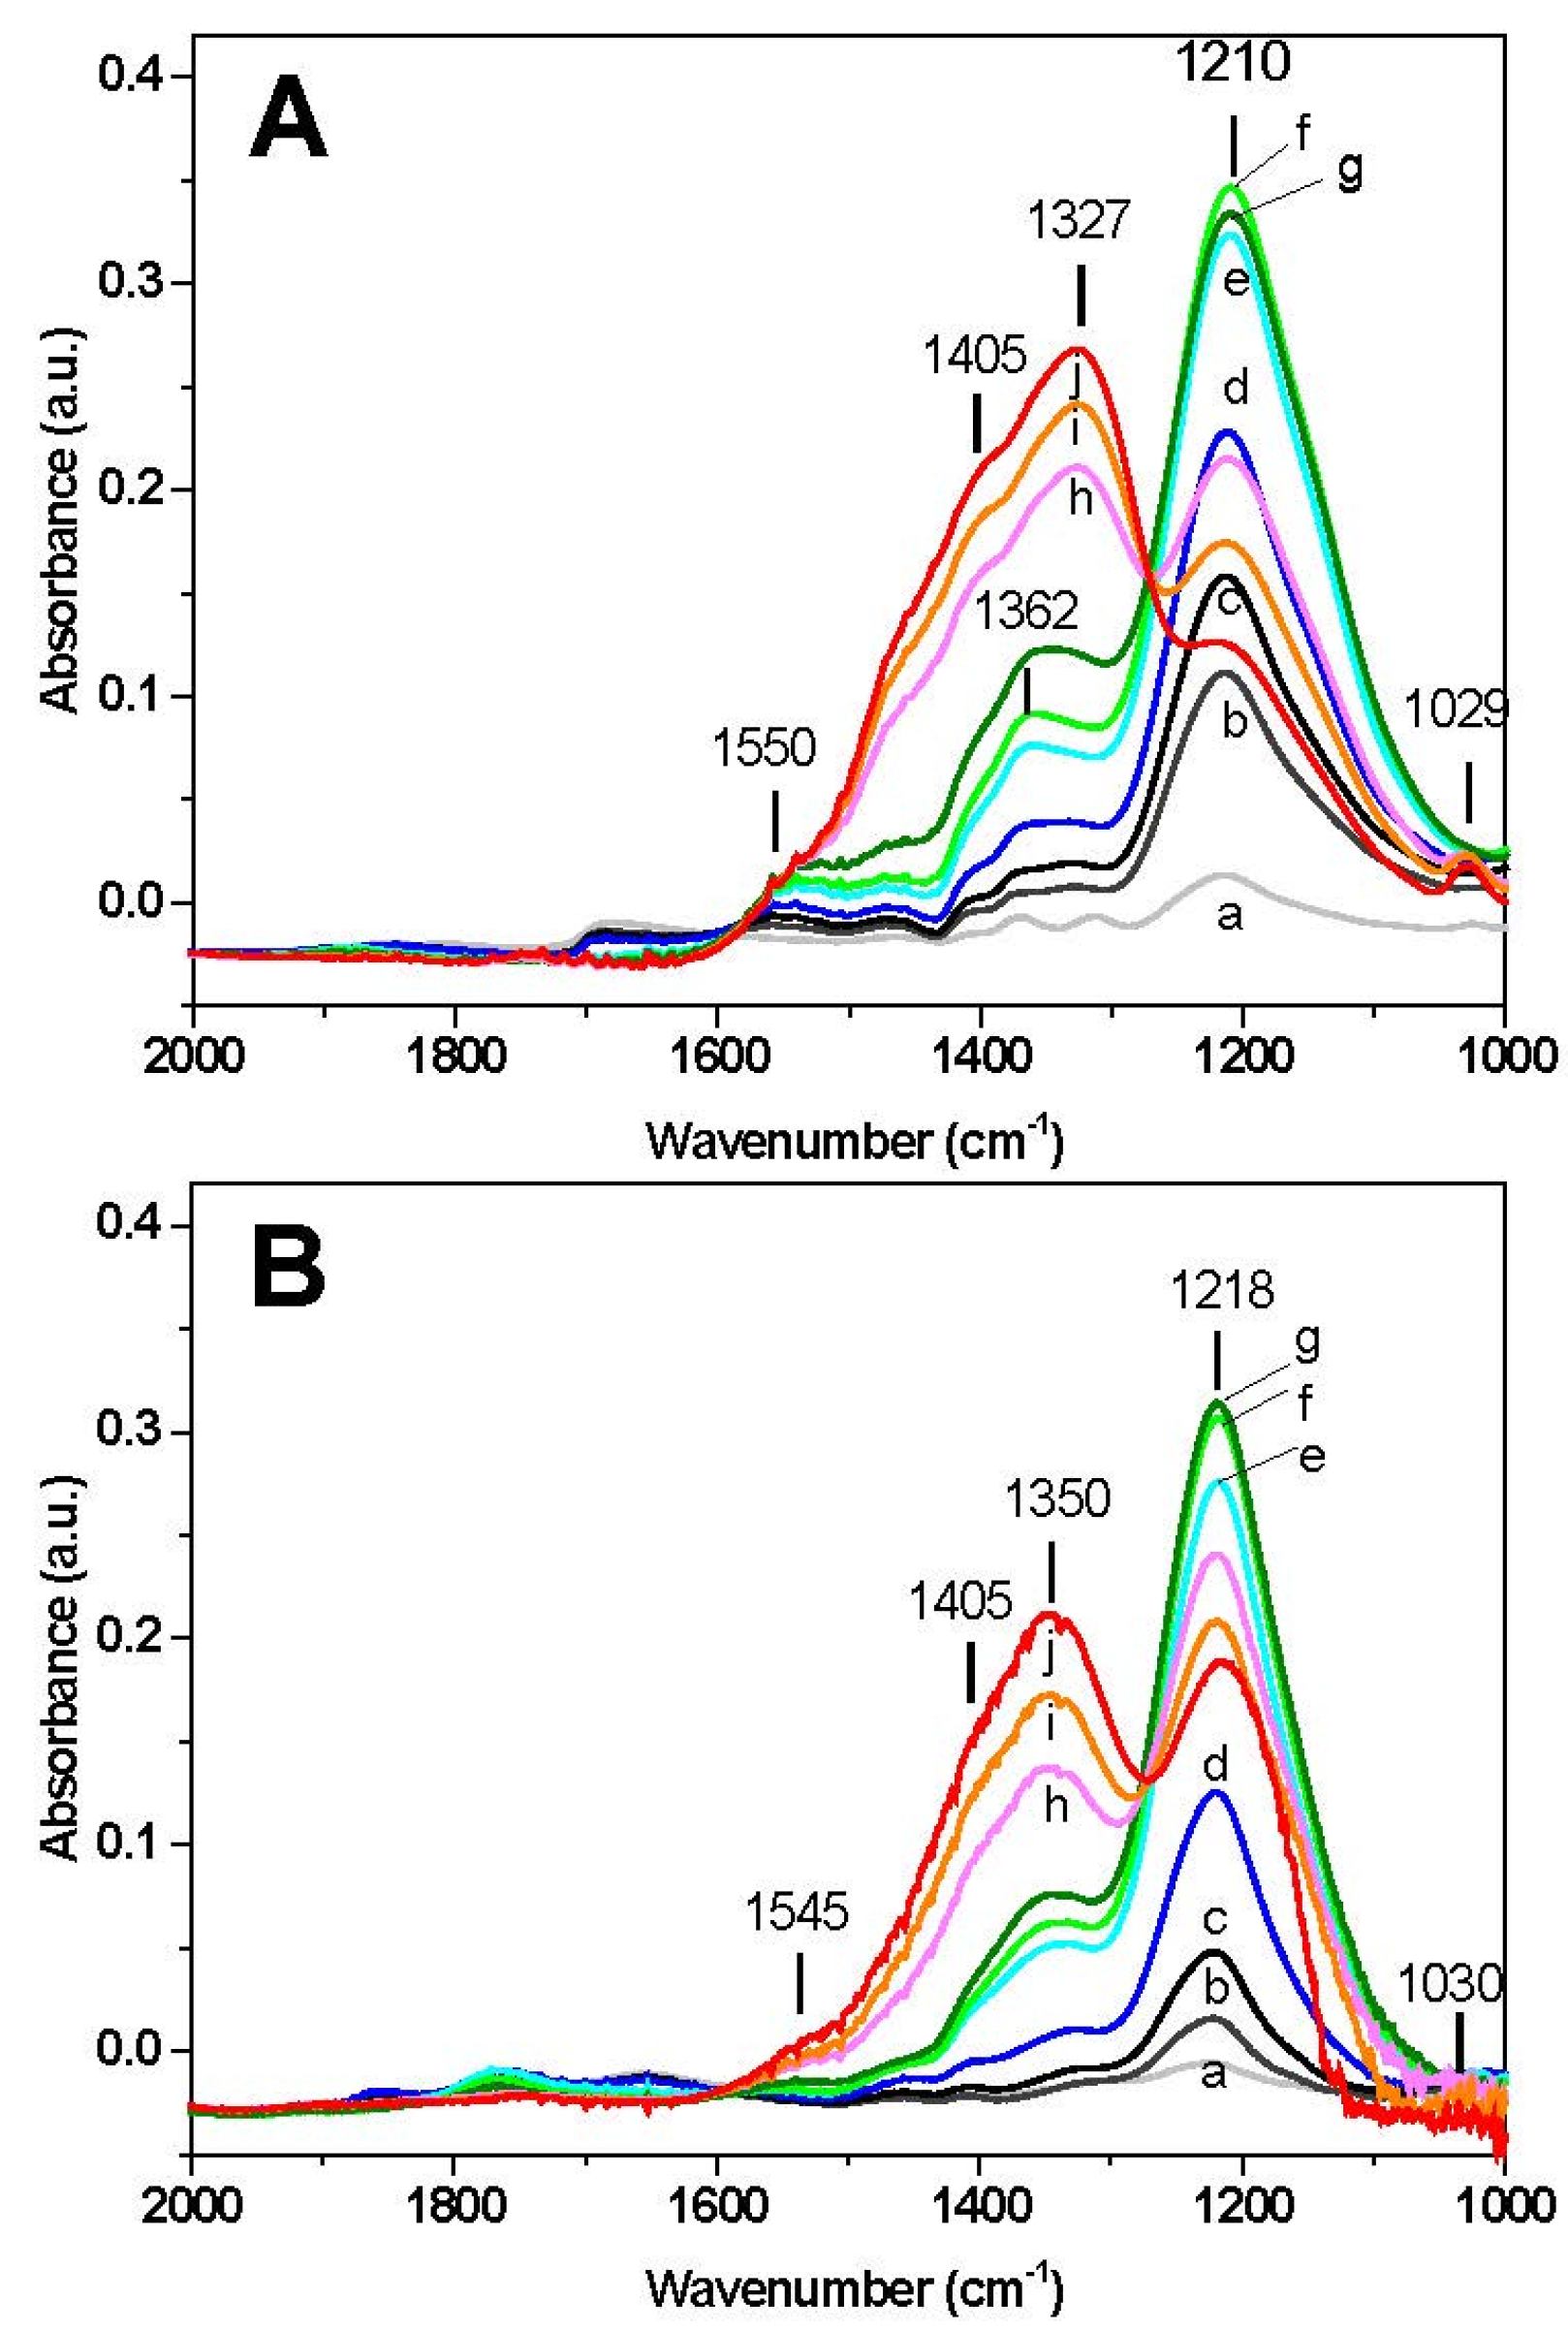
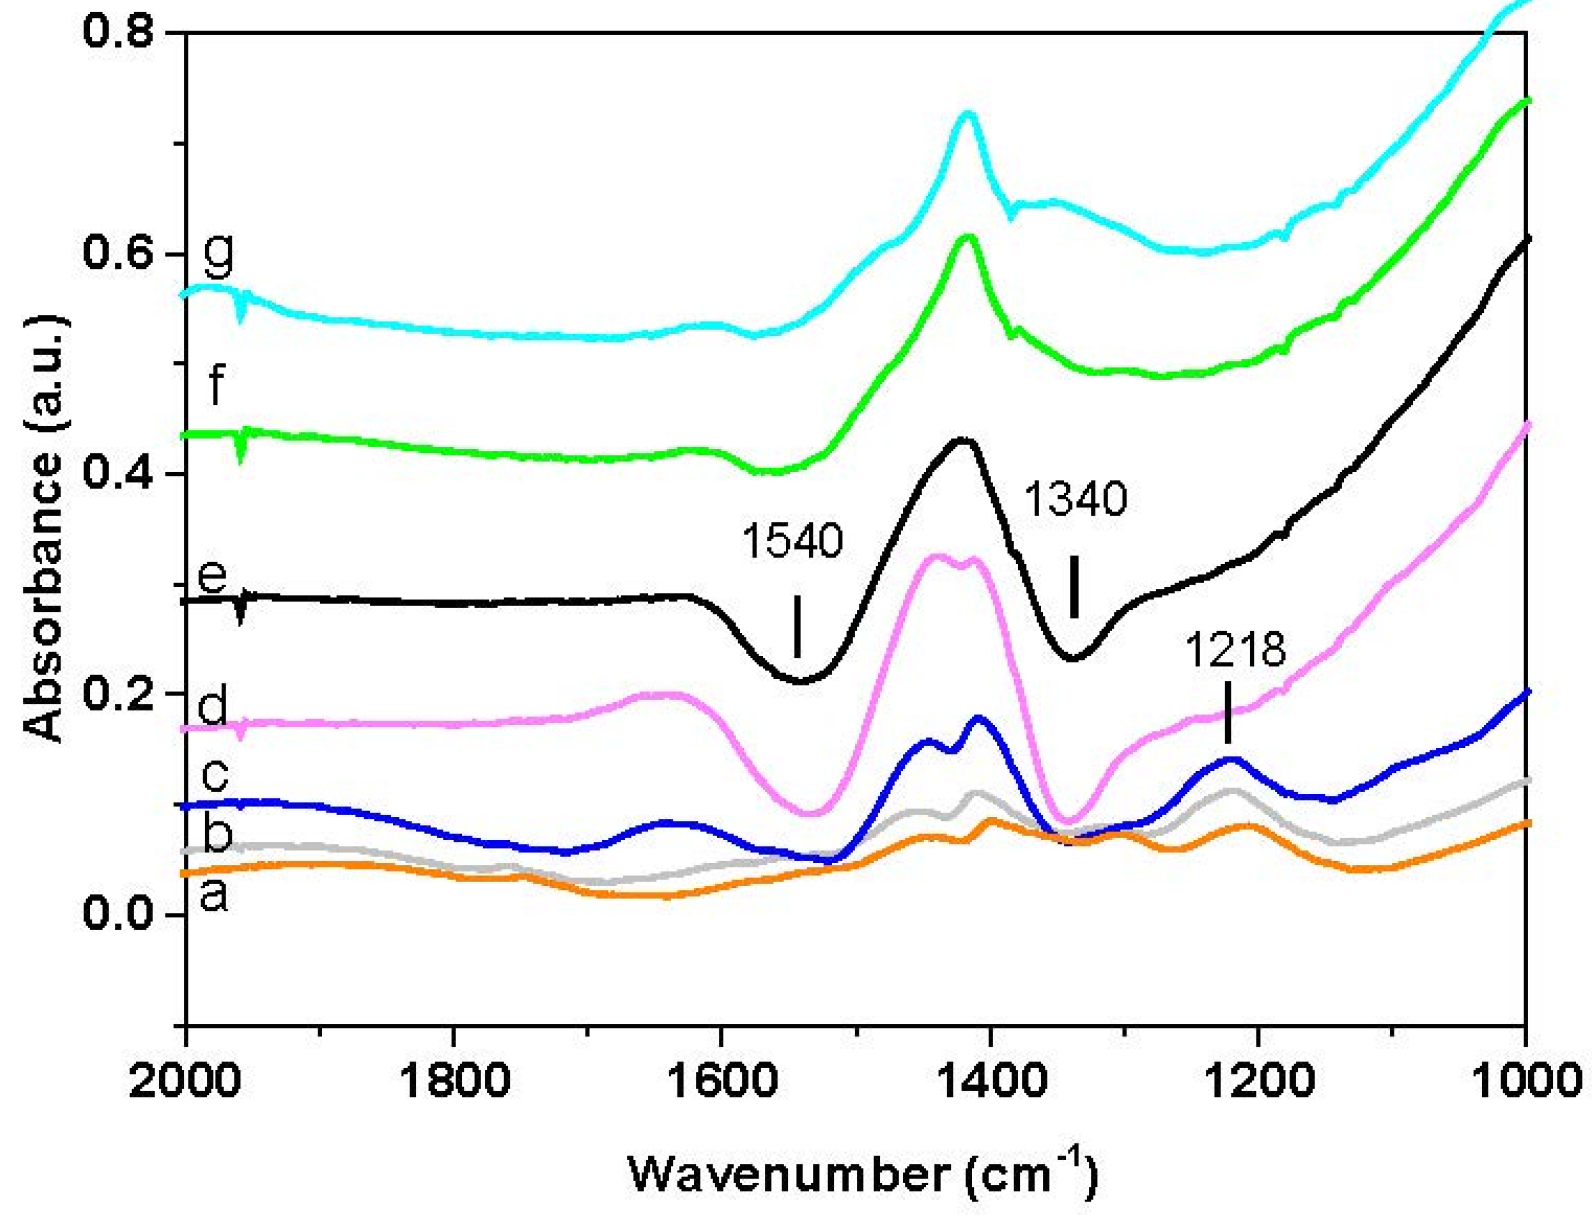
The results of surface analysis are shown in
Figure 2. In the case of Rh-BaO/Al
2O
3 catalyst (
Figure 2A) upon exposure of NO at 50 °C (spectrum a) a band appears at 1210 cm
−1 corresponding to ν
asym(NO
2) vibration of chelating nitrites on the barium phase. The presence of the ν
sym(NO
2) mode of nitrites may also be observed near 1365 cm
−1. Upon heating, the band located at 1210 cm
−1 increases, reaches a maximum intensity around 200–250 °C (spectra e–g) and then decreases with temperature. The decrease of the bands of nitrites is accompanied by an increase in the bands located near 1327 and 1405 cm
−1 associated with ionic nitrates (ν
asym(NO
3) at 1327 and 1405 cm
−1). The presence of an isosbestic point suggests the occurrence of the transformation of nitrites into nitrates on the catalyst surface. The appearance of nitrate species is also confirmed by the presence of a low intensity peak at 1030 cm
−1 (ν
sym(NO
3)). Furthermore, a shoulder near 1545 cm
−1, associated with bidentate nitrates (ν(N=O)) is also detected. At the end of the temperature ramp (350 °C) the surface of the catalyst is dominated by the presence of nitrate species, however nitrites are still present (band at 1210 cm
−1).
A similar picture was observed over the Pt-BaO/Al
2O
3 catalyst (
Figure 2B), with only minor differences. Also in this case the formation of chelating nitrites (1218 cm
−1) is seen at the initial stage, reaching a maximum in the same temperature range (220–250 °C) observed for the Rh-based catalyst. Then the bands decrease in favor of nitrate formation, as pointed out by the isosbestic point and by the growth of the bands near 1350 and 1405 cm
−1. At the end of the run (350 °C), the final amount of nitrites on the Pt containing catalyst is higher if compared to the Rh-based sample, as pointed out by the relative intensity of the bands at 1218 cm
−1 (nitrites) and at 1350–1405 cm
−1 (nitrates).
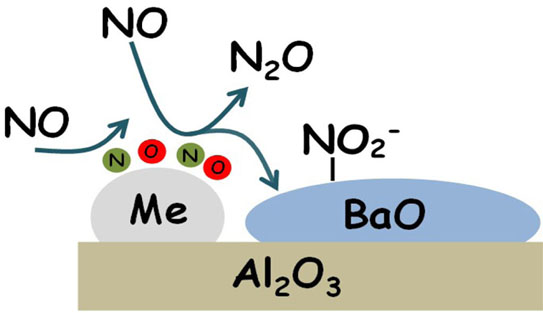
The above results clearly show that upon contacting NO with the reduced catalyst surface, NO is consumed leading to N
2O and nitrites adsorbed over the barium surface. In particular the results are in line with the occurrence, below 250 °C, of the following NO disproportion reaction Equation (1):
In fact the ratio between NO consumption and N
2O formation is not very far from the theoretical value 1:4 expected from the stoichiometry of the overall reaction Equation (1). At higher temperature, above 250 °C, nitrites are transformed into nitrates, in line with previous results [
10].
The overall stoichiometry of the NO disproportion reaction Equation (1) can be explained by considering the occurrence of the following reactions Equations (2)–(4):
where Me is the metal site (Pt or Rh). According to this scheme, the reaction is initiated at low temperature by the decomposition of NO over reduced Me sites, leading to the formation of N- and O-adspecies (reaction Equation (2)). The formation of oxidized metal sites (Me-O species) prevents the dissociation of other NO molecules and this results in the formation of N
2O (reaction Equation (3)) and of nitrites on Ba (reaction 4)). The occurrence of reaction Equation (4) removes O-adatoms on metal sites leaving vacant metal sites accessible for further NO dissociation. Reactions Equations (2)–(4) lead to the overall stoichiometry of reaction Equation (1).
Worth noting is that reactions Equations (2)–(4) require the presence of reduced metal sites, to initiate the NO dissociation reaction. In fact the NO disproportion reaction is observed to a much lower extent over an oxidized Pt-based catalyst sample (data not reported). Along similar lines, the storage component BaO is also important in that it provides the adsorption sites for the nitrite (and nitrate) surface species. In fact, experiments carried out over a bare Pt/Al
2O
3 sample pointed out a much lower N
2O (and nitrite) formation. However, the presence of BaO may also increase the activity of the metal sites in the dissociative chemisorption of NO, as reported elsewhere [
12].
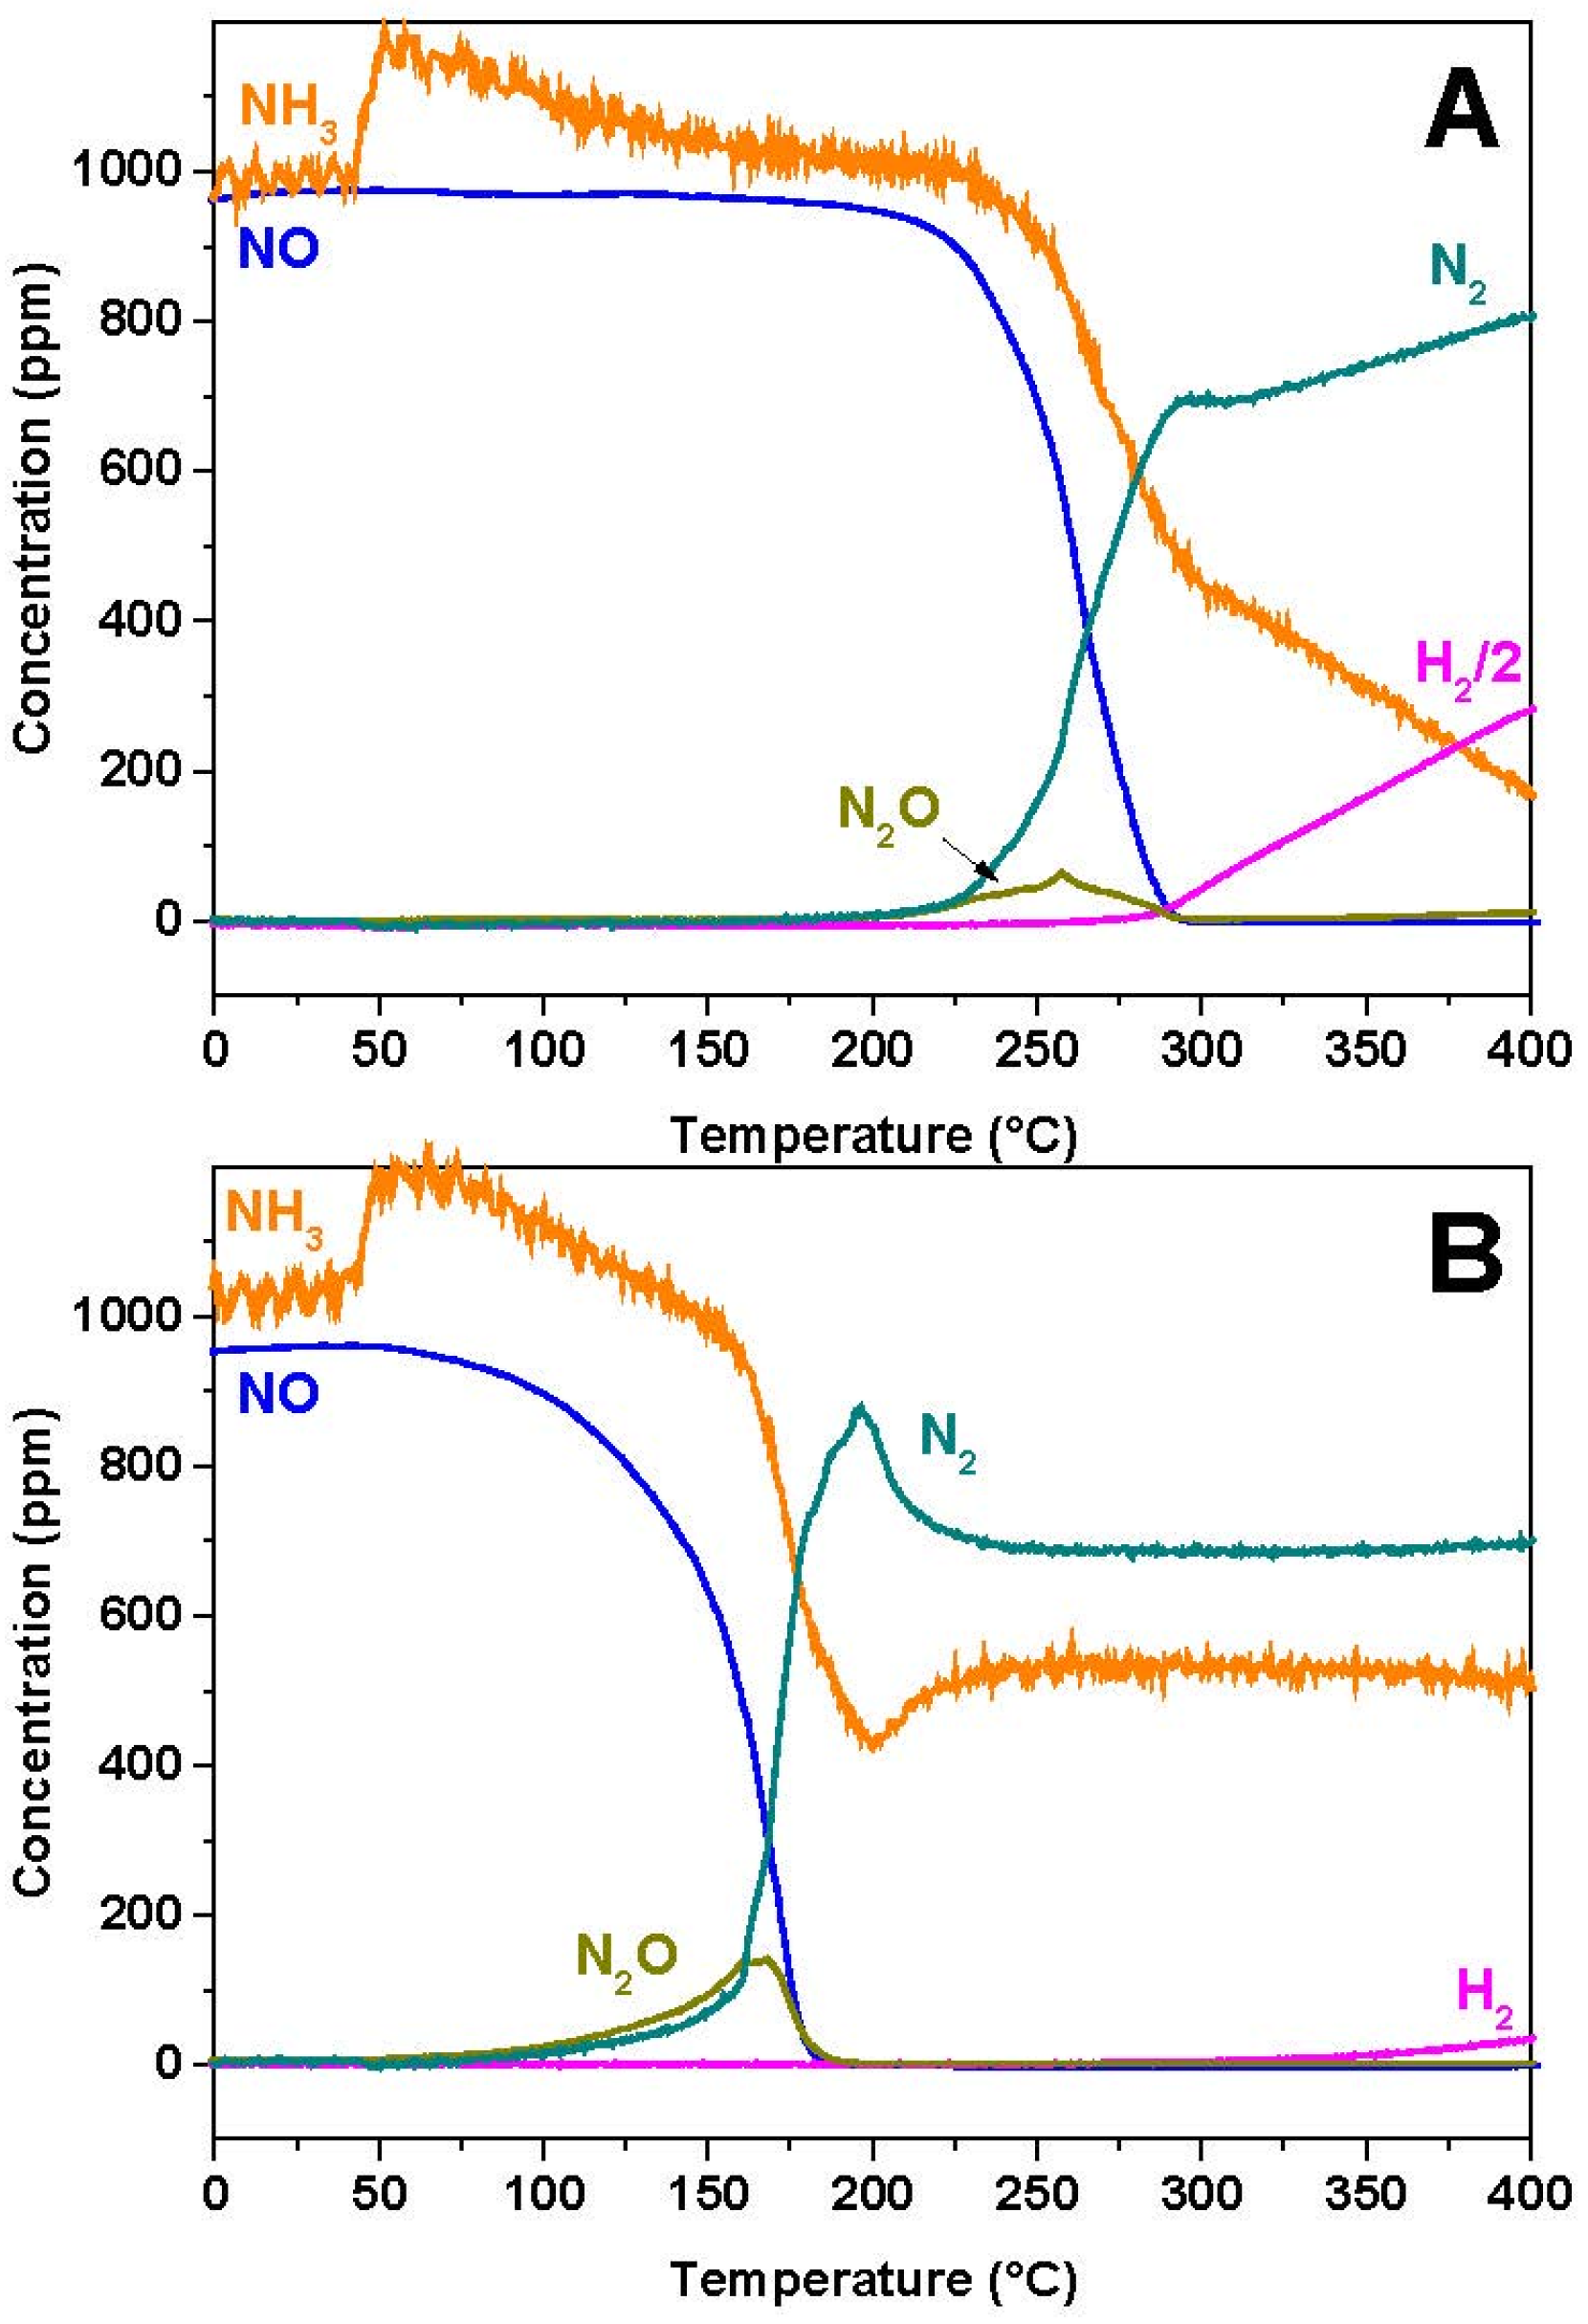
2.2. NO/H2-TPR
To investigate the effect of the presence of a reductant in N
2O formation, experiments were carried out in the presence of H
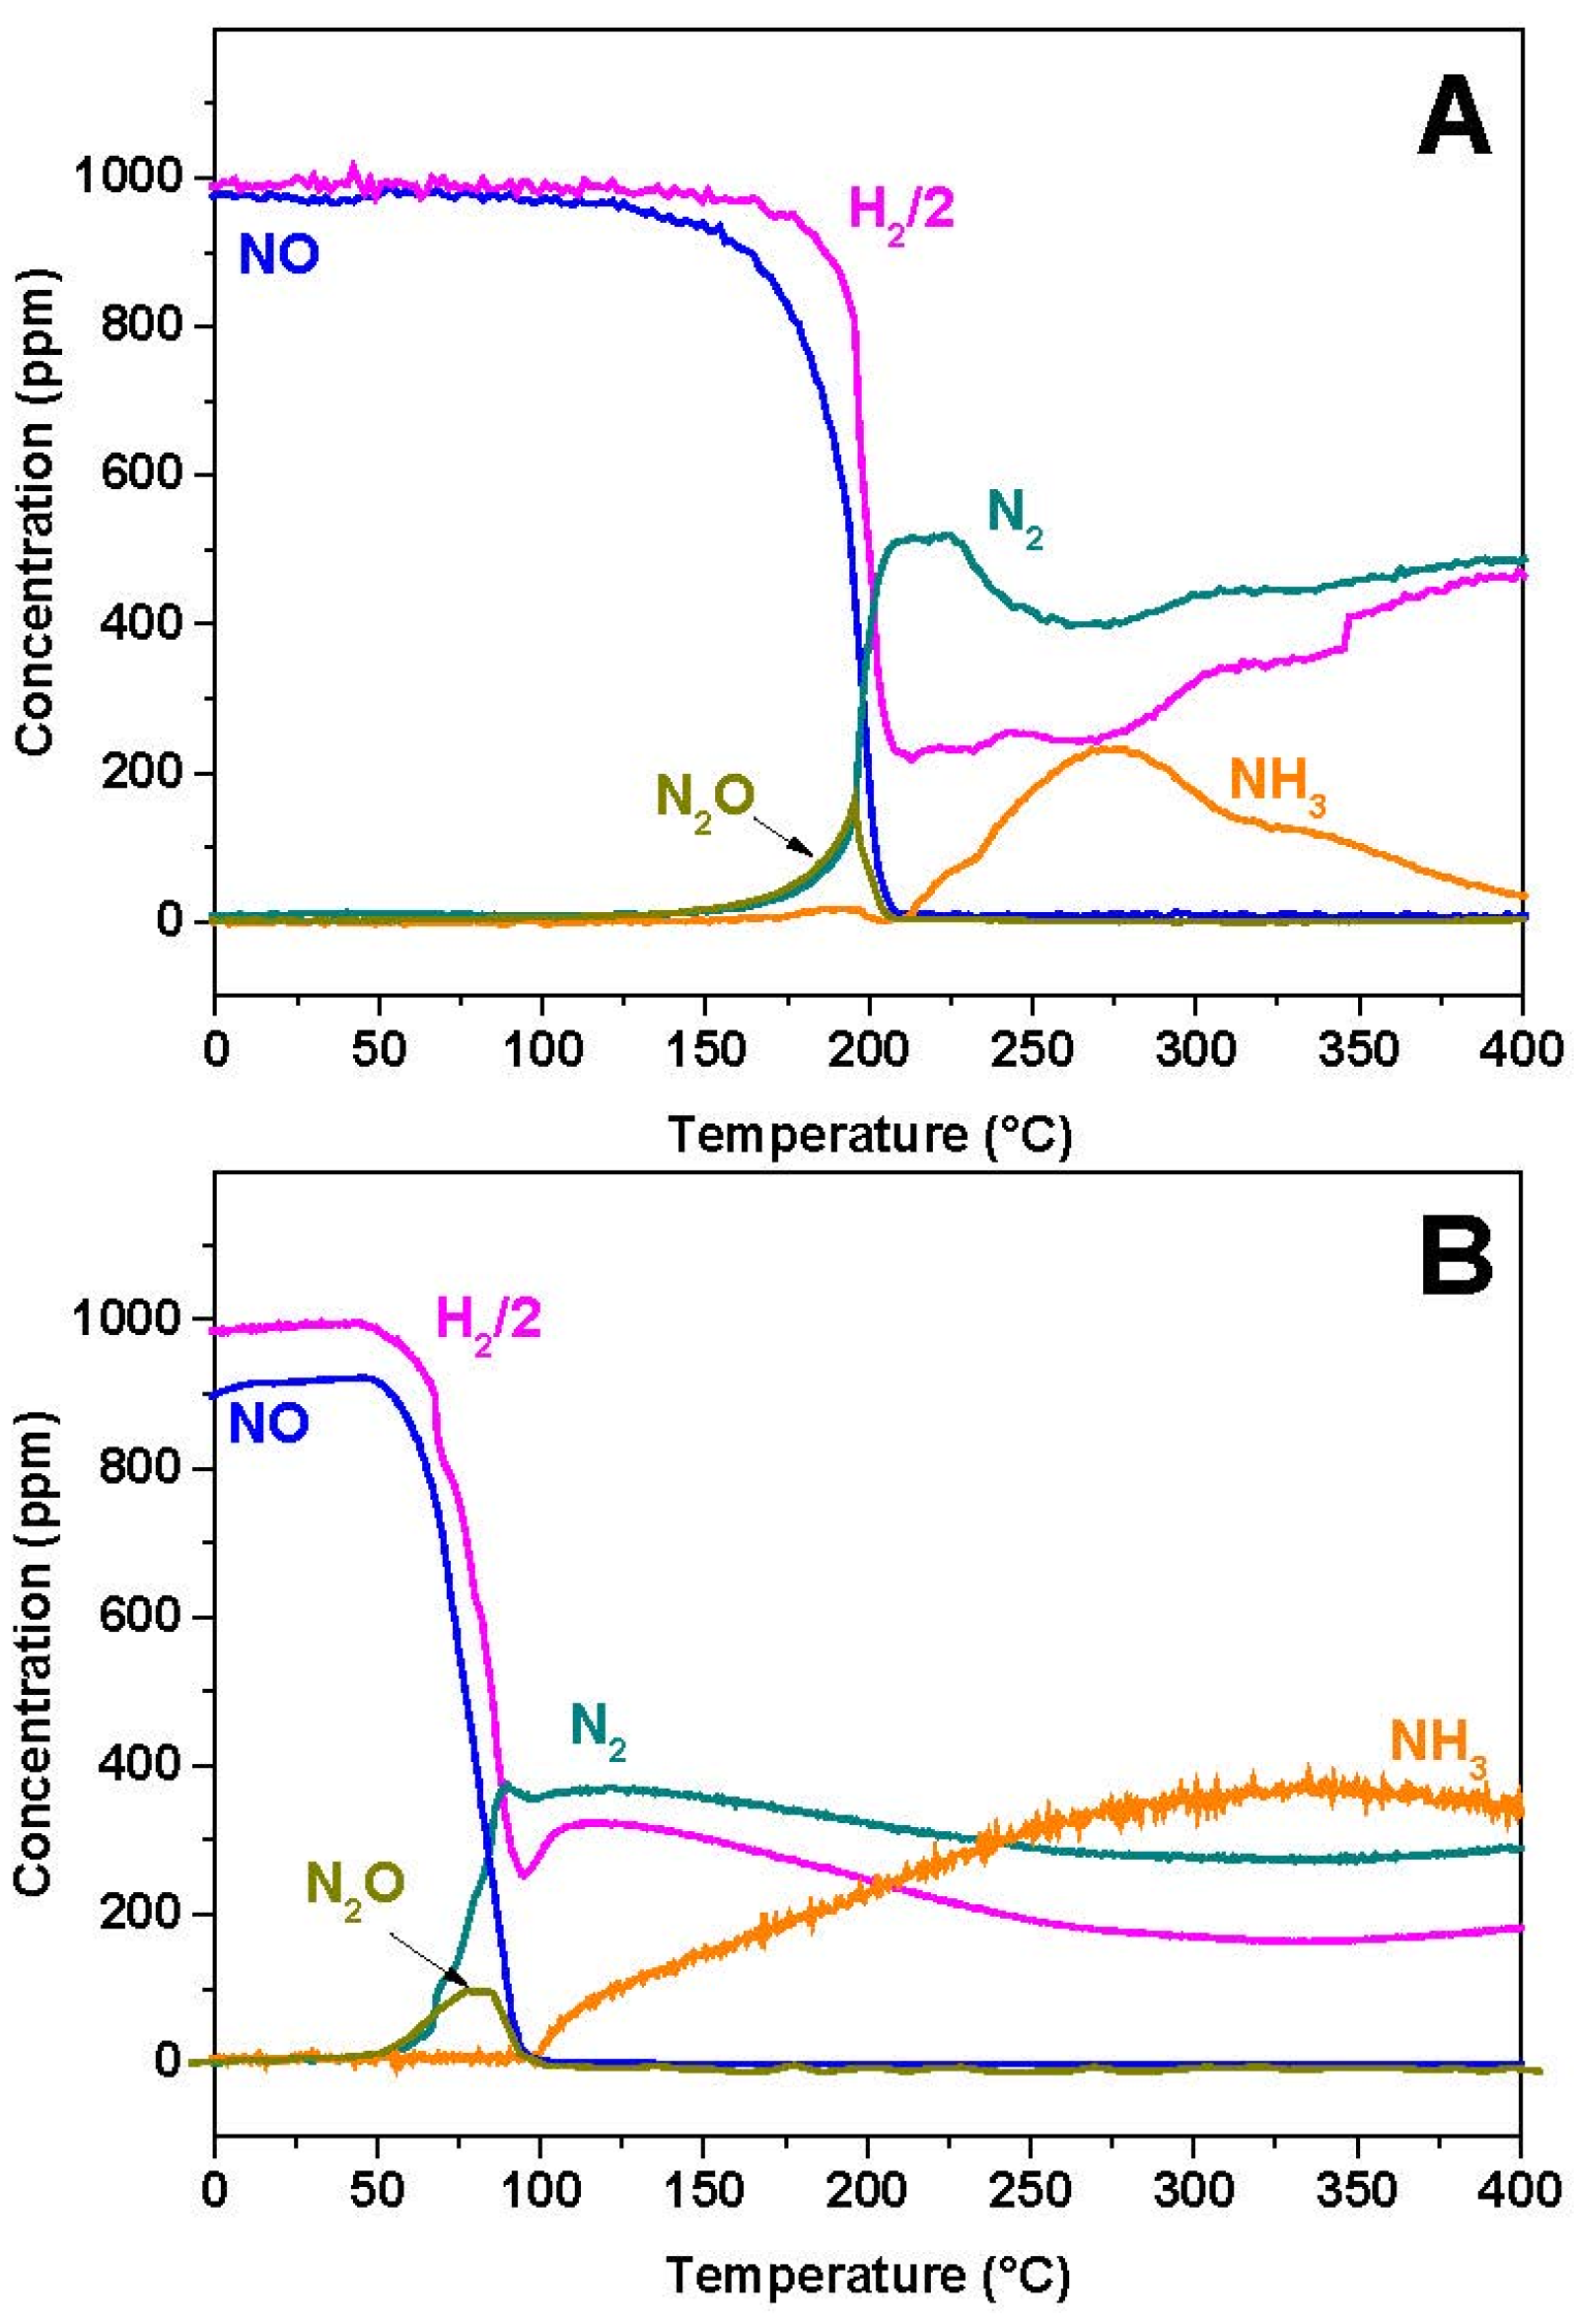
2 and results are shown in
Figure 3A,B in the case of Rh-BaO/Al
2O
3 and Pt-BaO/Al
2O
3 catalysts, respectively.
In the case of the Rh-based catalyst, NO starts to be converted near 150 °C, with formation of N2O and N2 in nearly equal amounts. Then, above 200 °C, NO is fully consumed and N2O formation rapidly drops. Accordingly above 200 °C only N2 and NH3 are seen in the reaction products.
Very similar results are observed in the case of the Pt-BaO/Al
2O
3 catalyst (
Figure 3B). However, in this case NO consumption is observed at much lower temperatures (onset temperature near 50 °C), and the NH
3 selectivity at high temperatures is much higher if compared to the Rh-BaO/Al
2O
3 sample.
The correspondent surface analysis is shown for the Pt-BaO/Al
2O
3 sample in
Figure 4. Upon NO admission, the formation of a very weak band at 1218 cm
−1 is seen, related to the formation of chelating nitrites on the Ba phase. This band slightly increases with temperature, reaches a weak maximum near 85 °C and then disappears at higher temperatures, along with N
2O. The spectra also show complex bands in the range 1300–1600 cm
−1, with positive and negative contributions. These bands are related to modifications of a covalent carbonate species, initially present on the surface, into more symmetric, ionic species upon interaction with water formed during the reduction of NO with H
2 and upon the temperature increase.
Very similar results were obtained in the case of the Rh-based sample (not shown): also in this case we observed the formation of a weak nitrite band in the temperature range where N2O is formed.
Upon comparing these results with those obtained in the absence of H
2 (
i.e., the NO-TPR runs,
Figure 1 and
Figure 2), it clearly appears that N
2O formation is seen at much lower temperatures in the case of the Pt-BaO/Al
2O
3 sample, and at slightly higher temperatures in the case of the Rh-based sample. In both cases N
2O formation is accompanied by nitrite evolution, although the band of nitrites is much lower in the presence of H
2.
As suggested above (see reactions Equations (2)–(4)), N2O (and nitrite) formation requires the presence of reduced Me (Pt, Rh) sites. Hence the reaction is initiated by the reduction of the PGM sites by H2: the lower onset temperature for NO reduction illustrates the much higher reducibility of the Pt-based sample if compared to the Rh-BaO/Al2O3 catalyst.
As shown in
Figure 3, the NO reduction reaction leads at low temperatures to the formation of N
2 and N
2O. Then, at higher temperatures, N
2O formation becomes nil and the selectivity shifts towards N
2 and NH
3. It is speculated that upon reduction of the PGM sites by H
2, N
2O (and nitrite) formation occurs according to reactions Equations (2)–(4). The presence of H
2 leads also to the formation of Rh-H and Pt-H species, according to the reaction Equation (5).
where Me is the metal site (Pt or Rh). The so formed Me-H species scavenge O-adatoms, reaction Equation (6):
The scavenging of O-adatoms according to reaction Equation (6) limits the formation of nitrites according to reaction Equation (4), as indeed is observed in the presence of H2.
Besides, N
2 formation is also observed along with N
2O, coming from the coupling of N-adatoms (reactions Equations (2) and (7)):
Since the O-removal efficiency by H
2 increases with temperature, upon increasing the temperature NO completely dissociates and N-adatoms lead to the formation of N
2 (reaction Equation (7)) or of NH
3 (reaction Equation (8)), thus shifting the selectivity towards N
2 and NH
3:
Notably, in the case of the Rh-containing catalyst, the NH3 concentration decreases above 275 °C. This is due to the occurrence of the NH3 decomposition reaction, which is efficiently catalyzed over Rh, as it is shown below.
2.3. NO/NH3-TPR
Figure 5 shows the results obtained during the reduction of NO with NH
3 in the case of Rh-BaO/Al
2O
3 (
Figure 5A) and Pt-BaO/Al
2O
3 catalysts (
Figure 5B). The onset temperature for NO reduction is seen near 200 and 100 °C for the Rh- and Pt-based catalysts, respectively. These temperature thresholds are higher than those measured in the case of H
2, but show the same order of reactivity of the investigated samples, being the Pt-BaO/Al
2O
3 catalyst more reactive than Rh-BaO/Al
2O
3. Over both the catalytic systems the initial formation of N
2O and N
2 is observed; then, when complete NO consumption is attained (
i.e., near 295 °C and 185 °C over Rh-BaO/Al
2O
3 and Pt-BaO/Al
2O
3, respectively) the N
2O concentration drops to zero resulting in complete N
2 selectivity. In the case of the Rh-based sample, above 300 °C an increase in the N
2 concentration is observed, along with H
2 and a correspondent decrease of the NH
3 concentration. This is due to the occurrence of the NH
3 decomposition reaction:
which is catalyzed by the Rh component.
The results of the FT-IR analysis carried out over the Rh-BaO/Al
2O
3 and the Pt-BaO/Al
2O
3 catalysts are shown in
Figure 6A,B respectively. In the case of Rh-BaO/Al
2O
3 (see
Figure 6A), upon NH
3 admission, bands at 1095 and 1647 cm
−1 (low intensity) immediately appear (spectrum a). These bands are related to the symmetric and antisymmetric bending modes of ammonia. Then, upon NO admission, a weak band of nitrites appears at 1212 cm
−1. Upon heating, the bands associated with NH
3 decrease and eventually disappear. Besides, the nitrite band slightly increases up to 275 °C and then disappears. In addition to these bands, positive and negative bands are evident in the spectra due to the distortion of carbonate species, as previously discussed.
The Pt-BaO/Al
2O
3 catalyst shows similar features (see
Figure 6B) but a much higher amount of nitrites is formed upon NO admission, with respect to Rh-BaO/Al
2O
3. Nitrites readily disappear near 200 °C (spectrum g).
The picture obtained from the analysis with NH3 is consistent with that discussed in the case of H2. Upon reduction of the PGM sites by NH3, NO is dissociated into N- and O-adatoms and formation of N2O and nitrites is observed (reactions Equations (2)–(4)). Formation of these species is observed at lower temperatures over the Pt-based sample in view of its higher reactivity, in line with data obtained during the NO/H2-TPR.
By comparing NO/NH
3-TPR and NO/H
2-TPR data, it is apparent that the onset of N
2O formation is shifted towards higher temperatures (compare
Figure 3A and
Figure 4A) and also higher amounts of nitrites are formed. This can be explained considering that NH
3 is a much less efficient reductant (
i.e., a less efficient O-scavenger) compared to H
2. This results in a higher onset temperature for the reaction and a higher temperature for complete NO dissociation.
In the case of NO/NH
3-TPR experiments, N
2O and N
2 formation involves coupling of N-containing species coming from NO and/or NH
3 molecules. To investigate such aspects, isotopic labeling experiments were carried out with NH
3 and
15NO over both Pt- [
13] and Rh-BaO/Al
2O
3 [
14]. In both cases the low-T NO consumption (
i.e., below the maximum in N
2O concentration) is accompanied by the evolution of double labeled
15N
2O and of single labeled N
2 (
15N
14N), with only minor amounts of single labeled N
2O (
15N
14NO). Then, at higher temperatures (near the complete NO consumption) N
2O is no more detected among the reaction products and all the N
2 isotopes are observed.
These results indicate that N
2O formation involves primarily NO molecules only, according to reactions Equations (2) and (3). In this pathway, the role of NH
3 is hence that of keeping the noble metal sites in a reduced state, with formation of Me-H and Me-NH
2 species according to reaction Equation (10):
Me-H scavenges O-adatoms, resulting in H
2O formation while Me-NH
2 reacts with (labelled) nitrite species leading to the formation of the single labelled N
2 (
15N
14N), according to reaction Equation (11), where O
= is lattice oxygen:
This accounts for the formation of single labelled N
2 that accompanies N
2O evolution. At higher temperatures, near complete NO consumption where no N
2O is seen, all N
2 isotopes are detected due to the statistical coupling of N-adatoms coming from NO- and NH
3-decomposition [
13].
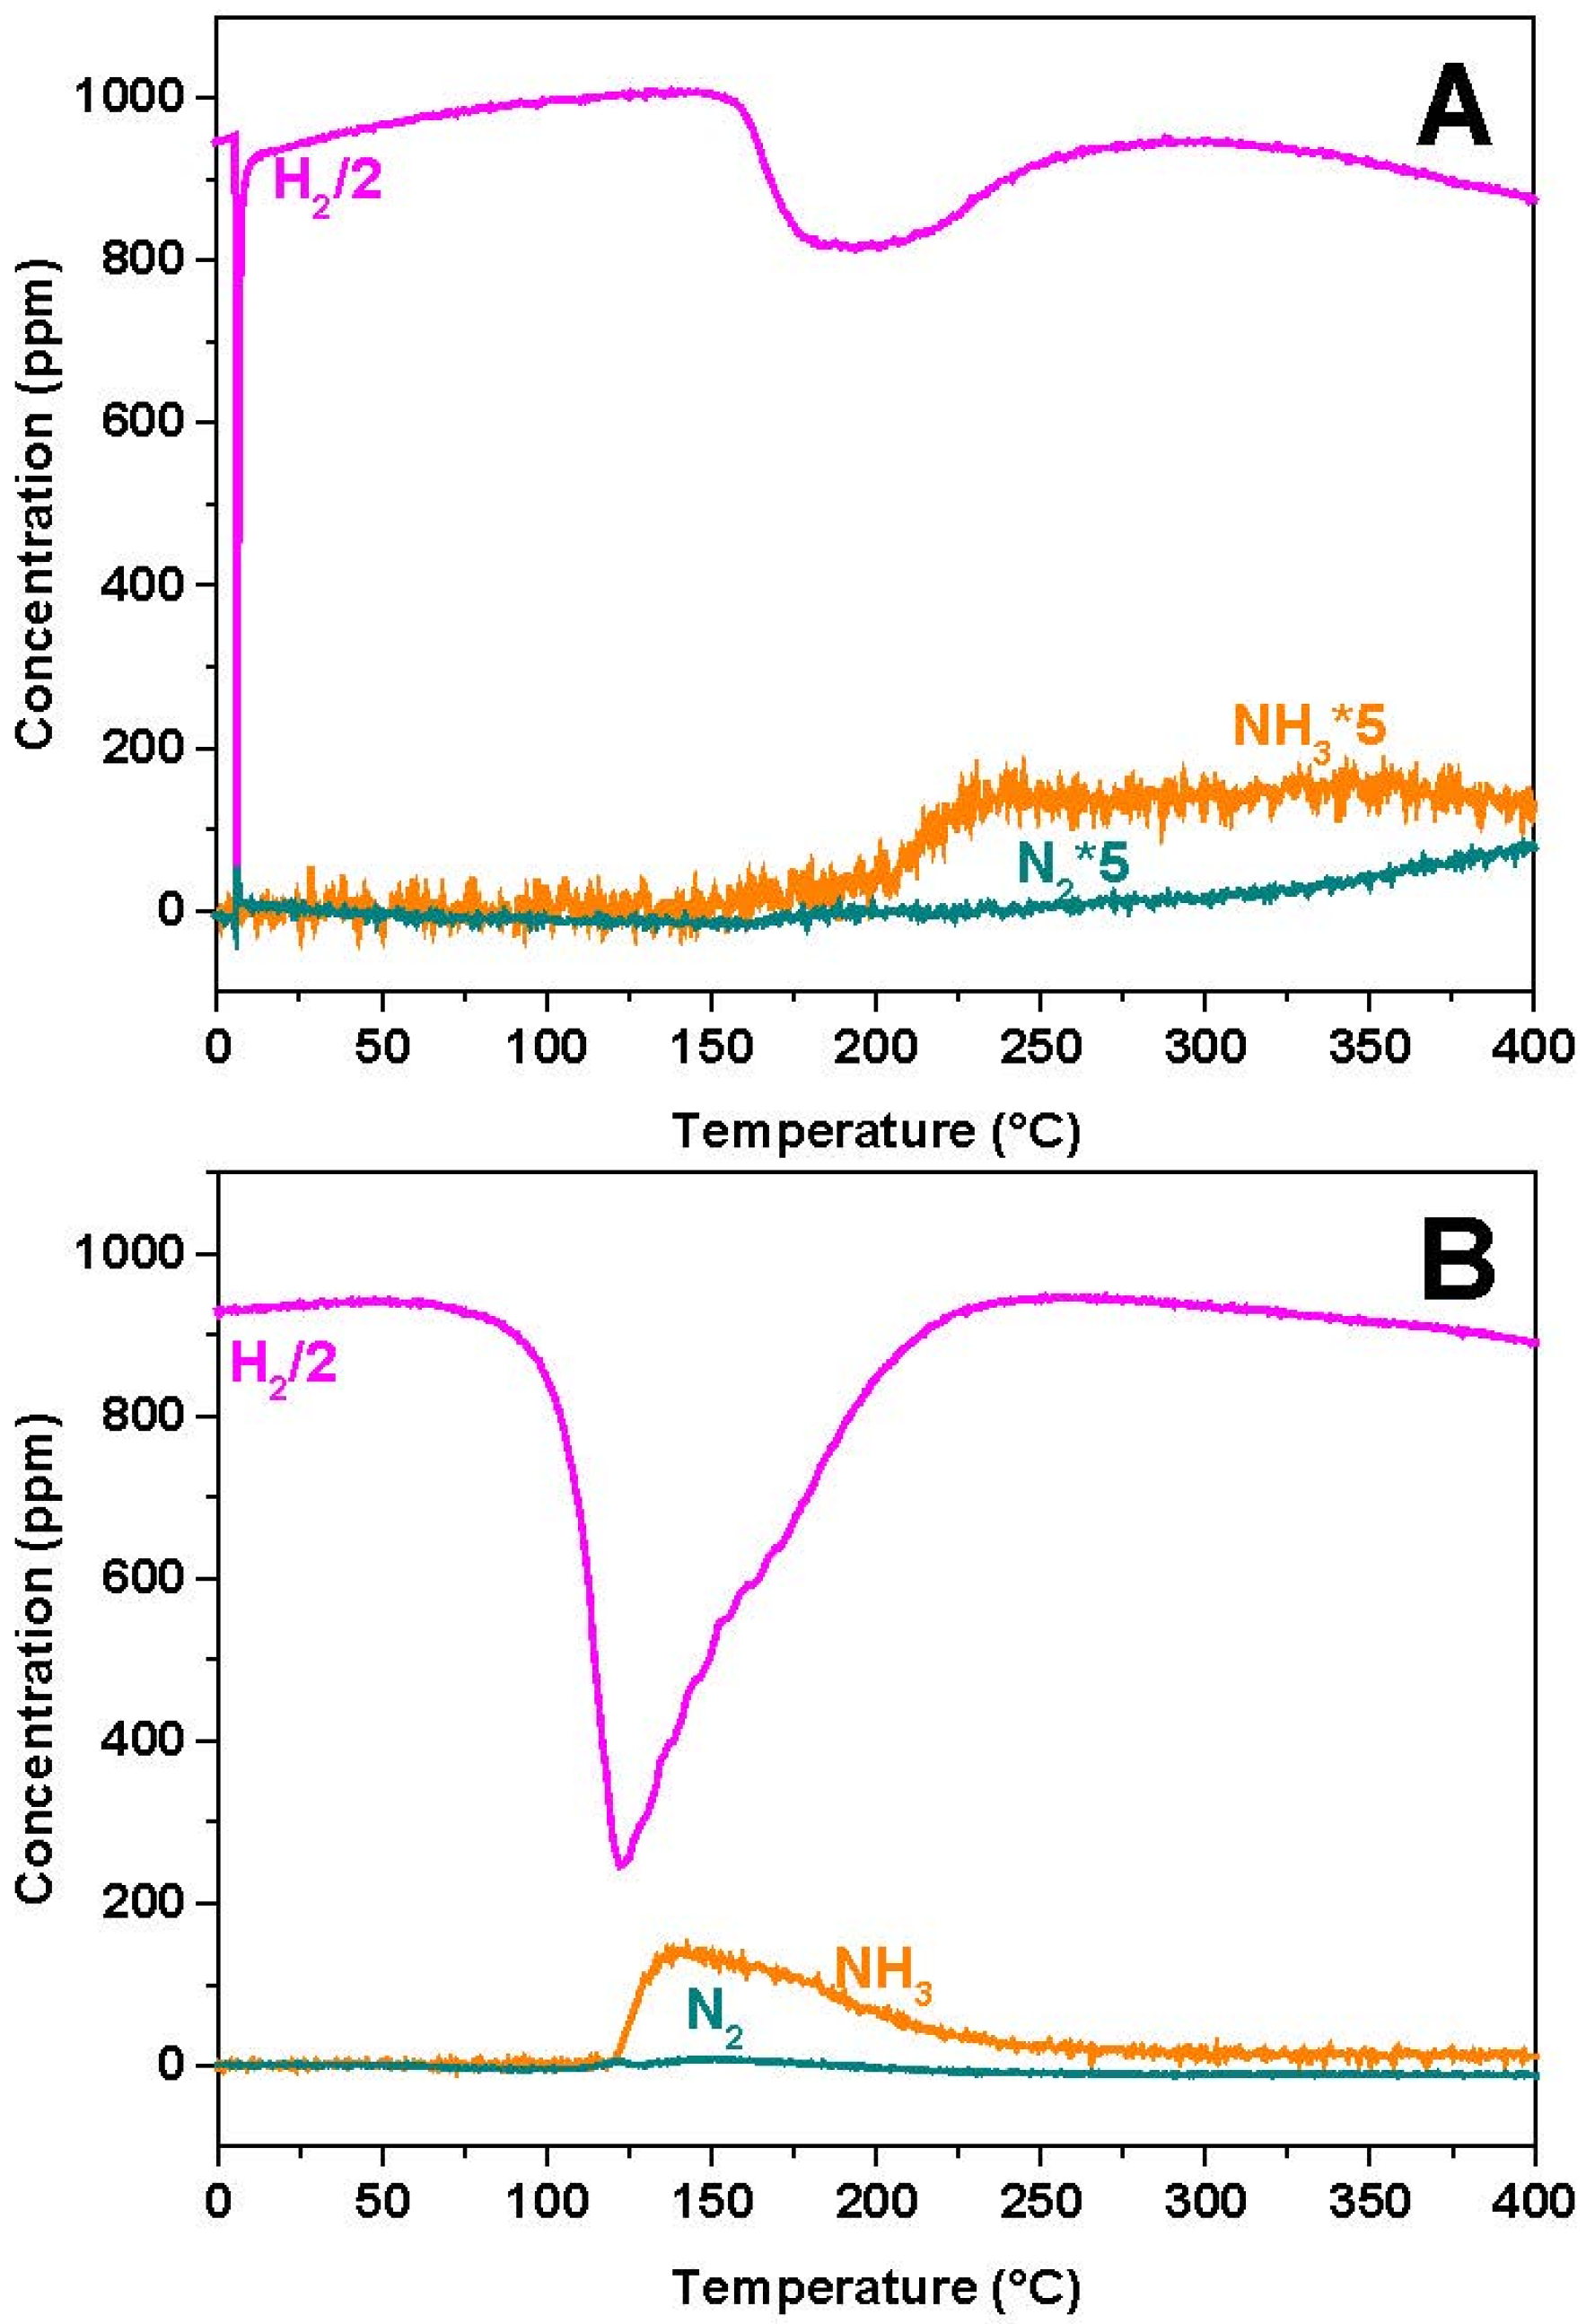
2.4. H2-Temperature Programmed Surface Reaction (H2-TPSR)
Figure 7 shows the results of the H
2-TPSR experiments performed over Rh-BaO/Al
2O
3 and Pt-BaO/Al
2O
3 after NO
x adsorption at 350 °C. The gas phase results are shown in
Figure 7A,B for the Rh- and Pt-based catalyst samples, respectively. In the case of the Rh-containing sample, the temperature threshold for hydrogen consumption is seen near 170 °C. Above 200 °C NH
3 evolution is seen, followed by that of N
2 above 300 °C. The initial H
2 consumption is probably related to the reduction of the Rh sites, since it is not accompanied by the release of reaction products.
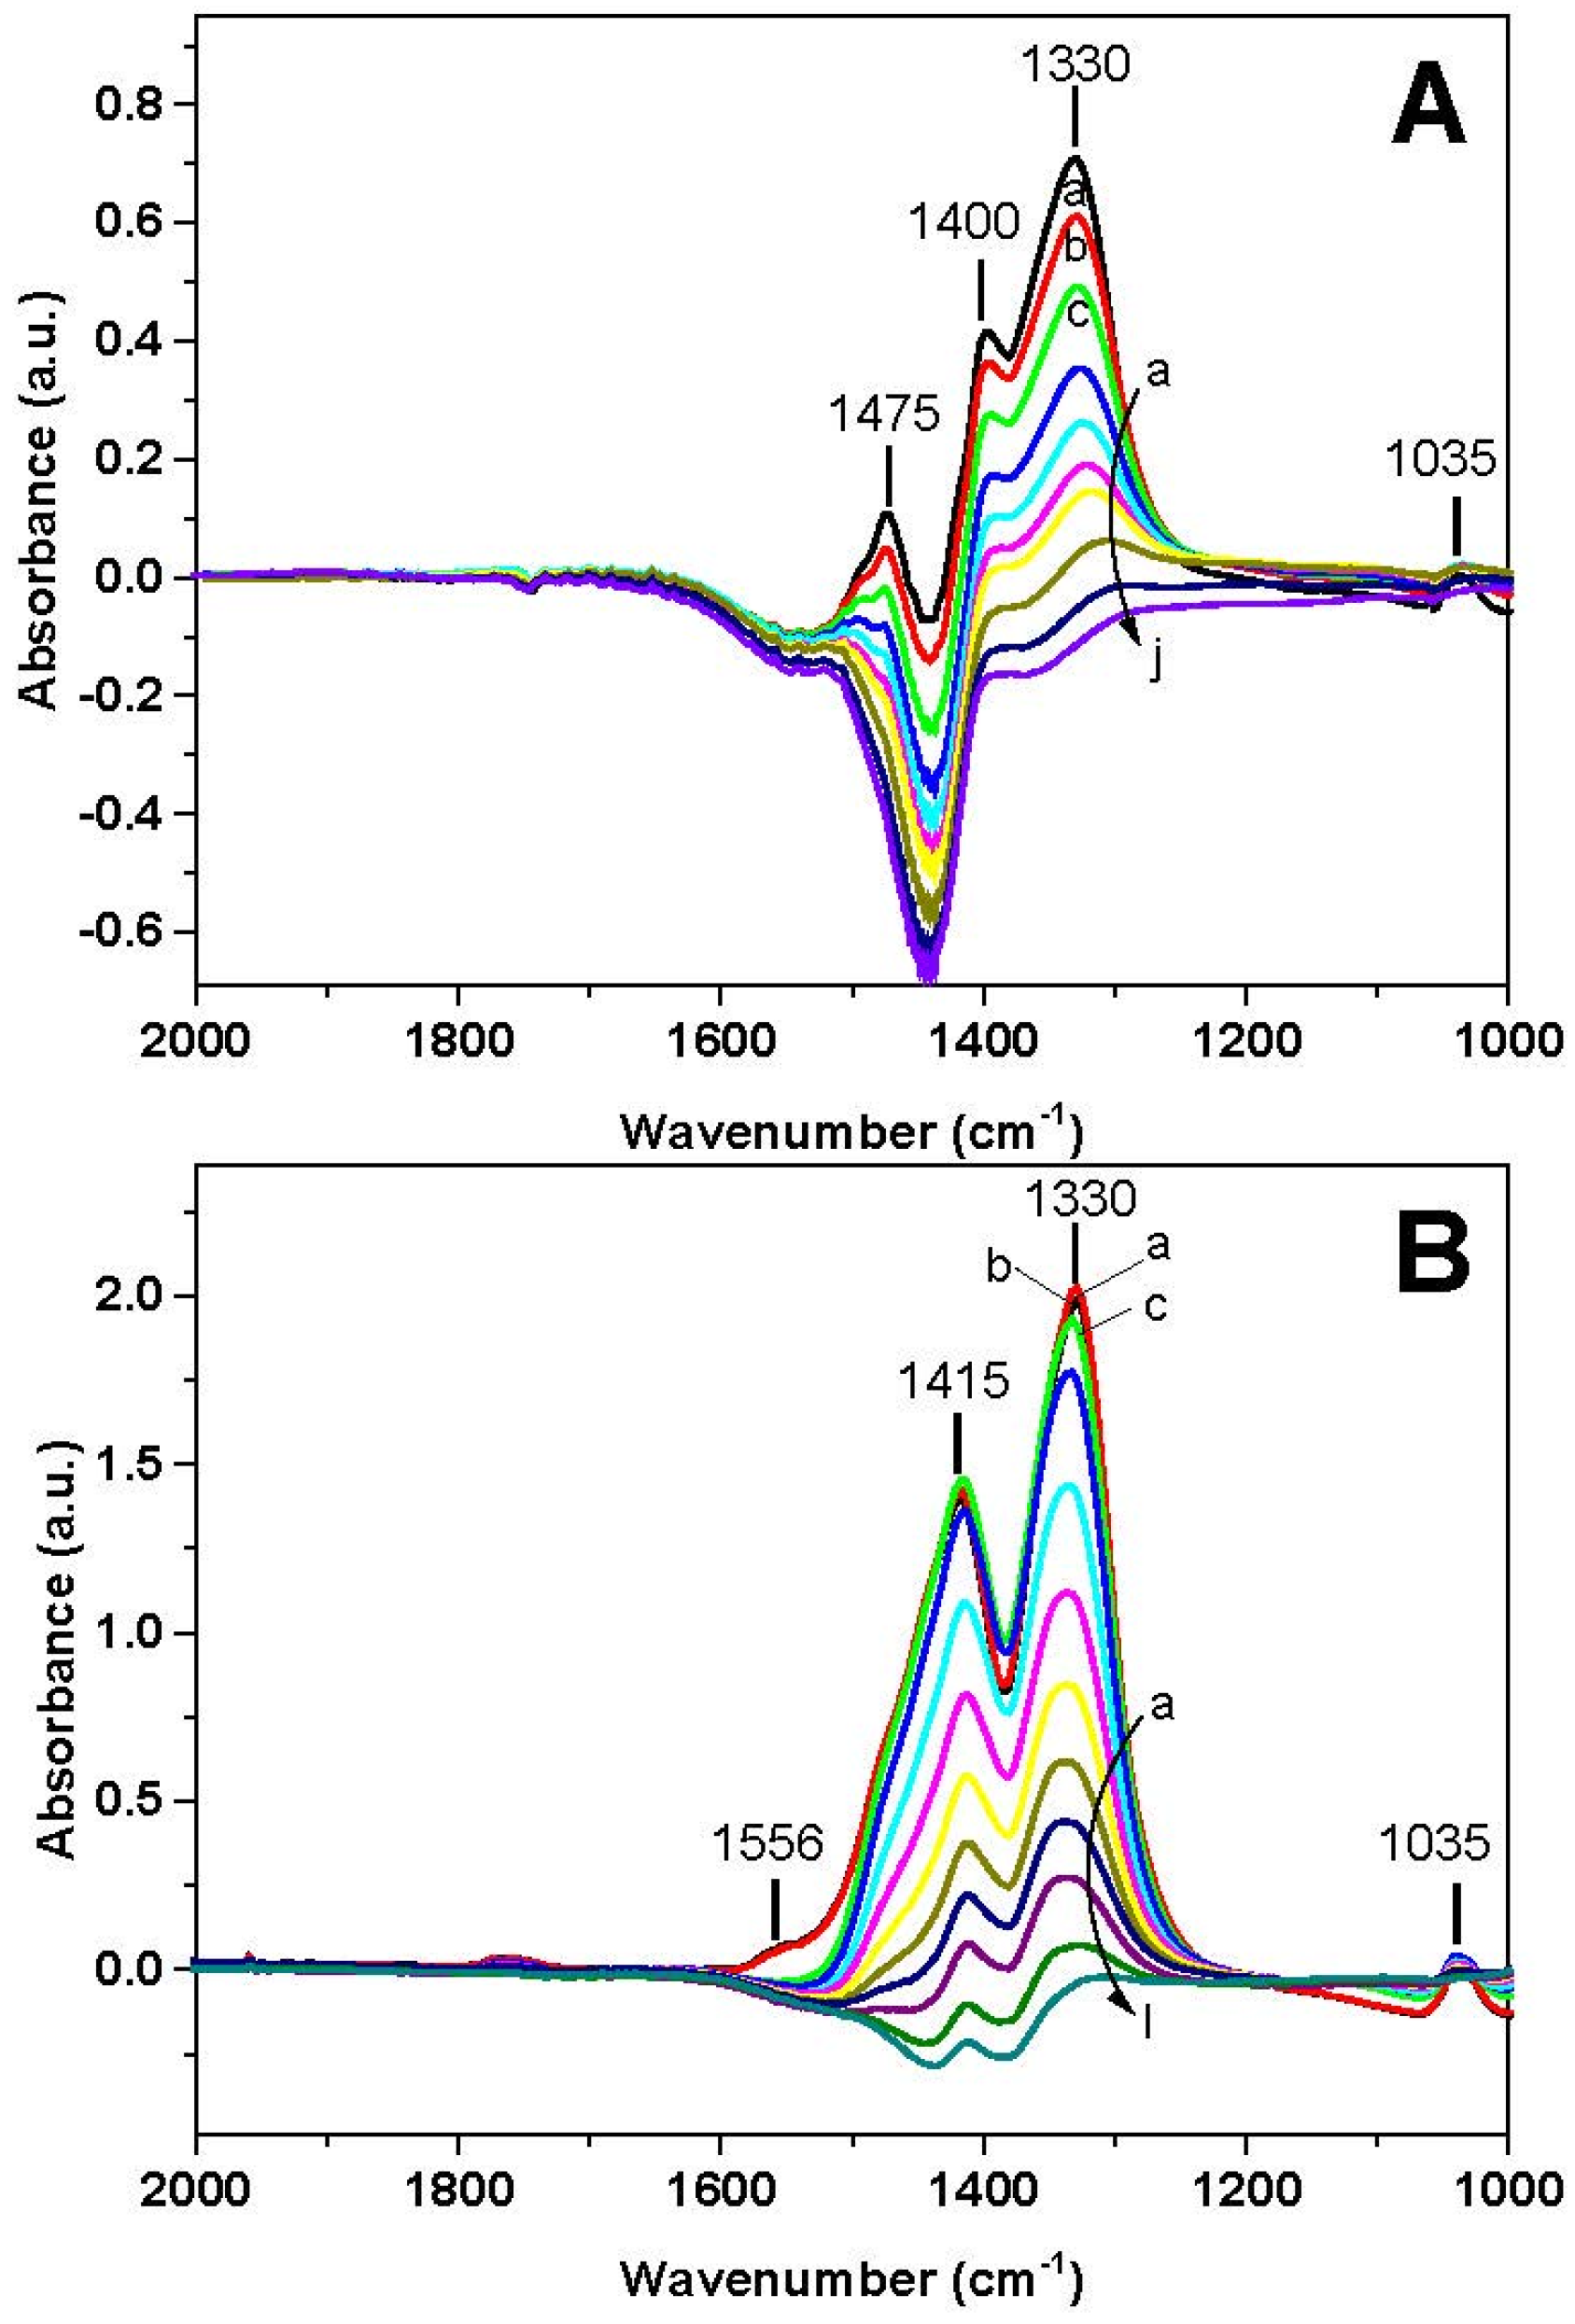
The corresponding FT-IR spectra are shown in
Figure 8A. The spectrum recorded prior to H
2 consumption (spectrum a) corresponds to the surface ionic nitrate (ν
asym(NO
3) mode split into two peaks at 1400 and 1330 cm
−1; ν
sym(NO
3) mode at 1035 cm
−1). The band near 1470 cm
−1 is an artefact due to the presence of carbonate species, which have been partially displaced upon adsorption of NO
x and therefore lead to the formation of negative peaks in the subtraction spectra. Consequently, FT-IR analysis confirms that NO
x have been stored at 350 °C in the form of nitrate species.
Upon heating, the reduction of nitrates occurs from 200 °C, as it is obvious from the corresponding decrease of the bands. The nitrate bands decrease in intensity with temperature, and no new bands are apparent. At 388 °C (spectrum j) the surface is clean and only a negative band at 1440 cm−1 is visible, due to carbonates that have been displaced upon nitrate adsorption from NO/O2 at 350 °C.
These results indicate that, over Rh-BaO/Al2O3, the stored nitrates are reduced by hydrogen selectively into NH3 (and minor amounts of N2), without any formation of NO or N2O.
Similar results were obtained in the case of the Pt-containing catalyst (
Figure 7B and
Figure 8B). Gas phase analysis (
Figure 7B) shows that H
2 consumption is seen starting from 100 °C,
i.e., at lower temperatures than Rh-BaO/Al
2O
3. The H
2 consumption is accompanied by the formation of ammonia with traces of nitrogen; no other reaction products (e.g., NO, N
2O) are formed. Also in this case the H
2 consumption is seen before the evolution of the reaction products, likely indicating the reduction of the catalyst metal sites.
Surface analysis (
Figure 8B) showed the presence of the ionic nitrates (ν
asym (NO
3)) mode split into two peaks at 1417 and 1320 cm
−1; ν
sym(NO
3) mode at 1035 cm
−1) and minor amounts of bidentate nitrates (ν(N=O) mode at 1555 cm
−1) on the catalyst surface at the beginning of the run (spectrum a). The reduction of nitrates is observed above 115 °C, in line with gas-phase results. Upon increasing the temperature the reduction of nitrates proceeds faster and complete reduction is attained above 200 °C, at a much lower temperature with respect to Rh-BaO/Al
2O
3. Also in this case, residual carbonates, present on the surface before the NO
x storage, were removed and this results in weak negative bands at 1440 and 1380 cm
−1.
H
2-TPSR experiments hence indicate that the reduction with H
2 of nitrates stored over both Pt- and Rh-containing catalyst samples does not lead to the formation of N
2O. The Pt-BaO/Al
2O
3 sample is more active than the Rh-containing catalyst but in both cases only NH
3 was observed as reduction product, along with traces of N
2. These results are in line with previous data obtained over the same Pt-containing sample used in this study and published elsewhere [
15].
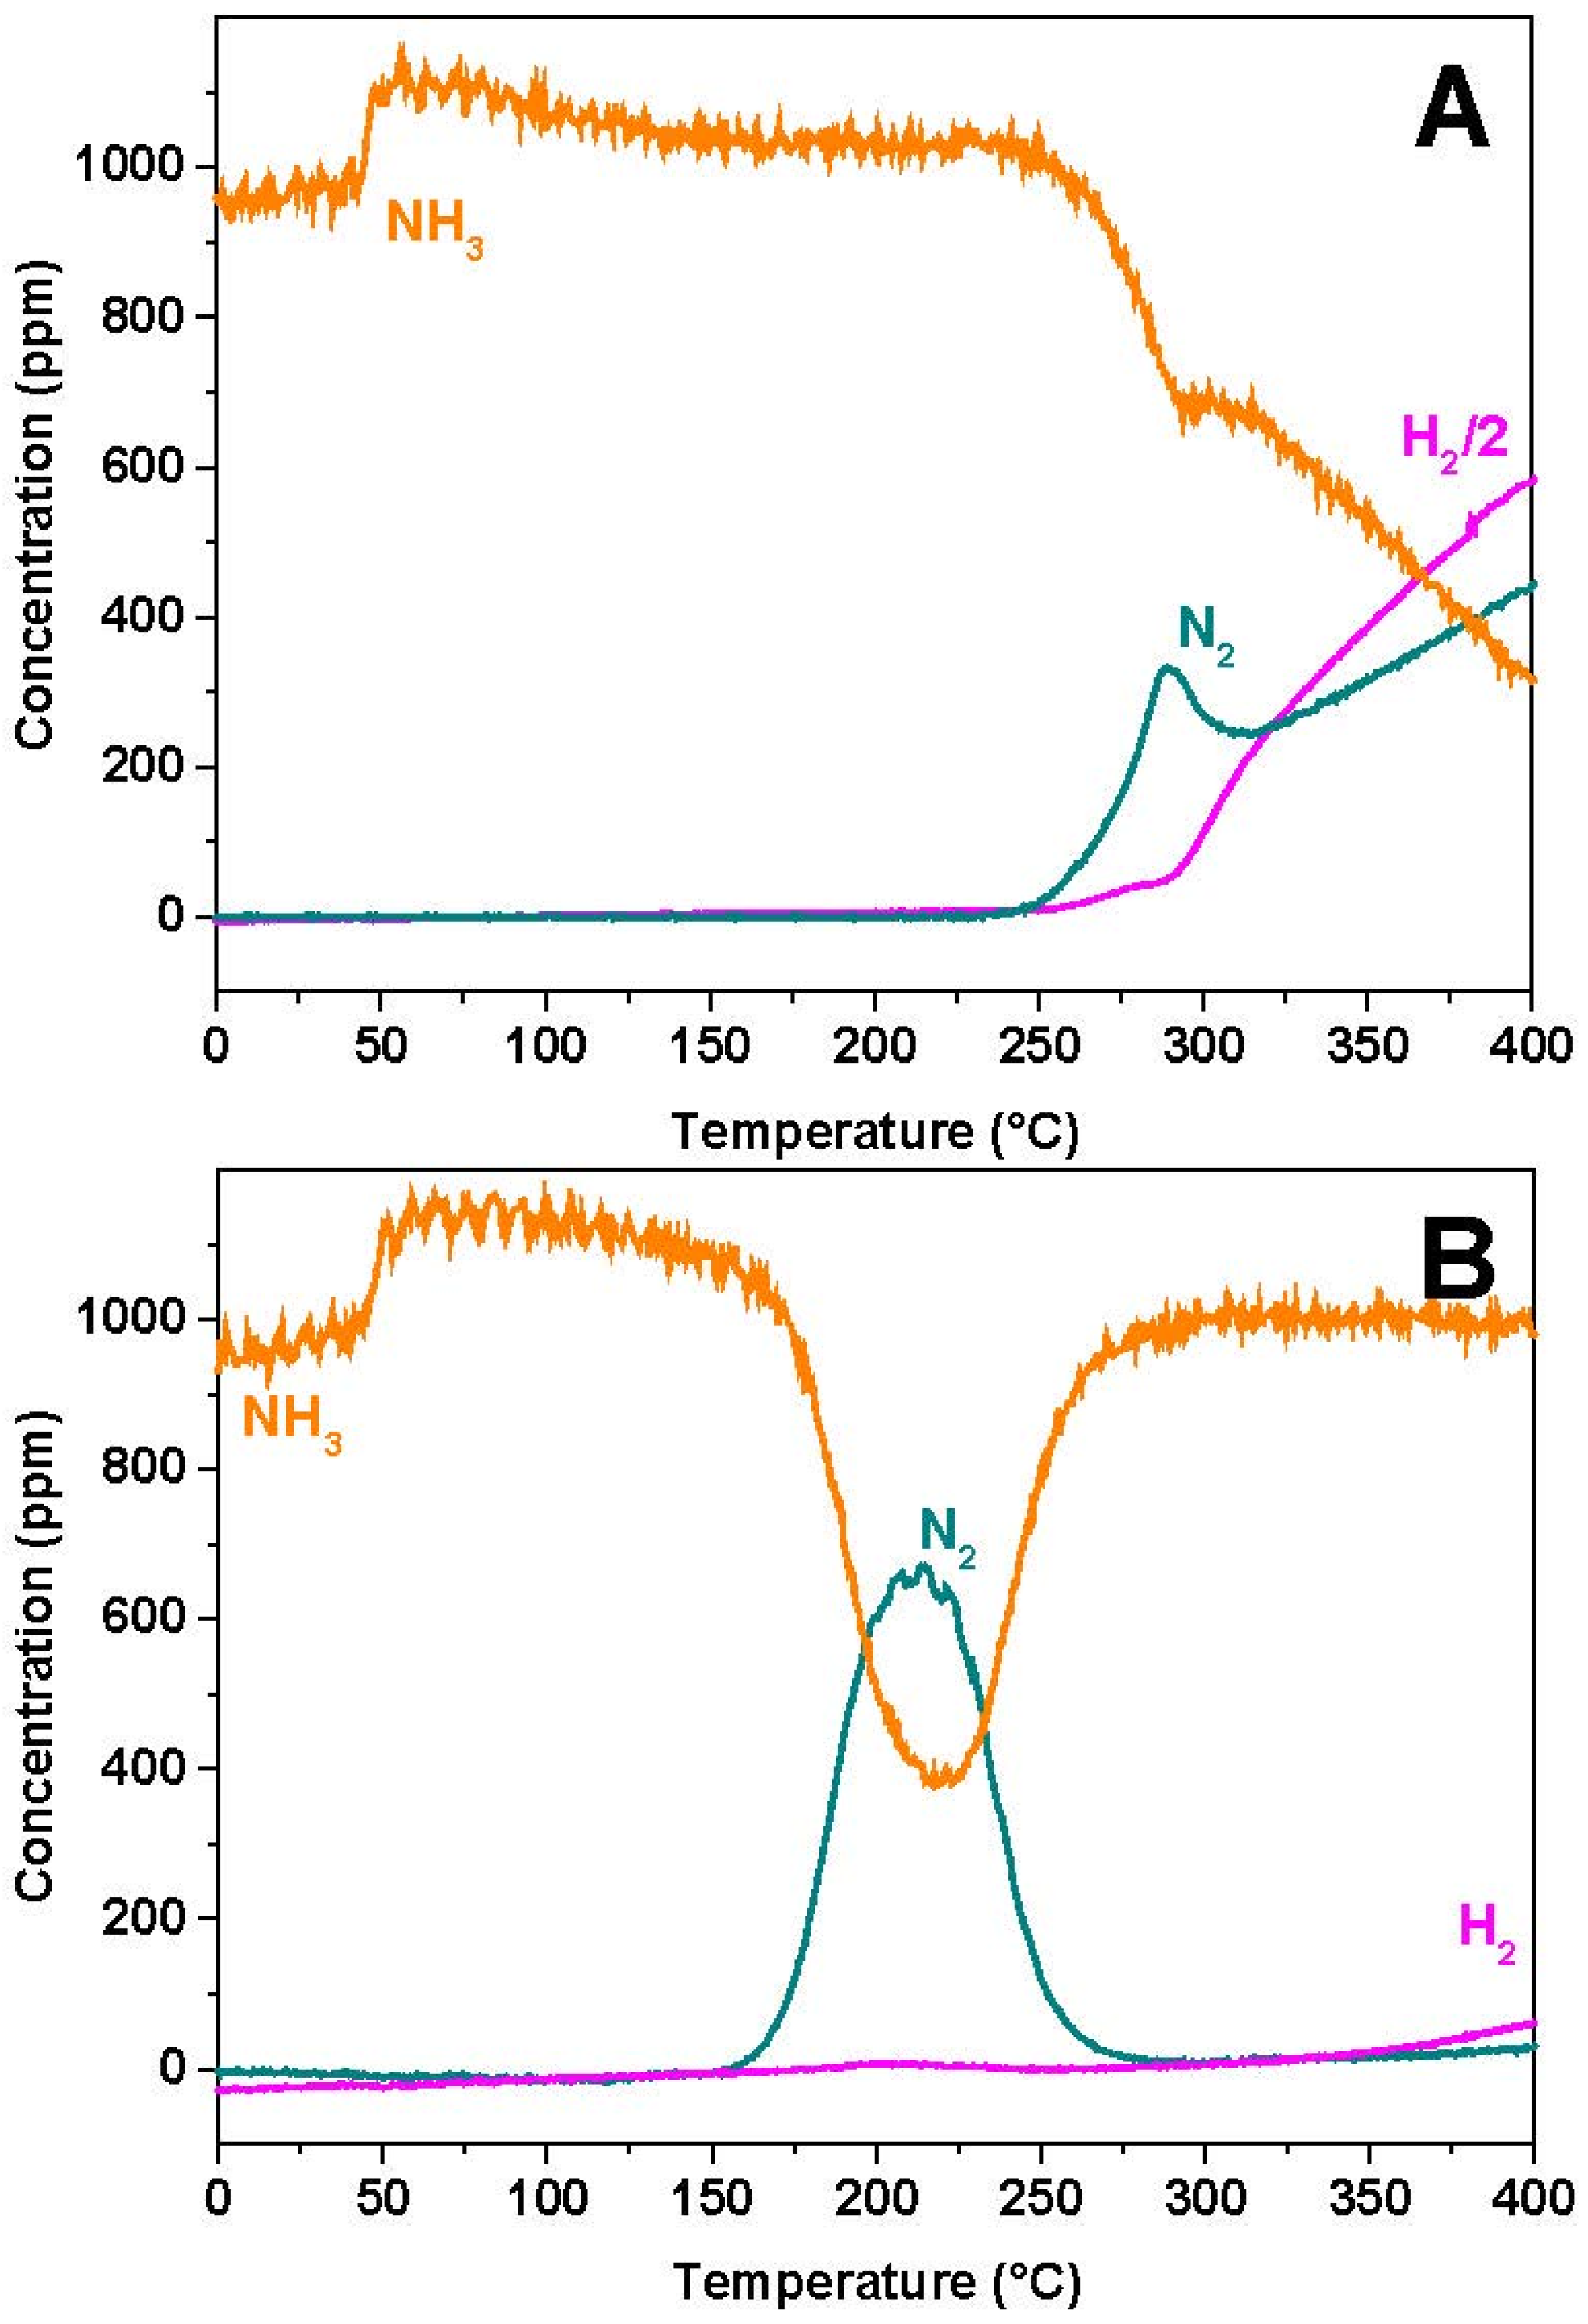
2.5 NH3–TPSR
Figure 9 and
Figure 10 show the results obtained during TPSR experiments performed with NH
3 after NO
x adsorption at 350 °C. The gas phase results are shown in
Figure 9A,B for Rh-BaO/Al
2O
3 and Pt-BaO/Al
2O
3, respectively. In the case of the Rh-catalyst (
Figure 9A), ammonia desorption is observed at the beginning of the heating ramp. Then the temperature onset for ammonia consumption is seen near 250 °C,
i.e., at higher temperatures if compared to H
2 (see
Figure 7A). The NH
3 consumption is accompanied by the formation of nitrogen, whose concentration shows a peak with maximum near 280 °C. At temperatures above 300 °C ammonia is further consumed leading to the evolution of N
2 and H
2. The initial N
2 formation, with maximum near 280 °C, is due to the reduction of the stored nitrates, whereas the nitrogen formation above 300 °C is due to occurrence of the NH
3 decomposition reaction. Notably, the reduction of the stored nitrates with ammonia is fully selective to N
2, and neither N
2O nor NO formation was observed.
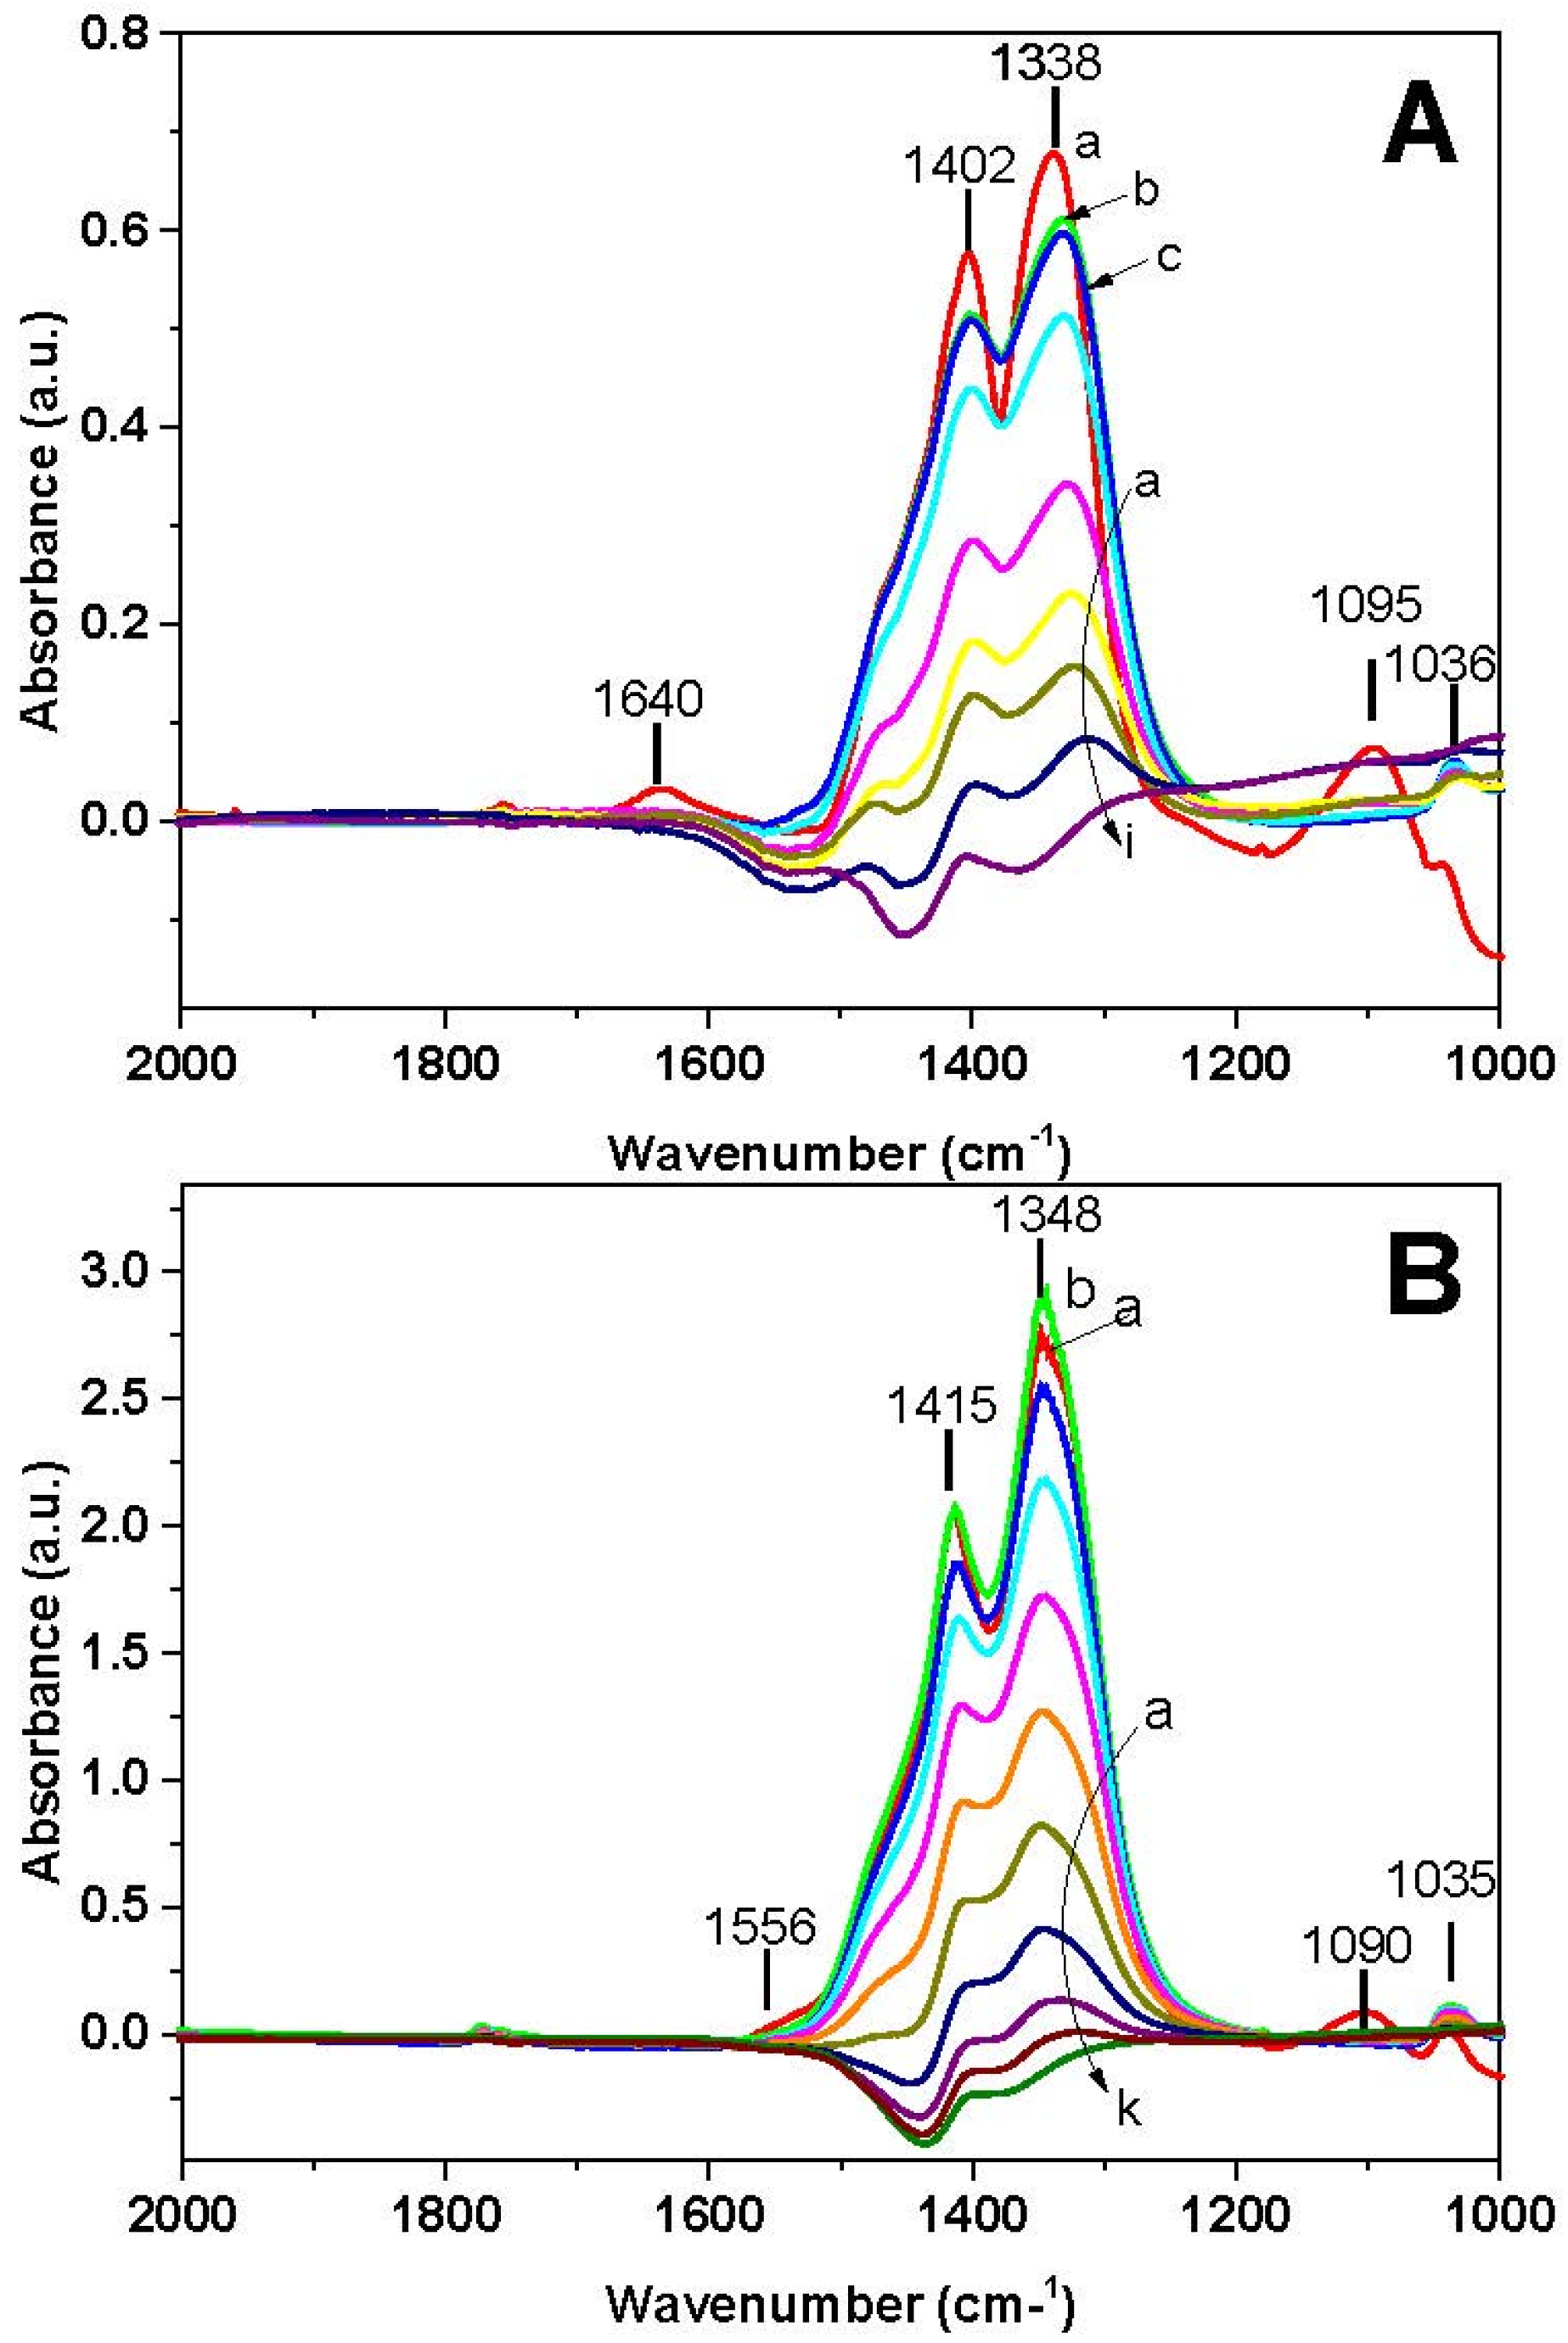
FT-IR spectra recorded during the NH
3-TPSR are shown in
Figure 10A. Ionic nitrates (bands at 1402, 1338, and 1036 cm
−1) and adsorbed ammonia (bands at 1095 and 1640 cm
−1) are initially present on the catalyst surface at 40 °C (spectrum a). The increase of the temperature leads at first to the disappearance of the 1095 and 1640 cm
−1 bands, in line with the desorption of NH
3 (spectrum b). At further temperature increase, nitrates are reduced and at 400 °C (spectrum i) the surface is free from nitrates.
In the case of the Pt-catalyst (
Figure 9B), the temperature threshold for ammonia consumption is observed near 150 °C,
i.e., at lower temperatures if compared to the Rh-containing sample, and leads to N
2 formation with a maximum near 220 °C. At 270 °C nitrogen evolution is completed and the NH
3 concentration reaches the inlet concentration value. Also in this case the reaction is fully selective towards nitrogen, and no N
2O formation was observed. Above 350 °C the Pt-catalyst shows a limited activity in the dissociation of NH
3, as pointed out by the small evolution of H
2 and of nitrogen. Concerning the surface phase (
Figure 10B), ionic nitrates (bands at 1415, 1348, and 1035 cm
−1), bidentate nitrates (1555 cm
−1) and adsorbed ammonia (band at 1090 cm
−1) are initially present (40 °C, spectrum a). Upon increasing the temperature, initially bidentate nitrates are transformed into ionic nitrates (spectrum b) and then ionic nitrates decrease. Above 250 °C nitrates are completely removed (spectra j and k).
The results hence indicate that over both catalyst samples NH3 is an effective reductant for the stored nitrates, although it is less efficient than H2. The Pt-containing sample is more reactive than the Rh-based catalyst. Notably, no N2O is formed upon the reduction of the stored nitrates, the reaction being very selective towards N2. This apparently rules out the involvement of surface nitrates and/or nitrate containing compounds (e.g., ammonium nitrate) in the formation of N2O, at least under the investigated experimental conditions.
3. Pathways for N2O Formation
The results of the reactivity of gas-phase NO and adsorbed NOx species with H2 and NH3 clearly illustrated that N2O is formed only during the run with the presence of gas-phase NO. In fact no nitrous oxide formation has been observed both over the Pt- and Rh-BaO/Al2O3 catalysts upon the reduction of stored nitrates, where no gas-phase NO is fed to the catalyst samples.
Notably, N2O is formed even in the absence of reductants (i.e., from NO alone), provided that reduced PGM sites are present over the catalyst surface. Reduced Pt or Rh sites catalyze the NO dissociation reaction into N- and O-adatoms; N-species further interact with undissociated NO molecules (either in the gas-phase or from an adsorbed state) leading to the formation of N2O. This pathway is represented by reactions Equations (2) and (3) previously discussed.
In the absence of any reductant, the reaction is self-inhibited by the formation of oxidized PGM sites (i.e., O-adatoms), formed upon NO dissociation. In this respect, NO itself acts as a weak reductant, being able to scavenge O-adatoms and resulting in the formation of nitrite species adsorbed over the storage component (Ba). The overall stoichiometry of the process is then well described by following NO disproportion reaction Equation (1).
Hence also the storage element participates in the reaction, providing the adsorption sites for nitrites. It may also increase the reactivity of the PGM sites in the NO dissociative chemisorption, as suggested in the literature [
10,
12]. In fact, experiments carried out over a Ba-free sample showed a much lower N
2O formation if compared to the Ba-containing catalysts [
14].
Reduced Pt- and Rh-based catalysts show similar reactivity in the N
2O formation from NO, N
2O being formed at the same temperature, although in the case of the Rh-containing catalyst much lower amounts of N
2O were detected. This is likely related to the lower metal dispersion of the Rh-BaO/Al
2O
3 catalyst if compared to the Pt-containing sample (6.8%
vs. 48%, see
Table 1), and hence to the lower amounts of surface reduced sites.
When a reductant (H2 or NH3) is co-fed with NO, N2O always appears as the first NO reduction product, along with nitrogen. The onset temperature for NO reduction (and N2O evolution) depends on the nature of the reductant (with H2 showing a greater reactivity than NH3) and on the catalyst as well (Pt-based catalyst being more active than the corresponding Rh-containing sample). The pathways involved in N2O formation are those already depicted for NO alone: the reductant leads to the reduction of the PGM sites, leading to NO dissociation into N- and O-adatoms. However in this case O-adatoms are scavenged by the reductant, and nitrite formation is reduced with respect to the reaction of pure NO. When the reactivity of the reductant is not very high (i.e., near the onset temperature for NO reduction) the PGM sites are not fully reduced and hence there is the chance for N-adspecies to react with undissociated NO molecules, leading to N2O evolution. At variance, when the reductant maintains the PGM sites in a fully reduced state, NO is readily dissociated and the reduction products are N2 and NH3 (when H2 is used as reductant) or N2 (reductant NH3). It is concluded that the formation of N2O occurs only in the presence of undissociated NO molecules, i.e., when the PGM sites are not fully reduced. Accordingly, the temperature onset for N2O formation depends on the reactivity of the reductant: it is seen at lower temperature when H2 is used as a reductant instead of NH3, due to the higher reactivity of H2.
Notably, no N
2O formation was observed under our experimental conditions upon reduction with both H
2 and NH
3 of nitrates stored over both Pt- and Rh-BaO/Al
2O
3. Notably, the intermediacy of species like ammonium nitrate in N
2O formation is apparently ruled out since no N
2O was observed in the NH
3/nitrate reaction over both Pt- and Rh-based catalytic materials. It has been suggested that the reduction of the stored NO
x species is involved in the release of NO from the stored NO
x as first step, followed by the reduction of the released NO over the PGM sites [
16,
17,
18,
19]. The reduction process is initiated by the reduction of the PGM sites by the reductant, which precedes the NO release. The observation that no N
2O is formed in this case may be explained by considering that the rate determining step in the reduction of the stored NO
x is the NO release step [
16]; once NO is released, it is readily converted to the reduction products. Accordingly the gas-phase concentration of NO is small and this prevents N
2O formation. However under real operating conditions, where significant temperature effects may take place, significant release of NO may take place and accordingly N
2O formation is likely to occur.
4. Materials and Methods
Model Pt-BaO/Al
2O
3 (1/20/100
w/
w/
w) and Rh-BaO/Al
2O
3 (0.5/20/100
w/
w/
w) samples were prepared by incipient wetness impregnation of a commercial γ-alumina (Versal 250 UOP, Des Plaines, IL, USA) support with Pt(NO
2)
2(NH
3)
2 (Strem Chemicals, 5%
w/
w, Newburyport, MA, USA) and Rh(NO
3)
3 (Sigma Aldrich, 10%
w/
w, St. Louis, MO, USA) aqueous solutions, respectively, followed by impregnation with Ba(CH
3COO)
2 (Sigma Aldrich, 99%
w/
w) aqueous solution. After each impregnation step the samples were dried at 80 °C overnight and calcined at 500 °C for 5 h. The obtained catalysts were characterized by Brunauer-Emmett-Teller (BET) analysis for specific surface area and H
2 chemisorption for metal dispersion and results are reported in
Table 1.
The reactivity of NO alone and with different reductants (H2, NH3) was investigated via temperature programmed reaction (TPR) experiments. In the case of NO alone, the catalysts were heated in the temperature range 40–400 °C (heating rate 10 °C/min) under a flow of NO (1000 ppm in He, NO-TPR). Before performing the experiments, the catalysts were reduced with H2 (2000 ppm in He) at 350 °C for 30 min and cooled to 40 °C in He. Such experiments were carried out in a flow micro-reactor apparatus consisting of an home made quartz tube reactor (7 mm I.D.) connected to a mass spectrometer (Omnistar 200, Pfeiffer Vacuum, Asslar, Germany), a micro-gas chromatograph (Agilent 3000A, Santa Clara, CA, USA) and a ultraviolet (UV) analyzer (Limas 11HW, ABB, Zurich, Switzerland) for the on-line analysis of the outlet gases (rig #1). An amount of 60 mg of catalyst was used with a flow rate of 100 cc/min (at 0 °C and 1 atm).
Information on the surface species formed during the experiments was collected in this case by performing the NO-TPR experiments under the same experimental conditions inside an IR reactor cell (ISRI Infrared Reactor, Granger, IN, USA) by using the catalysts in form of self-supported wafers (15 mg, diameter = 13 mm, thickness = 0.1 mm) (rig #2). The IR measurements were collected with a FT-IR Vertex 70 (Bruker, Billerica, MA, USA) spectrometer with 4 cm−1 spectral resolution and accumulation of 64 scans using a mercury-cadmium-telluride (MCT) detector.
The reactivity of NO with H2 and NH3 (NO/H2-TPR and NO/NH3-TPR, respectively) was investigated by heating the catalyst samples in a flow of NO (1000 ppm) with H2 (2000 ppm) or NH3 (1000 ppm) in Ar in the temperature range 40–400 °C (heating rate 4 °C/min). These experiments were carried out in an operando FT-IR spectroscopy setup (rig #3) consisting in a “Sandwich” IR cell containing the catalyst (15 mg) in the form of a self-supported wafer; the gases leaving the cell were analyzed by a mass spectrometer (ThermoStar TM GSD 301, Pfeiffer Vacuum) and a chemiluminescence analyzer (42i-HL MEGATEC, Thermo Fisher Scientific, Waltham, MA, USA). Total flow was 25 cm3min·1 (at 1 atm and 0 °C). Surface FT-IR spectra were collected with a FT-IR Nicolet Nexus spectrometer (Thermo Fisher Scientific) with 4 cm−1 spectral resolution and accumulation of 64 scans using a deuterated-triglycine sulfate (DTGS) detector.
The same apparatus was used to perform temperature programmed surface reaction (H
2- and NH
3-TPSR) experiments. In this case the catalysts were at first saturated with NO
x species at 350 °C by feeding NO (1000 ppm) in O
2 (3%
v/
v) + Ar. This resulted in the formation of surface nitrate species. Then the catalyst was cooled under He at 40 °C and subsequently heated in flowing H
2 (2000 ppm in Ar, H
2-TPSR) or NH
3 (1000 ppm in Ar, NH
3-TPSR) up to 400 °C (heating rate 4 °C/min). Notably, due to the low reductant concentration, experiments were carried out under nearly isothermal conditions,
i.e., in the absence of significant temperature effects during the experiments. Further details concerning apparatuses and procedures can be found in [
10,
15].
Since the fresh catalyst samples were covered by carbonate species, before the experiments few adsorption-reduction cycles under isothermal conditions at 350 °C, (
i.e., NO/O
2 (1000 ppm NO + O
2 3%,
v/
v) and H
2 (2000 ppm)) were performed. This procedure partially replaces the originally present BaCO
3 species with BaO/Ba(OH)
2 species [
20].
5. Conclusions
In this paper, mechanistic aspects involved in the formation of N2O over Pt-BaO/Al2O3 and Rh-BaO/Al2O3 model NSR catalysts were investigated. In particular, the reactivity of both gas-phase NO and stored nitrates were investigated by using H2 and NH3 as reductants. Transient experiments with simultaneous gas phase and surface analysis using FT-IR spectroscopy were used to correlate the concentration of the gas-phase species with adsorbed surface species.
The data herein obtained provides clear indication of the fact that over both Rh- and Pt-BaO/Al2O3 catalysts, N2O formation involves the presence of gas-phase NO. In fact under our experimental conditions no nitrous oxide formation was observed upon the reduction of the stored nitrate species. The data show that N2O formation involves the coupling of undissociated NO molecules with N-adspecies formed upon NO dissociation onto reduced PGM sites. The reductant keeps the PGM sites in a reduced state by scavenging O-adatoms formed upon NO dissociation, the initial step of the process. However when complete dissociation of gas-phase NO occurs, N2O formation is prevented. In fact N2O formation is observed at temperatures where the reductants start to be active in the reduction of the PGM sites, whereas at higher temperatures, where the reductants effectively keep the PGM sites in a fully reduced state, complete dissociation of NO takes place and N2O formation is not effective. This explains why N2O formation is observed at low temperatures and then disappears at high temperatures.
Over both Rh- and Pt-BaO/Al2O3 catalysts N2O formation is observed at lower temperatures with H2 than with NH3, in view of the higher reactivity of hydrogen in the reduction of the PGM sites. Also, N2O formation occurs at lower temperatures onto Pt-containing catalyst if compared to the Rh-based sample, due to the higher reducibility of Pt vs. Rh.
In the absence of reducing agents, N2O can be formed from NO provided that reduced PGM sites are present. In such a case O-adatoms formed upon NO decomposition are scavenged by NO itself leading to the formation of nitrite species so that the formation of N2O occurs according to the stoichiometry of the NO disproportionation reaction Equation (1).
Finally, the fact that N2O formation was not observed upon the reduction of stored nitrates with both H2 and NH3 is due to the slow rate of the NO release process from the stored species. This limits the NO gas-phase concentration during the reduction of the stored species thus preventing N2O formation.


 ,
, 


