
Catalysts Promoted with Niobium Oxide for Air Pollution Abatement


1
Earth and Environmental Engineering Department, Columbia University, New York, NY 10027, USA
2
Chemical Engineering Department, Columbia University, New York, NY 10027, USA
3
Chemical Engineering for Energy and the Environment Department, KTH Royal Institute of Technology, 10044 Stockholm, Sweden
*
Author to whom correspondence should be addressed.
Catalysts 2017, 7(5), 144; https://doi.org/10.3390/catal7050144
Submission received: 31 March 2017
/
Revised: 1 May 2017
/
Accepted: 4 May 2017
/
Published: 8 May 2017
(This article belongs to the Special Issue Commemorative Issue in Honor of Professor Emeritus Calvin H. Bartholomew in Anticipation of His 75th Birthday)
Abstract
:Pt-containing catalysts are currently used commercially to catalyze the conversion of carbon monoxide (CO) and hydrocarbon (HC) pollutants from stationary chemical and petroleum plants. It is well known that Pt-containing catalysts are expensive and have limited availability. The goal of this research is to find alternative and less expensive catalysts to replace Pt for these applications. This study found that niobium oxide (Nb2O5), as a carrier or support for certain transition metal oxides, promotes oxidation activity while maintaining stability, making them candidates as alternatives to Pt. The present work reports that the orthorhombic structure of niobium oxide (formed at 800 °C in air) promotes Co3O4 toward the oxidation of both CO and propane, which are common pollutants in volatile organic compound (VOC) applications. This was a surprising result since this structure of Nb2O5 has a very low surface area (about 2 m2/g) relative to the more traditional Al2O3 support, with a surface area of 150 m2/g. The results reported demonstrate that 1% Co3O4/Nb2O5 has comparable fresh and aged catalytic activity to 1% Pt/γ-Al2O3 and 1% Pt/Nb2O5. Furthermore, 6% Co3O4/Nb2O5 outperforms 1% Pt/Al2O3 in both catalytic activity and thermal stability. These results suggest a strong interaction between niobium oxide and the active component—cobalt oxide—likely by inducing an oxygen defect structure with oxygen vacancies leading to enhanced activity toward the oxidation of CO and propane.
1. Introduction
Carbon monoxide (CO) is produced by incomplete combustion of carbon-containing fuels. When this deadly toxic gas combines with hemoglobin in blood, oxygen (O2) cannot be delivered to vital organs essential for life. Propane (C3H8) is produced during the process of combusting liquefied petroleum gas, but can also be considered a model of volatile organic compounds (VOCs). An active low-temperature oxidation catalyst has attracted immense attention to meet ever-changing stringent environmental regulations for oxidation of volatile organic compounds in chemical plants, petroleum refineries, pharmaceutical plants, automobile manufacturing, etc. [1,2].
Volatile organic compounds are toxic and mainly contribute to the formation of photochemical smog with a with a negative impact on air quality [3]. Catalytic oxidation is a main technology used commercially in their reduction [4,5]. The basic catalytic oxidation reactions of CO (1) and hydrocarbon (CxHy) (2) are shown as follows [2]:
Many environmental abatement catalysts are precious metals, such as Pt and Pd, due to their excellent performance and superior life in abating real exhausts. However, their high price is a disadvantage, and therefore alternative materials are always being sought. However, this is very challenging. For low temperature applications, such as VOCs removal in indoor air, transition metal oxides have been proposed as replacements for precious metals [6]. Among transition metal oxides, cobalt oxide (Co3O4) shows very high CO oxidation activity in CO/O2 mixtures even at ambient temperature [7]. Co3O4 is also highly effective for the total oxidation of propane under conditions relevant for VOC emission control [8]. Moreover, the evasive “holy grail” for catalytic applications is a precious metal–free catalyst for three-way automobile gasoline exhaust catalysts [9].
It is an essential to disperse the catalytic components on a carrier with a high surface area, such as Al2O3, TiO2, SiO2, ZrO2, or SiO2-Al2O3, in order to maximize active sites available for reactants. Furthermore, supported catalysts are deposited (as washcoats) on high cell density monoliths (ceramic and metal) to minimize pressure drop and volume relative to packed beds [2]. Niobium pentoxide (Nb2O5) has been reported to show strong metal support interaction (SMSI) with certain metals [1,10,11]. However, no commercial VOC applications that include Nb2O5 are known.
The goal of this study was to investigate Nb2O5’s promoting effects on base metal catalysts for CO and propane oxidation. Nb2O5 has the ability to form defect structures with oxygen vacancies when combined with base metal oxide materials to enhance catalytic activity [12,13]. The active oxidation state for cobalt is +3 in Co3O4 and has been reported to be a prime candidate for precious metal replacement in VOC applications due to its high catalytic activity [14,15]. Retaining Co in the active +3 state will enhance its thermal stability. The current study was designed to further explore the performance of Co supported on Nb2O5 and to investigate whether other transition metal oxides combined with Nb2O5 could also have a beneficial effect for VOC applications. This feasibility study compared the oxidation performance of Co3O4/Nb2O5 with traditional Co3O4/Al2O3. Furthermore, the study expanded to evaluate other base metal oxides such as iron oxide (Fe2O3), copper oxide (CuO), and nickel oxide (NiO), all of which were deposited on Nb2O5 relative to Al2O3 with the aim to broaden the understanding of the promoting effects of Nb2O5 in VOC applications. Finally, the catalytic performance of Co3O4/Nb2O5 was compared to that of Pt/γ-Al2O3.
The catalytic protocols used in establishing performance characteristics were fresh and aging activity tests. Thermal gravimetric analysis (TGA) was used to establish minimum time and temperature necessary for complete decomposition of precursor to the respective oxides.
2. Result and Discussion
2.1. TGA Results for Precursor of Cobalt (Co)
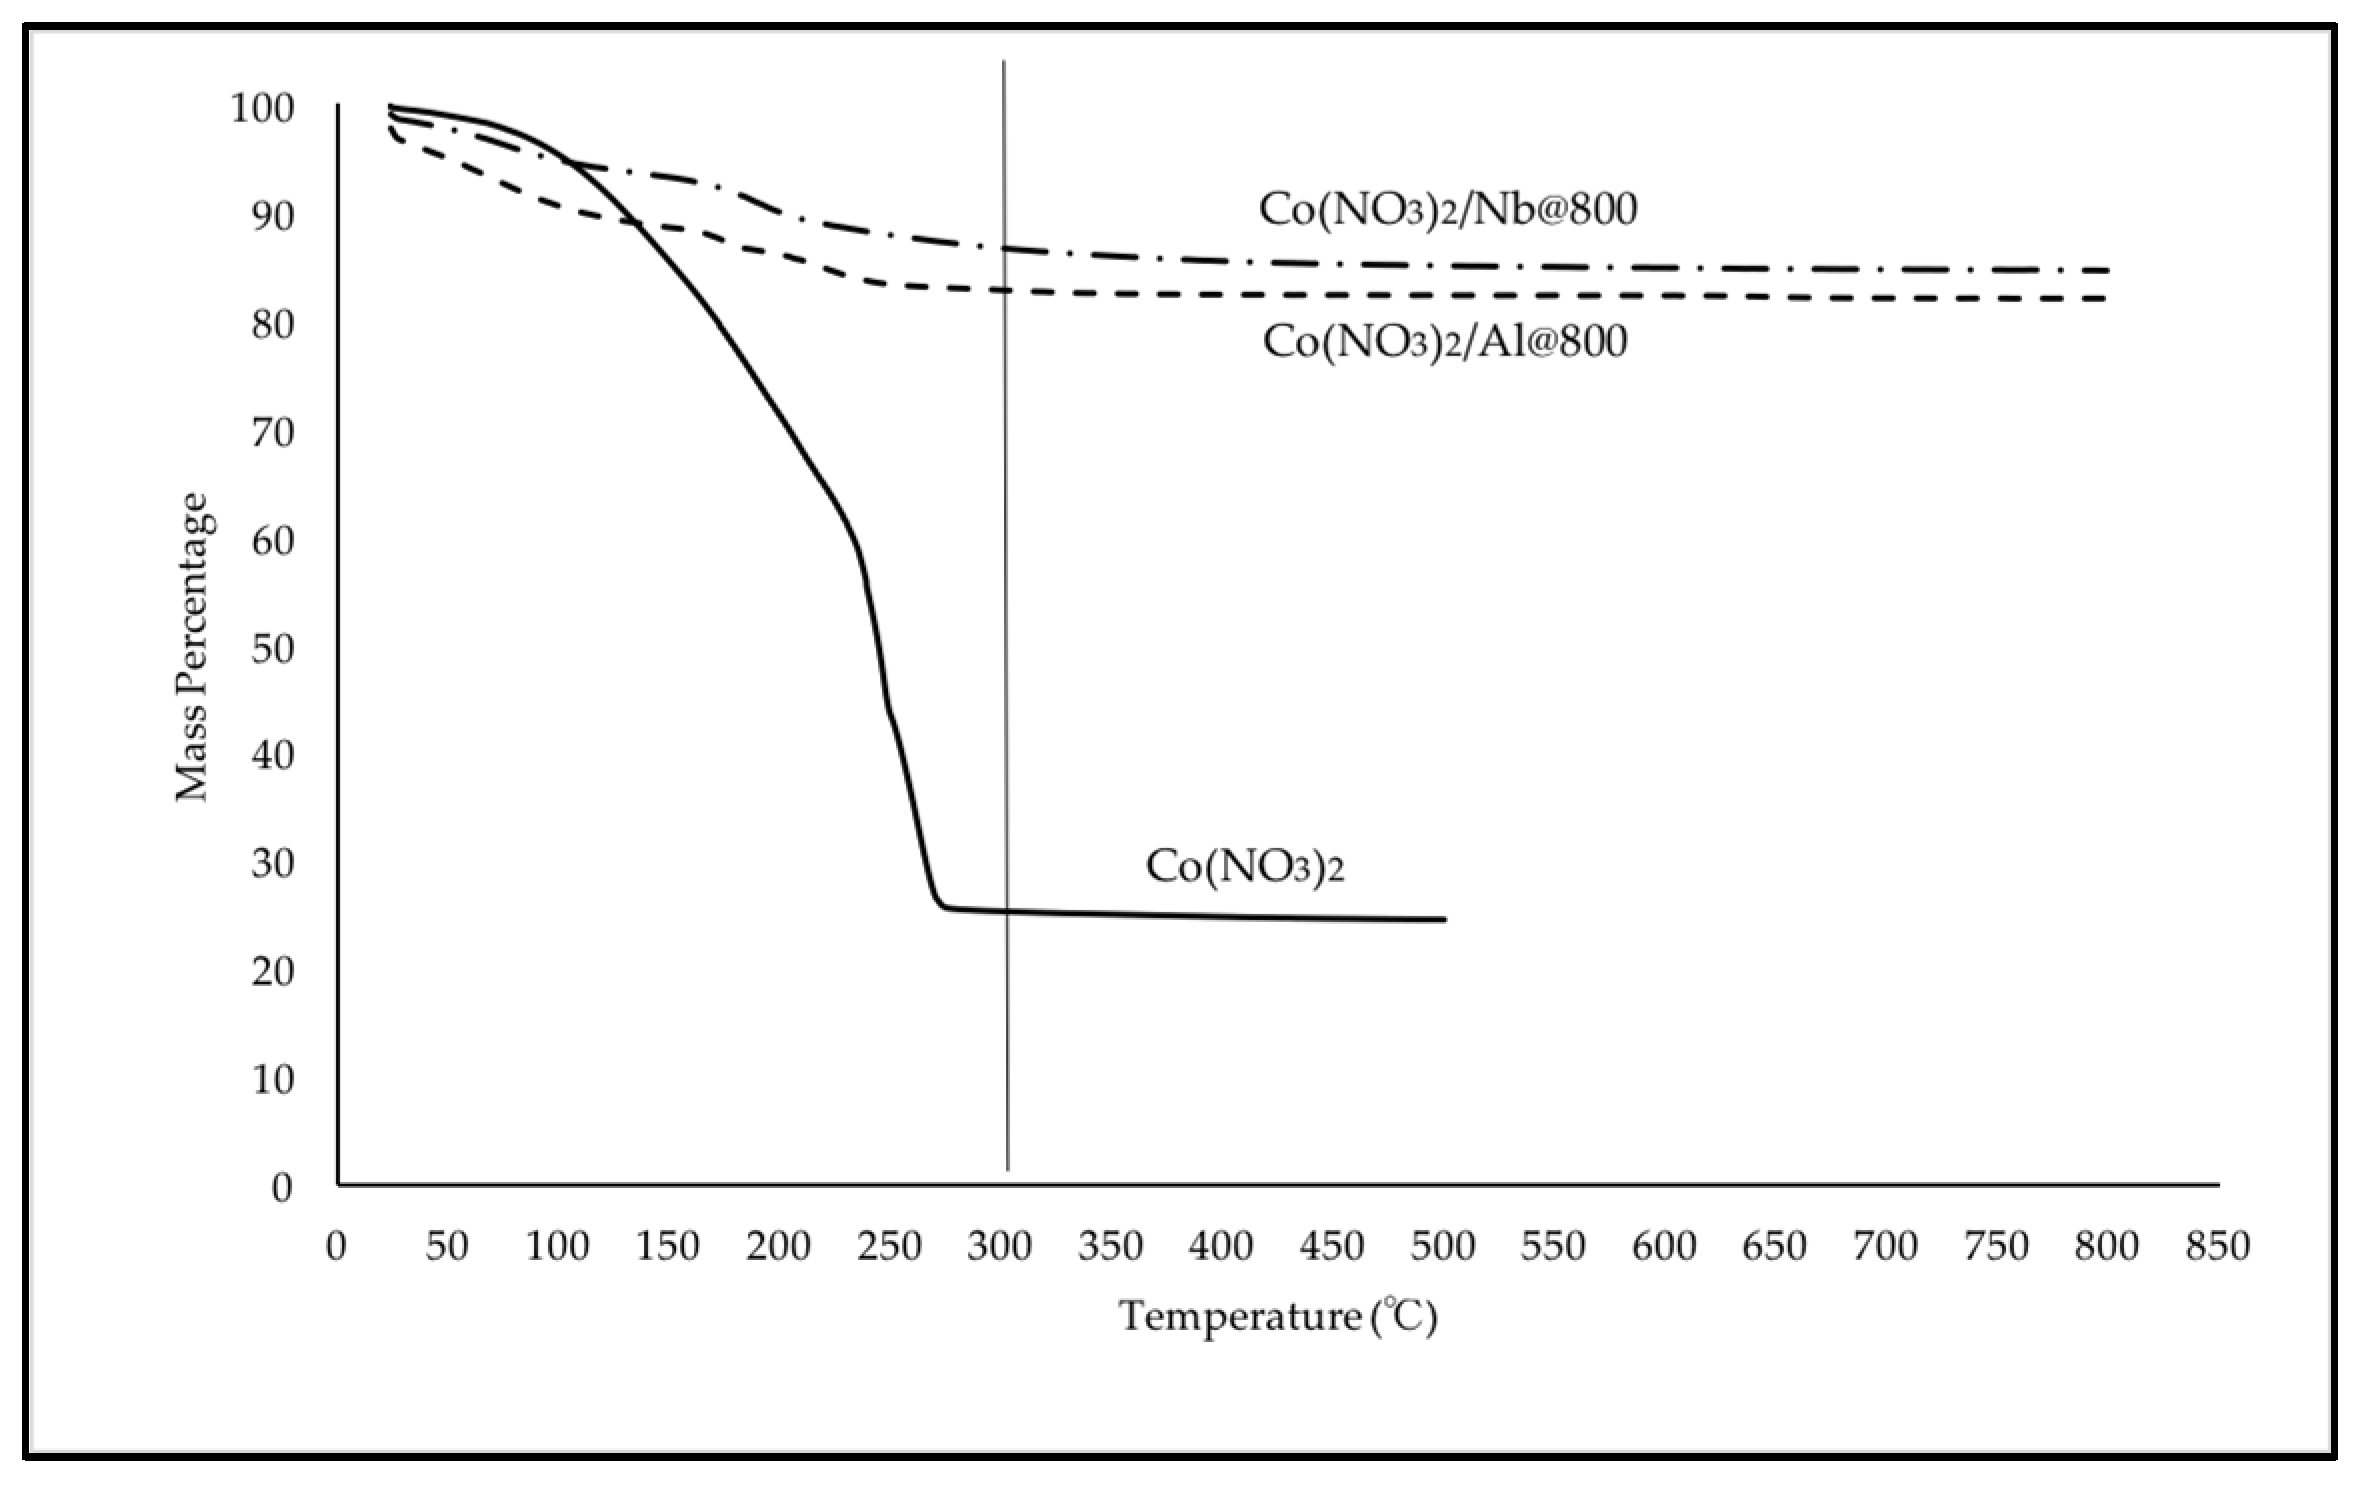
Thermal gravimetric analysis (TGA) measures the weight change of a material upon heating in various gaseous environments. Figure 1 shows the TGA results of three samples: the precursor Co(NO3)2·6H2O, the impregnated precursor on carriers, 6% Co(NO3)2/Nb@800 (the term Nb@800 = pre calcination temperature of Nb2O5 at 800 °C in air for 2 h), 6% Co(NO3)2/Al@800 (pre calcination of Al2O3 in air for 2 h). The precursor Co(NO3)2·6H2O decomposes completely to Co3O4 at about 300 °C where no additional weight loss occurs [16] upon continued heating as shown in Figure 1. The impregnated catalysts also achieve constant weight at 300 °C. Thus, all impregnated catalysts were calcined at 300 °C. The cobalt oxide content was 6% by weight on supported carriers.
2.2. Preparative Details of Co/Nb and Co/Al
2.2.1. Pre-Calcination Temperature of Carriers Nb2O5 and Al2O3
Nb2O5 has different crystal phases at different temperature [17]. The pre-calcination temperature affects the crystal phase of Nb2O5, which in turn affects the chemical and physical properties of Nb2O5. The structure of Al2O3 is similarly affected. The monohydrate and tri-hydrate alumina structures change as a function of the temperature (°C) in air [18]. The impact of pre-calcination temperature on carriers and final catalysts were therefore explored.
All carriers were pre-calcined at specified temperatures for 2 h in air. After pre-calcination of the carriers, Co(NO3)2·6H2O was deposited on each carrier and calcined at 300 °C in air for 2 h to give 6% Co@300/Nb and 6% Co@300/Al. This nomenclature indicates 6% cobalt oxide calcined at 300 °C after deposited on Nb2O5 or Al2O3.
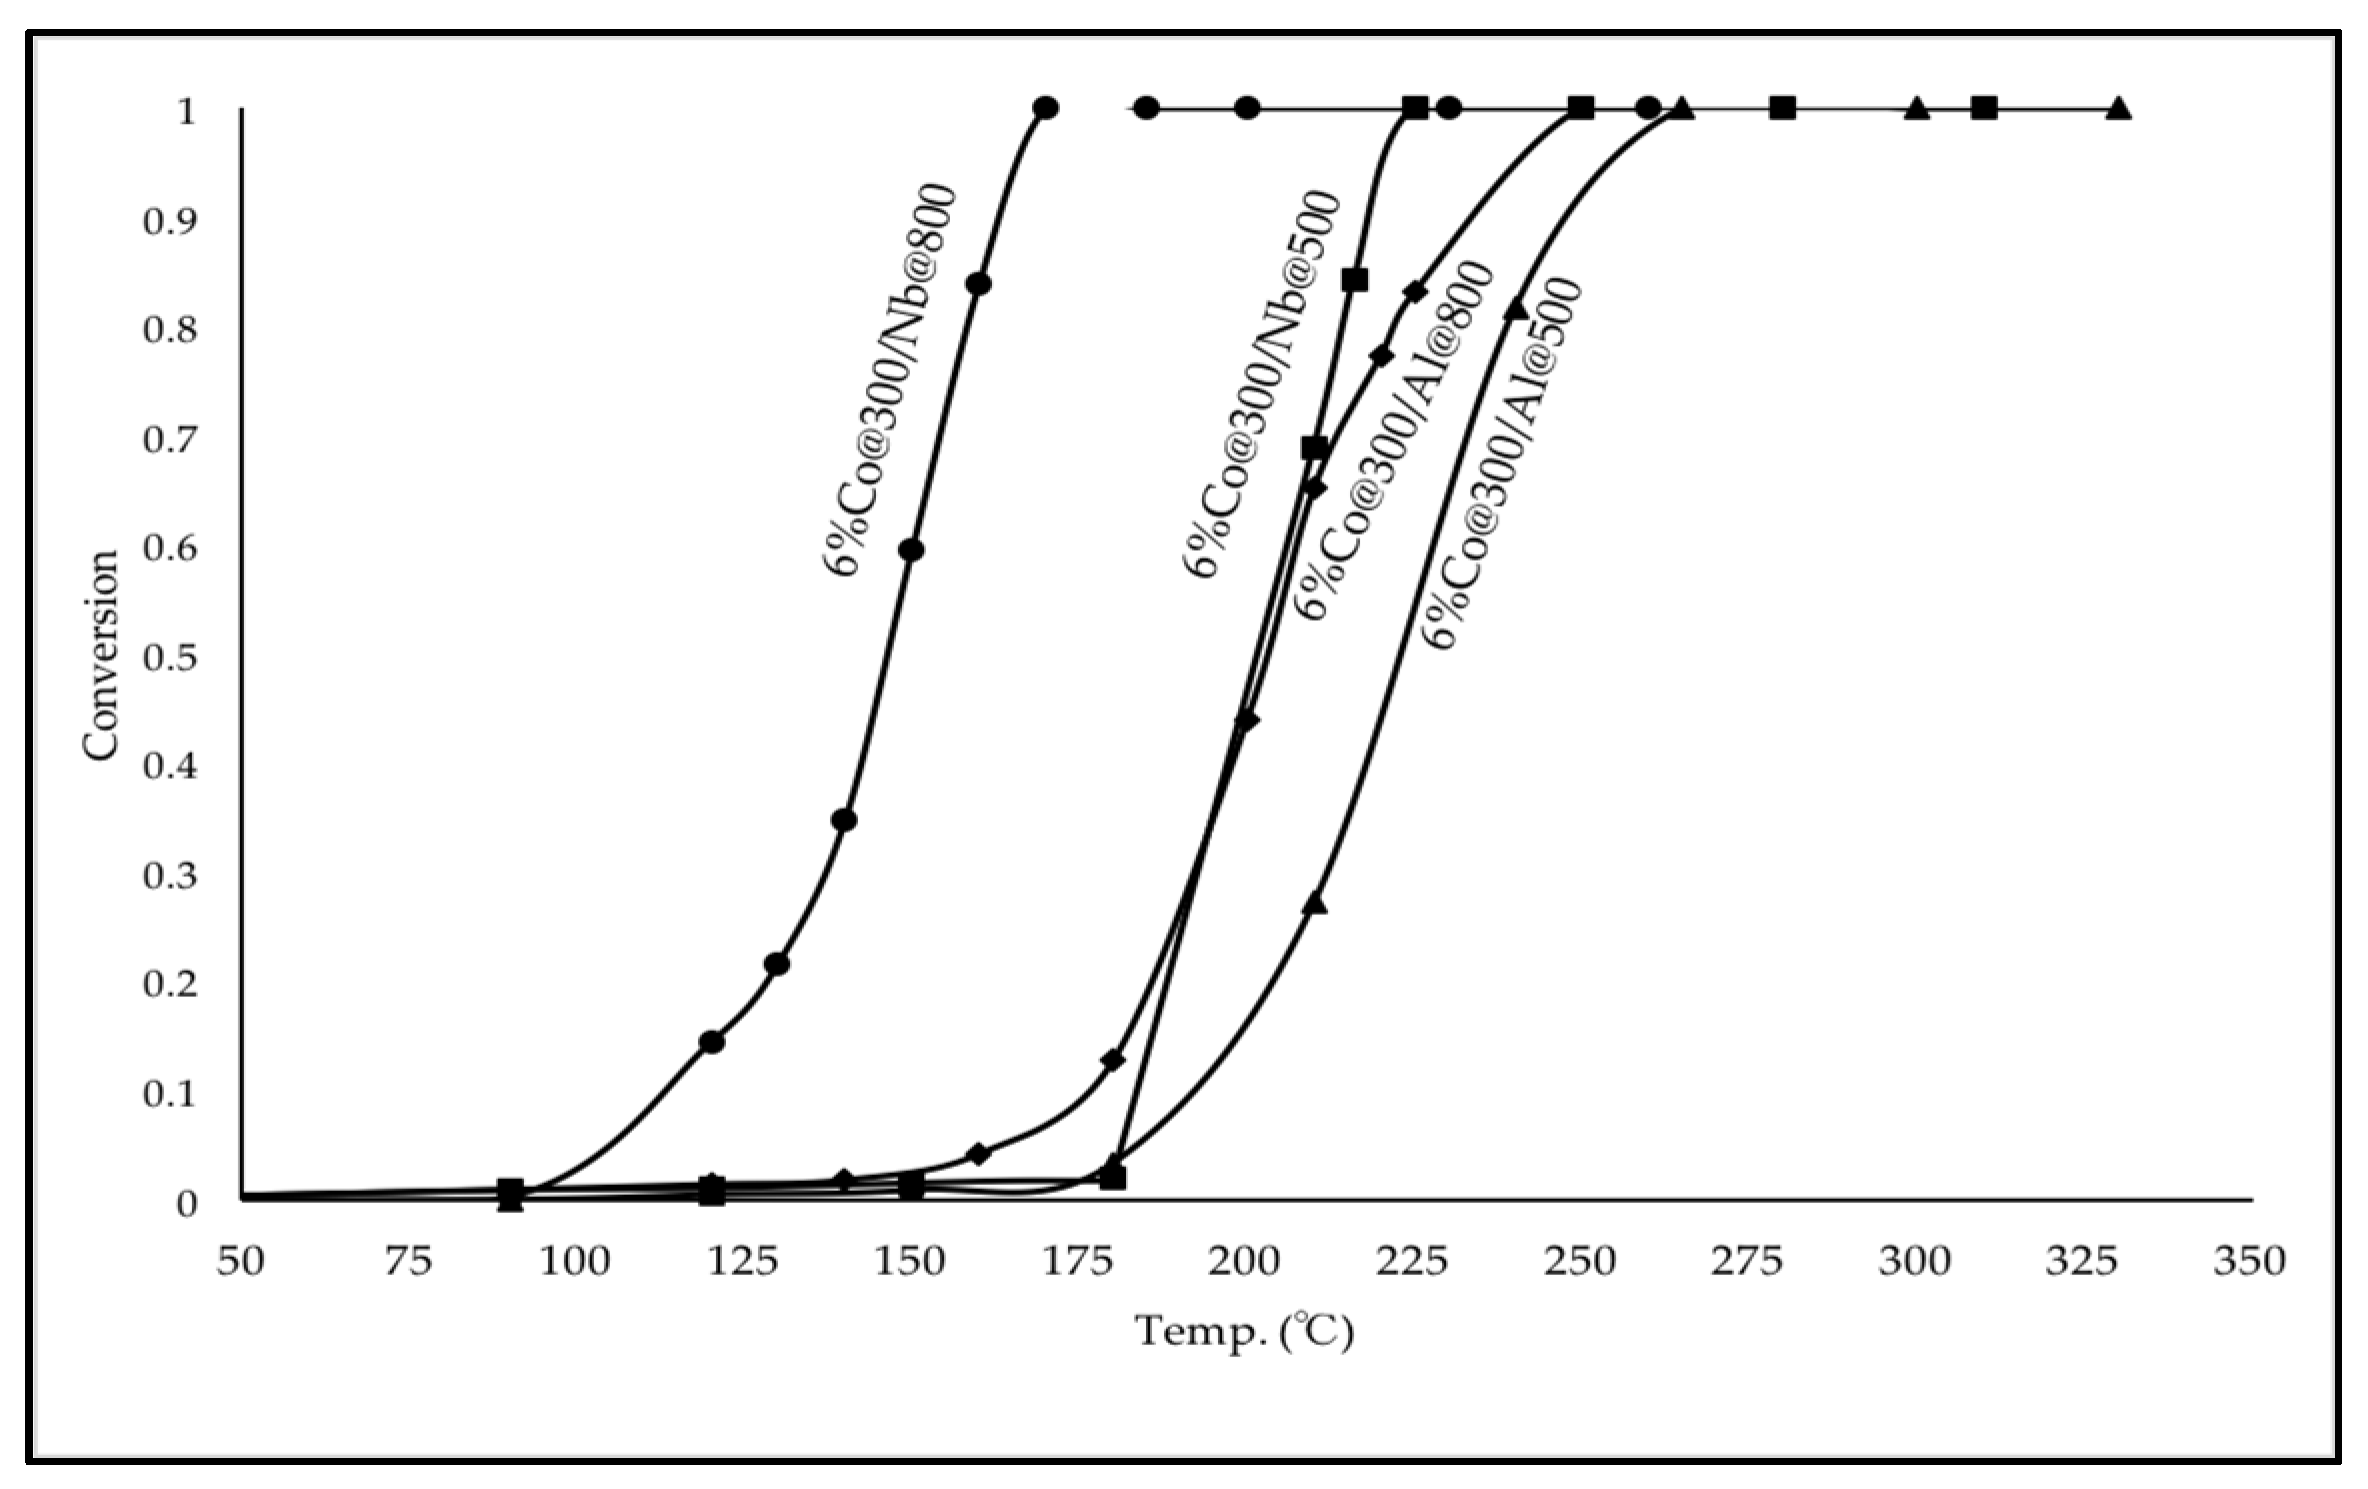
Table 1 demonstrates catalytic performances of fresh catalysts of 6% Co/Nb with different pre-calcination temperatures of Nb2O5. In Table 1, all carriers were Nb2O5 pre-calcined from 500 °C to 900 °C. T20, T50 and T90 values (temperature for 20%, 50% and 90% conversion) are compared. T20 and T50 are indicative of chemical kinetic control, while T90 often reflects some pore diffusion control. It is clear that Co on Nb@700 and Nb@800 show better catalytic performance of CO oxidation with the Nb@800 showing the best performance.
Table 2 provides catalytic results of fresh 6% Co/Al with different pre-calcination temperatures of Al2O3. The T20, T50 and T90 indicate that Al@800, pre-calcined at 800 °C, yielded the best results.
One can conclude that the optimal pre-calcination temperature for both Nb2O5 and Al2O3 was 800 °C. Therefore, both Nb2O5 and Al2O3 were pre-calcined at 800 °C for all experiments conducted henceforth.
Further, Figure 2 compares the activity of cobalt catalysts as a function of the pre-calcination temperature of the two carriers. Clearly, 6% Co@300/Nb@800 yielded the best performance of all for CO oxidation.
To further quantify the advantages offered by fresh 6% Co@300/Nb@800 relative to fresh 6% Co@300/Al@800 turn over frequencies (TOF) are presented in Table 3 for different temperatures.
2.2.2. Catalytic Performance of Fresh and Aged Co Catalysts for CO Oxidation
Based on the data in Table 1, Table 2 and Table 3, the pre-calcination temperature of carriers was set at 800 °C with the precursor decomposition at 300 °C for 2 h in air.
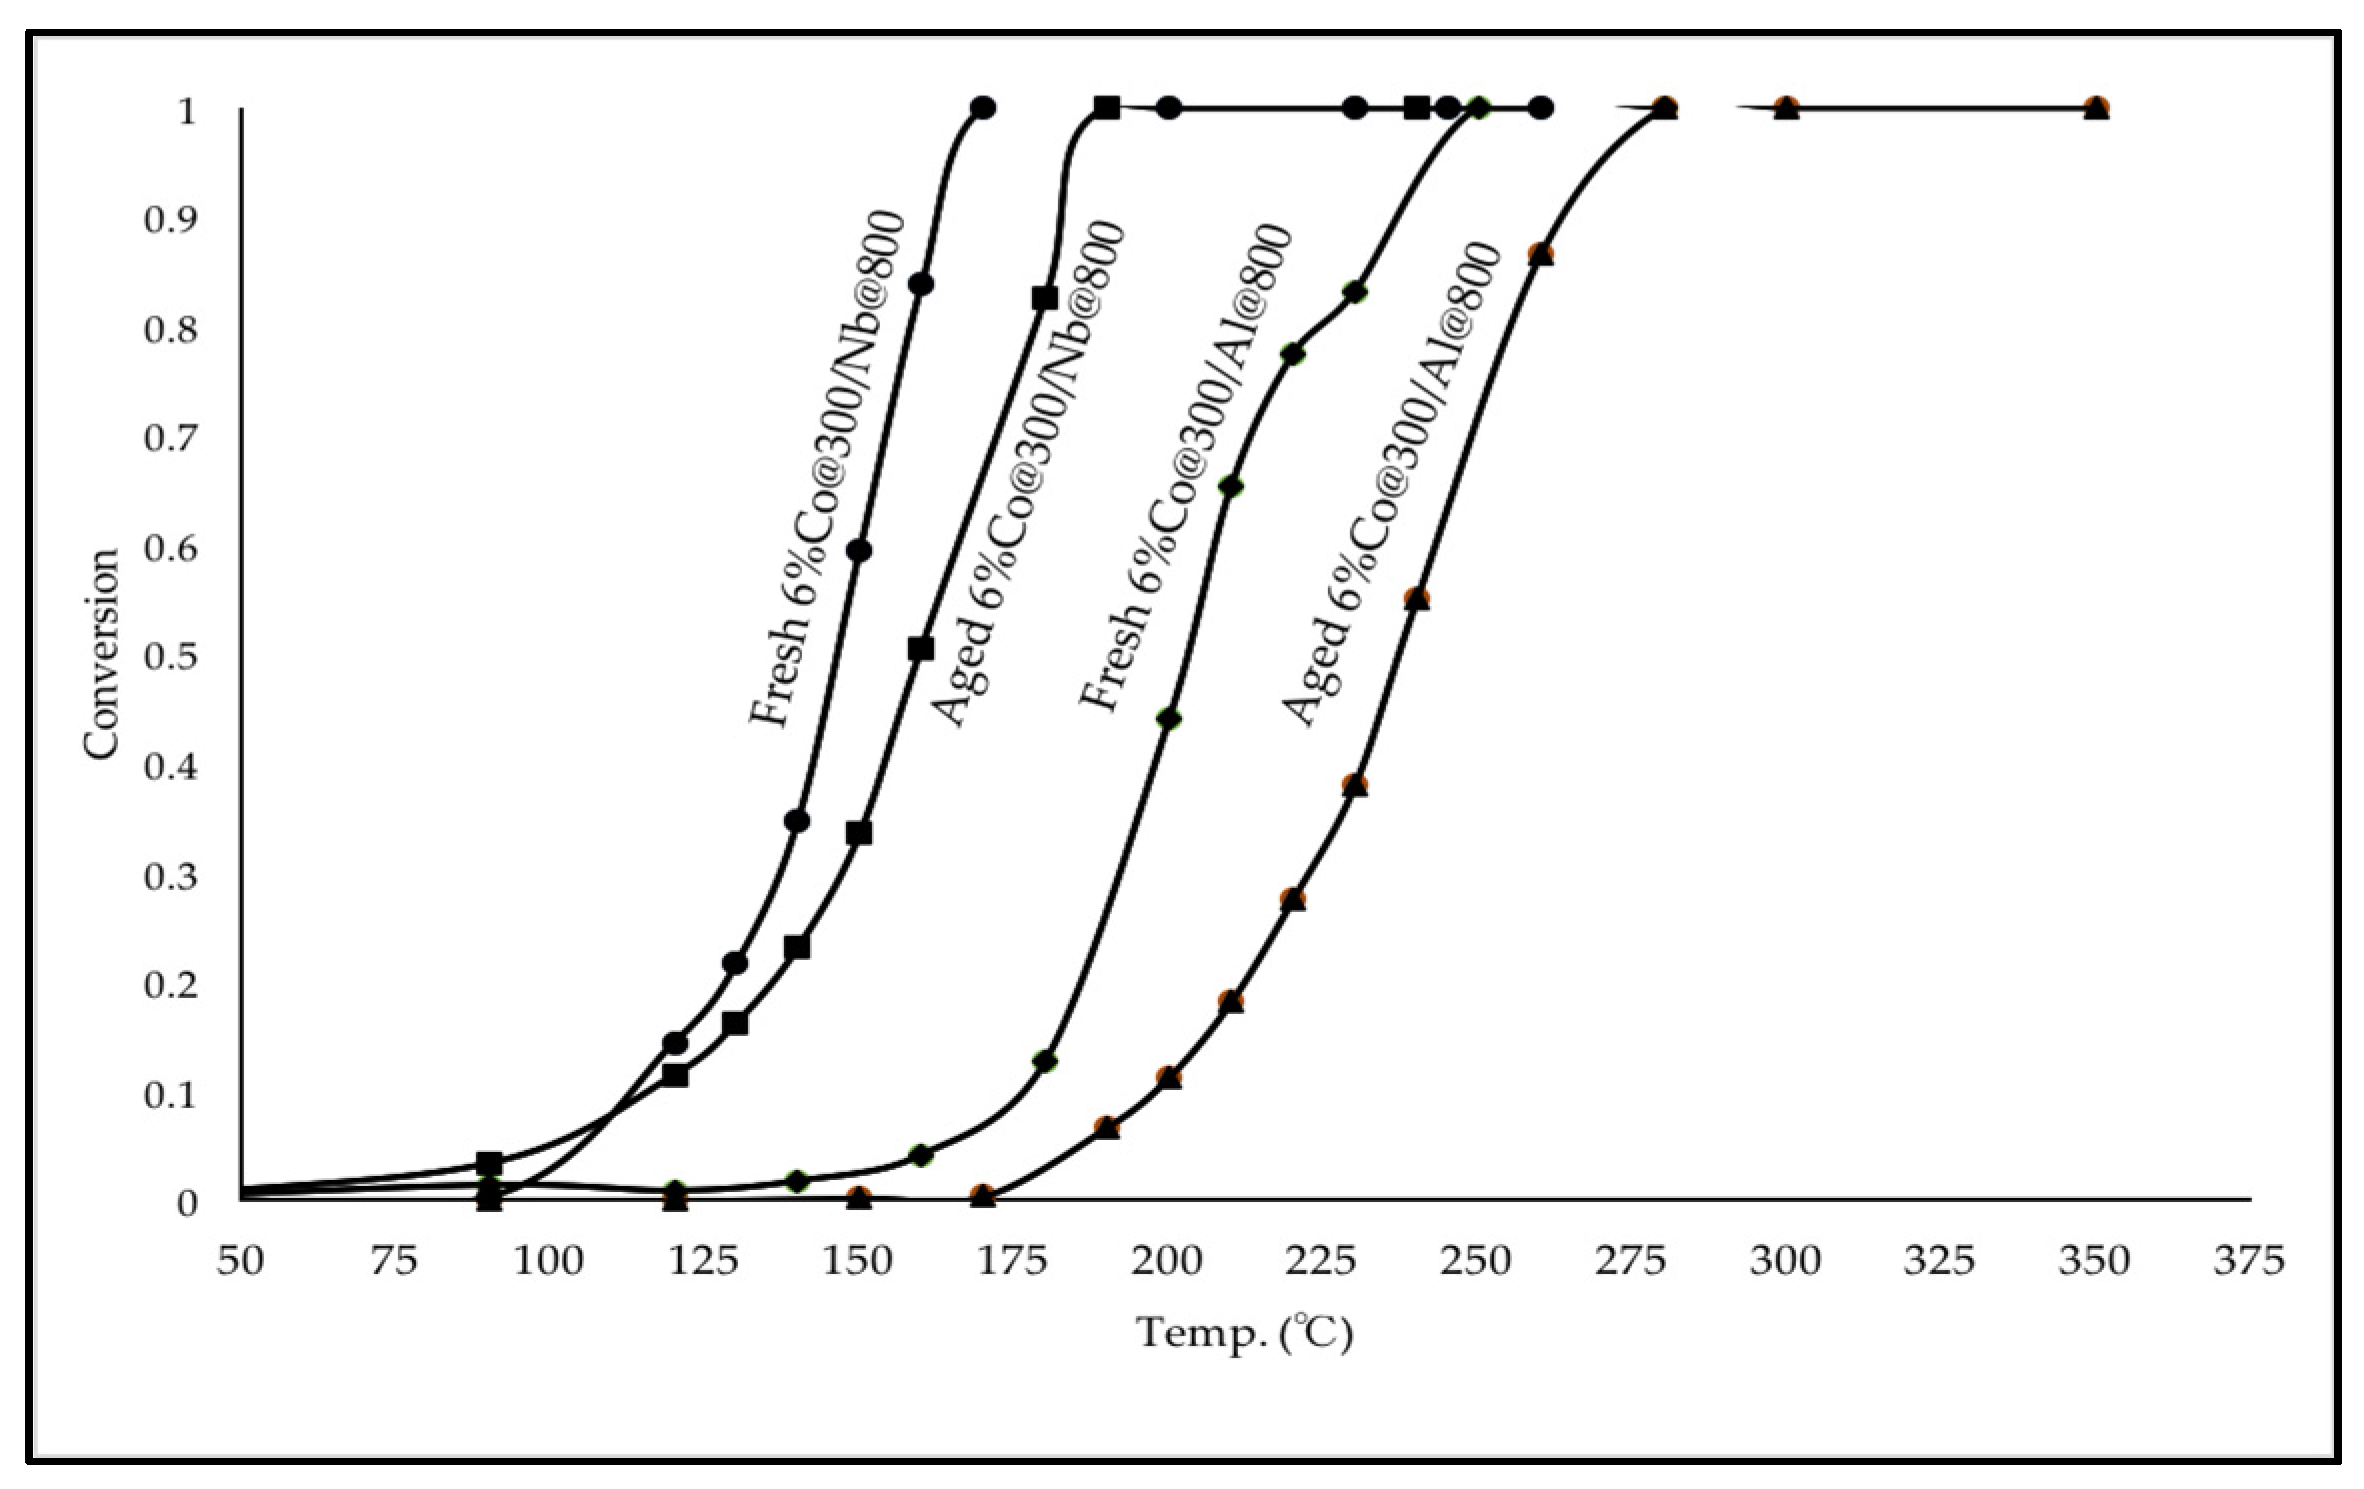
Figure 3 shows that fresh 6% Co@300/Nb@800 outperforms fresh 6% Co@300/Al@800 for CO oxidation over the entire conversion-temperature profile including the kinetic control regime up to fractional conversion approaching of 1.0 (100% conversion). Catalytic performance of each catalysts aged at 400 °C for 12 h in reaction gases is also shown in this figure. This temperature is approximately the maximum experienced in abating VOC from some stationary chemical plants. Clearly, 6% Co@300/Nb@800 outperformed its counterpart however, both catalysts suffered some deactivation after aging. Six percent Co@300/Nb@800 seemed to experience some reaction rate limited by pore diffusion (slightly lower slope at T50 region), while the chemical kinetic control region (T20) was not affected. For 6% Co@300/Al@800 both kinetic control (T20 region) and pore diffusion control (T50 region) were negatively affected as evidenced by the large shift to higher temperature and the decrease in their respective slopes. One can speculate that the shift to higher temperature and a slightly lower slope reflects a loss of accessibility to the Co active sites due to its reaction rate limited by pore diffusion.
2.3. Various Loadings of Co3O4 Supported on Nb2O5
2.3.1. Catalysts with Various Co3O4 Loadings: Propane Oxidation
Various Co3O4 loadings were studied to optimize Co3O4 content. The oxidation of propane was used as the metric because it is more difficult to oxidize than CO. In Figure 4 (left), three fresh catalysts with cobalt contents, 1%, 3%, and 6% are compared. All three completed propane oxidation up to 400 °C. Not surprisingly 6% Co@300/Nb@800 shows the best catalytic performance. The sensitivity of performance to cobalt loading confirms that the activity is in the kinetic regime suitable for activity comparison.
In Figure 4 (right), all cobalt oxides on niobium oxide were aged at 400 °C for 12 h in reaction propane gas.
Detailed information of these Co@300/Nb@800 are provided in Table 4. It is clear that 6% Co@300/Nb@800 presents the lowest T20, T50, and T90 over the entire conversion profile.
2.3.2. Propane Oxidation with and without Moisture
Results for both fresh 6% Co@300/Nb@800 and 6% Co@300/Al@800, are presented in Figure 5. Once again, the superiority of fresh 6% Co@300/Nb@800 relative to the baseline 6% Co@300/Al@800 is demonstrated.
Moisture (from upstream combustion) is always present and typically has a poisoning or inhibiting effect on the performance of the catalyst. Tests were conducted with a feed containing 5% H2O (steam) for both 6% Co@300/Nb@800 and 6% Co@300/Al@800. In Figure 6, fresh and aged 6% Co@300/Nb@800 and 6% Co@300/Al@800 are compared for propane oxidation with 5% H2O present. 6% Co@300/Nb@800 retains much of its activity, and is far more resistant to deactivation than 6% Co@300/Al@800. However, moisture does inhibit 6% Co@300/Nb@800, but far less than for the 6% Co@300/Al@800.
This figure also demonstrates the obvious advantage of 6% Co@300/Nb@800 over 6% Co@300/Al@800 when both catalysts were aged for 12 h in feed gas containing H2O at 5 vol %. The aged 6% Co@300/Al@800 lost the majority of its active sites achieving only about 40% (0.4) conversion at 400 °C. Aged 6% Co@300/Nb@800 showed significant catalytic activity even after being aged in steam containing reaction gas at 400 °C for 12 h.
2.4. Comparison of Co3O4 and Pt for Propane Oxidation
The state of the art catalyst used in VOC abatement is typically 1% Pt/Al2O3. For the purpose of a practical application, the behavior of 1% Co@300/Nb@800 and 6% Co@300/Nb@800 was compared with 1% Pt/Nb@800 and 1% Pt/Al@800 for propane oxidation. The result shown in Figure 7 (left) indicates that 6% Co@300/Nb@800 shows a performance advantage over 1% Pt@500/Nb@800 and 1% Pt@500/Al@800. Some advantage for 1% Co@300/Nb@800 is noted at both low and higher conversions however, diffusional effects may be operative. 1% Pt@500/Nb@800 shows no advantage over 1% Pt@500/Al@800. Figure 7 (right) shows results of 1% Co@300/Nb@800, 6% Co@300/Nb@800 and 1% Pt@500/Nb@800 subjected to aging test at 400 °C for 12 h in air. The 6% cobalt system suffers slightly, relative to the Pt system, at light off but recovers its performance advantage as 100% conversion is approached. From these encouraging results, monolith-supported catalysts will be prepared in the future and comparison extended closer to an actual system.
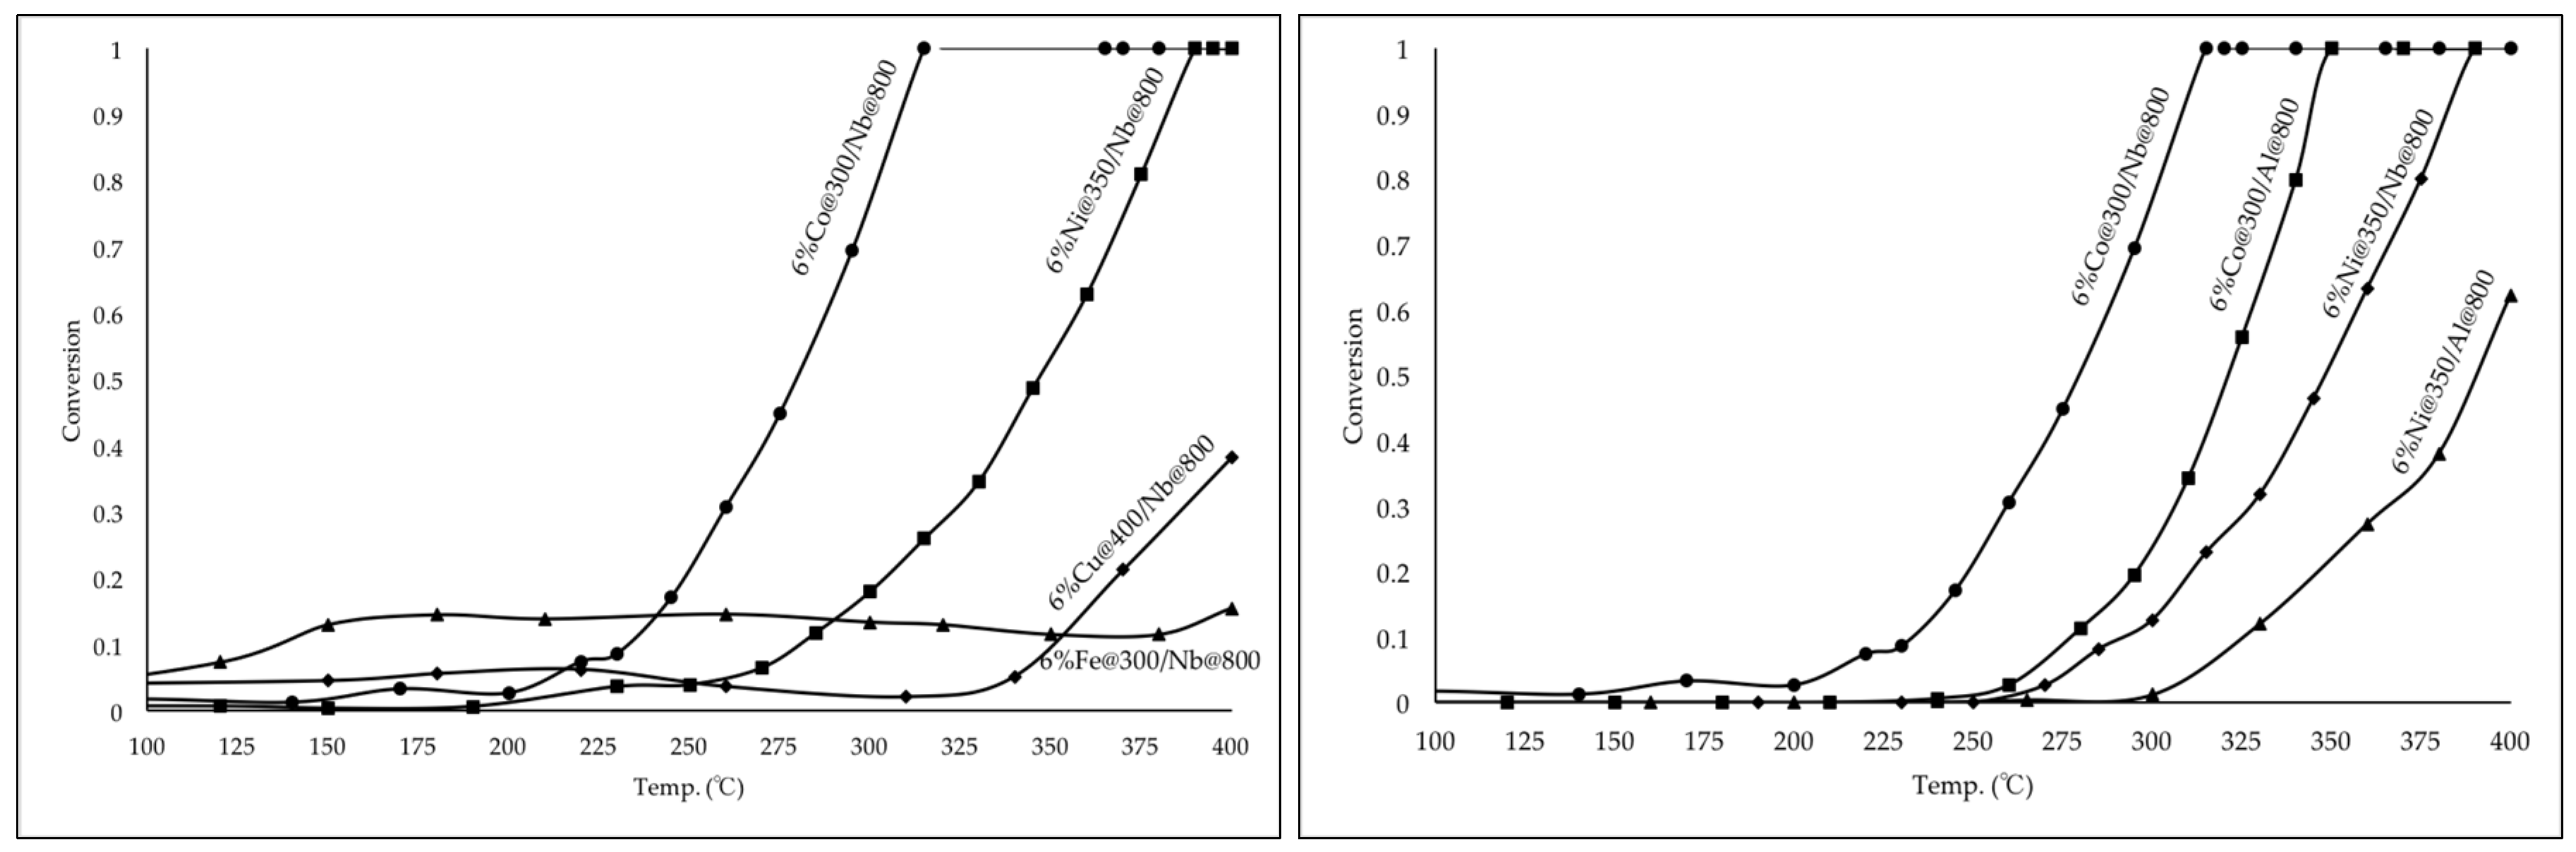
2.5. Other Base Metal Oxides for Propane Oxidation
Based on the encouraging results with 6% Co@300/Nb@800 for both CO and C3H8 the study was expanded to include nickel (Ni), copper (Cu) and iron (Fe) each deposited on Nb@800 and Al@800. A comparison is shown in Figure 8 (left) for propane oxidation. All four base metal oxides were prepared with a loading of 6% on Nb@800. It is clear that Co3O4 on Nb2O5 has lowest light-off and full oxidation performance. Aging for 12 h at 400 °C in reacting gases also showed the superiority of the cobalt system. Figure 8 (right) shows results that Nb2O5 has a much greater promoting effects on Co3O4 than on NiO.
2.6. Cobalt Oxide Catalyst Characterization
BET Tests for Catalysts and Carriers
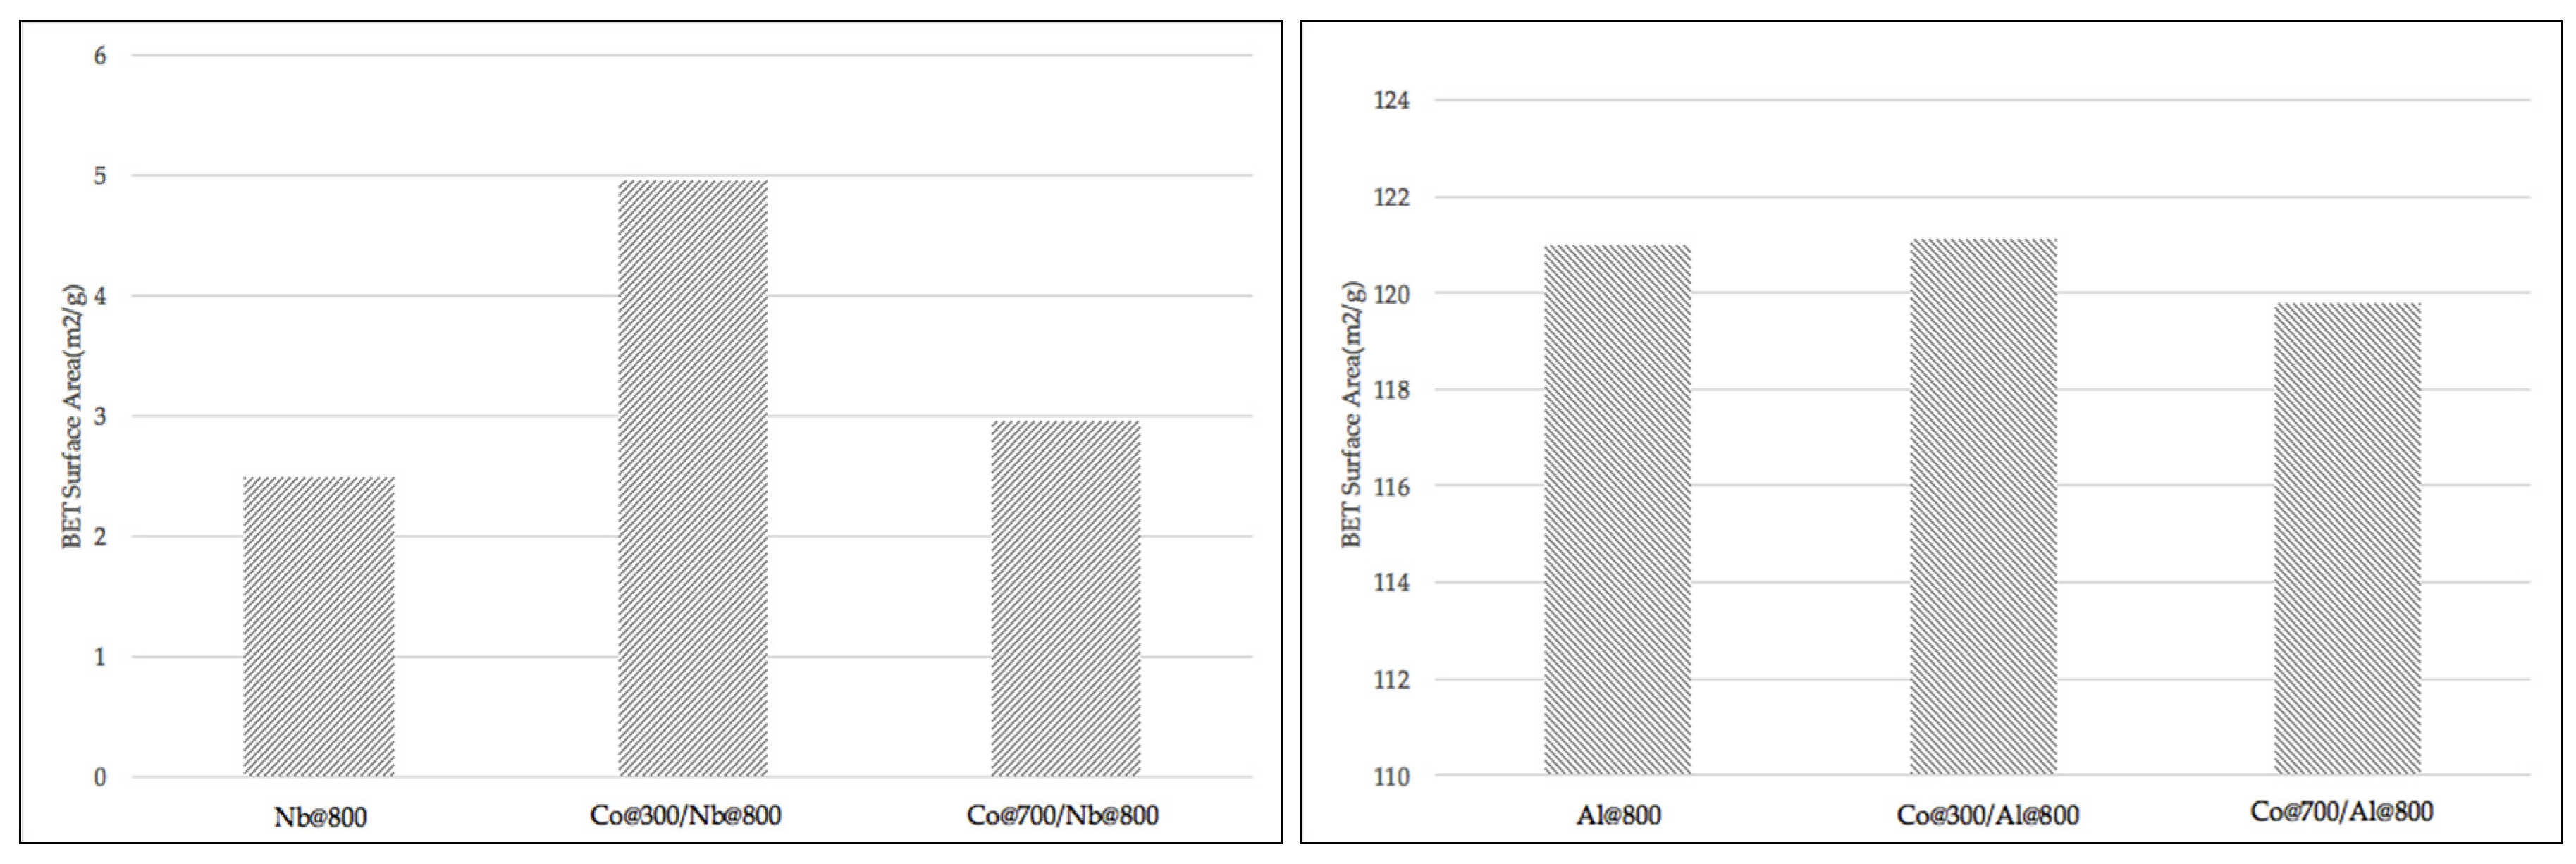
Surface area of the carrier is among the most fundamentally important properties in catalysis because the active sites are present or dispersed throughout the internal surface through which reactants and products are transported [2]. Quantachrome ChemBET Pulsar TPR/TPD is used to measure surface area of Al2O3 and Nb2O5.
A 50 mg sample is used for Al2O3 and 6% Co3O4/Al2O3; 200 mg sample is used for Nb2O5 and 6% Co3O4/Nb2O5. Figure 9 shows that Nb2O5 pre-calcined at 500 °C has a surface area of 53 m2/g. When pre-calcined at 700 °C, Nb2O5 has a surface area decrease to 5 m2/g, while at 800 °C it, decreased to 2 m2/g. Meanwhile, Al2O3 has a 100 times larger surface area than Nb2O5. After pre-calcined at 800 °C Al2O3 still has a surface area of about 120 m2/g. Nb2O5 has no surface area stability advantages over Al2O3, indicating some other interaction of Nb2O5 and Co3O4 gives rise to the enhancement of activity. In Figure 10 (left), when 6% Co3O4 is impregnated onto Nb2O5, the total surface area increases. But the final surface area is still very small compared to the surface area of Al2O3. Figure 10 (right) shows no change in surface area after Co impregnation.
3. Materials and Methods
3.1. Carrier Preparation
Niobium Oxide Hydrate (Nb2O5·5H2O) was received from CBMM Brazil (Sao Paolo, Brazil). Alumina (gamma-Al2O3) was provided by BASF (Iselin, NJ, USA). Both Nb2O5 and Al2O3 were pre-calcined at various temperatures prior to deposition of cobalt nitrate hydrate (Co(NO3)2·6H2O).
3.2. Catalyst Preparation
Incipient wetness was used for metal impregnations. In order to determine the required volume to fill the pores, water was slowly added to the calcined carrier until saturation was achieved. The precursor salt was dissolved in this precise amount of water, which was then added to the carrier. It was dried in air at 130 °C for one hour and then calcined in air to various temperatures as shown in the Results and Discussion section.
3.2.1. Co-Containing Catalyst Preparation
The cobalt nitrate impregnated catalyst was dried at 130 °C for 1 h in air to remove all the water and then calcined at 300 °C in air to completely decompose the precursor salt for 2 h. The heating rate was 10 °C/min. Cobalt catalysts were prepared with loadings from 1%, 3% to 6% on both carriers. Percentages are based on the metal oxide component.
3.2.2. Pt-Containing Catalysts Preparation
A water soluble platinum amine salt, which is alkali and halide free, provided by BASF (Iselin, NJ, USA), was used for preparation of the Pt catalyst using incipient wetness. 1% Pt/Nb2O5 and 1% Pt/Al2O3 were prepared with the 800 °C pre-calcined carriers. Drying was accomplished 130 °C in air and the final calcination at 500 °C for 2 h in air at a heating rate of 10 °C/min.
3.3. Reactor Test
3.3.1. Reactor Preparation
The 0.1 mL (about 0.08–0.09 g) of finished catalyst was uniformly mixed with about 0.75 g of diluent quartz to maintain the bed temperature approximately constant. Air and propane (1% C3H8 in N2 were introduced into the reactor. The reactor quartz tubing was 10.5 mm (ID) × 12.75 mm (OD) with a length of 50 cm with XC-course quartz frit provided by Quartz Scientific, Inc. Harbor, OH, USA to support the catalyst.
3.3.2. Reactor Gas Flow Rate
The volume of catalyst used for all experiments was 0.1 mL and the total volumetric flow rate was 108 mL/min. Thus the GHSV was set at 64,800 h−1.
Reactor Gas Flow without Steam for CO Oxidation
21% O2/N2 with flow rate 75 mL/min and 4.94% CO/N2 with flow rate 33 mL/min was used as reactant gases. Flow rates are measured at room temperature of 25 °C and pressure of 1 atm. The GHSV here is: 64,800 h−1. Rotameters were calibrated with a soap film bubble meter and used to control flow rates.
Reactor Gas Flow without Steam for Propane Oxidation
21% O2/N2 at flow rate of 97.2 mL/min and 1% C3H8/N2 at a flow rate of 10.8 mL/min was used as reactant gases giving C3H8 = 0.1% C3H8 or 1000 ppm. All flow rates were measured at room temperature of 25 and pressure of 1 atm. The GHSV here was: 64,800 h−1. Rotameters were calibrated with a soap film bubble meter and used to control flow rates.
Reactor Gas Flow with Steam for Propane Oxidation
Twenty-one percent O2/N2 at a flow rate of 91.8 mL/min, 1% C3H8/N2 at a flow rate of 10.8 mL/min and H2O (steam) was introduced giving a flow rate of 5.4 mL/min. This gives 0.1% C3H8 with 5% steam and balance air. Liquid water was injected into the reactor connected into a heated transfer line. The heating tape was set at 150 °C; sufficiently high to generate a homogenous gaseous mixture. The GHSV here is 64,800 h−1. Rotameters were calibrated with a soap film bubble meter and used to control flow rate.
3.4. Data Management
3.4.1. Data Acquisition
Catalytic oxidations were carried out in a fixed-bed quartz flow reactor at atmospheric pressure. A cold trap was placed at the outlet to condense water produced during the reaction prior to entering the gas chromatography (GC). Effluent gases of O2, CO, CO2, C3H8 and N2 were analyzed by the micro GC. The temperature of the catalyst bed was measured by a K-type thermocouple and controlled by Omega CN7800 series temperature controller. An INFICON 3000 Micro GC, East Syracuse, NY, USA was used to analyze gas composition. Five single runs were conducted at each temperature. The GC was calibrated using 4 different certified standard gases before measurement.
3.4.2. Data Processing
Raw data from the GC was managed and analyzed in Excel to obtain plots of conversion as a function of temperature. The inlet catalyst temperature was increased and held until steady conversion was achieved. The temperature was controlled by a thermocouple located inside the reactor immediately above the catalyst inlet and connected to the MELLEN TEMPERATURE CONTROLLER. The temperature was increased in increments of 10 °C and the conversion measured.
Conversion of CO and C3H8 oxidation at each temperature point is as follows:
The oxidation reaction of CO and C3H8 to CO2 is as follows:
3.5. Aging Test
The aging temperature was maintained at 400 °C for 12 h in the reactant gases, followed by the generation of a conversion vs. temperature profile.
4. Conclusions
The pre-calcination temperature of the Nb2O5 carrier of 800 °C with cobalt calcined at 300 °C gives the best fresh and aged performance for both CO and propane oxidation. Nb2O5 shows a significant advantage over Al2O3 as the carrier. Six percent Co@300/Nb@800 has better fresh catalytic performance, higher thermal stability and greater resistance to steam than its counterpart, 6% Co@300/Al@800. Co3O4/Nb2O5 demonstrates increasing catalytic performance with Co3O4 loading from 1% to 6%. 6% Co@300/Nb@800 outperforms 1% Pt@500/Nb@800 for both fresh and aged states. Nb2O5 promotes Co3O4 and fresh NiO. However there is no advantage for CuO and Fe2O3 compared to the traditional Al2O3 carrier. Additionally, 6% Ni@350/Nb@800 has poor thermal stability relative to 6% Co@300/Nb@800. Therefore, 6% Co@300/Nb@800 is a viable candidate for replacing 1% Pt@500/Al@800 even though some small decrease in GHSV may be necessary to insure equal performance. However, this will not negatively affect the cost advantage of Co3O4 compared to Pt-containing catalysts. Naturally, candidate catalysts must be deposited on monolith and subjected to real VOC feed streams before a definitive recommendation can be made regarding replacement for Pt.
Acknowledgments
The authors are indebted to CBMM, San Paolo, Brazil, for their financial support. The authors especially want to thank Rogerio Ribas of CBMM and Robson Monteiro of Catalysis Consultoria Ltda for valuable contributions throughout these studies.
Author Contributions
Wendi Xiang designed the experiments under instruction of Robert J. Farrauto. Xiaochen Han conducted most of the propane experiments, and Jennifer Astorsdotter conducted most of the CO experiments. Both Wendi Xiang and Xiaochen Han analyzed the data and prepared this paper. Robert J. Farrauto is the only advisor for this research and contributed substantially to the editing of this paper.
Conflicts of Interest
The authors declare no conflict of interest.
References
- Leung, E.; Shimizu, A.; Barmak, K.; Farrauto, R. Copper oxide catalyst supported on niobium oxide for CO oxidation at low temperatures. Catal. Commun. 2017. [Google Scholar] [CrossRef]
- Heck, R.M.; Farrauto, R.J.; Gulati, S.T. Catalytic Air Pollution Control: Commercial Technology, 3rd ed.; John Wiley and Sons: Hoboken, NJ, USA, 2012. [Google Scholar]
- Liotta, L.F. Catalytic oxidation of volatile organic compounds on supported noble metals. Appl. Catal. B Environ. 2010, 100, 403–412. [Google Scholar] [CrossRef]
- Spivey, J.J. Complete catalytic oxidation of volatile organics. Ind. Eng. Chem. Res. 1987, 26, 2165–2180. [Google Scholar] [CrossRef]
- Duprez, D.; Cavani, F. Handbook of Advanced Methods and Processes in Oxidation Catalysis “from Laboratory to Industry”; Imperial College Press: London, UK, 2014; Chapters 1–8. [Google Scholar]
- Busca, G.; Daturi, M.; Finocchio, E.; Lorenzelli, V.; Ramis, G.; Willey, R.J. Transition metal mixed oxides as combustion catalysts: Preparation, characterization and activity mechanisms. Catal. Today 1997, 33, 239–249. [Google Scholar] [CrossRef]
- Thormahlen, P.; Thormählen, P.; Skoglundh, M.; Fridell, E.; Andersson, B. Low-Temperature CO Oxidation over Platinum and Cobalt Oxide Catalysts. J. Catal. 1999, 188, 300–310. [Google Scholar] [CrossRef]
- Solsona, B.; Vázquez, I.; Garcia, T.; Davies, T.E.; Taylor, S.H. Complete oxidation of short chain alkanes using a nanocrystalline cobalt oxide catalyst. Catal. Lett. 2007, 116, 116–121. [Google Scholar] [CrossRef]
- Glisenti, A.; Pacella, M.; Guiotto, M.; Natile, M.M.; Canu, P. Largely Cu-doped LaCo1−xCuxO3 perovskites for TWC: Toward new PGM-free catalysts. Appl. Catal. B Environ. 2016, 180, 94–105. [Google Scholar] [CrossRef]
- Tauster, S.J.; Fung, S.C.; Baker, R.T.; Horsley, J.A. Strong interactions in supported-metal catalysts. Science 1981, 211, 1121–1125. [Google Scholar] [CrossRef] [PubMed]
- Hu, Z.; Nakamura, H.; Kunimori, K.; Asano, H.; Uchijima, T. Ethane hydrogenolysis and hydrogen chemisorption over niobia-promoted rhodium catalysts: A new phase by a strong rhodium-niobia interaction. J. Catal. 1988, 112, 478–488. [Google Scholar] [CrossRef]
- Leung, E.; Lin, Q.; Farrauto, R.J.; Barmak, K. Oxygen storage and redox properties of Nb-doped ZrO2-CeO2-Y2O3 solid solutions for three-way automobile exhaust catalytic converters. Catal. Today 2016, 277, 227–233. [Google Scholar] [CrossRef]
- Sasaki, K.; Zhang, L.; Adzic, R.R. Niobium oxide-supported platinum ultra-low amount electrocatalysts for oxygen reduction. Phys. Chem. Chem. Phys. PCCP 2008, 10, 159–167. [Google Scholar] [CrossRef] [PubMed]
- Sun, Y.; Lv, P.; Yang, J.Y.; He, L.; Nie, J.C.; Liu, X.; Li, Y. Ultrathin Co3O4 nanowires with high catalytic oxidation of CO. Chem. Commun. 2011, 47, 11279–11281. [Google Scholar] [CrossRef] [PubMed]
- Xie, X.; Li, Y.; Liu, Z.-Q.; Haruta, M.; Shen, W. Low-temperature oxidation of CO catalysed by Co3O4 nanorods. Nature 2009, 458, 746–749. [Google Scholar] [CrossRef] [PubMed]
- Ehrhardt, C.; Gjikaj, M.; Brockner, W. Thermal decomposition of cobalt nitrato compounds: Preparation of anhydrous cobalt (II) nitrate and its characterisation by Infrared and Raman spectra. Thermochim. Acta 2005, 432, 36–40. [Google Scholar] [CrossRef]
- Yan, L.; Rui, X.; Chen, G.; Xu, W.; Zou, G.; Luo, H. Recent advances in nanostructured Nb-based oxides for electrochemical energy storage. Nanoscale 2016, 8, 8443–8465. [Google Scholar] [CrossRef] [PubMed]
- Wefers, K.; Misra, C. Oxides and Hydroxides of Aluminum; Alcoa Laboratories: East Saint Louis, IL, USA, 1987. [Google Scholar]
Figure 1.
Thermal gravimetric analysis (TGA) tests for the decomposition of the Co(NO3)2·6H2O and impregnated catalysts Co(NO3)2/Nb@800 and Co(NO3)2/Al@800. Both Nb2O5 and Al2O3 were pre-calcined at 800 °C for 2 h in air. The supported catalysts were prepared to give 6% cobalt oxide.
Figure 1.
Thermal gravimetric analysis (TGA) tests for the decomposition of the Co(NO3)2·6H2O and impregnated catalysts Co(NO3)2/Nb@800 and Co(NO3)2/Al@800. Both Nb2O5 and Al2O3 were pre-calcined at 800 °C for 2 h in air. The supported catalysts were prepared to give 6% cobalt oxide.

Figure 2.
Six percent Co@300/Nb@800, 6% Co@300/Nb@500, 6% Co@300/Al@800 and 6% Co@300/Al@500 for CO oxidation. Both Nb@800 and Al@800 were pre-calcined at 800 °C for 2 h in air, and both Nb@500 and Al@500 were pre-calcined at 500 °C for 2 h in air. All four impregnated catalysts were calcined at 300 °C for 2 h in air. Gas composition: CO 1.5 vol %; O2 14.5 vol %, N2 84 vol %. Catalysis volume: 0.1 mL; GHSV: 64,800 (h−1).

Figure 3.
Fresh 6% Co@300/Nb@800, aged 6% Co@300/Nb@800, fresh 6% Co@300/Al@800 and aged 6% Co@300/Al@800 for CO oxidation. Aging was conducted at 400 °C for 12 h with reaction gases flowing. Gas composition: CO 1.5 vol %; O2 14.5 vol %, N2 84 vol %. Catalysis volume: 0.1 mL; GHSV: 64,800 (h−1).
Figure 3.
Fresh 6% Co@300/Nb@800, aged 6% Co@300/Nb@800, fresh 6% Co@300/Al@800 and aged 6% Co@300/Al@800 for CO oxidation. Aging was conducted at 400 °C for 12 h with reaction gases flowing. Gas composition: CO 1.5 vol %; O2 14.5 vol %, N2 84 vol %. Catalysis volume: 0.1 mL; GHSV: 64,800 (h−1).

Figure 4.
Fresh Co@300/Nb@800 with loadings of 1%, 3%, and 6%, for propane oxidation (left); aged Co@300/Nb@800 for propane oxidation (right). Aging was conducted at 400 °C with reaction gases for 12 h. Gas composition: C3H8 0.1 vol %, O2 18.9 vol %, N2 81 vol %. Catalysis volume: 0.1 mL, GHSV: 64,800 (h−1).
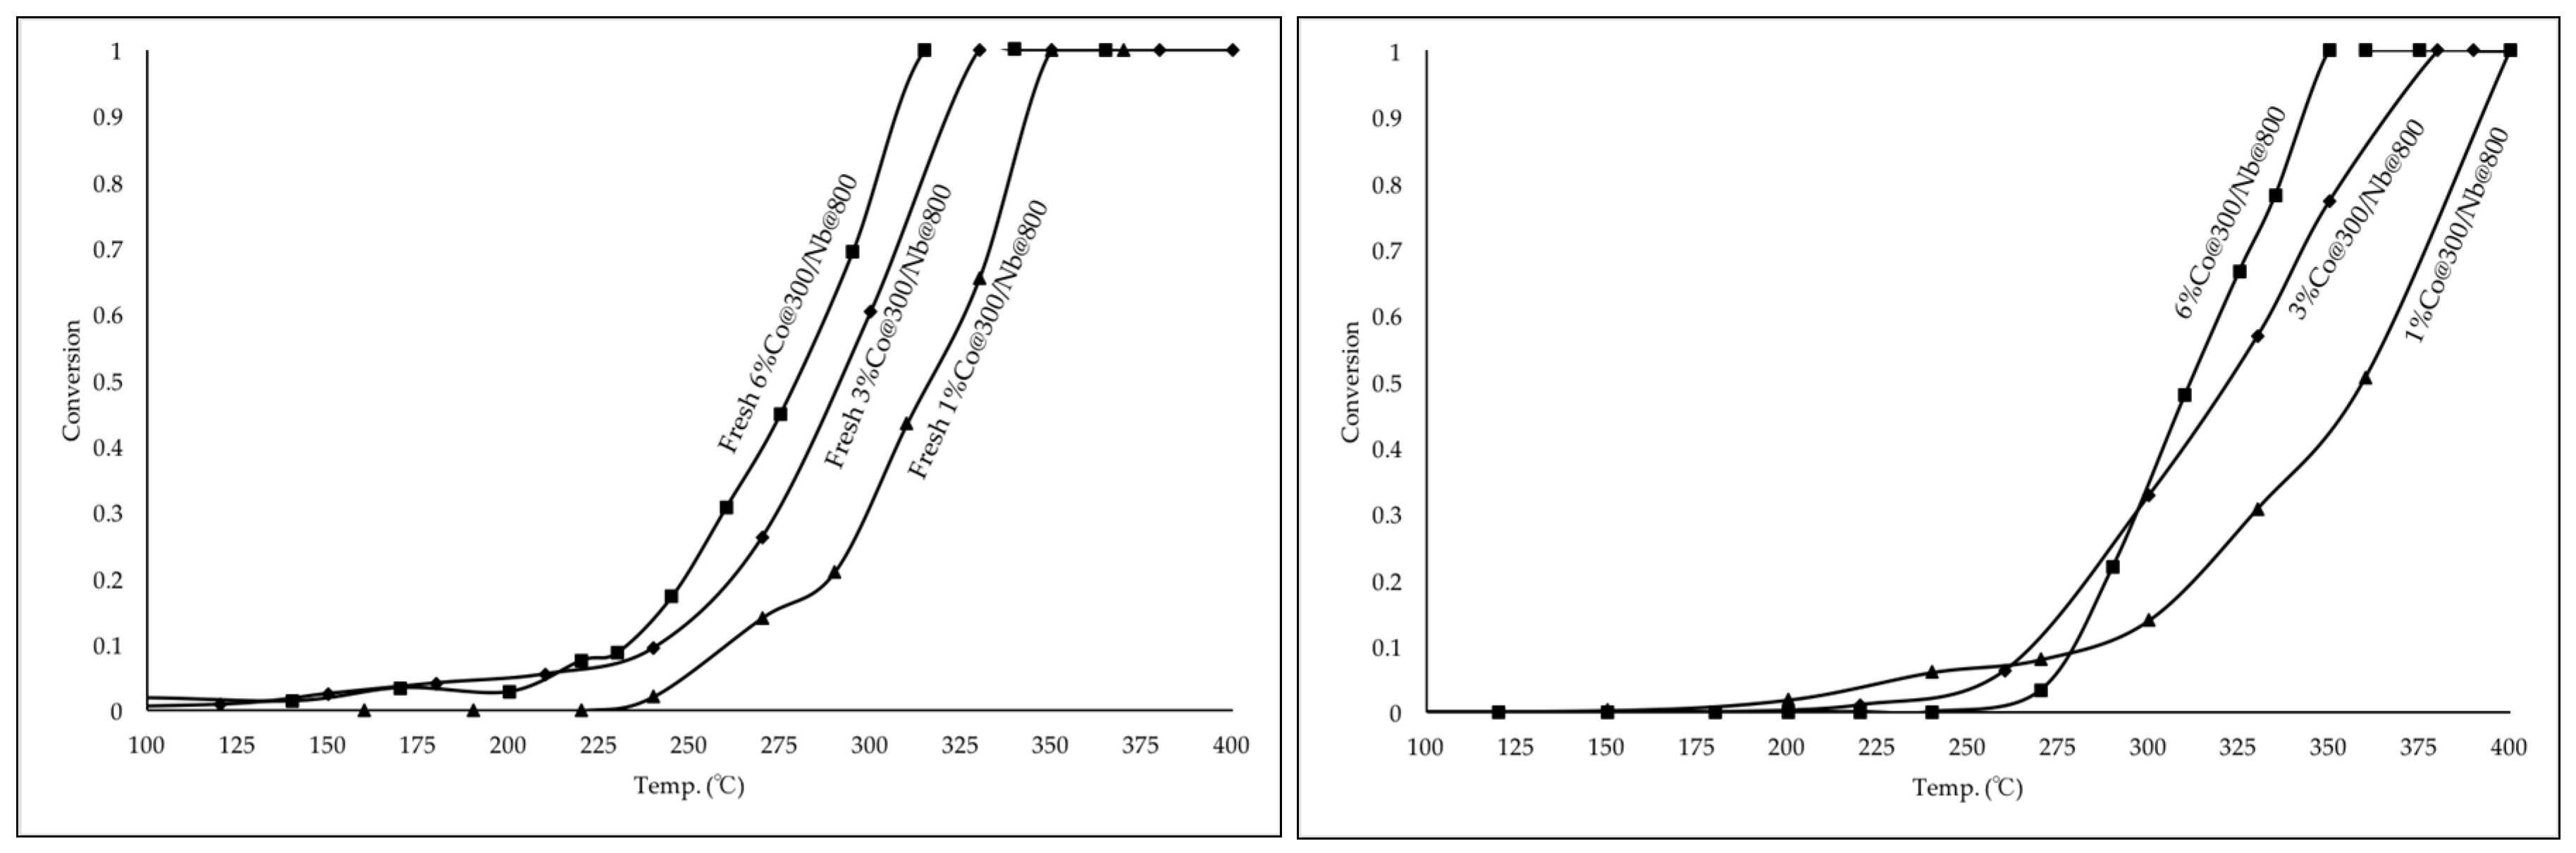
Figure 5.
Fresh and aged 6% Co@300/Nb@800 and 6% Co@300/Al@800 for propane oxidation. Aging was conducted at 400 °C with reaction gases for 12 h. Gas composition: C3H8 0.1 vol %, O2 18.9 vol %, N2 81 vol %. Catalysis volume: 0.1 mL, GHSV: 64,800 (h−1).
Figure 5.
Fresh and aged 6% Co@300/Nb@800 and 6% Co@300/Al@800 for propane oxidation. Aging was conducted at 400 °C with reaction gases for 12 h. Gas composition: C3H8 0.1 vol %, O2 18.9 vol %, N2 81 vol %. Catalysis volume: 0.1 mL, GHSV: 64,800 (h−1).
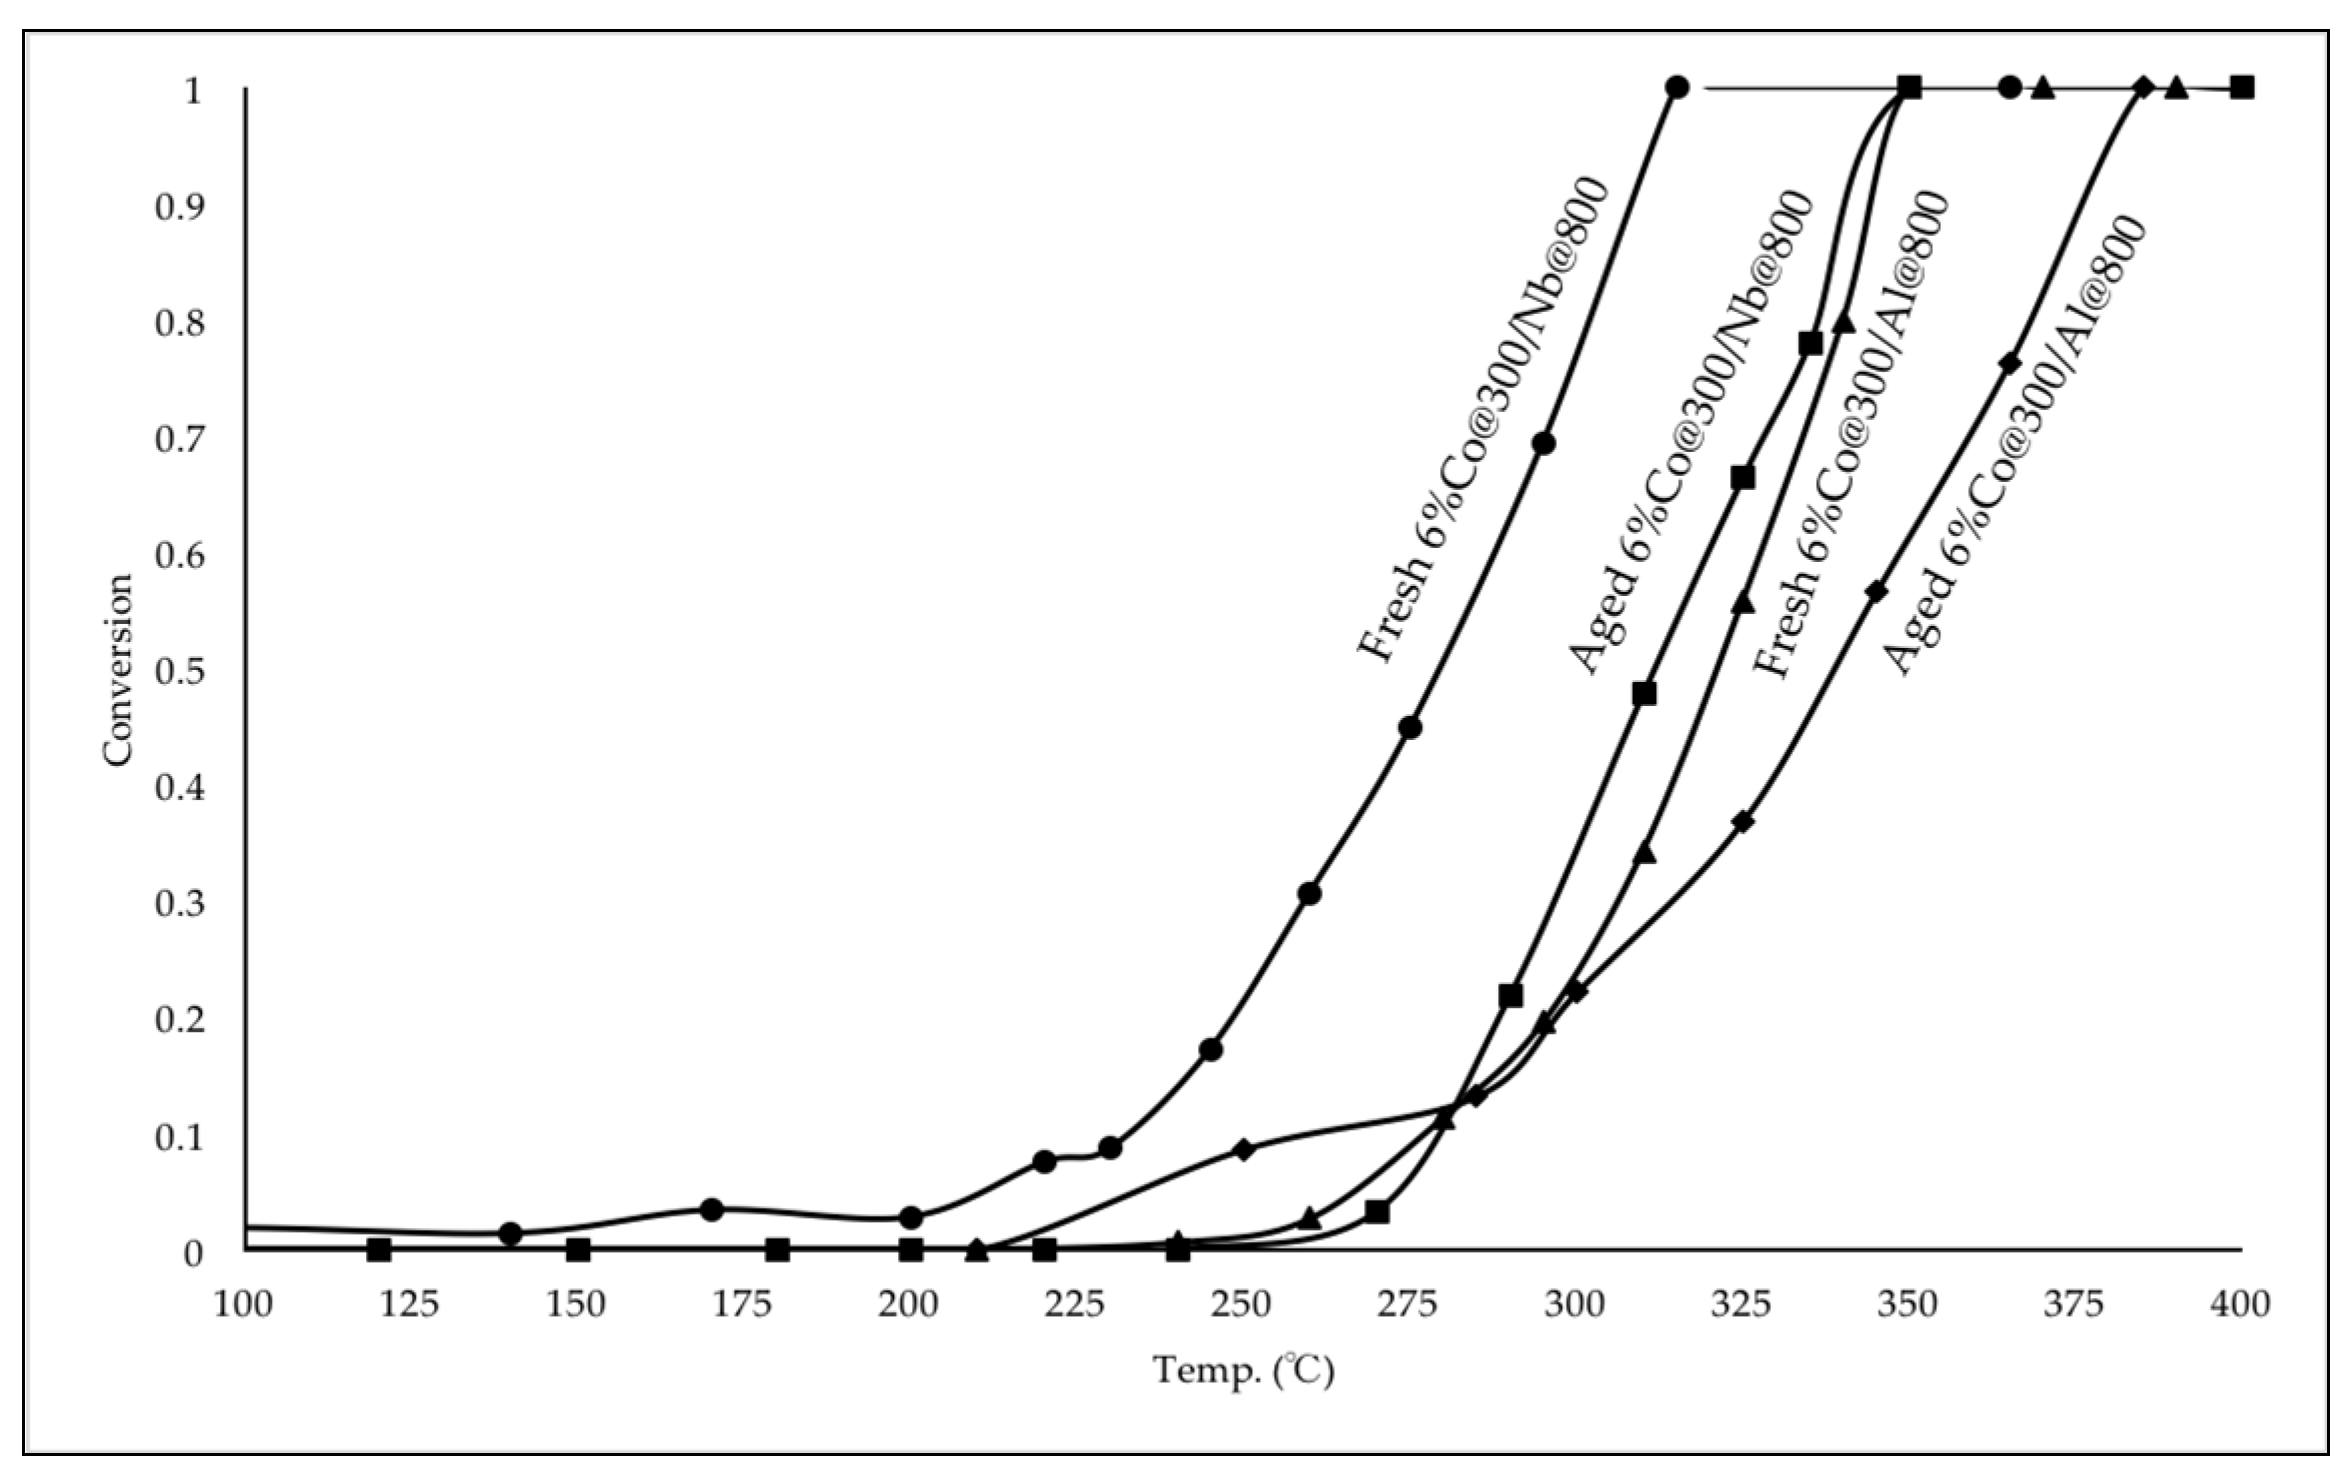
Figure 6.
Fresh and aged 6% Co@300/Nb@800 and 6% Co@300/Al@800 for propane oxidation with moisture. Aging test was conducted at 400 °C with reaction gases for 12 h. Gas composition with H2O 5 vol %, C3H8 0.1 vol %, O2 17.85 vol %, N2 77.05 vol %. Catalysis volume: 0.1 mL, GHSV: 64,800 (h−1).
Figure 6.
Fresh and aged 6% Co@300/Nb@800 and 6% Co@300/Al@800 for propane oxidation with moisture. Aging test was conducted at 400 °C with reaction gases for 12 h. Gas composition with H2O 5 vol %, C3H8 0.1 vol %, O2 17.85 vol %, N2 77.05 vol %. Catalysis volume: 0.1 mL, GHSV: 64,800 (h−1).
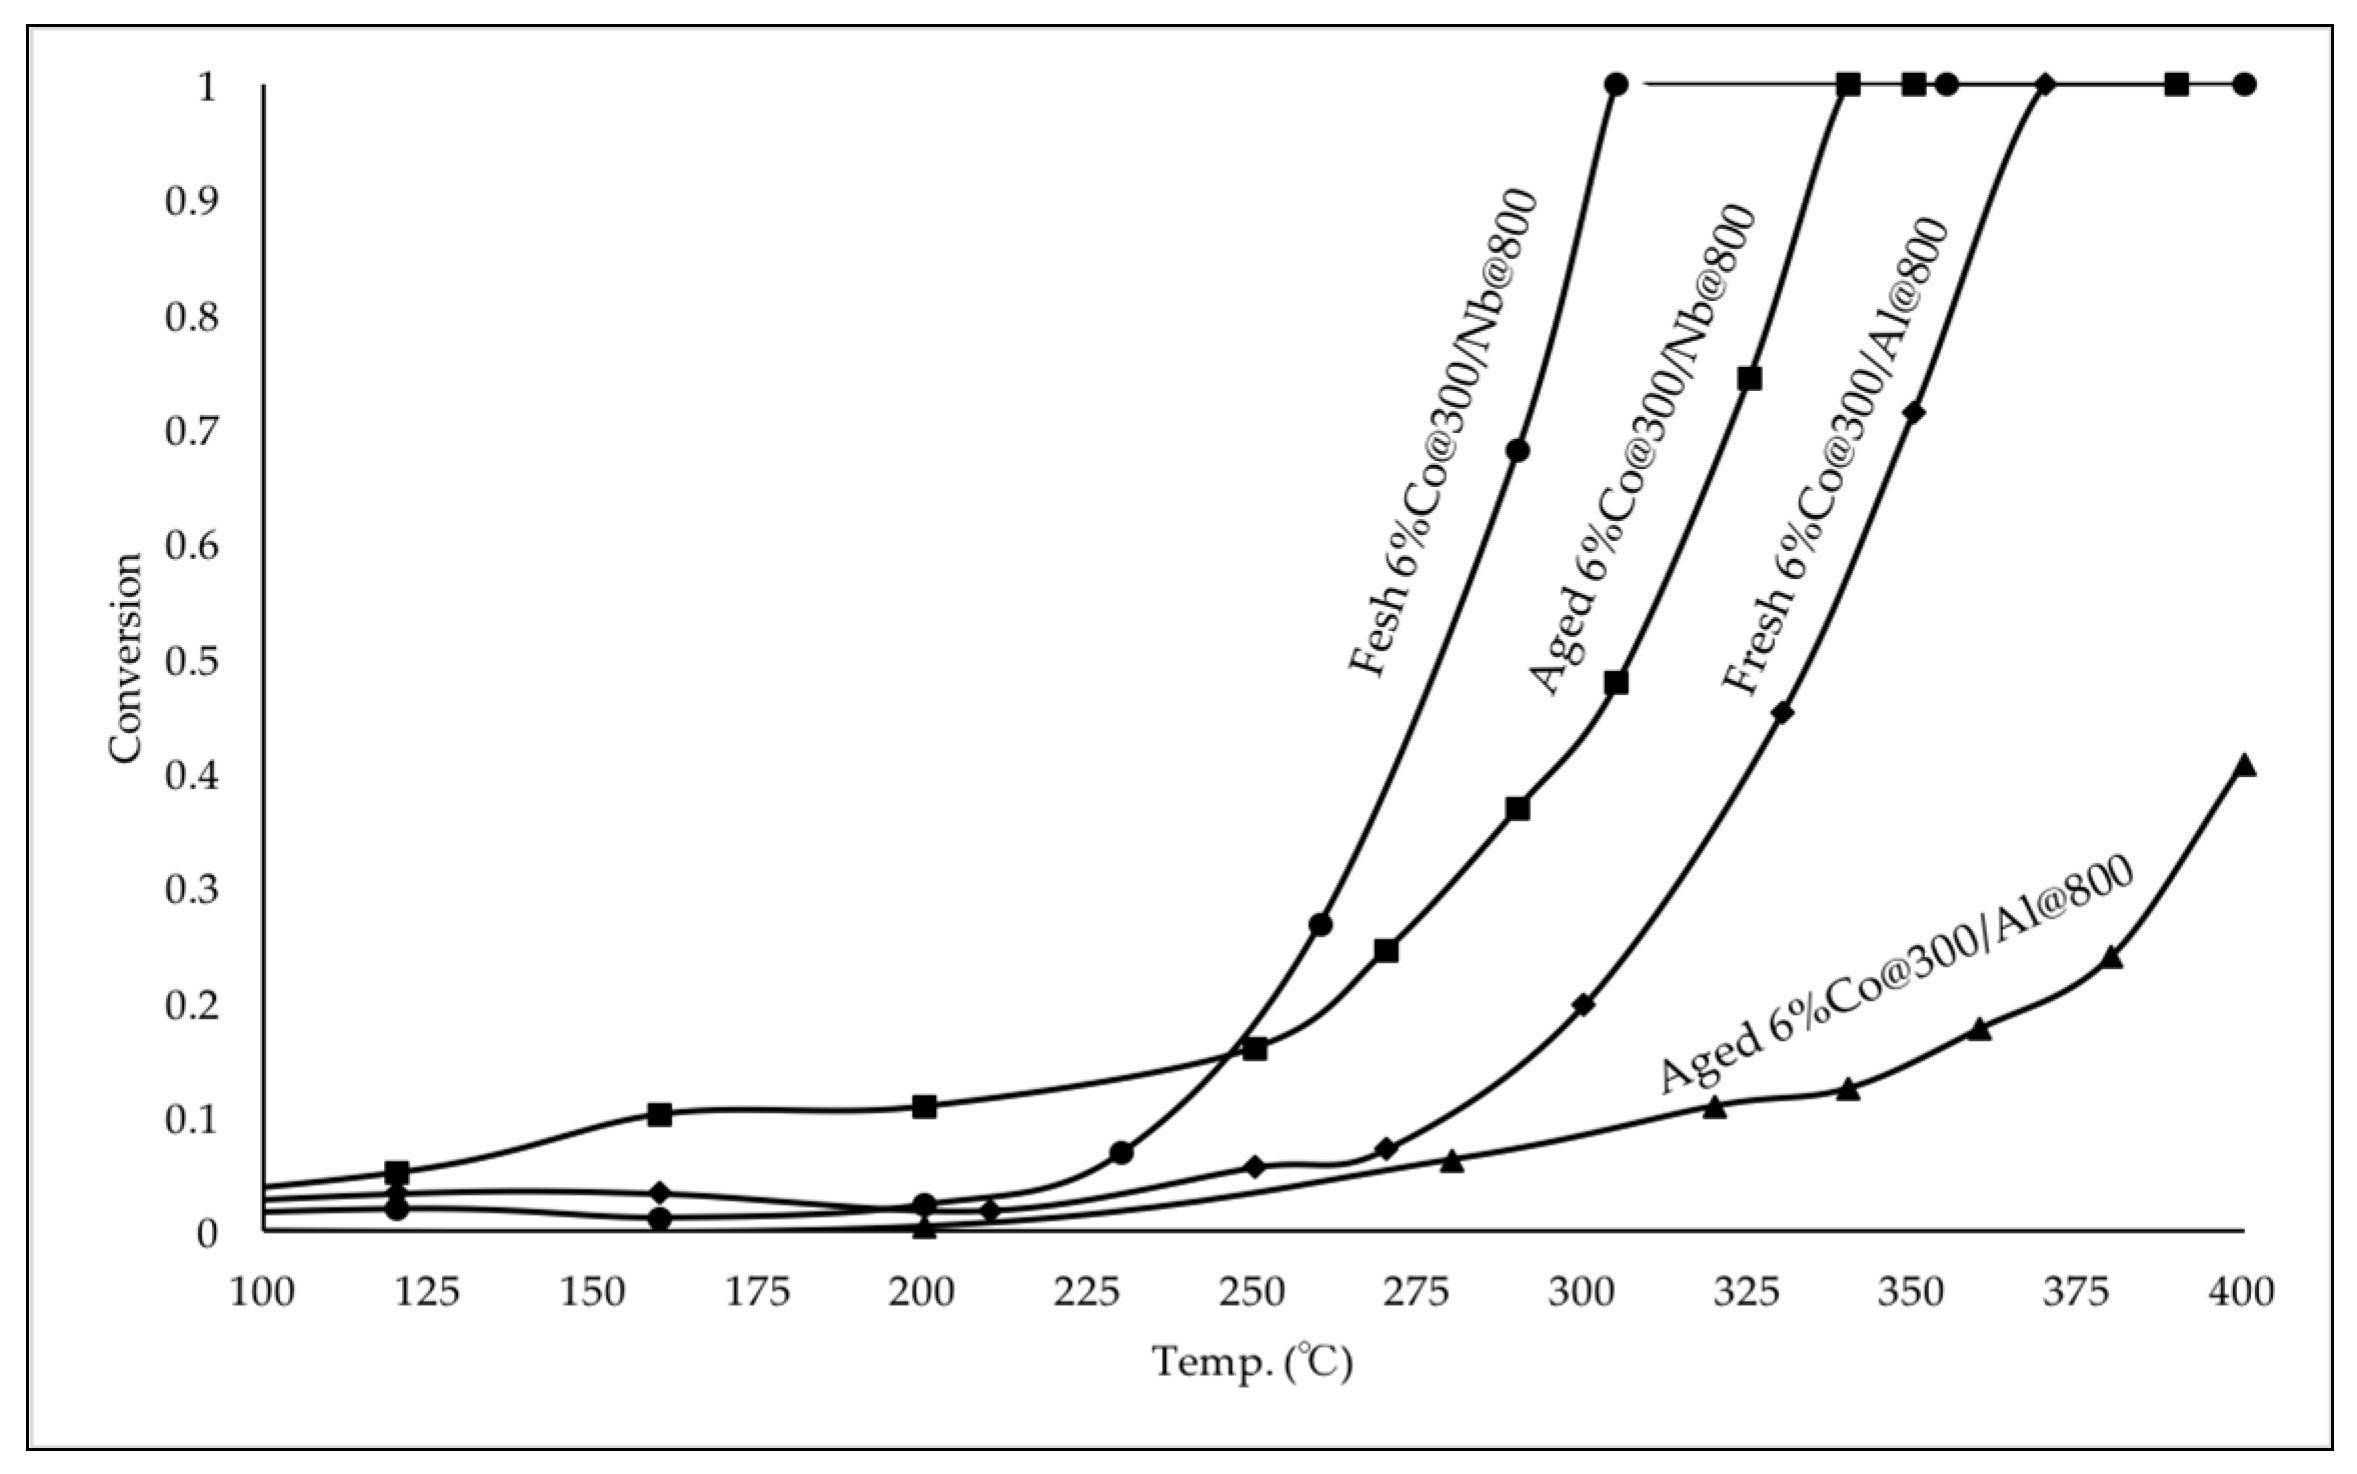
Figure 7.
Fresh cobalt oxide catalyst and fresh platinum catalyst for propane oxidation (left); aged cobalt oxide and aged platinum on niobium oxide for propane oxidation (right). Impregnated platinum catalysts were calcined at 500 °C. Aging was conducted at 400 °C with reaction gases for 12 h. C3H8 0.1 vol %, O2 18.9 vol %, N2 81 vol %. Catalysis volume: 0.1 mL; GHSV: 64,800 (h−1).
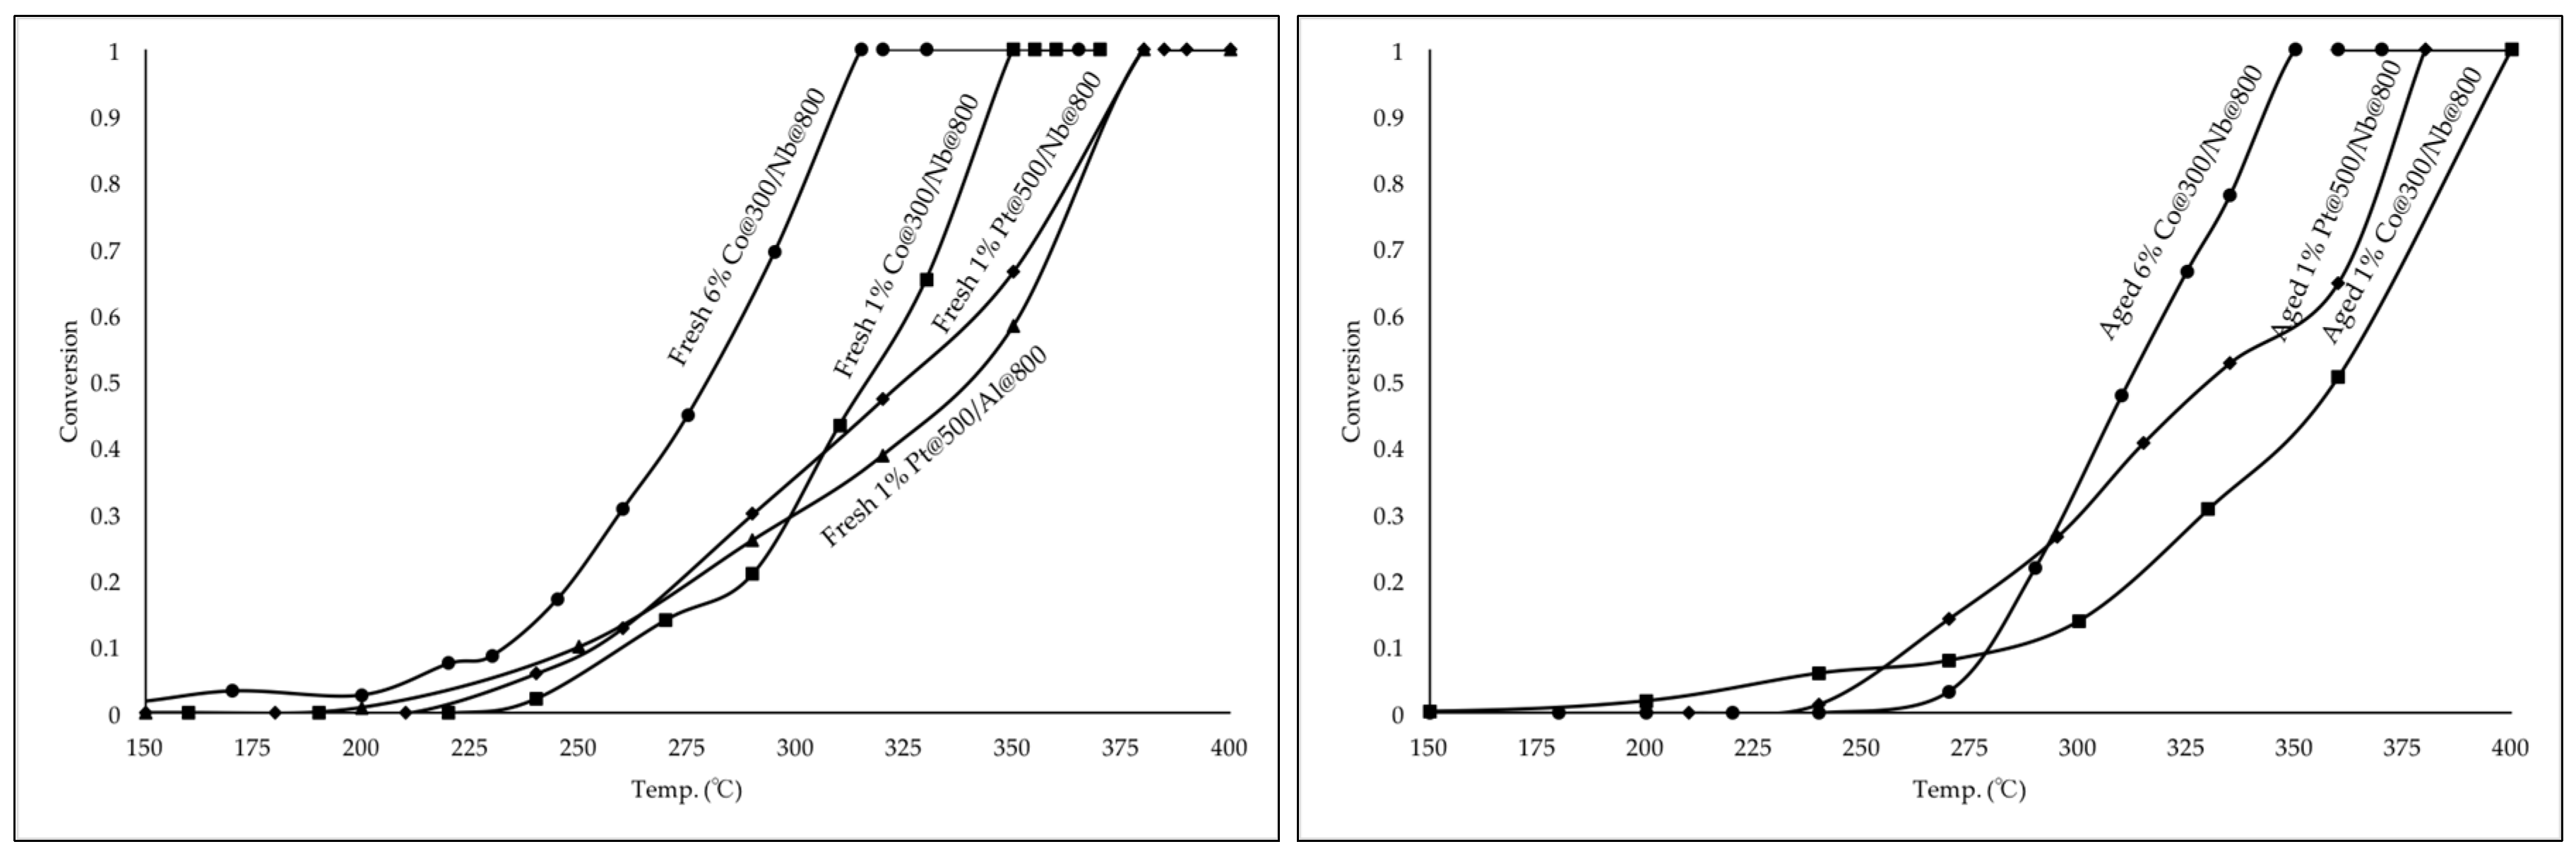
Figure 8.
Different metal oxides (6%) on Nb@800 for propane oxidation (left); 6% Co3O4 and 6% NiO on different carriers for propane oxidation (right). The iron catalysts were calcined at 300 °C, impregnated nickel catalysts were calcined at 350 °C, and impregnated copper catalysts were calcined at 400 °C. C3H8 0.1 vol %, O2 18.9 vol %, N2 81 vol %. Catalyst volume: 0.1 mL; GHSV: 64,800 (h−1).

Figure 9.
Surface area of Al2O3 and Nb2O5 pre-calcined at different temperatures. BET test was conducted on Quantachrome ChemBET Pulsar TPR/TPD carrier gas is 30% N2/He.
Figure 9.
Surface area of Al2O3 and Nb2O5 pre-calcined at different temperatures. BET test was conducted on Quantachrome ChemBET Pulsar TPR/TPD carrier gas is 30% N2/He.
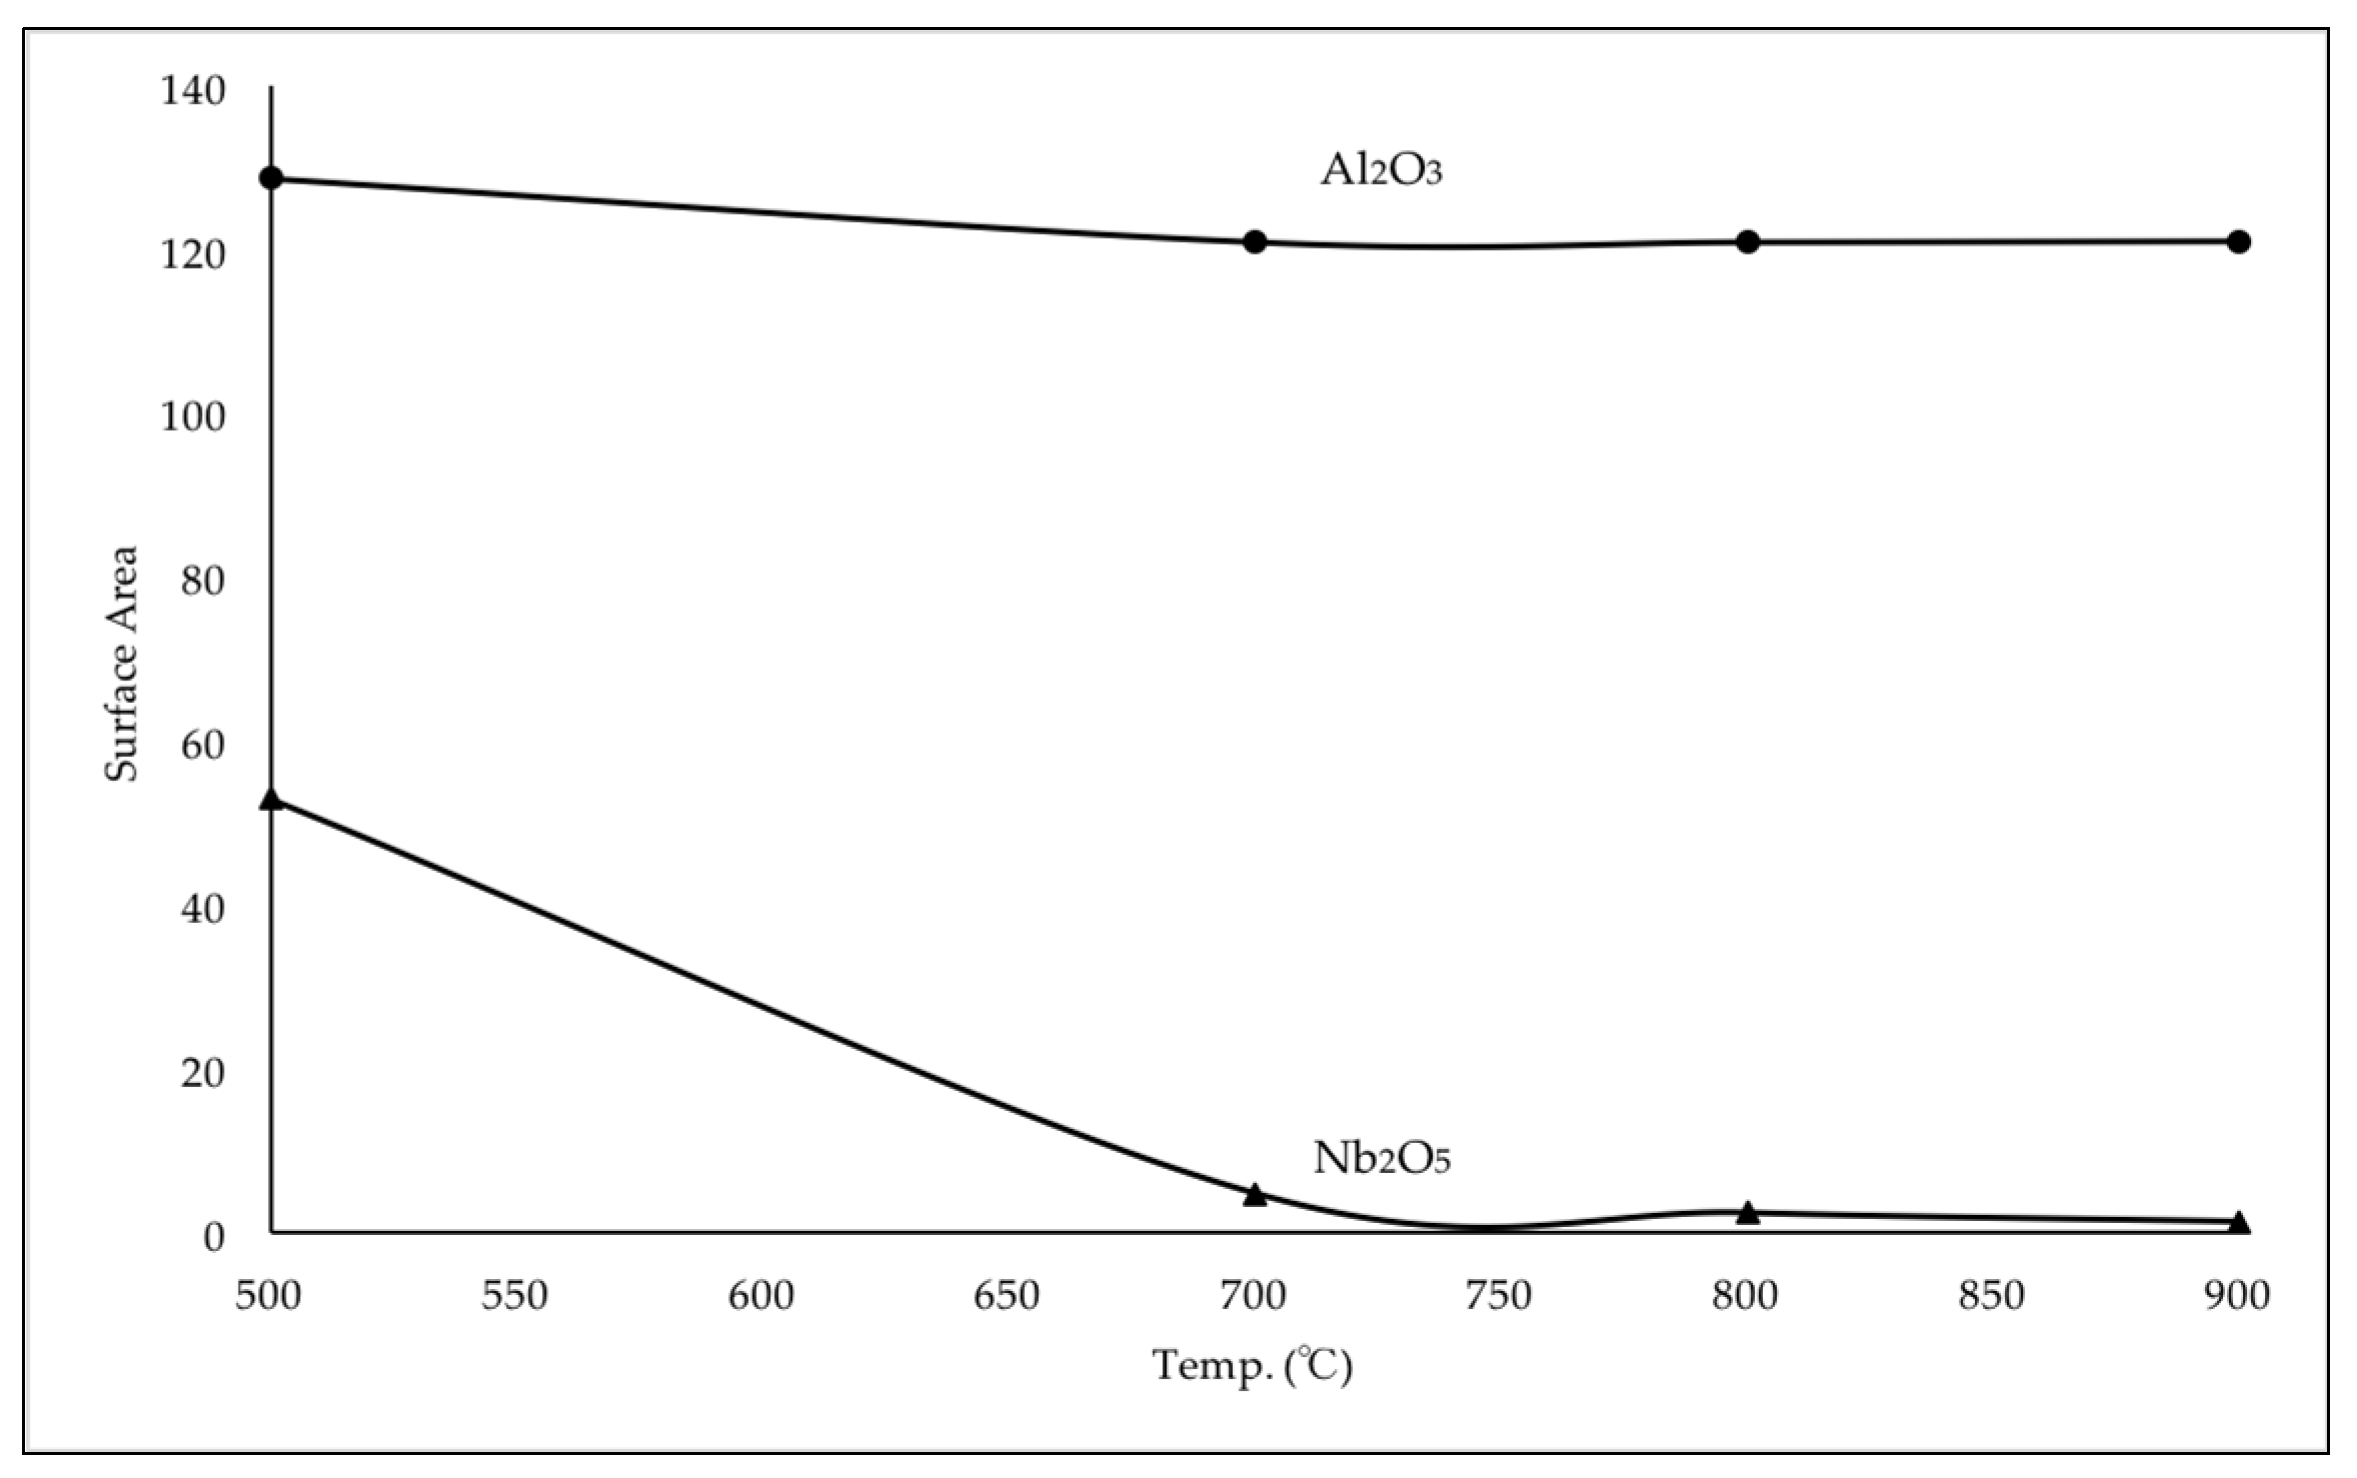
Figure 10.
Comparison between Co3O4/Nb2O5 and Nb2O5 (left); comparison between Co3O4/Al2O3 and Al2O3 (right). BET test was conducted on Quantachrome ChemBET Pulsar TPR/TPD, carrier gas is 30% N2/He.
Figure 10.
Comparison between Co3O4/Nb2O5 and Nb2O5 (left); comparison between Co3O4/Al2O3 and Al2O3 (right). BET test was conducted on Quantachrome ChemBET Pulsar TPR/TPD, carrier gas is 30% N2/He.


Table 1.
Six percent Co@300/Nb with the number following @ = pre-calcination temperatures of the carrier for CO oxidation.
Table 1.
Six percent Co@300/Nb with the number following @ = pre-calcination temperatures of the carrier for CO oxidation.
| Catalyst | T20 (°C) | T50 (°C) | T90 (°C) |
|---|---|---|---|
| 6% Co@300/Nb@500 | 190 | 200 | 220 |
| 6% Co@300/Nb@700 | 150 | 155 | 160 |
| 6% Co@300/Nb@800 | 130 | 145 | 160 |
| 6% Co@300/Nb@900 | 130 | 155 | 185 |
Table 2.
Six percent Co/Al with @ = pre-calcination temperatures of the carrier for CO oxidation.
| Catalyst | T20 (°C) | T50 (°C) | T90 (°C) |
|---|---|---|---|
| 6% Co@300/Al@500 | 205 | 225 | 245 |
| 6% Co@300/Al@700 | 200 | 215 | - |
| 6% Co@300/Al@800 | 185 | 205 | 240 |
| 6% Co@300/Al@900 | 215 | 240 | 270 |
Table 3.
Turnover Frequencies (TOF) for CO oxidation for fresh 6% Co@300/Nb@800 relative to fresh 6% Co@300/Al@800.
Table 3.
Turnover Frequencies (TOF) for CO oxidation for fresh 6% Co@300/Nb@800 relative to fresh 6% Co@300/Al@800.
| Catalyst | TOF@150 °C (h−1 × 10⁵) | TOF@170 °C (h−1 × 10⁵) | TOF@190 °C (h−1 × 10⁵) | TOF@210 °C (h−1 × 10⁵) |
|---|---|---|---|---|
| 6% Co@300/Nb@800 | 897.8 | 1508 | 1508 | 1508 |
| 6% Co@300/Al@800 | 53.48 | 129.9 | 496.6 | 1241 |
Table 4.
Co@300/Nb@800 with various cobalt loadings for propane oxidation: fresh and aged.
| Catalyst | T20 (°C) | T50 (°C) | T90 (°C) |
|---|---|---|---|
| Fresh 6% Co@300/Nb@800 | 250 | 280 | 305 |
| Aged 6% Co@300/Nb@800 | 290 | 310 | 340 |
| Fresh 3% Co@300/Nb@800 | 260 | 270 | 310 |
| Aged 3% Co@300/Nb@800 | 285 | 320 | 360 |
| Fresh 1% Co@300/Nb@800 | 290 | 315 | 345 |
| Aged 1% Co@300/Nb@800 | 315 | 355 | 390 |
Table 5.
T20, T50, and T90 of fresh Co catalysts and Pt catalysts for propane oxidation.
| Catalysts | T20 (°C) | T50 (°C) | T90 (°C) |
|---|---|---|---|
| 6% Co@300/Nb@800 | 250 | 280 | 305 |
| 1% Co@300/Nb@800 | 290 | 315 | 345 |
| 1% Pt@500/Nb@800 | 275 | 325 | 370 |
| 1% Pt@500/Al@800 | 275 | 340 | 370 |
Table 6.
T20, T50, and T90 of aged Co catalysts and Pt catalysts for propane oxidation.
| Catalysts | T20 (°C) | T50 (°C) | T90 (°C) |
|---|---|---|---|
| 6% Co@300/Nb@800 | 290 | 310 | 340 |
| 1% Co@300/Nb@800 | 315 | 355 | 390 |
| 1% Pt@500/Nb@800 | 290 | 335 | 375 |
© 2017 by the authors. Licensee MDPI, Basel, Switzerland. This article is an open access article distributed under the terms and conditions of the Creative Commons Attribution (CC BY) license (http://creativecommons.org/licenses/by/4.0/).
Share and Cite
MDPI and ACS Style
Xiang, W.; Han, X.; Astorsdotter, J.; Farrauto, R. Catalysts Promoted with Niobium Oxide for Air Pollution Abatement. Catalysts 2017, 7, 144. https://doi.org/10.3390/catal7050144
AMA Style
Xiang W, Han X, Astorsdotter J, Farrauto R. Catalysts Promoted with Niobium Oxide for Air Pollution Abatement. Catalysts. 2017; 7(5):144. https://doi.org/10.3390/catal7050144
Chicago/Turabian StyleXiang, Wendi, Xiaochen Han, Jennifer Astorsdotter, and Robert Farrauto. 2017. "Catalysts Promoted with Niobium Oxide for Air Pollution Abatement" Catalysts 7, no. 5: 144. https://doi.org/10.3390/catal7050144
Note that from the first issue of 2016, this journal uses article numbers instead of page numbers. See further details here.