Article

Photocatalytic Treatment of An Actual Confectionery Wastewater Using Ag/TiO2/Fe2O3: Optimization of Photocatalytic Reactions Using Surface Response Methodology

Department of Chemical Engineering, Ryerson University, 350 Victoria Street, Toronto, ON M5B 2K3, Canada
*
Author to whom correspondence should be addressed.
Catalysts 2018, 8(10), 409; https://doi.org/10.3390/catal8100409
Submission received: 15 August 2018 / Revised: 15 September 2018 / Accepted: 17 September 2018 / Published: 21 September 2018
(This article belongs to the Special Issue State-of-the-Art Photocatalytical Technology in North America)

Abstract

:
Titanium dioxide (TiO2) photocatalysis is one of the most commonly studied advanced oxidation processes (AOPs) for the mineralization of deleterious and recalcitrant compounds present in wastewater as it is stable, inexpensive, and effective. Out of all, doping with metal and non-metals, and the heterojunction with another semiconductor were proven to be efficient methods in enhancing the degradation of organic pollutants under ultraviolet (UV) and visible light. However, complex degradation processes in the treatment of an actual wastewater are difficult to model and optimize. In the present study, the application of a modified photocatalyst, Ag/TiO2/Fe2O3, for the degradation of an actual confectionery wastewater was investigated. Factorial studies and statistical design of experiments using the Box-Behnken method along with response surface methodology (RSM) were employed to identify the individual and cross-factor effects of independent parameters, including light wavelength (nm), photocatalyst concentration (g/L), initial pH, and initial total organic carbon (TOC) concentration (g/L). The maximum TOC removal at optimum conditions of light wavelength (254 nm), pH (4.68), photocatalyst dosage (480 mg/L), and initial TOC concentration (11,126.5 mg/L) was determined through the numerical optimization method (9.78%) and validated with experimental data (9.42%). Finally, the first-order rate constant with respect to TOC was found to be 0.0005 min−1 with a residual value of 0.998.

1. Introduction

Confectionery wastewater effluents contain high amounts of sugar (sucrose), sugar alcohol, artificial sweeteners (aspartame, acesulfame, and sucralose), food additives, colorants (TiO2), natural flavors, and artificial flavors that account for their high strength in chemical oxygen demand (COD) and biological oxygen demand (BOD) [1,2]. These organic compounds can cause sudden shocks and rapid dissolved oxygen depletion in the biological treatment systems when discharged to surrounding municipal wastewater treatment facilities, further causing deviation in characteristics of treated effluents [1,2,3]. Among all, artificial sweeteners, such as aspartame, acesulfame, and sucralose, are extremely stable throughout the conventional wastewater treatment processes; however, toxicity will increase after photodegradation [4,5,6]. As the inadequately treated wastewater containing deleterious substances is being discharged to large water bodies, they will continue to persist with half-lives up to several years [6,7].
Advanced oxidation processes (AOPs) are promising and environmentally friendly wastewater treatment technologies capable of mineralizing deleterious substances in wastewater systems [4,8,9,10]. Among all, photocatalysis, especially with titanium dioxide (TiO2), is commonly studied owing to its high chemical stability, promising efficiency, low cost, and non-toxicity [10,11,12]. The study conducted by Sang et al. showed promising efficiency of TiO2 in degrading the artificial sweeteners found in confectionery wastewater and in mineralizing the intermediate products generated during the degradation process [4]. Photomineralization is a process in which the photogenerated hydroxyl radical participates in the redox reactions with the organic materials in aqueous solutions which produce intermediate products (aldehydes and carboxylic acids) and, finally, achieve complete oxidation of carbon atoms [1,4,9,10,13]. However, the application of TiO2 is limited by the ultraviolet (UV) activation and the fast recombination rate of the generated electron-hole pairs [10,12,14]. Hence, modifications of TiO2 photocatalysts through metal doping, non-metal doping, and its combination with another semiconductor photocatalyst are common methods to extend the absorption wavelength of TiO2 towards visible light spectrum, to restrict the recombination of electron-hole pairs, and to increase the specific surface area of the photocatalyst [9,10,11,12,13,14,15,16,17].
Metal doping of TiO2 can be accomplished through interstitial doping and substitutional doping. Interstitial doping involves metal dopants located on the surface of TiO2, and substitutional doping involves the substitution of Ti4+ atoms by metal dopants [9,18,19]. Metal doping also introduces a mid-gap energy level in the band gap of TiO2 [20,21]. Out of all metal dopants, noble metals have higher resistance to corrosion, making them ideal to be used in water treatment processes. Metal dopants include Au, Ag, Co, Fe, Ni, Pt, and Zn [9,10]. Non-metal doping is established through similar theories, except that in substitutional doping O2− atoms are substituted by a non-metal dopant, and non-metal doping of TiO2 also has a promising effect in expanding the photocatalytic activity to the visible light region of the spectrum [10,22]. Common non-metal dopants include B, C, F, I, N, and S [13]. These metal and non-metal dopants are effective in introducing a mid-gap energy state in the TiO2 energy levels and enhance the specific surface area of the photocatalyst [13,23]. Moreover, combining two semiconductor photocatalysts, such as Zn/TiO2, CdS/TiO2/Pt, TiO2/Y-zeolite, Ag2O/TiO2, Ag-Bi2MoO4, zeolite/WO3-Pt, and CdS-SnO2, has also been studied to enhance the photoactivity of photocatalysts [24,25]. Each modification method has its own strengths and shortcomings. Other physical parameters, such as specific surface area, crystalline phase, crystalline size, and pore distribution, that can be modified through these modification methods are crucial in improving the photocatalytic activity of a photocatalyst [10,13,17,26]. Among all, metal-doped and semi-conductor-combined photocatalyst, Ag/TiO2/Fe2O3, presents an excellent improvement in the photoactivity under ultraviolet type-A (UV-A) in the treatment of textile dyes [26]. In the present study, a TiO2 photocatalyst was synthesized, combined with another semiconductor (Fe2O3), and finally doped with a noble metal (Ag) using the UV-assisted thermal method established by Nasirian [26].
The optimization of the degradation of organic pollutants in an actual confectionery wastewater was performed using single-variable studies [4,27,28,29,30,31]. However, it is difficult to predict the optimum reaction conditions from previous results owing to the possible interactions between different independent variables involved in the photocatalytic reactions [10,17,22,30]. Statistical programs come in handy to help establish a design of experiment (DOE) using response surface methodology (RSM) to develop a mathematical function relating the response with various predictors, and to obtain optimum conditions that maximizes the desired results under high desirability [8,32]. Furthermore, the central composited design (CCD) and Box-Behnken design (BBD) are both effective RSM designs to generate a second-order response surface model in the optimization of the photocatalytic treatment process [8,10,17,22,32]. The BBD is preferred when parameters are limited to three levels [8,10,22].
In this study, the as-synthesized modified photocatalyst, Ag/TiO2/Fe2O3, was employed to treat an actual confectionery wastewater (CWW), and the photomineralization process was optimized by numerical and graphical optimization methods of Box-Behnken Design (BBD) with response surface methodology (RSM). The final optimized conditions were validated through an extra experimental trial, and the first-order rate constant of the photomineralization process based on TOC removal was determined under these optimum operating conditions.

2. Results and Discussion

2.1. Preliminary Studies

Figure 1 shows the photocatalytic mineralization efficiencies of bare and modified TiO2 photocatalysts including anatase TiO2, rutile TiO2, P25 TiO2, as-synthesized TiO2, Ag/TiO2, TiO2/Fe2O3, and Ag/TiO2/Fe2O3 after 3 h of visible light illumination. Results indicate an improvement on the photocatalytic activity under visible light and specific surface area of modified TiO2 after metal doping and combining with another semiconductor (Ag/TiO2/Fe2O3), where the largest specific surface area presented highest photocatalytic activity under visible light illumination as compared to that of the visible-light-inactive commercial TiO2 in treating an actual confectionery wastewater. A similar trend in the photocatalytic efficiencies was also observed in the previous work performed by Nasirian [26], where the same photocatalyst was found to be the most efficient in treating synthetic textile wastewater under UV-A.

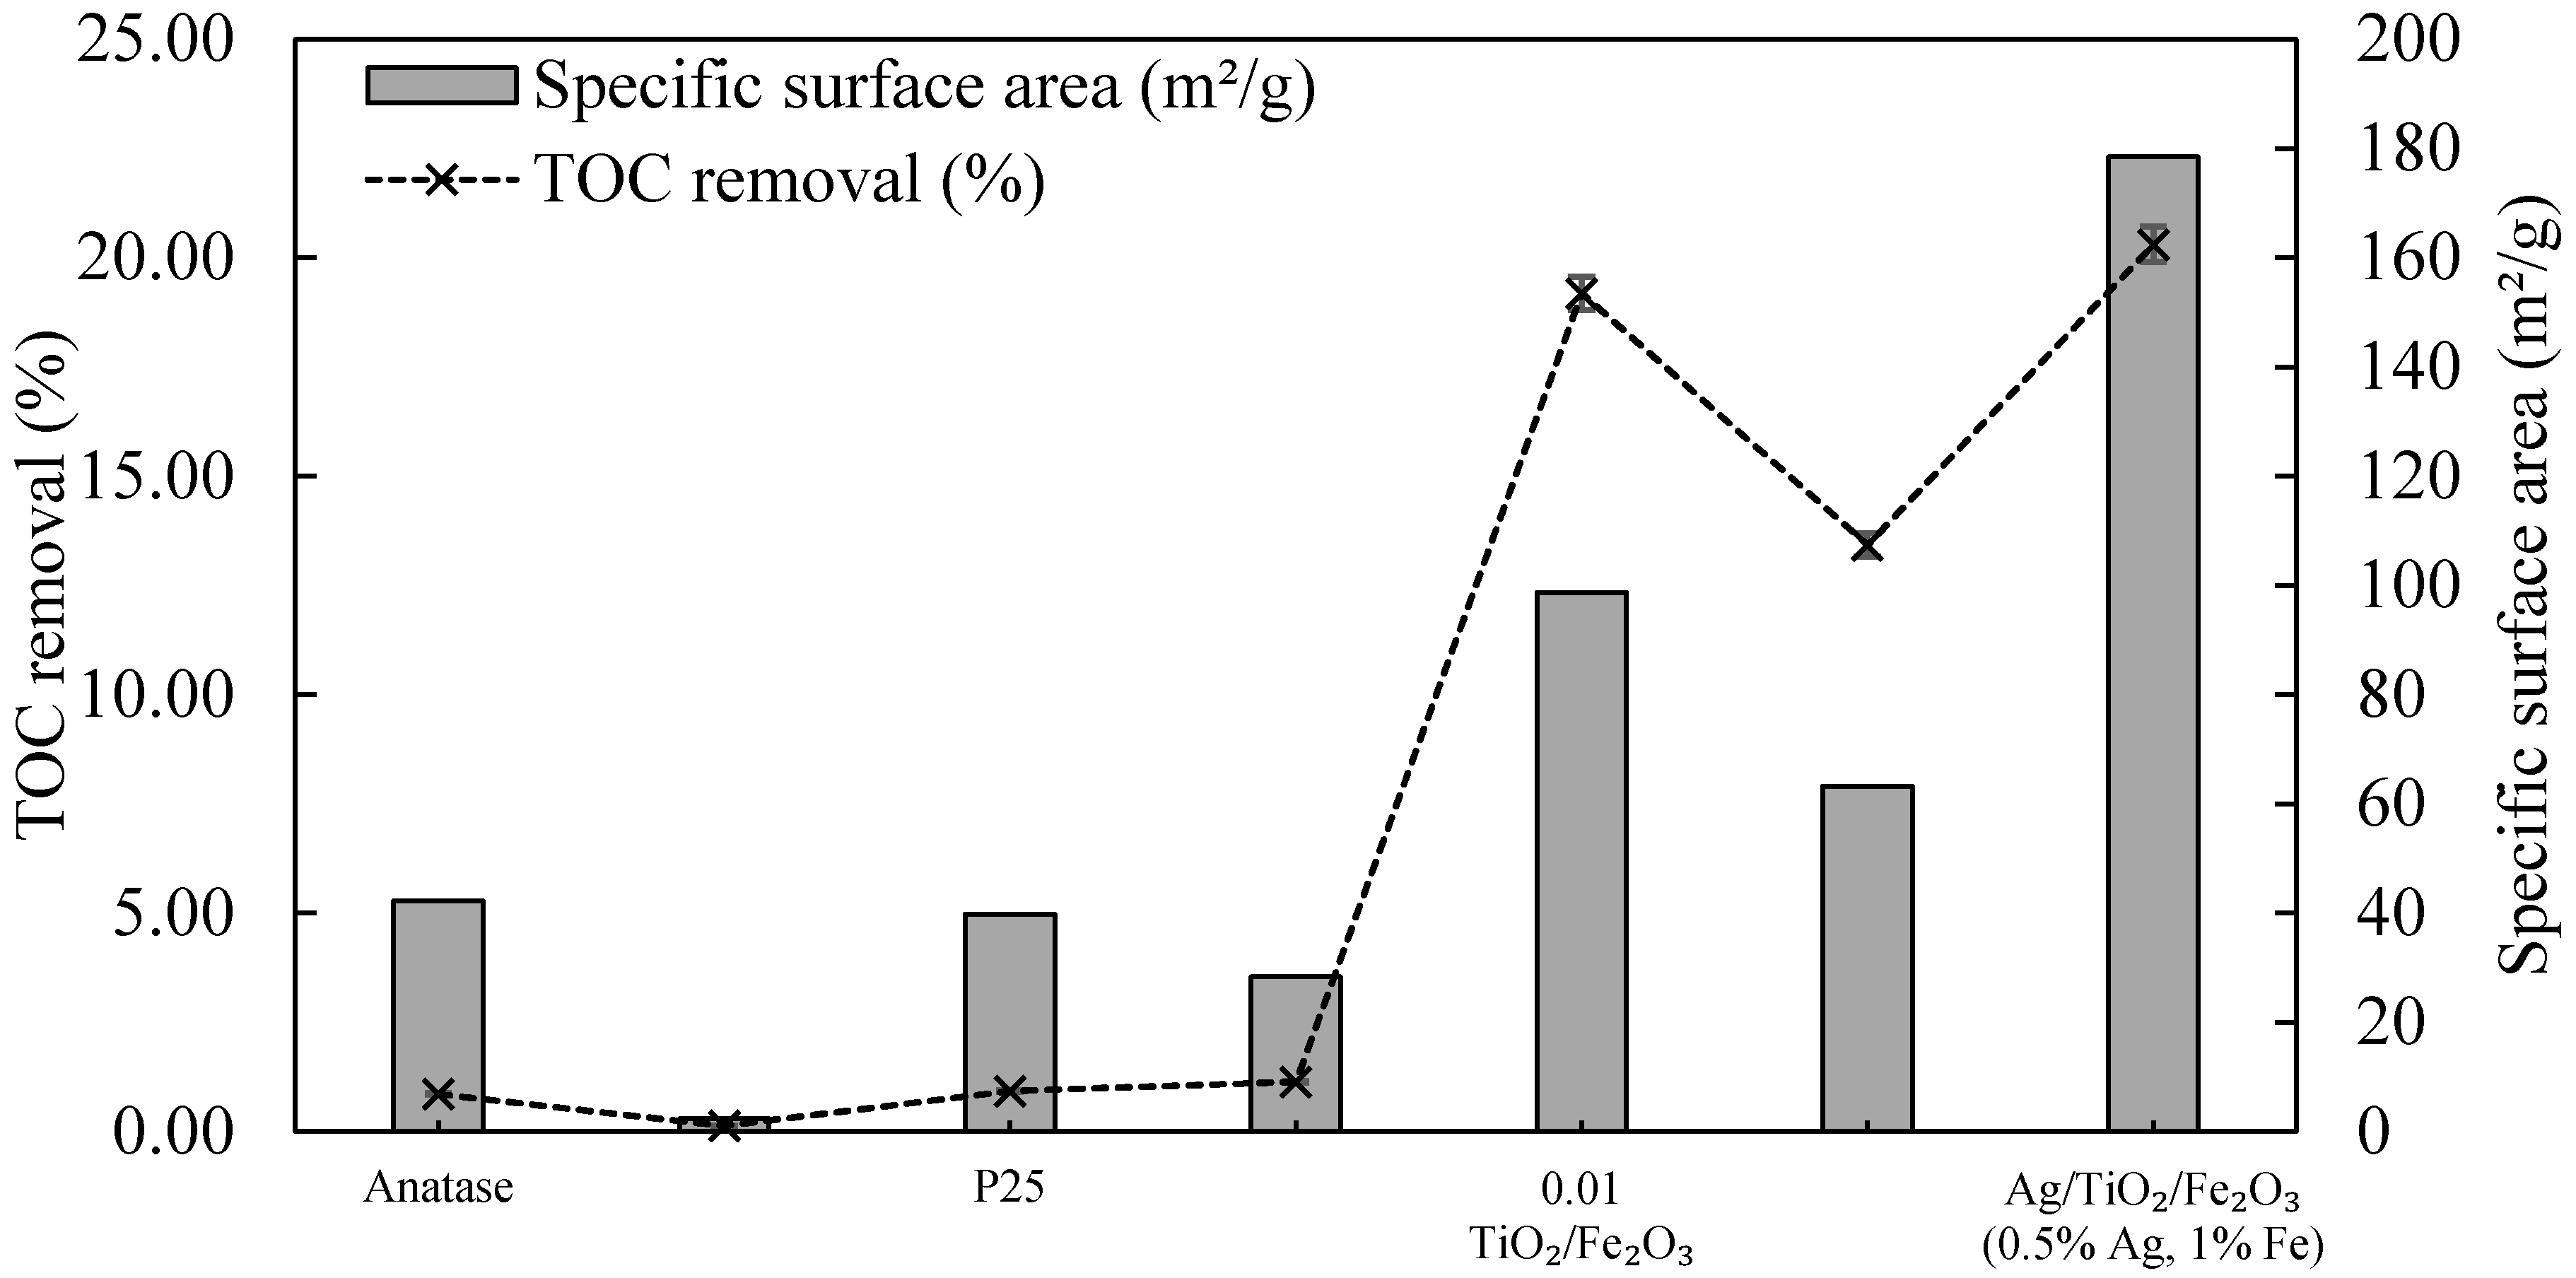
2.2. Photocatalyst Characterization

Figure 2a is the scanning electron microscopy (SEM) image of Ag/TiO2/Fe2O3 (0.5 wt% Ag/TiO2 and 1.0 wt% Fe/TiO2) showing heterogeneous shaped particles with variable particle sizes with the range of 0.5–5 µm. The microparticles were irregular in shape and randomly organized with rough morphology. Rough particle morphology has been reported to contribute to the enhancement of the adsorption of target pollutants onto the photocatalyst surface during photocatalytic process of aqueous organic degradation [19,33].
Figure 2b is the energy dispersive X-ray spectroscopy (EDS) chemical composition analysis of the Ag/TiO2/Fe2O3 photocatalyst. The actual ratio of Fe:TiO2 was found at 0.7 wt%, which was lower than the expected ratio of 1 wt% Fe:TiO2. In contrast, the actual ratio of Ag:TiO2 could not be determined as the detection limit of the instrument was at 0.1 wt%, which is larger than the expected amount of 0.5 wt% Ag/TiO2. Figure 2c illustrates the X-ray diffractogram of the Ag/TiO2/Fe2O3 (0.005 Ag:TiO2 w:w and 0.01 Fe:TiO2 w:w); the crystalline phases were confirmed with the standard diffractograms in the Joint Committee on Powder Diffraction Standards (JCPDS-21-1272) databank. Primary anatase and rutile TiO2 phases were observed with 2θ peaks at 25.3° and 27.4°, respectively. In contrast to the work performed by Nasirian [26] where only anatase phase was observed in Ag/TiO2/Fe2O3, rutile phase was also observed in all prepared TiO2 after calcination at 300 °C. Other peaks of anatase TiO2 were located at 38.2°, 48.0°, and 54.3°. Other peaks of rutile TiO2 were located at 36.0°, 41.2°, 44.1°, and 56.6°. The generation of rutile phase under transition temperature was caused by the high titanium precursor concentration positively affecting the rutile content [33,34]. Moreover, a small 2θ peak representing Fe2O3 at 39.28° indicated a low concentration of Fe2O3 phase presented in the Ag/TiO2/Fe2O3 photocatalyst.
The specific surface area of the conventional TiO2, as-prepared TiO2, TiO2/Fe2O3, Ag/TiO2, and Ag/TiO2/Fe2O3 is illustrated in Figure 1 with the greatest being 178.48 m2/g for Ag/TiO2/Fe2O3 and lowest being 2.32 m2/g for rutile TiO2. Specific surface area of other photocatalyst were 42.27 m2/g for anatase TiO2, 39.80 m2/g for P25 TiO2, 28.36 m2/g for as-prepared TiO2, 98.69 m2/g for TiO2/Fe2O3, and 63.20 m2/g for Ag/TiO2. The incorporation of Fe2O3 into TiO2 crystalline structure forms TiO2-Fe2O3 heterojunction, increasing the specific surface area of the photocatalyst. Moreover, the surface doping of Ag onto TiO2 modified the surface structure of the photocatalyst, decreasing the anatase grain size and increasing the specific surface area of the photocatalyst at relatively low concentrations of Ag/TiO2 [35]. However, excess silver would cover up the surface of the photocatalyst leading to the reduction in the concentration of photogenerated charge carrier and hinder the contact between TiO2 and organic pollutants [9,26,35]. As photocatalytic reactions take place on the surface of the photocatalyst, the photocatalysts tend to have higher activity when higher specific surface area presents owing to the higher number of active sites available for reactions. At the same time, visible light activity is limited in the bare TiO2, while the modification of TiO2 with a metal and a semi-conductor element greatly increases its activity in the visible region along with its specific surface area.

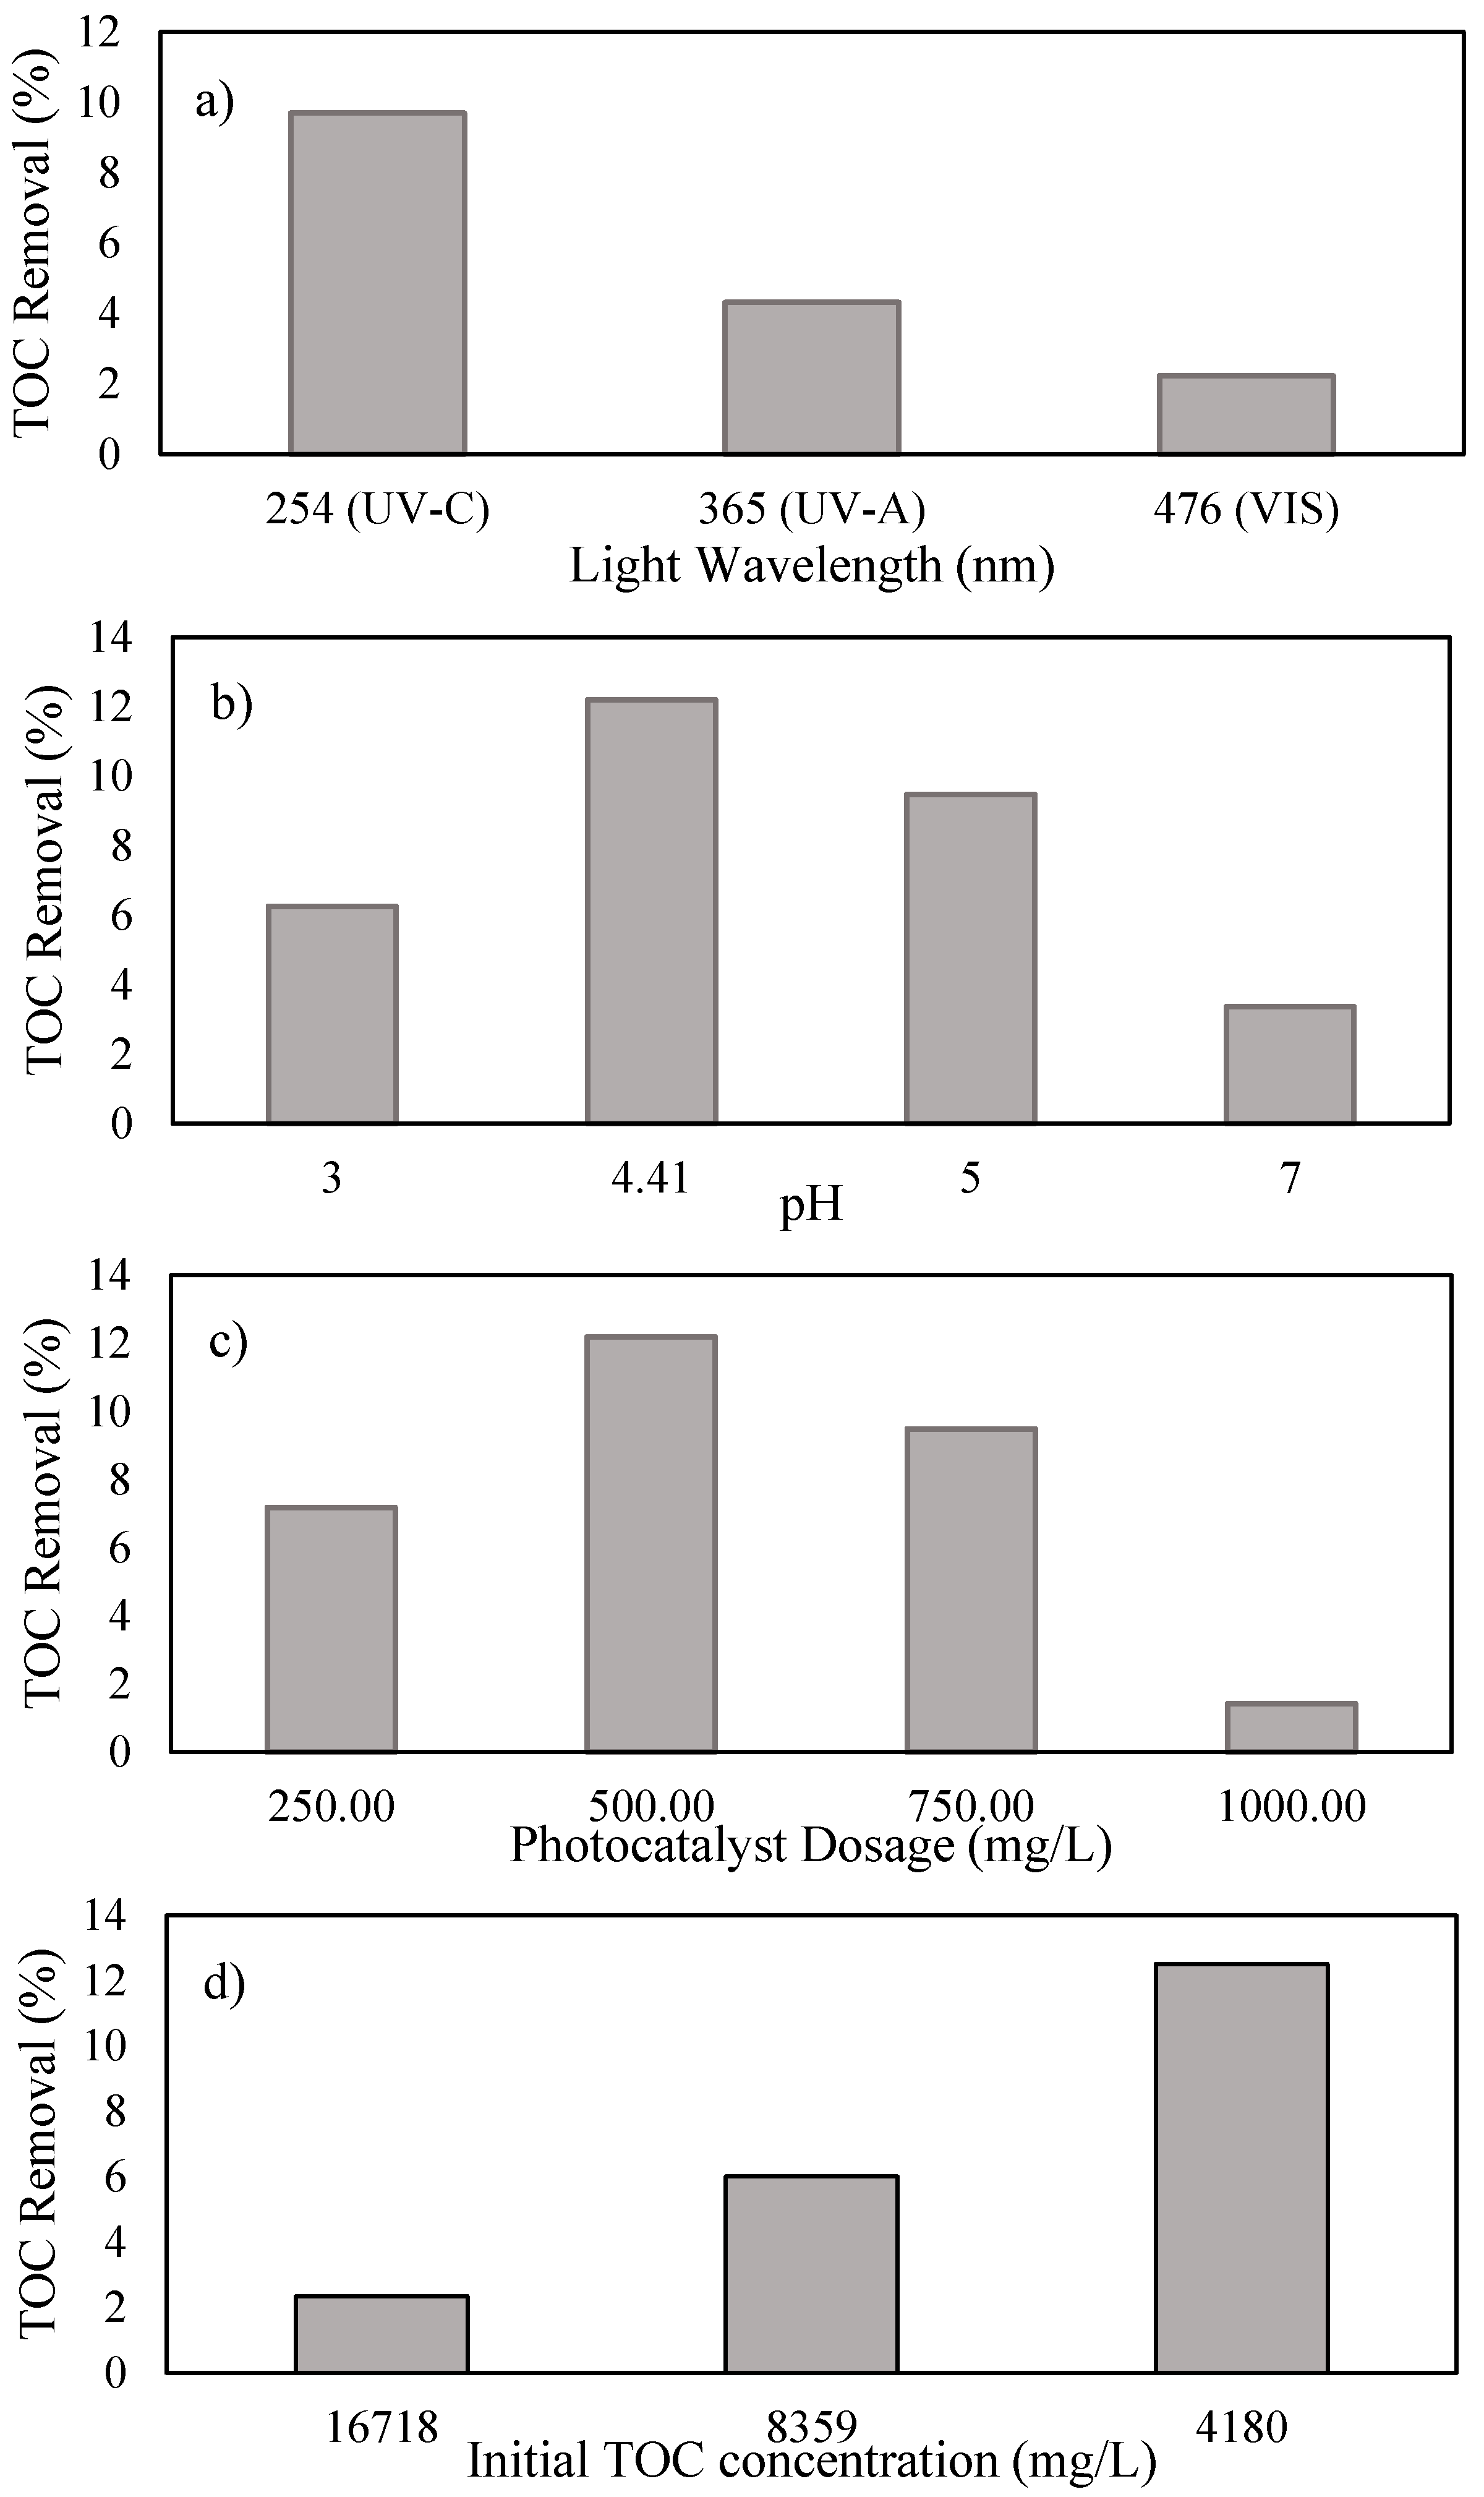
2.3. Effects of Individual Factors

Several factors affect the photocatalytic efficiency for the degradation of aqueous organics during the photocatalytic process. Among those, pH, photocatalyst dosage, initial TOC concentration, and irradiation wavelength are the greatest contributors to the process. Figure 3a shows that the Ag/TiO2/Fe2O3 photocatalyst has higher activity under UV-C irradiation as compared to that of visible light illumination. This effect is generally contributed by the higher photon energy provided by UV-C as compared to that of UV-A and visible light. Figure 3b depicts the optimum pH of the photocatalytic reactions at 4.41, which further indicated that pH adjustment was not required before photocatalytic reactions. Results in Figure 3c illustrate the optimum photocatalyst dosage of 500 mg/L. The photocatalyst dosing above such concentration would increase the turbidity of the slurry causing photocatalytic efficiency to reduce due to lower light transmission. In addition, a reduction in treatment efficiency was experienced when the photocatalyst dosage was lower than such concentration, which potentially led to lower amount of hydroxyl radical formation. Figure 3d shows the inverse proportionality between TOC removal rates and initial TOC concentrations under constant photocatalyst dosage, which is mainly due to the abundancy of organic molecules as compared to that of the short-lived hydroxyl radicals formed during photocatalysis.

2.4. Statistical Analysis

Table 1 demonstrates the four-factor BBD with experimental and predicted TOC removal results designed by the developed quadratic statistical model. The levels of each factor were determined from factorial study. As the TOC concentrations of actual wastewater differed from day to day basis, one sample of actual wastewater was utilized in all experiments in the statistical design of the experiment. Hence, the developed quadratic model of the photocatalytic degradation process of the actual confectionery wastewater in terms of coded factors is governed by:
Y = 8.26 0.99 X 1 + 1.06 X 2 0.72 X 3 0.82 X 4 2.63 X 1 X 2 + 1.12 X 1 X 3 + 1.7 X 1 X 4 0.39 X 2 X 3 0.56 X 2 X 4 0.34 X 3 X 4 0.068 X 1 2 3.30 X 2 2 3.60 X 3 2 2.18 X 4 2
In this model, negative coefficients corresponded to unfavorable effects on the TOC removal for X1, X3, X4, X1X2, X2X3, X2X4, X3X4, X12, X22, X32, and X42; whilst positive coefficients corresponded to favorable effects on the TOC removal for X2, X1X3, and X1X4. Parameters with coefficients close to zero indicated a lower effect on the TOC removal than that of larger coefficients under the same magnitude of change in that certain factor. Thus, X12, X2X3, and X3X4 did not significantly affect the TOC removal when these factors were changed accordingly.
The statistical significance of the developed model and predictors was evaluated using the analysis of variance (ANOVA) with 95% confidence interval (CI) of the TOC removal, as shown in Table 2. The significance of each factor coefficient was determined using probability values (p-values) from Fisher’s (F) exact test, where p < 0.05 indicated a significant model or predictor while p > 0.05 indicated non-significance. In this study, the predictor terms X2X3, X3X4, and X12 were not significant in the response, which indicated that changes in these variables would not significantly affect the overall TOC removal based on this model. The determination coefficient (R2) of 0.9918 and the adjusted R2 of 0.9837 ensured a high significance of the developed model, as R2 and adjusted R2 close to 1.0 were desired [8,10,17]. The insignificant lack of fit (p > 0.05), suggested that the developed statistical model fitted well with the observed data [8,10,17].
The continuous variance assumption was confirmed graphically using Figure 4a, the plot of predicted response versus the internally studentized residuals, where internally studentized residual values were attained by dividing the residual values by respective standard deviation [8,10]. The sample points in Figure 4a were randomly scattered within outlier detection limits from −3 to +3. Moreover, the observed and predicted response in Figure 4b indicated minor discrepancies and a reasonable agreement between predicted model and observed values. Therefore, the prediction model expressed in Equation (1) is deemed satisfactory.

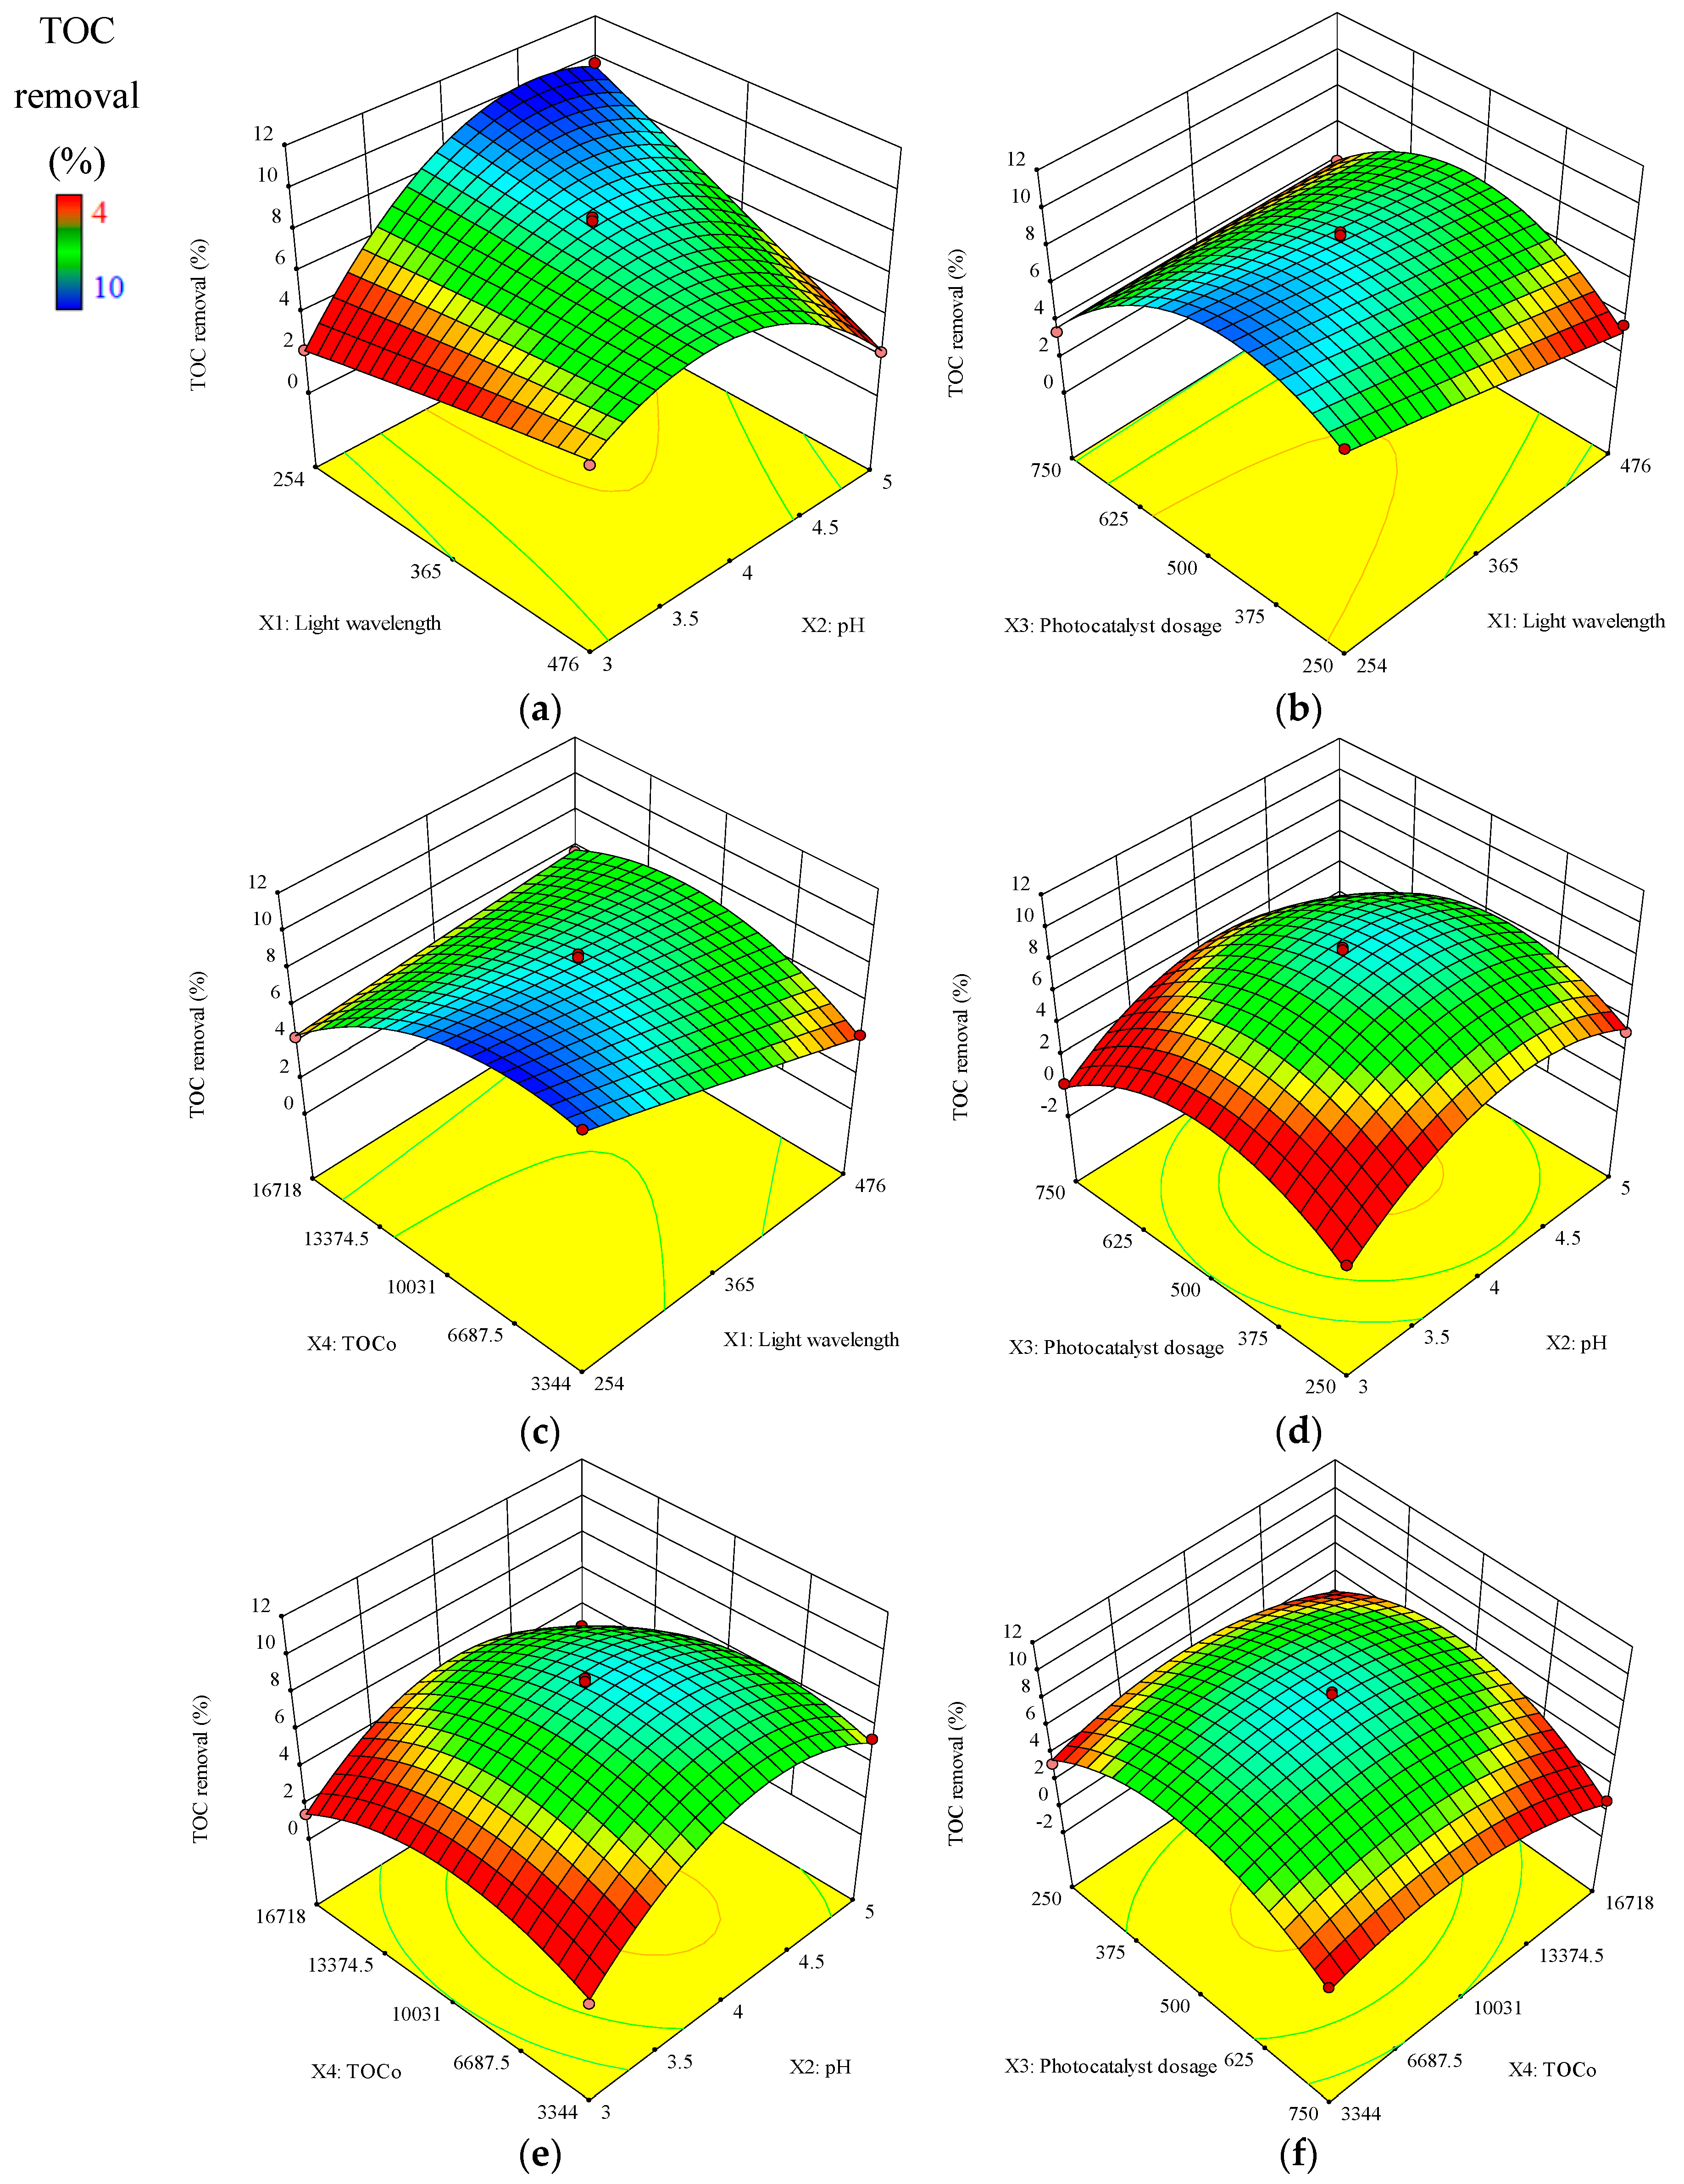
2.5. Interaction between Model Parameters, 2D Contour Plots, and 3D Response Surface

As shown in Table 2, among all model parameters, the interaction between the pH and the photocatalyst dosage (X2X3), the photocatalyst dosage, and the initial TOC concentration (X3X4) did not have significant effects on the TOC removal. In contrast, the interaction between light wavelength and all other three parameters (X1X2, X1X3, and X1X4) and the interaction between the pH and the initial TOC concentration (X2X4) presented significant effects. Thus, the choice of the light wavelength, the pH, and the initial TOC concentration could be optimized to minimize any treatment-related costs, especially for UV-C photoreaction while maintaining high treatment efficiency.
The three-dimensional (3D) surfaces and two-dimensional (2D) contour plots in Figure 5 showed the cross-factor interaction effects between independent predictors for the removal of TOC in photocatalytic treatment of CWW. The response functions of the variation and interaction between two predictor parameters were presented while keeping other parameters fixed at center levels [8,10,17]. Figure 5a–c shows the inverse relationship between the TOC removal and the light wavelength. The interaction between light wavelength and other factors were shown to intensify when the light wavelength was minimized, recommending for the application of UV-C photocatalytic treatment. However, other cross-factor interactions showed convex surfaces representing intensification around center-level of photocatalyst dosage, pH around 4.5, and lowest initial TOC concentration. Results confirm that there is no need for any pH adjustment.

2.6. Optimization of Process Parameters

The RSM was used to maximize the TOC removal (Y) under optimized experimental conditions of the four predictor parameters, including the light wavelength (X1), the pH (X2), the photocatalyst dosage (X3), and the initial TOC concentration (X4). The optimization of these parameters was accomplished using numerical optimization method of BBD built into the statistical software, Design Expert 10.0.3.1, using Equation (1) as the objective function for TOC removal while independent variables were used as constraints in the defined critical ranges. The multiple-response function shown in Equation (1) was used to obtain the interaction plots in Figure 6 while maximizing the TOC removal ( Y ) and desirability value (D). The desirability value was determined by the statistical software based on Equation (6). Hence, the desirability value of 1.00 was achieved while acquiring a TOC removal of 9.78% under optimum conditions of the light wavelength (254 nm; UV-C), the pH (4.68), the photocatalyst dosage (480 mg/L), and the initial TOC concentration (11,126.5 mg/L) for the photocatalytic treatment of CWW using Ag/TiO2/Fe2O3. Finally, the obtained optimum experimental conditions were validated by an extra experiment, which presented 9.42% TOC removal. The observed, experimental TOC removal under optimum conditions was within 95% CI and 5% relative standard deviation (RSD) of the predicted value, confirming the accuracy and reliability of the developed model.
The first-order rate constant of the photocatalytic treatment based on the TOC for the CWW under optimum conditions of the light wavelength of 254 nm, the pH of 4.68, the photocatalyst dosage of 480.0 mg/L, and the initial TOC concentration of 11,126.5 mg/L was determined from Figure 7. The relationship between natural-log of the ratio between TOC concentrations and the time of the photocatalytic treatment process was modeled by a linear function based on Equation (4). As listed in Table 3, the first-order rate constant and the coefficient of determination (R2) (0.0005 min−1 and 0.998 for Ag/TiO2/Fe2O3; and 0.0004 min−1 and 0.995 for commercial P25 TiO2 photocatalyst, respectively) presented an improvement in photocatalytic efficiency in the modified photocatalyst as compared to that of commercial photocatalyst under optimized experimental conditions. In addition, an excellent linearity of photocatalytic treatment process representing high fitness of the rate model was obtained.

3. Materials and Methods

3.1. Materials

Analytical grade chemical materials, including anatase TiO2, ethylene glycol (C2H6O2), iron (III) nitrate nonahydrate (Fe(NO3)3·9H2O), P25 TiO2, rutile TiO2, silver nitrate (AgNO3), and titanium butoxide (Ti(OBu)4), were purchased from Sigma-Aldrich (Oakville, ON, Canada) and Van Waters and Nat Rogers (VWR) Canada (Mississauga, ON, Canada).

3.2. Photocatalyst Preparation

The synthesis of Ag/TiO2/Fe2O3 was accomplished through a series of synthesis processes based on the study conducted previously [26,36]. First, the sol-gel synthesis of TiO2 from 30 mL of titanium butoxide and 30 mL of ethylene glycol was carried out at the temperature of 180 °C under constant mixing at 400 rpm, provided by a magnetic stirrer-heater for 2 h [24,26]. Then, the combination of Fe2O3 and TiO2 with 1 wt% Fe:TiO2 was accomplished through UV-assisted thermal synthesis using 1 mL of 0.3 M Fe(NO3)3·9H2O in ethanol, 9 mL of H2O, and 1.5 g of as-synthesized TiO2 reacting under UV-C radiation of 18 W at 95 °C under constant mixing of 400 rpm for 6 h. Finally, silver (Ag) was incorporated onto TiO2/Fe2O3 through UV-assisted thermal synthesis using 0.0157 g of AgNO3 with 10 mL of H2O and 2 g of as-synthesized TiO2/Fe2O3 for 8 h to achieve the mass ratio of 0.5 wt% Ag:TiO2. All prepared photocatalysts were centrifuged; washed with ethanol and water; dried at 105 °C for 4 h; and finally calcined at 300 °C for 6 h.

3.3. Photocatalyst Characterization

The crystalline structure and conversion phase of the photocatalysts were determined by X-ray diffraction (XRD) (PANalytical X’pert PRO, St. Laurent, QC, Canada). The specific areas were measured using N2 adsorption-desorption isotherms at 77 K (Quantachrome Nova e1200, Boynton Beach, FL, USA) incorporating the Brunauer-Emmet and Teller (BET) method. Topography and crystal structures were determined using SEM (JEOL JSM-6370 LV, Calgary, AB, Canada,). Elemental analysis was performed using EDS (Oxford Instrument X-Max-N-80, Concord, MA, USA). All instruments were calibrated accordingly prior to their usage.

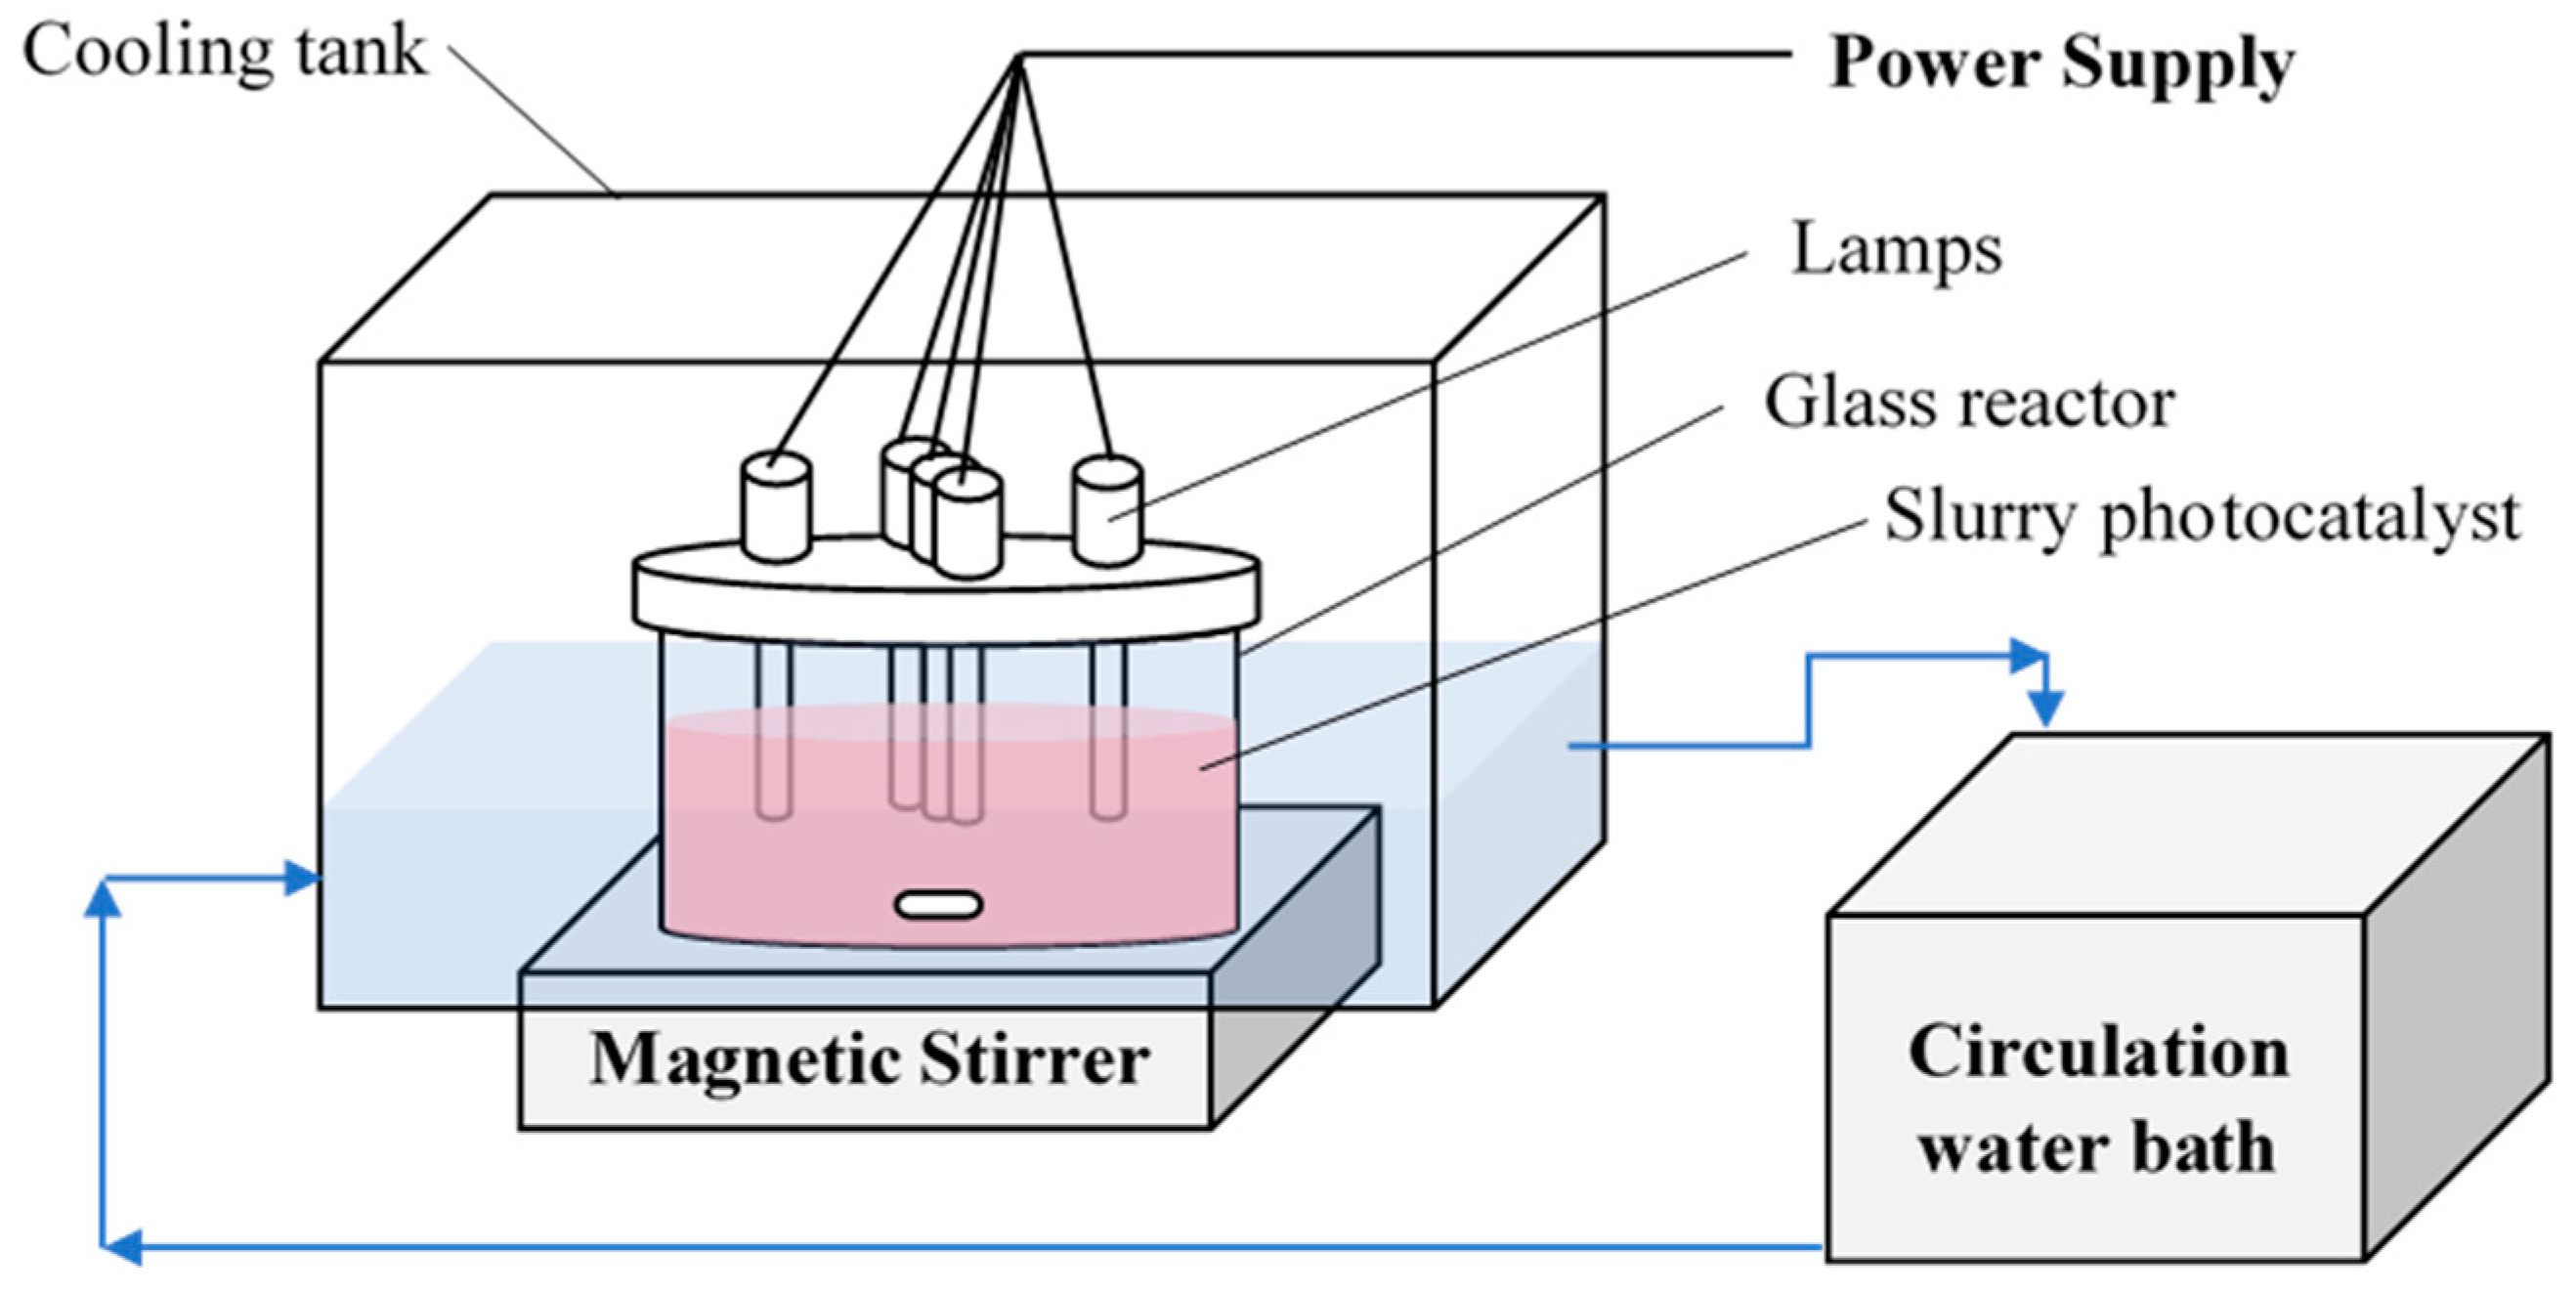
3.4. Photocatalytic Activity Measurement

The photocatalytic reactions were carried out in a batch photoreactor under constant mixing. As shown in Figure 8, the experimental setup consisted of a 3.5 L cylindrical glass container, five UV lamps or five visible light lamps, and a circulating water bath (NESLAB Instruments Inc. RTE-211, Newington, NH, USA). The source of irradiation was varied according to experimental conditions and included lamps with center peak wavelengths at 254 nm for UV-C (PL-S 9W/TUV-UV Germicide, 110–120 V), 365 nm for UV-A (Philips BL PL-S 9 W 110–120 V, 2P Actinic, Markham, ON, Canada), and 476 nm for visible (PL-2PIN 9 W 110–120 V) lamps, respectively. All lamps were placed vertically on the top of the reactor. The water bath was used to maintain the reactor at 25 °C throughout the entire experiment. The exterior of the cooling water tank was covered with aluminum foil to reflect UV radiation and to prevent exposure of UV radiation to the laboratory environment.
A slurry containing the actual confectionery wastewater, picked up from a confectionery manufacturer in Greater Toronto Area, Ontario, Canada, and photocatalyst was stirred in dark condition for 30 min to reach equilibrium prior to photocatalytic reactions. The samples were centrifuged at 5000 rpm for 20 min (Thermo Scientific Heraeus Multifuge X1, Mississauga, ON, Canada) to remove the photocatalyst particles prior to TOC measurements. The concentrations of organic materials were measured using a total organic carbon (TOC) analyzer (Teledyne Tekmar model Apollo 9000, Mason, OH, USA). Percent TOC removal was determined by:
T O C r e m o v a l ( % ) = T O C 0 T O C T O C 0 × 100
where TOC0 is the initial TOC concentration (mg/L) and TOC is the final TOC concentration after 3 h of the photocatalytic reaction (mg/L). During each batch process, the reaction rate-limited condition was controlled under sufficient mixing of the slurry to improve the mass transfer rate of organic constituents to the surface of the photocatalyst. The photocatalytic reaction was modeled by a first-order reaction-rate based on TOC as follows [37]:
d T O C d t = R T O C
where RTOC is the first order rate of TOC removal. The rate of TOC reduction in a batch system can be expressed by the first-order model as follows:
ln ( T O C T O C 0 ) = k t
where TOC is the TOC concentration of samples taken at different reaction time (mg/L), TOC0 is the initial TOC concentration (mg/L), k’ is the first-order kinetic rate constant (min−1), and t is the reaction time (min).

3.5. Statistical Model

A four-factor BBD with RSM was used to maximize the TOC removal in photocatalytic mineralization of organic compounds in an actual confectionery wastewater. Light wavelength (X1), pH (X2), photocatalyst dosage (X3), and initial TOC concentration (TOC0) (X4) were considered as independent predictor parameters while the TOC removal (Y) was considered as the process response in the Design of Experiment (DOE). Design Expert 10.0.3.1 statistical software (Stat-Ease, Minneapolis, MN, USA) was utilized to optimize the reaction conditions through numerical and graphical methods. The quadratic model (Equation (5)) estimated the parametric coefficients of the statistical model by correlating both predictor parameters and responses using the least-squares regression [8,10,17]:
Y i = β o + i = 1 k β i X i + i = 1 k β i i X i 2 + i = 1 k i = 1 k β i j X i X j + c
In this equation, βo, βi, βii, and βij are the constant, linear, quadratic, and cross-factor interaction coefficients, respectively; Xi and Xj are the coded predictor parameters listed in Table 4; Yi is the response under evaluation; k is the number of predictors of the model; and c is the residual error [8,10]. The significance of the model equation, individual parameters, and the interactions between factors were evaluated through ANOVA with the CI of 95% (α = 0.05). The p-value larger than 0.05 was considered insignificant, whilst the p-value smaller than 0.05 was considered significant. From the experimental data along with the quadratic models, 2D contour plots and 3D surface responses were constructed. Optimized operating conditions along of the quadratic model with its response at maximum TOC removal was developed through numerical and graphical optimization methods and they were validated with additional experimental runs.
The desirability multiple-response approach was utilized to obtain a concurrent objective function in Equation (5) through a combination of desired ranges for each response as shown in Equation (6) [8,10]:
D = ( Y 1 × Y 2 × × d n ) 1 / n = ( i = 1 n Y i ) 1 / n
In this equation, D, Y, and n are the desirability term, response (percent TOC removal), and the total number of process responses, respectively. During simultaneous optimization of the photocatalytic reactions, the response function is required to stay within the desired range; otherwise, the desirability becomes zero.

4. Conclusions

In general, the statistical model developed through RSM combined with a four-factor BBD was found to be reliable for modeling the photocatalytic treatment of CWW using Ag/TiO2/Fe2O3. The accuracy of the developed statistical model was evaluated using ANOVA, demonstrating that the light wavelength, the pH, the photocatalyst dosage, and the initial TOC concentration were significant, independent predictors of the TOC removal. The cross-factor effects between these parameters were also evaluated. The numerical optimization achieved a maximum TOC removal of 9.78% at the light wavelength of 254 nm, the pH of 4.68, the photocatalyst dosage of 480 mg/L, and the initial TOC concentration of 11,126.5 mg/L; while the desirability was maintained at 1.0 within the 95% CI. The experimental validation of numerically optimized condition presented 9.42% TOC removal within 5% relative standard deviation of the predicted value. The optimized condition indicated that no adjustment of pH for the treatment of the actual CWW was required. Therefore, the proposed statistical model successfully described the photo-mineralization of complex pollutant matrix present in the actual CWW under UV-C, and the first-order rate constant could be utilized as a future reference on photoreactor design, process optimization, and scale-up studies. Meanwhile, there is a need in designing a continuous model and simulation of the model along with statistical modeling. However, slurry photocatalysis in a continuous form is difficult to apply at the industrial scale, so there is a need to investigate the immobilization of the modified photocatalyst with reusability studies. Finally, the effect of photocatalytic treatment on improving the biodegradability of an actual CWW could be further studied to help in the design of a photocatalytic treatment system for the pre-treatment of CWW prior to biological treatment.

Author Contributions

Y.P.L. designed and conducted the experiments under supervision of M.M. Both authors made substantial contributions to this manuscript.

Acknowledgments

The financial support of the Natural Sciences and Engineering Research Council of Canada (NSERC) and Ryerson University Faculty of Engineering and Architectural Science Dean’s Research Fund is greatly appreciated.

Conflicts of Interest

The authors declare no conflict of interest. The founding sponsors had no role in the design of the study; in the collection, analyses, or interpretation of data; in the writing of the manuscript, and in the decision to publish the results.

References

  1. Diwani, G.E.; Abd, H.E.; Hawash, S.; Ibiari, N.E.; Rafei, S.E. Treatment of Confectionery and Gum Factory Wastewater Effluent. Adsorpt. Sci. Technol. 2000, 18, 813–821. [Google Scholar] [CrossRef]
  2. Ozgun, H.; Karagul, N.; Dereli, R.K.; Ersahin, M.E.; Coskuner, T.; Ciftci, D.I.; Ozturk, I.; Altinbas, M. Confectionery industry: A case study on treatability-based effluent characterization and treatment system. Water Sci. Technol. 2012, 66, 15–20. [Google Scholar] [CrossRef] [PubMed]
  3. Beal, L.J.; Raman, D.R. Sequential Two-stage Anaerobic Treatment of Confectionery Wastewater. J. Agric. Eng. Res. 2000, 76, 211–217. [Google Scholar] [CrossRef]
  4. Sang, Z.; Jiang, Y.; Tsoi, Y.K.; Leung, K.S. Evaluating the environmental impact of artificial sweeteners: A study of their distributions, photodegradation and toxicities. Water Res. 2014, 52, 260–274. [Google Scholar] [CrossRef] [PubMed]
  5. Scheurer, M.; Schmutz, B.; Happel, O.; Brauch, H.; Wulser, R.; Storck, F.R. Transformation of the artificial sweetener acesulfame by UV light. Sci. Total Environ. 2014, 481, 425–432. [Google Scholar] [CrossRef] [PubMed]
  6. Lubick, N. Artificial sweetener persists in the environment. Environ. Sci. Technol. 2008, 42, 3125. [Google Scholar] [CrossRef] [PubMed]
  7. Mead, R.N.; Morgan, J.B.; Brooks Avery, G.; Kieber, R.J.; Kirk, A.M.; Skrabal, S.A.; Willey, J.D. Occurrence of the artificial sweetener sucralose in coastal and marine waters of the United States. Mar. Chem. 2009, 116, 13–17. [Google Scholar] [CrossRef]
  8. Bustillo-Lecompte, C.F.; Mehrvar, M. Treatment of an actual slaughterhouse wastewater by integration of biological and advanced oxidation processes: Modeling, optimization, and cost-effectiveness analysis. J. Environ. Manag. 2016, 182, 651–666. [Google Scholar] [CrossRef] [PubMed]
  9. Nasirian, M.; Bustillo-Lecompte, C.F.; Mehrvar, M. Photocatalytic efficiency of Fe2O3/TiO2 for the degradation of typical dyes in textile industries: Effect of calcination temperature and UV-assisted thermal synthesis. J. Environ. Manag. 2017, 196, 487–498. [Google Scholar] [CrossRef] [PubMed]
  10. Nasirian, M.; Bustillo-Lecompte, C.F.; Lin, Y.P.; Mehrvar, M. Optimization of the Photocatalytic Activity of N-Doped TiO2 for the Photocatalytic Degradation of Methyl Orange. Desalin. Water Treat. 2018, 110, 193–208. [Google Scholar] [CrossRef]
  11. Shi, W.; Yang, W.; Li, Q.; Gao, S.; Shang, P.; Shang, J.K. The synthesis of nitrogen/sulfur co-doped TiO2 nanocrystals with a high specific surface area and a high percentage of 001 facets and their enhanced visible-light photocatalytic performance. Nanoscale Res. Lett. 2012, 7, 1–9. [Google Scholar] [CrossRef] [PubMed]
  12. Huang, L.; Fu, W.; Zong, B.; Liu, H.; Bala, H.; Wang, X.; Sun, G.; Cao, J.; Zhang, Z. Facile and large-scale preparation of N-doped TiO2 photocatalyst with high visible light photocatalytic activity. Mater. Lett. 2017, 209, 585–588. [Google Scholar] [CrossRef]
  13. Nasirian, M.; Lin, Y.P.; Bustillo-Lecompte, C.F.; Mehrvar, M. Enhancement of photocatalytic activity of titanium dioxide using non-metal doping methods under visible light: A review. Int. J. Environ. Sci. Technol. 2018, 15, 2009–2032. [Google Scholar] [CrossRef]
  14. Wang, S.Q.; Lin, W.B.; Fu, P.; Cheng, W.L. Enhanced photoactivity of N-doped TiO2 for Cr(VI) removal: Influencing factors and mechanism. Korean J. Chem. Eng. 2017, 34, 1584–1590. [Google Scholar] [CrossRef]
  15. Alsharaeh, E.H.; Bora, T.; Soliman, A.; Ahmed, F.; Bharath, G.; Ghoniem, M.G.; Abu-Salah, K.M.; Dutta, J. Sol-Gel-Assisted Microwave-Derived Synthesis of Anatase Ag/TiO2/GO hybrids toward Efficient Visible Light Phenol Degradation. Catalysts 2017, 7, 133. [Google Scholar] [CrossRef]
  16. Ali, I.; Kim, J. Continuous-Flow Photocatalytic Degradation of Organics Using Modified TiO2 Nanocomposites. Catalysts 2018, 8, 43. [Google Scholar] [CrossRef]
  17. Li, L.; Ma, Q.; Wang, S.; Song, S.; Li, B.; Guo, R.; Cheng, X.; Cheng, Q. Photocatalytic Performance and Degradation Mechanism of Aspirin by TiO2 through Response Surface Methodology. Catalysts 2018, 8, 118. [Google Scholar] [CrossRef]
  18. Devadi, M.A.H.; Krishna, M.; Narisimha Murthy, H.N.; Sathyanarayana, B.S. Statistical Optimization for Photocatalytic Degradation of Methylene Blue by Ag-TiO2 Nanoparticles. Procedia Mater. Sci. 2014, 5, 612–621. [Google Scholar] [CrossRef]
  19. Subramonian, W.; Wu, T.Y.; Chai, S.P. Photocatalytic degradation of industrial pulp and paper mill effluent using synthesized magnetic Fe2O3-TiO2: Treatment efficiency and characterization of reused photocatalyst. J. Environ. Manag. 2017, 187, 298–310. [Google Scholar] [CrossRef] [PubMed]
  20. Zaleska, A. Doped-TiO2: A Review. Recent Pat. Eng. 2008, 2, 157–164. [Google Scholar] [CrossRef]
  21. Umebayashi, T.; Yamaki, T.; Itoh, H.; Asai, K. Analysis of electronic structures of 3d transition metal-doped TiO2 based on band calculations. J. Phys. Chem. Solids 2002, 63, 1909–1920. [Google Scholar] [CrossRef]
  22. Kassahun, S.K.; Kiflie, Z.; Shin, D.W.; Park, S.S.; Jung, W.Y.; Chung, Y.R. Optimization of sol-gel synthesis parameters in the preparation of N-doped TiO2 using surface response methodology. J. Solgel Sci. Technol. 2017, 82, 322–334. [Google Scholar] [CrossRef]
  23. Valentin, C.D.; Pacchioni, G. Trends in non-metal doping of anatase TiO2: B, C, N, and F. Catal. Today 2013, 206, 12–18. [Google Scholar] [CrossRef]
  24. Nasirian, M.; Mehrvar, M. Modification of TiO2 to enhance photocatalytic degradation of organics in aqueous solutions. J. Environ. Chem. Eng. 2016, 4, 4072–4082. [Google Scholar] [CrossRef]
  25. Fiorenza, R.; Bellardita, M.; Scirè, S.; Palmisano, L. Effect of the addition of different doping agents on visible light activity of porous TiO2 photocatalysts. Mol. Catal. 2018, 455, 108–120. [Google Scholar] [CrossRef]
  26. Nasirian, M. Development of a Novel Photocatalyst for the Photocatalytic Treatment of Industrial Wastewater. Ph.D. Thesis, Ryerson University, Toronto, ON, Canada, 2017. [Google Scholar]
  27. Bellardita, M.; El Nazer, H.A.; Loddo, V.; Parrino, F.; Venezia, A.M.; Palmisano, L. Photoactivity under visible light of metal loaded TiO2 catalysts prepared by low frequency ultrasound treatment. Catal. Today 2017, 284, 92–99. [Google Scholar] [CrossRef]
  28. Colmenares, J.C.; Magdziarz, A.; Chemyayeva, O.; Lisovytskiy, D.; Kurzydłowski, K.; Grzonka, J. Sonication-Assisted Low-Temperature Routes for the Synthesis of Supported Fe-TiO2 Econanomaterials: Partial Photooxidation of Glucose and Phenol Aqueous Degradation. ChemCatChem 2013, 5, 2270–2277. [Google Scholar] [CrossRef]
  29. Da Vià, L.; Recchi, C.; Davies, T.E.; Greeves, N.; Lopez-Sanchez, J.A. Visible-Light-Controlled Oxidation of Glucose using Titania-Supported Silver Photocatalysts. ChemCatChem 2016, 8, 3275–3283. [Google Scholar] [CrossRef] [PubMed]
  30. Hinkova, A.; Henke, S.; Bubník, Z.; Pour, V.; Salova, A.; Sluková, M.; Šárka, E. Degradation of Food industrial pollutants by photocatalysis with immobilised titanium dioxide. Innov. Food Sci. Emerg. Technol. 2015, 27, 129–135. [Google Scholar] [CrossRef]
  31. Iervolino, G.; Vaiano, V.; Murcia, J.J.; Rizzo, L.; Ventre, G.; Pepe, G.; Campiglia, P.; Hidalgo, M.C.; Navio, J.A.; Sannino, D. Photocatalytic hydrogen production from degradation of glucose over fluorinated and platinized TiO2 catalysts. J. Catal. 2016, 339, 47–56. [Google Scholar] [CrossRef]
  32. Salarian, A.A.; Hami, Z.; Mirzaei, N.; Mohseni, S.M.; Asadi, A.; Bahrami, M.; Vosoughi, M.; Alinejad, A.; Zare, M. N-doped TiO2 nanosheets for photocatalytic degradation and mineralization of diazinon under simulated solar irradiation: Optimization and modeling using a response surface methodology. J. Mol. Liq. 2016, 220, 183–191. [Google Scholar] [CrossRef]
  33. Carneiro, J.O.; Azevedo, S.; Fernandes, F.; Freitas, E.; Pereira, M.; Tavares, C.J.; Lanceros-Méndez, S.; Teixeira, V. Synthesis of iron-doped TiO2 nanoparticles by ball-milling process: The influence of process parameters on the structural, optical, magnetic, and photocatalytic properties. J. Mater. Sci. 2014, 49, 7476–7488. [Google Scholar] [CrossRef] [Green Version]
  34. Wang, W.K.; Chen, J.J.; Zhang, X.; Huang, Y.X.; Li, W.W.; Yu, H.Q. Self-induced synthesis of phase-junction TiO2 with a tailored rutile to anatase ratio below phase transition temperature. Nature 2016, 6, 20491. [Google Scholar] [CrossRef] [PubMed]
  35. Cao, Y.; Tan, H.; Shi, T.; Tang, T.; Li, J. Preparation of Ag-doped TiO2 nanoparticles for photocatalytic degradation of acetamiprid in water. J. Chem. Technol. Biotechnol. 2008, 83, 546–552. [Google Scholar] [CrossRef]
  36. Nasirian, M.; Mehrvar, M. Photocatalytic degradation of aqueous Methyl Orange using nitrogen doped TiO2 photocatalyst prepared by novel method of UV assisted thermal synthesis. J. Environ. Sci. 2018, 66, 81–93. [Google Scholar] [CrossRef] [PubMed]
  37. Chong, M.N.; Jin, B.; Chow, C.W.; Saint, C. Recent developments in photocatalytic water treatment technology: A review. Water Res. 2010, 44, 2997–3027. [Google Scholar] [CrossRef] [PubMed]
Figure 1. Photocatalytic efficiencies for the mineralization of an actual confectionery wastewater and specific surface area of bare and modified TiO2 under visible light (photocatalyst dosage = 500 mg/L, [TOC0] = 18,700 mg/L, lamp power = 45 W).
Catalysts 08 00409 g001
Figure 2. (a) SEM image; (b) elemental analysis by EDS; and (c) X-ray diffractogram of Ag/TiO2/Fe2O3 (Ag/TiO2 = 0.005 w:w and Fe/TiO2 = 0.01 w:w).
Catalysts 08 00409 g002
Figure 3. (a) Effect of light wavelength on photocatalytic treatment of CWW ([Ag/TiO2/Fe2O3] = 500 mg/L, pH = 4.85 (no adjustment), [TOC0] = 10,031 mg/L); (b) effect of pH on photocatalytic treatment of CWW (light wavelength = 476 nm, [TOC0] = 6900 mg/L, [Ag/TiO2/Fe2O3] = 500 mg/L); (c) effect of photocatalyst dosage on photocatalytic treatment of CWW (light wavelength = 476 nm, pH = 4.41, [TOC0] = 6116.7 mg/L); and (d) effect of initial TOC concentration on photocatalytic treatment of CWW ([Ag/TiO2/Fe2O3] = 500 mg/L, pH = 4.85, light wavelength = 476 nm).
Catalysts 08 00409 g003
Figure 4. Validation of the TOC removal model using (a) internally studentized residuals versus predicted values and (b) observed experimental data versus predicted values.
Catalysts 08 00409 g004
Figure 5. Interaction effects between different parameters on TOC removal analyzed by 3D response surface and 2D contours of: (a) light wavelength and pH (X1X2); (b) light wavelength and photocatalyst dosage (X1X3); (c) light wavelength and TOC0 (X1X4); (d) pH and photocatalyst dosage (X2X3); (e) pH and TOC0 (X2X3); and (f) photocatalyst dosage and TOC0 (X3X4).
Catalysts 08 00409 g005
Figure 6. Desirability 2D plots maximizing TOC removal at optimum levels of studied parameters at light wavelength of 254 nm, pH of 4.68, photocatalyst dosage of 480.0 mg/L, and initial TOC concentration of 11,126.5 mg/L.
Catalysts 08 00409 g006
Figure 7. Photocatalytic treatment of CWW at optimum conditions using Ag/TiO2/Fe2O3 (Ag/TiO2 = 0.005 w:w and Fe/TiO2 = 0.01 w:w) and commercial P25 TiO2 photocatalysts.
Catalysts 08 00409 g007
Figure 8. Experimental set-up of the photocatalysis reaction.
Catalysts 08 00409 g008
Table 1. Four-factor BBD for RSM with observed and predicted TOC removal.
RunFactor 1 (X1)Factor 2 (X2)Factor 3 (X3)Factor 4 (X4)Response (Y) = TOC Removal (%)
Light Wavelength (nm)pHPhotocatalyst Dosage (mg/L)TOC0 (mg/L)ObservedPredicted
1254350010,0312.192.2
2476350010,0315.235.47
3254550010,0319.699.56
4476550010,0312.232.33
5365425033443.373.69
6365475033443.132.92
7365425016,7182.412.73
8365475016,7180.830.61
9254450033449.639.53
10476450033444.244.14
11254450016,7184.374.49
12476450016,7185.785.91
13365325010,0310.980.64
14365525010,0313.283.53
15365375010,0310.19-0.03
16365575010,0310.941.3
17254425010,0317.597.43
18476425010,0313.63.21
19254475010,0313.483.74
20476475010,0313.974
21365350033441.711.98
22365550033445.395.21
23365350016,7181.421.47
24365550016,7182.862.46
25365450010,0318.758.26
26365450010,0317.928.26
27365450010,0317.878.26
28365450010,0318.188.26
29365450010,0318.588.26
Table 2. ANOVA of TOC removal modeled by quadratic modeling in the optimization of photocatalytic activity of Ag/TiO2/Fe2O3 for the treatment of CWW.
SourceSum of SquaresdfaMean SquareF Value bp-Value cRemark
Model233.911416.71121.44<0.0001Significant
X1 = Light wavelength11.8111.885.77<0.0001Significant
X2 = pH13.38113.3897.23<0.0001Significant
X3 = Photocatalyst dosage6.2916.2945.74<0.0001Significant
X4 = TOC081858.17<0.0001Significant
X1X227.56127.56200.34<0.0001Significant
X1X35.0215.0236.47<0.0001Significant
X1X411.56111.5684.02<0.0001Significant
X2X30.610.64.370.0554Not significant
X2X41.2511.259.120.0092Significant
X3X40.4510.453.260.0924Not significant
X120.0310.030.220.6481Not significant
X2270.82170.82514.73<0.0001Significant
X3283.91183.91609.89<0.0001Significant
X4230.7130.7223.12<0.0001Significant
Residual1.93140.14
Lack of Fit1.31100.130.850.6222Not significant
Pure Error0.6240.15
Corrected total SS d235.8428
R20.9918
Adjusted R20.9837
Adequate Precision35.964
a Degrees of freedom (df). b Fisher’s (F) exact test value. c A probability (p) value < 0.05 is considered as significant and >0.05 is considered as not significant. d Total sum of squares corrected for the mean.
Table 3. Rate constant determined from first-order reaction of photocatalytic treatment of CWW using Ag/TiO2/Fe2O3 (Ag/TiO2 = 0.005 w:w and Fe/TiO2 = 0.01 w:w) and P25 TiO2.
PhotocatalystFirst-Order Rate Constant (k’) (min−1)R2
Ag/TiO2/Fe2O30.00050.998
P25 TiO20.00040.995
Table 4. Coded parameters in statistical quadratic model.
PredictorsVariablesCoded Levels
−101
Light wavelength (nm)X1254365476
pHX2345
Photocatalyst dosage (mg/L)X3250500750
TOC0 (mg/L)X4334410,03116,718
Note: The maximum initial TOC concentration was obtained from the collected raw wastewater samples. Other initial TOC concentrations were prepared via dilution of wastewater sample with distilled water. The three levels of light wavelength (X1) refer to different types of light sources with similar photometric intensities that were utilized in this experimental design.

