Article

Experimental Study on the Effect of Hydrogen Sulfide on High-Temperature Proton Exchange Membrane Fuel Cells by Using Electrochemical Impedance Spectroscopy

Department of Mechanical Engineering and Advanced Institute of Manufacturing with High-tech Innovations, National Chung Cheng University, 168, University Rd., Minhsiung Township, Chiayi 62102, Taiwan
*
Author to whom correspondence should be addressed.
Catalysts 2018, 8(10), 441; https://doi.org/10.3390/catal8100441
Submission received: 9 September 2018 / Revised: 28 September 2018 / Accepted: 8 October 2018 / Published: 9 October 2018
(This article belongs to the Special Issue Catalysts for Polymer Membrane Fuel Cells)

Abstract

:
When the fuel supplied to a high-temperature proton exchange membrane fuel cell (HT-PEMFC) is produced by hydrocarbon formation, hydrogen sulfide (H2S) may appear, resulting in decreased cell performance and durability. To study the effects of H2S on the performance and durability of the HT-PEMFC, a series of experiments was conducted. In the first step, the effects of polyvinylidene fluoride (PVDF) and platinum loading on cell performance were investigated and discussed under pure hydrogen operation conditions. Optimal PVDF and platinum compositions in the catalyst layer are suggested. Then, the effect of H2S on membrane electrode assembly (MEA) performance with various platinum loadings was investigated by supplying hydrogen containing 5.2 ppm of H2S to the anode of the MEA. An electrochemical impedance spectroscope was employed to measure the impedance of the MEAs under various operating conditions. Finally, degradation of the MEA when supplied with hydrogen containing 5.2 ppm of H2S was analyzed and discussed. The results suggest that the performance of an MEA with 0.7 mg Pt cm−2 and 10% PVDF can be recovered by supplying pure hydrogen. The rate of voltage decrease is around 300 μV h−1 in the presence of H2S.

1. Introduction

High-temperature proton exchange membrane fuel cells (HT-PEMFCs), which operate at temperatures higher than 100 °C, offer many advantages compared with low-temperature proton exchange membrane fuel cells (LT-PEMFCs), including high CO tolerance, enhanced oxygen reduction reaction kinetics, no humidification requirement, simple water management, and high-quality residual heat. Hence, they are regarded as promising energy conversion devices for combined heat and power applications [1,2,3,4,5]. The performance and durability of a HT-PEMFC depend highly on its membrane electrode assembly (MEA), one of key components of a cell, which comprises a proton exchange membrane, anode and cathode catalyst layers (CLs), and gas diffusion layers (GDLs). A polybenzimidazole (PBI) membrane doped with H3PO4 has been demonstrated to be the most promising PEM for HT-PEMFCs [6,7,8,9,10,11]. The CLs play a key role in the MEA. Many studies related to the CLs used in MEAs are available in the literature [12,13,14].
The CL usually consists of Pt/C catalyst and binder. The most commonly used binder is PBI because it is the same material as that of the membrane. Lobato et al. [13] investigated the influence of carbon/PBI weight ratio on the performance of an HT-PEMFC and suggested a ratio of 20. Mamlouk et al. [8] investigated the effects of polytetrafluoroethylene (PTFE) content in CLs on cell performance. They suggested that both anode and cathode CLs with 40% PTFE content provide optimal cell performance at the operating temperature of 120 °C. Su et al. [10] investigated the effect of CL composition on the performance of an HT-PEMFC, including Pt loadings and binders in the anode and cathode. Their results suggested that an MEA with PVDF as binder performs better than an MEA with PTFE or PBI. Lin et al. [14] used a mixture of PBI and PVDF as the binder in the cathode CL. Their results suggested that the introduction of PVDF into the CL enhanced performance and durability over an operation period of 48 h at 160 °C. The weight ratio of PVDF–PBI–Pt/C was suggested to be 1:5:95.
Usually, the working temperature of HT-PEMFCs ranges between 120 and 180 °C, making them suitable for use with reformed-hydrogen-based fuels [15,16]. When hydrogen is produced by reforming natural gas or biomass [17,18], some byproducts such as CO, CO2, and H2S may accompany hydrogen formation [19], affecting HT-PEMFC performance. These impurities can be tolerated at higher concentrations in HT-PEMFCs compared with in LT-PEMFCs. It has been shown that a few ppm of CO in the fuel causes significant performance loss in an LT-PEMFC owing to CO poisoning of the catalyst surface [20,21,22,23]. On the contrary, HT-PEMFCs can tolerate higher amounts of CO. As a result, the gas purification system and the processing for a HT-PEMFC can be simplified.
Krishnan et al. [24] investigated the CO poisoning effect of an HT-PEMFC by supplying hydrogen fuel with 1 vol % of CO to an HT-PEMFC. Their results showed that the performance loss due to CO poisoning can be recovered by supplying pure H2 to the anode. No performance loss was observed when the HT-PEMFC was operated at 210 °C. Li et al. [25] demonstrated that Poly(2,5-benzimidazole) membrane-based HT-PEMFCs could tolerate up to 3% CO in hydrogen at an operating temperature of 200 °C and current density of 0.8 A cm−2. In addition, they demonstrated the direct use of reformatted hydrogen from a methanol reformer without further CO removal [26].
In contrast to the effect of CO poisoning on PEMFCs, only a few studies regarding the contamination of HT-PEMFC electrodes in the presence of H2S are available in the literature. Schmidt et al. [27] demonstrated a H2S tolerance of at least 10 ppm for an HT-PEMFC. Under certain conditions, the effects of CO and H2S are additive. Adding 1% CO to a 30% H2 feed stream resulted in a cell voltage drop of 15 mV, and this drop could be recovered completely by feeding pure hydrogen. Adding 10 ppm H2S to the hydrogen stream resulted in the same voltage drop; however, the voltage could not be recovered by supplying pure hydrogen. Their experimental results showed the incompletely reversible effect of H2S poisoning on cell voltage. Rau et al. [28] developed bimetallic materials for the anode catalyst of HT-PEMFCs to increase tolerance to H2S. They conducted experiments by using a three-electrode cell to simulate the working environment of HT-PEMFCs. The electrochemical characterization of the catalyst under a gas mixture containing 60% H2 and 40% H2S was evaluated by conducting a cyclic voltammetry test. The results showed that bimetallic catalysts are good alternatives to increase H2S tolerance when compared to Pt/C catalysts.
According to the abovementioned studies, HT-PEMFCs can tolerate H2S up to approximately 10 ppm. However, the mechanism of degradation of an HT-PEMFC in the presence of H2S and the effect of catalyst loading on H2S tolerance have not been investigated adequately. As a result, the present study focuses on the effect of H2S on the performance of HT-PEMFCs. In the first step MEAs with various anode catalyst loadings are fabricated and tested under pure hydrogen operation. Then, the effect of anode catalyst loading on MEA performance is investigated by supplying hydrogen containing 5 ppm of H2S. Electrochemical impedance spectroscopy (EIS) is employed to measure MEA impedance under various operating conditions. Finally, degradation of the MEA supplied with H2S is analyzed and discussed.

2. Results and Discussion

2.1. Effect of Catalyst Composition on MEA Performance

The MEA performance is affected significantly by catalyst composition, including Pt and binder loadings. Su et al. [29] showed that gas diffusion electrodes (GDEs) with PVDF yielded better performance than with PBI or Nafion. Based on Su’s study, the effect of PVDF concentration on the cell performance was investigated in this study. Pt loading for the anode and the cathode were set to 0.5 and 0.7 mg cm−2, respectively, and the effect of PVDF loading on MEA performance is shown in Figure 1. The activation overpotentials of MEAs with PVDF loadings ranging between 5 and 20% were very close. The performance difference between 10% and 15% PVDF loadings was negligible. When the PVDF loading was increased to 25%, the MEA activation overpotential decreased rapidly. This could be due to excessive PVDF covering the electrochemical surface area of the catalyst, resulting in decreased reaction kinetics. In the ohmic region, 25% PVDF could reduce the continuous path for electron transfer in the catalyst layer, resulting in a significant ohmic potential.
The peak power densities of the single cell with PVDF loadings of 5, 10, 15, 20, and 25% were 0.158, 0.195, 0.195, 0.179, and 0.042 W cm−2, respectively. The maximum power densities for all PVDF loadings were observed at the working voltage of 0.4 V. This result is similar to that in Su’s report [29]. As a result, the optimal PVDF loading was determined to be 10% and applied in the subsequent experiments conducted in this study.
Figure 2 shows the polarization curves of the MEAs with different anode Pt loadings when the cathode Pt loading was 0.7 mg cm−2. The polarization curves indicate that MEA performance did not increase significantly when the anode Pt loading was higher than 0.4 mg cm−2. The current densities at 0.6 V were approximately 0.25 A cm−2 when the anode Pt loading was higher than 0.4 mg cm−2. Because the catalyst layer thickness increased with increasing Pt loading, phosphoric acid did not penetrate through the catalyst layer to provide more reactive triple-phase sites. The optimal Pt loading for the anode was 0.4 mg cm−2 in this study. This Pt loading is close to the experimental value reported by Su et al. [29]. Accordingly, the optimal anode Pt loading was determined to be 0.4 mg cm−2, and this value was applied in subsequent experiments in this study.

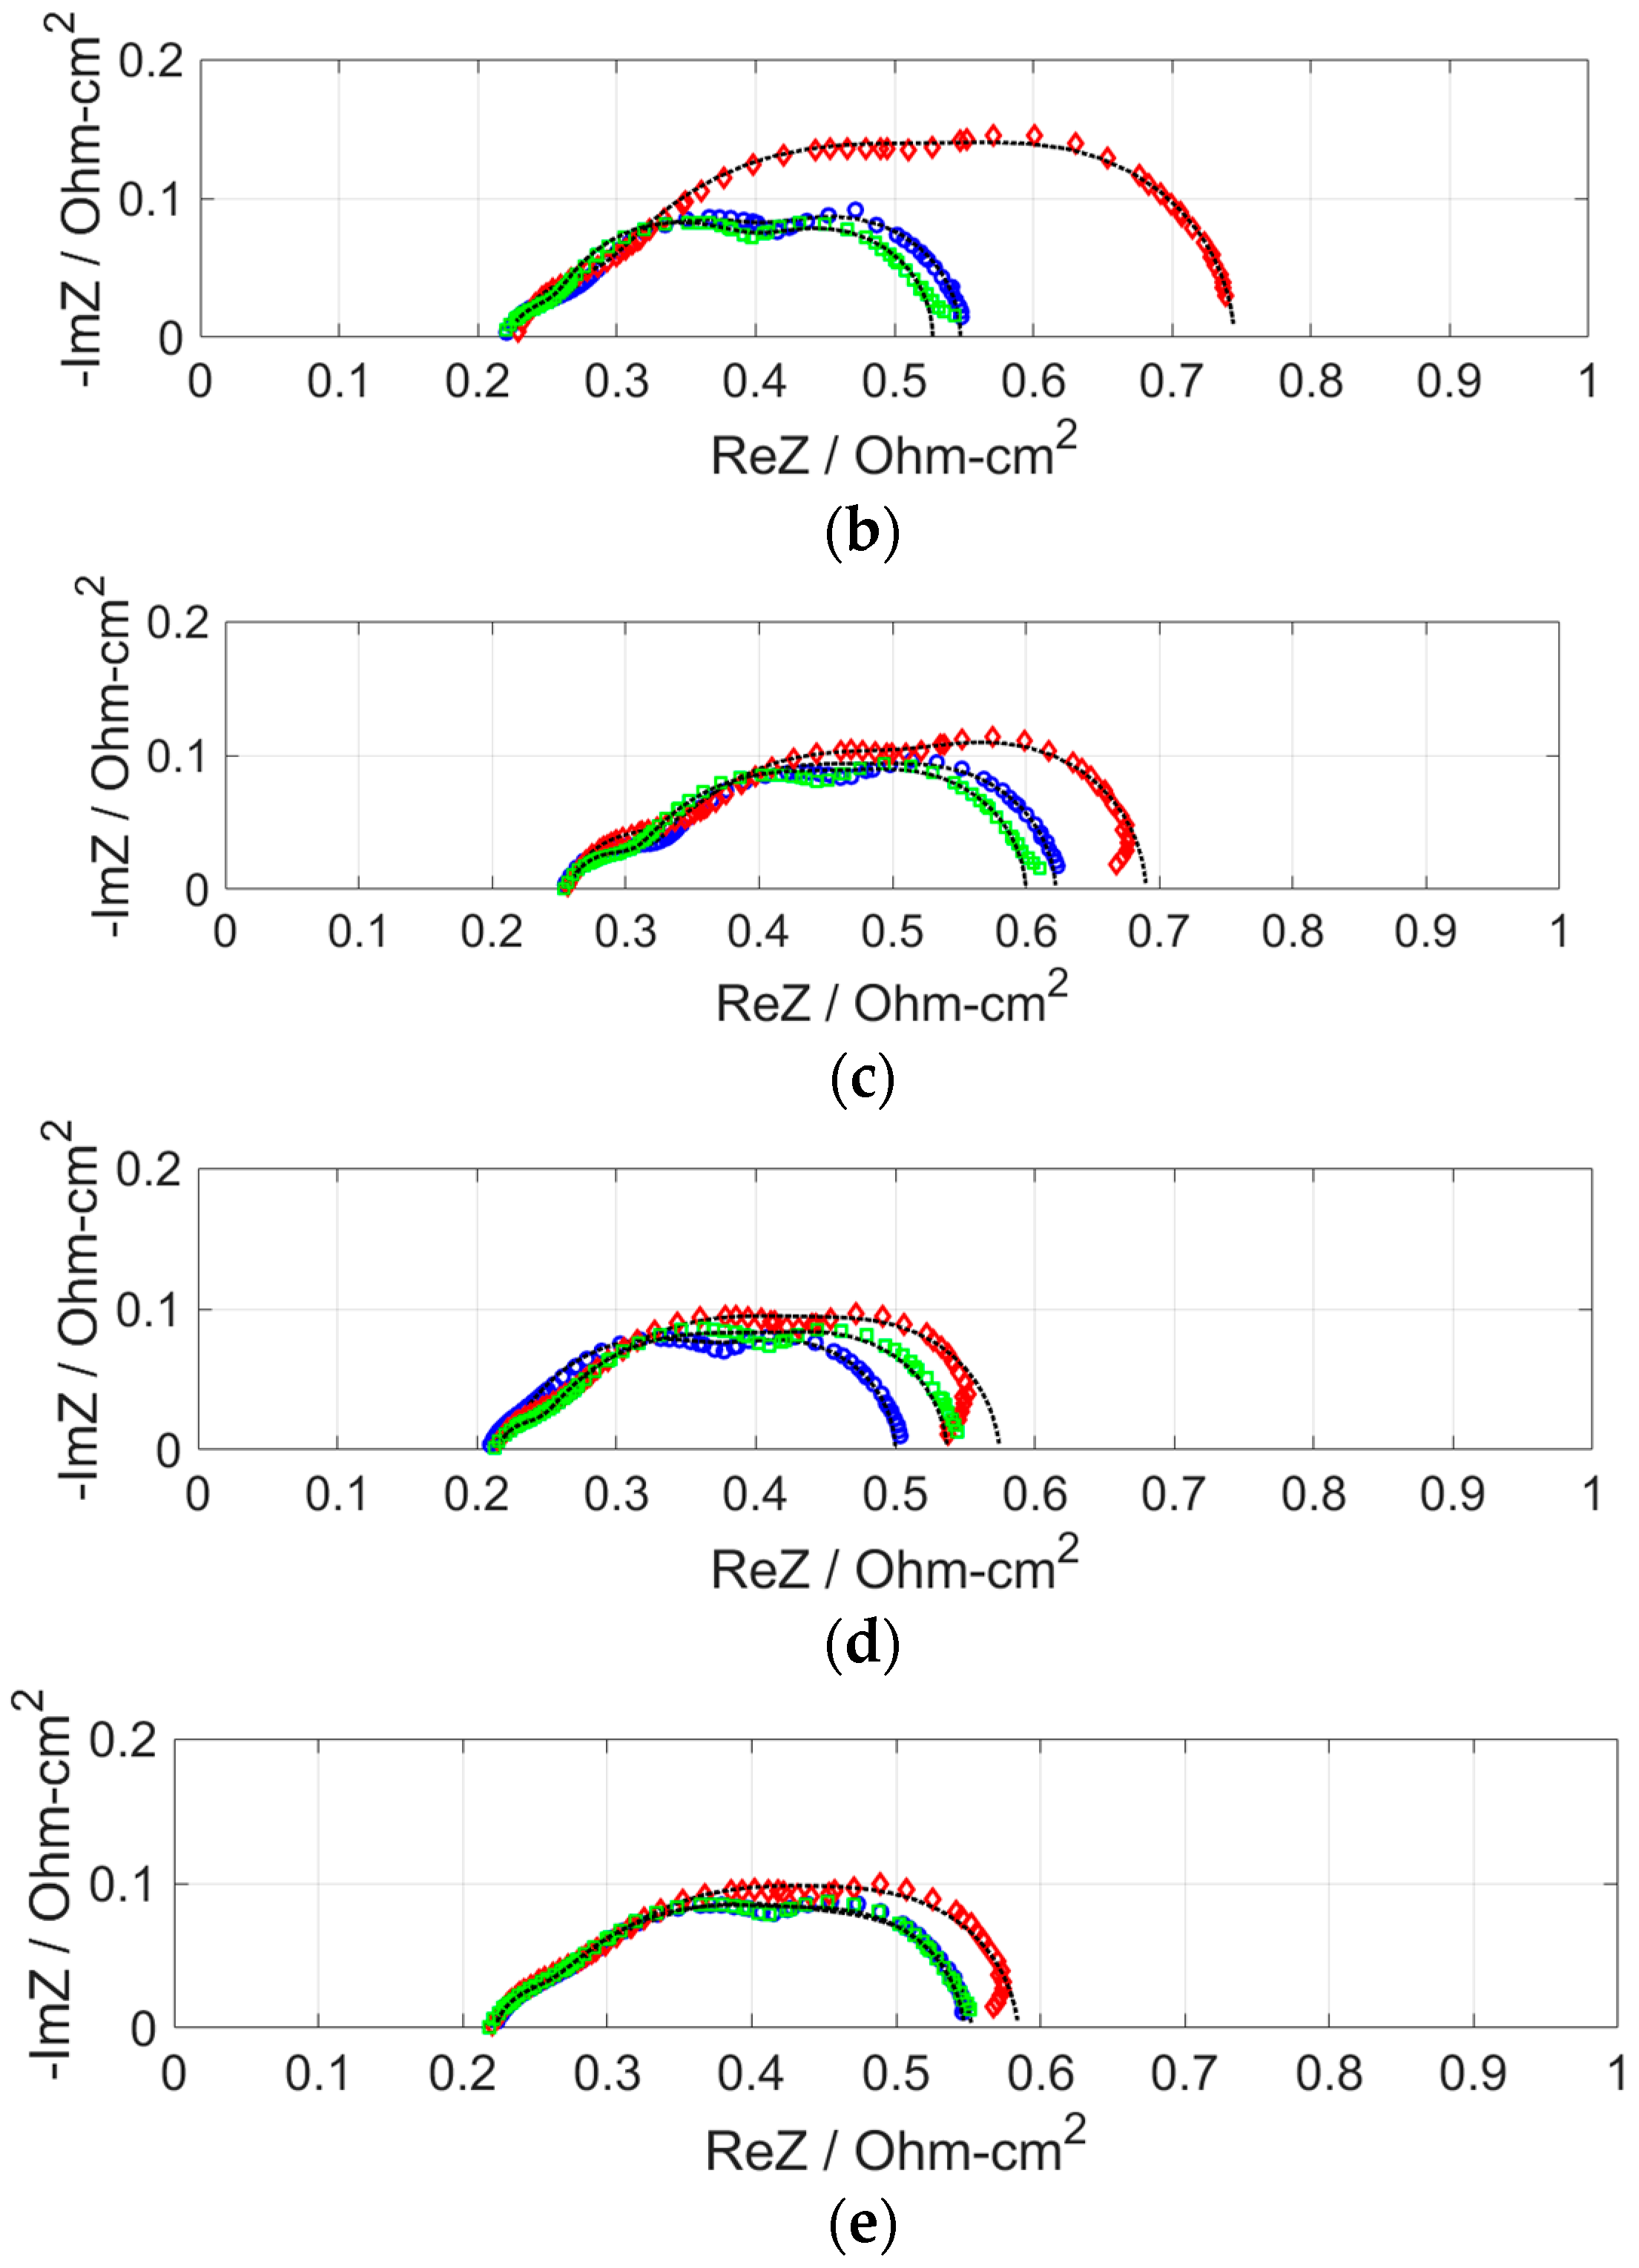
2.2. Effect of H2S on Cell Performance at Various Anode Pt Loadings

The effect of H2S on cell performance was studied using EIS under various operating conditions. To quantify impedance, the electrochemical equivalent circuit shown in Figure 3 was employed to fit the experimental data [30]. In the equivalent circuit model, RΩ represents the internal resistances of the single cell, including material resistance and contact resistance. Ran, Rca, and Rm represent anode charge transfer resistance, cathode charge transfer resistance, and mass transfer resistance, respectively. The capacitor Cm accounts for the mass transfer effect. The constant phase elements CPEan and CPEca were used to replace capacitors to improve the fit. The impedance of the CPE is of the form
CPE = 1 Q ( j ω ) n .
The exponent n is 1 for an ideal capacitor while 0 for a pure resistor. The value of n is 0.85 in this study. The overall impedance of the equivalent circuit then can be arranged as
Z t = R Ω + R an 1 + R an ( Q an ( j ω ) n ) + R ca 1 + R ca ( Q ca ( j ω ) n ) + R m 1 + R m j ω C m .
The resistances RΩ, Ran, Rca, and Rm are fitted according to the Nyquist plots obtained by EIS measurement under various operating conditions.
Figure 4 shows the Nyquist plots for investigating the effect of H2S on the performance of MEAs with various anode Pt loadings. All MEAs with a cathode Pt loading of 0.7 mg cm−2 and 10% PVDF were operated at 180 °C and stoichiometric ratios of 1.2 and 2 for the anode and cathode, respectively. The high-frequency resistance (HFR), RΩ, of the MEAs varied between 0.21 and 0.26 Ω cm2. This may have resulted from the variation of the phosphoric acid doping level of the TPS membrane because the HFR is influenced mainly by membrane resistivity. The fitted area resistances are summarized in Table 1.
When the anode was supplied with 5.2 ppm H2S balanced with H2, the HFR showed no significant difference at each anode Pt loading. However, the resistances of anodic charge transfer increased from 0.1250 to 0.1675, from 0.05 to 0.065, from 0.0625 to 0.075, and from 0.025 to 0.0375 Ω cm2 for the anode Pt loadings of 0.3, 0.4, 0.5, and 0.6 mg cm−2, respectively, as shown in Figure 4a–d. Although H2S was supplied to the anode, it may have diffused to the cathode through the membrane, resulting in slightly increased resistance of cathodic charge transfer for the anode Pt loadings of 0.3–0.6 mg cm−2, as shown in Figure 4a–d. As a result, the mass transfer resistance increased slightly in the presence of H2S.
The increase in resistance was the least in the case of the MEA with an anode Pt loading of 0.7 mg cm−2, as shown in Figure 4e. This could be ascribed to the higher specific electrochemical surface area with the anode Pt loading of 0.7 mg cm−2. As presented in the previous section, when the anode Pt loading is higher than 0.4 mg cm−2, the cell performance shows no significant improvement. Thus, the excess electrochemical surface area worked as a buffer to adsorb H2S. In addition, the presence of oxygen diffusing through the membrane from the cathode could decontaminate the catalyst according to the following reaction:
H 2 S + O 2 + 3 Pt Pt-S + 2 Pt-O + H 2 O
Pt-S + 2 Pt-O SO 2 + 3 Pt .
When the anode was supplied with pure H2 again, the resistances of anodic charge transfer, cathodic charge transfer, and mass transfer decreased and almost recovered to their initial values for all anode Pt loadings. The results showed that the MEAs manufactured in this study can tolerate at least 5.2 ppm of H2S.

2.3. Effect of H2S on Cell Performance under Various Operating Current Density Levels

According to the results shown in the previous section, when the anode Pt loading was 0.7 mg cm−2, H2S has less impact on cell performance and cell performance could be recovered after supplying pure H2. Thereafter, MEAs were prepared with both anode and cathode Pt loadings of 0.7 mg cm−2 for the experiments.
Figure 5 shows the effect of operating current density on the impedances in the presence of 5.2 ppm H2S in the anode. The fitted area resistances are summarized in Table 2. When the anode was supplied with pure H2, the HFR of the MEAs ranged between 0.18 and 0.22 Ω cm2, demonstrating the stability of the manufacturing process employed in this study. The resistance of anodic charge transfer at the operating current density of 0.2 A cm−2 was 0.1375 Ω, which was slightly higher than those at the other operating current density levels, as shown in Figure 5a. This could be ascribed to the low H2 flow rate at the low current density of 0.2 A cm−2, resulting in increased activation overpotential. In this study, stoichiometric ratios for the anode and cathode were 1.2 and 2, respectively. Accordingly, flow rates of both anode and cathode gases increased with operating current density, resulting in the decrease of the area resistance of anodic charge transfer, as shown in Figure 5b–d. However, the area resistance of mass transfer increased significantly at 0.5 A cm−2 owing to insufficient supply of cathode air. Moreover, the water generated on the catalyst surface at a higher operating current density hindered the supply of oxygen to the reaction sites.
After the anode was fed with H2S, all area resistances did not increase significantly because the anode Pt loading was adequately high to alleviate the effect of H2S on cell performance, as discussed in the previous section. As shown in Figure 5a, the increase in the area resistance of mass transfer is larger at 0.2 A cm−2 than it is at the other current density levels owing to the low gas flow rate. When pure H2 was supplied to the anode, all resistances at each operating current density almost recovered to their initial values. These results imply that MEA performance was not influenced significantly by H2S at operating current densities of up to 0.5 A cm−2.

2.4. Durability Test

The effect of H2S on MEA durability is shown in Figure 6. The MEA was operated at the current density of 0.4 A cm−2 for around 150 h. In the first 125 h, the anode was supplied with 5.2 ppm H2S balanced by hydrogen. As can be seen in the plot, the initial voltage degradation rate was noticeable, and it became moderate gradually. The degradation rate was calculated to be 400 µV h−1 between the 20th hour and 30th hour, and 300 µV h−1 between the 100th hour and 110th hour. In the beginning, when H2S was supplied to the anode, the electrochemically active surface area decreased gradually, resulting in degradation. When the steady-state coverage was reached, the degradation became moderate. When the anode gas was switched to pure hydrogen in the 125th hour, cell voltage increased to 0.654 V but did not completely recover to its initial voltage. This could be caused by partial poisoning of the catalysts, resulting in a lower overall electrochemically active area. However, the degradation rate decreased to 200 µV h−1. This result suggests that the MEA with anode Pt loading of 0.7 mg cm−2 alleviated the degradation caused by 5.2 ppm H2S.

3. Experimental

3.1. MEA Preparation

MEAs with an active area of 25 cm2 and composed of a membrane and GDE were fabricated. A commercially available membrane (TPS, Advent, Greece) was doped with 85% H3PO4 at 140 °C for 12 h to achieve the desired doping level of 270% before use. The GDE was a GDL (GDL340, CeTech, Taiwan) coated with catalyst by using an ultrasonic spraying system (Benchtop BT, USI, USA). The catalyst ink consisted of carbon-supported platinum (46.6% Pt/C, Tanaka, Japan), PVDF, and DMAc. The catalyst ink was stirred for 4 h and then mixed using an ultrasonic bath. The ratio of PVDF to the solid phase was 5–25 wt %. The Pt loading was controlled by the number of spraying layers, ranging between 0.3 and 0.7 mg Pt cm−2. During the spraying process, the GDL was heated to 200 °C by using a hot plate (PC-400D, Corning, NY, USA).
The MEA was assembled by sandwiching the doped TPS membrane between two GDEs in a single cell fixture without the preceding hot-pressing step. The single cell fixture consisted of two graphite plate plates with single and triple serpentine channels in the anode and the cathode, respectively.

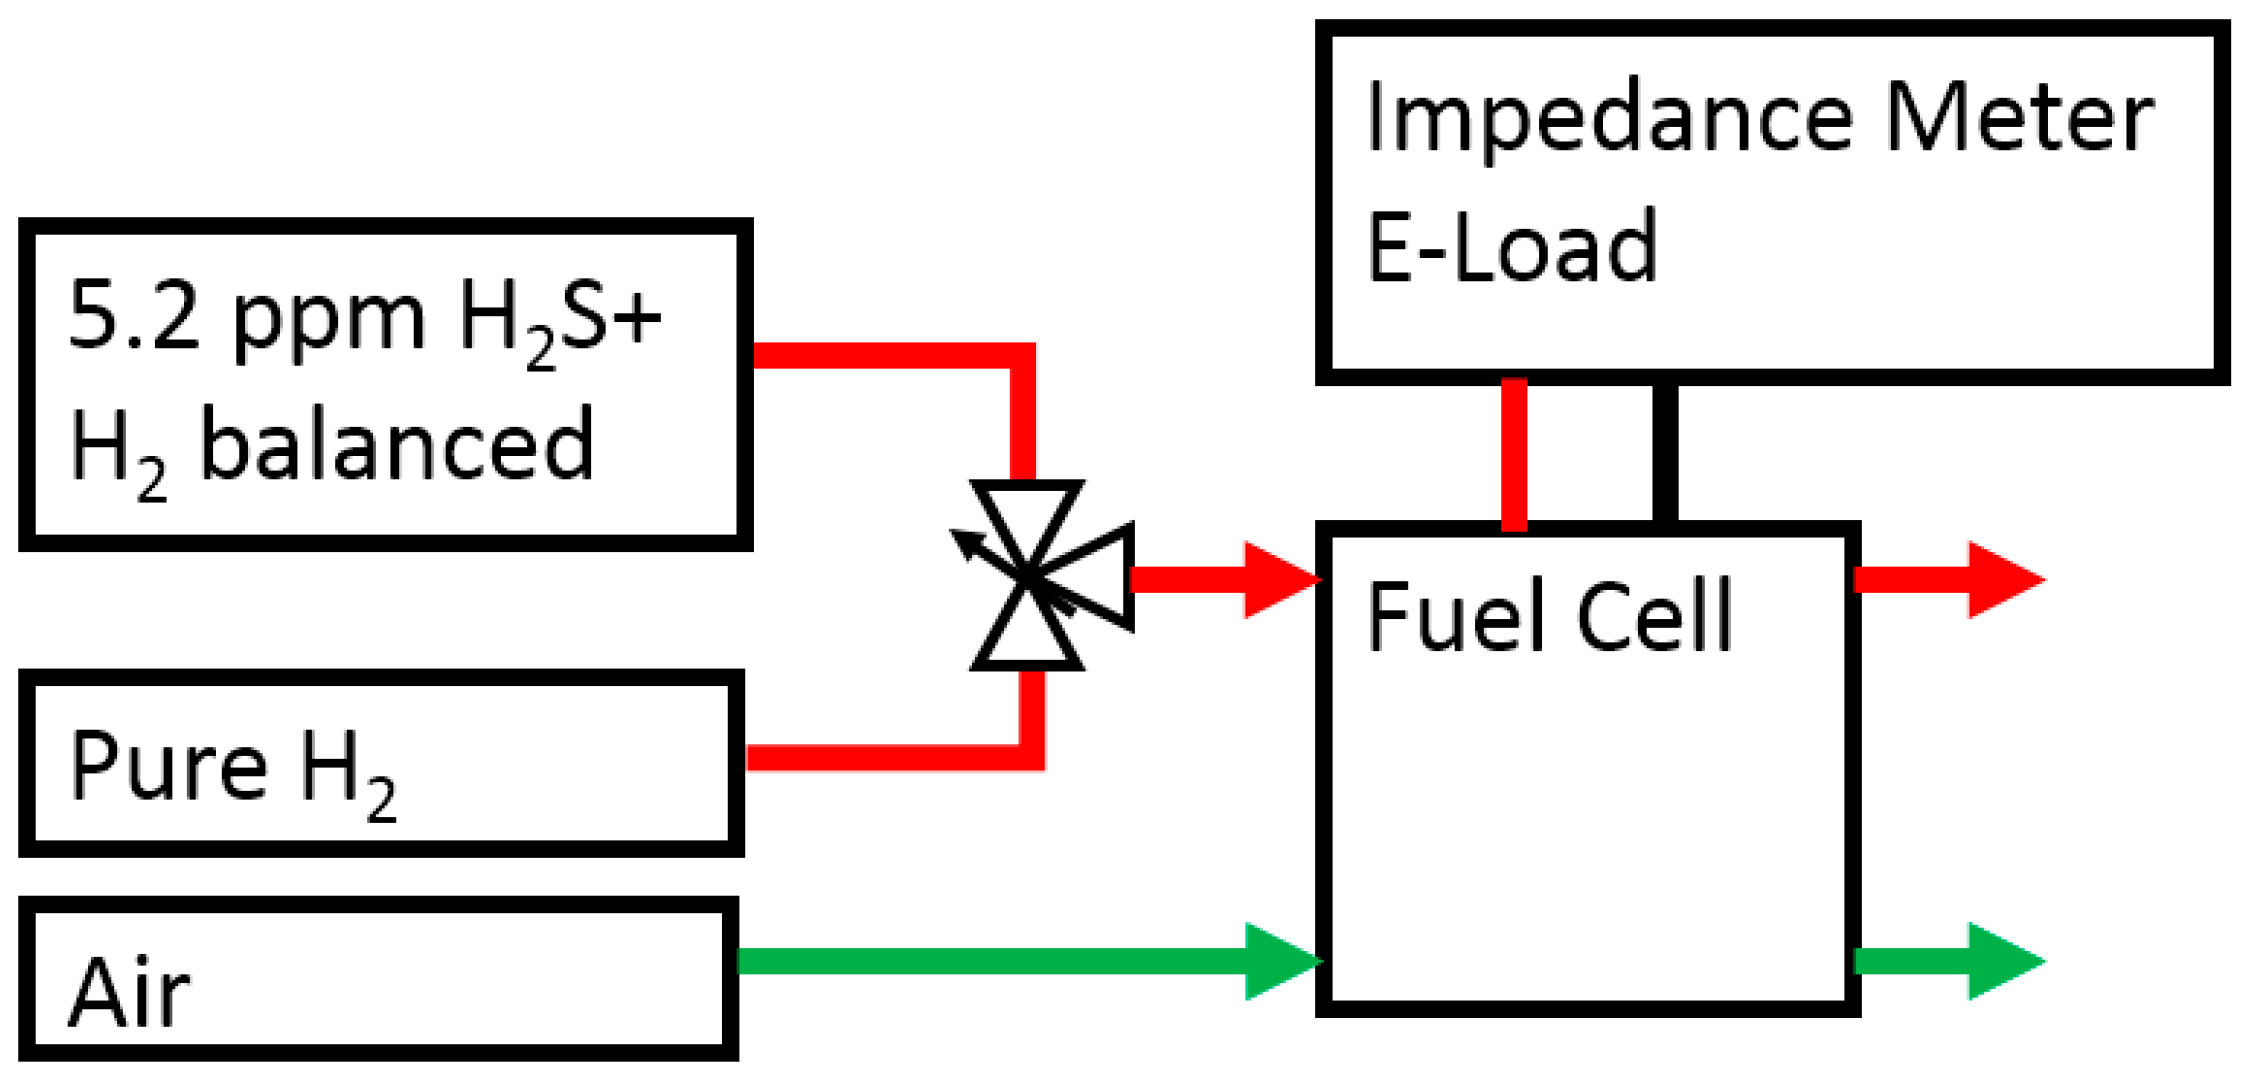
3.2. Experimental Procedure

The single cell was operated in a fuel cell test station (Mini 150, Hephase energy, Taiwan) with an electronic load (PLZ660, Kikusui, Japan). Before the performance test, each MEA was activated at 180 °C by supplying dry pure H2 and air with stoichiometric ratios of 1.2 and 2, respectively. The applied current was alternated periodically between 0.2 and 0.4 A cm−2 for at least 9 h during the activation process.
The polarization curves were obtained by measuring cell voltage with stepwise increment of current density from 0 to 1 A cm−2. At each current density, the cell voltage was measured after a holding time of 10 min for the cell to approach a steady state.
The effect of H2S on the cell performance was investigated in three steps by using the experimental setup shown in Figure 7. The fuel cell was operated at selected current density levels at 180 °C. Initially, the anode and the cathode were fed with pure hydrogen and air at the stoichiometric ratios of 1.2 and 2, respectively, for 10 min. Then, the anode was supplied with 5.2 ppm H2S with H2 balanced for 30 min, and subsequently, the supply was switched back to pure H2 for 20 min. The cell voltage was monitored during fuel cell operation and electrochemical impedance was measured in each step.
Electrochemical impedance spectroscopy (EIS) was performed using an AC impedance meter (KFM2150, Kikusui Electronics, Japan). EIS measurements were performed at selected operating current density levels with an amplitude of 10 mV and a frequency range of 0.1 Hz–10 kHz.

4. Conclusions

In this study, the effect of H2S on HT-PEMFC performance was investigated using self-made MEAs. MEA performance under various PVDF and Pt loadings in the catalyst layer was analyzed and discussed. Then, the electrochemical resistances were studied by using EIS under various operating conditions. The following conclusions were drawn.
  • When PVDF was employed as the binder, excessive PVDF covered the electrochemical surface area of the catalyst and reduced the continuous path for electron transfer. The optimal PVDF loading in the catalyst layer was 10 wt % in this study.
  • MEA performance did not increase significantly when the anode Pt loading was higher than 0.4 mg cm−2 under pure H2 operation.
  • After the anode was supplied with H2S, the resistance increase was the least for the MEA with anode Pt loading of 0.7 mg cm−2. Because the performances of MEAs with anode Pt loadings higher than 0.4 mg cm−2 were almost the same, the excess electrochemical surface area can be said to have worked as a buffer that adsorbed H2S. The larger increase in area resistance at 0.2 A cm−2 was caused by slow gas flow rate.
  • In the durability test, the voltage decrease rate was approximately 300 μV h−1 in the presence of H2S, and it recovered to 200 μV h−1 after H2 was supplied to the anode.

Author Contributions

R.-J.K. performed experiments and prepared figures. Y.-S.C. prepared this manuscript. Both authors read and approved this manuscript before submission.

Acknowledgments

The authors would like to acknowledge the support from the Ministry of Science and Technology of Taiwan, ROC (106-3113-E-006-002-CC2) for this study.

Conflicts of Interest

The authors declare no conflict of interest.

References

  1. Arsalis, A.; Nielsen, M.P.; Kær, S.K. Modeling and off-design performance of a 1kWe HT-PEMFC (high temperature-proton exchange membrane fuel cell)-based residential micro-CHP (combined-heat-and-power) system for Danish single-family households. Energy 2011, 36, 993–1002. [Google Scholar] [CrossRef]
  2. Arsalis, A.; Nielsen, M.P.; Kær, S.K. Modeling and parametric study of a 1kWe HT-PEMFC-based residential micro-CHP system. Int. J. Hydrog. Energy 2011, 36, 5010–5020. [Google Scholar] [CrossRef]
  3. Giacoppo, G.; Barbera, O.; Carbone, A.; Gatto, I.; Saccà, A.; Pedicini, R.; Passalacqua, E. 1.5 kWe HT-PEFC stack with composite MEA for CHP application. Int. J. Hydrog. Energy 2013, 38, 11619–11627. [Google Scholar] [CrossRef]
  4. Najafi, B.; Haghighat Mamaghani, A.; Rinaldi, F.; Casalegno, A. Long-term performance analysis of an HT-PEM fuel cell based micro-CHP system: Operational strategies. Appl. Energy 2015, 147, 582–592. [Google Scholar] [CrossRef]
  5. Lei, J.; Yue, H.; Tang, H.; Liang, B. Heat integration and optimization of hydrogen production for a 1 kW low-temperature proton exchange membrane fuel cell. Chem. Eng. Sci. 2015, 123, 81–91. [Google Scholar] [CrossRef]
  6. Li, Q.; He, R.; Jensen, J.O.; Bjerrum, N.J. PBI-based polymer membranes for high temperature fuel cells–preparation, characterization and fuel cell demonstration. Fuel Cells 2004, 4, 147–159. [Google Scholar] [CrossRef]
  7. Lobato, J.; Cañizares, P.; Rodrigo, M.A.; Ruiz-López, C.; Linares, J.J. Influence of the Teflon loading in the gas diffusion layer of PBI-based PEM fuel cells. J. Appl. Electrochem. 2008, 38, 793–802. [Google Scholar] [CrossRef]
  8. Mamlouk, M.; Scott, K. Phosphoric acid-doped electrodes for a PBI polymer membrane fuel cell. Int. J. Energy Res. 2011, 35, 507–519. [Google Scholar] [CrossRef]
  9. Jung, G.-B.; Tseng, C.-C.; Yeh, C.-C.; Lin, C.-Y. Membrane electrode assemblies doped with H3PO4 for high temperature proton exchange membrane fuel cells. Int. J. Hydrog. Energy 2012, 37, 13645–13651. [Google Scholar] [CrossRef]
  10. Su, H.; Pasupathi, S.; Bladergroen, B.; Linkov, V.; Pollet, B.G. Optimization of gas diffusion electrode for polybenzimidazole-based high temperature proton exchange membrane fuel cell: Evaluation of polymer binders in catalyst layer. Int. J. Hydrog. Energy 2013, 38, 11370–11378. [Google Scholar] [CrossRef] [Green Version]
  11. Su, H.; Pasupathi, S.; Bladergroen, B.J.; Linkov, V.; Pollet, B.G. Enhanced performance of polybenzimidazole-based high temperature proton exchange membrane fuel cell with gas diffusion electrodes prepared by automatic catalyst spraying under irradiation technique. J. Power Sources 2013, 242, 510–519. [Google Scholar] [CrossRef] [Green Version]
  12. Myles, T.; Bonville, L.; Maric, R. Catalyst, membrane, free electrolyte challenges, and pathways to resolutions in high temperature polymer electrolyte membrane fuel cells. Catalysts 2017, 7, 16. [Google Scholar] [CrossRef]
  13. Lobato, J.; Cañizares, P.; Rodrigo, M.A.; Linares, J.J.; Pinar, F.J. Study of the influence of the amount of PBI–H3PO4 in the catalytic layer of a high temperature PEMFC. Int. J. Hydrog. Energy 2010, 35, 1347–1355. [Google Scholar] [CrossRef]
  14. Lin, H.-L.; Wu, T.-J.; Lin, Y.-T.; Wu, H.-C. Effect of polyvinylidene difluoride in the catalyst layer on high-temperature PEMFCs. Int. J. Hydrog. Energy 2015, 40, 9400–9409. [Google Scholar] [CrossRef]
  15. Lwin, L.; Daud, W.R.W.D.; Mohamad, A.B.; Yaakob, Z. Hydrogen production from steam methanol reforming: Thermodynamic analysis. Int. J. Hydrog. Energy 2000, 25, 47–53. [Google Scholar] [CrossRef]
  16. Joensen, F.; Rostrup-Nielsen, J.R. Conversion of hydrocarbons and alcohols for fuel cells. J. Power Sources 2002, 105, 195–201. [Google Scholar] [CrossRef]
  17. Hafez, H.; Nakhla, G.; El Naggar, H. Biological Hydrogen production from corn-syrup waste using a novel system. Energies 2009, 2, 445–455. [Google Scholar] [CrossRef]
  18. Kumar, A.; Jones, D.; Hanna, M. Thermochemical biomass gasification: A review of the current status of the technology. Energies 2009, 2, 556–581. [Google Scholar] [CrossRef]
  19. Rau, M.; Cremers, C.; Tübke, J. Development of anodic materials for HT-PEMFCs with high tolerance to H2S. Int. J. Hydrog. Energy 2015, 40, 5439–5443. [Google Scholar] [CrossRef]
  20. Qi, Z. Effect of CO in the anode fuel on the performance of PEM fuel cell cathode. J. Power Sources 2002, 111, 239–247. [Google Scholar] [CrossRef]
  21. Brett, D.; Aguiar, P.; Brandon, N.; Kucernak, A. Measurement and modelling of carbon monoxide poisoning distribution within a polymer electrolyte fuel cell. Int. J. Hydrog. Energy 2007, 32, 863–871. [Google Scholar] [CrossRef]
  22. Reshetenko, T.V.; Bethune, K.; Rocheleau, R. Spatial proton exchange membrane fuel cell performance under carbon monoxide poisoning at a low concentration using a segmented cell system. J. Power Sources 2012, 218, 412–423. [Google Scholar] [CrossRef]
  23. Decoopman, B.; Vincent, R.; Rosini, S.; Paganelli, G.; Thivel, P.X. Proton exchange membrane fuel cell reversible performance loss induced by carbon monoxide produced during operation. J. Power Sources 2016, 324, 492–498. [Google Scholar] [CrossRef]
  24. Krishnan, P.; Park, J.-S.; Kim, C.-S. Performance of a poly(2,5-benzimidazole) membrane based high temperature PEM fuel cell in the presence of carbon monoxide. J. Power Sources 2006, 159, 817–823. [Google Scholar] [CrossRef]
  25. Li, Q.; He, R.; Gao, J.-A.; Jensen, J.O.; Bjerrum, N.J. The CO poisoning effect in PEMFCs operational at temperatures up to 200 °C. J. Electrochem. Soc. 2003, 150, A1599–A1605. [Google Scholar] [CrossRef] [Green Version]
  26. Pan, C.; He, R.; Li, Q.; Jensen, J.O.; Bjerrum, N.J.; Hjulmand, H.A.; Jensen, A.B. Integration of high temperature PEM fuel cells with a methanol reformer. J. Power Sources 2005, 145, 392–398. [Google Scholar] [CrossRef]
  27. Schmidt, T.J.; Baurmeister, J. Durability and reliability in high-temperature reformed hydrogen PEFCs. ECS Trans. 2006, 3, 861–869. [Google Scholar]
  28. Rau, M.; Niedergesäß, A.; Cremers, C.; Alfaro, S.; Steenberg, T.; Hjuler, H.A. Characterization of membrane electrode assemblies for high-temperature PEM fuel cells. Fuel Cells 2016, 16, 577–583. [Google Scholar] [CrossRef]
  29. Su, H.; Jao, T.-C.; Pasupathi, S.; Bladergroen, B.J.; Linkov, V.; Pollet, B.G. A novel dual catalyst layer structured gas diffusion electrode for enhanced performance of high temperature proton exchange membrane fuel cell. ECS Trans. 2014, 246, 63–67. [Google Scholar] [CrossRef]
  30. Andreasen, S.J.; Vang, J.R.; Kær, S.K. High temperature PEM fuel cell performance characterisation with CO and CO2 using electrochemical impedance spectroscopy. Int. J. Hydrog. Energy 2011, 36, 9815–9830. [Google Scholar] [CrossRef]
Figure 1. Polarization curves of the single cell with various PVDF loadings.
Catalysts 08 00441 g001
Figure 2. Polarization curves of a single cell with various Pt loadings.
Catalysts 08 00441 g002
Figure 3. Equivalent circuit used to fit the experimental data. (RΩ: internal resistance; Ran: anode charge transfer resistance; Rca: cathode charge transfer resistance; Rm: mass transfer resistance; Cm: mass transfer effect; CPEan: constant phase element of the anode; CPEca: constant phase element of the cathode).
Catalysts 08 00441 g003
Figure 4. Effect of H2S on AC impedance of MEAs under various Pt loadings measured at current density of 0.48 A cm−2: (a) 0.3; (b) 0.4; (c) 0.5; (d) 0.6; and (e) 0.7 mg cm−2. (□: pure H2; ◇: H2S; ○: H2 recovery; --: fitted line).
Catalysts 08 00441 g004aCatalysts 08 00441 g004b
Figure 5. Effect of H2S on AC impedance of MEAs under various operating current density levels: (a) 0.2; (b) 0.3; (c) 0.4; and (d) 0.5 A cm−2. (□: pure H2; ◇: H2S; ○: H2 recovery; --: fitted line).
Catalysts 08 00441 g005
Figure 6. Cell voltage at 0.4 A cm−2 using 5.2 ppm H2S with H2 balanced and using 99.99% H2.
Catalysts 08 00441 g006
Figure 7. Experimental setup for investigating effect of hydrogen sulfide on high-temperature proton exchange membrane fuel cell (HT-PEMFC) performance.
Catalysts 08 00441 g007
Table 1. Fitted resistances of membrane electrode assemblies (MEAs) with various anode Pt loadings under different gases.
Pt Loading
(mg cm−2)
Anode GasRΩ
(Ω cm2)
Ran
(Ω cm2)
Rca
(Ω cm2)
Rm
(Ω cm2)
0.3H20.25750.12500.22500.1500
H2S0.27500.16750.25000.2200
Recover0.25750.11250.15000.1500
0.4H20.22250.05000.13750.1375
H2S0.22500.06500.27500.1800
Recover0.22250.03750.14250.1250
0.5H20.25750.06250.18500.1175
H2S0.25750.07500.20000.1575
Recover0.25750.05000.17500.1175
0.6H20.21000.02500.15000.1150
H2S0.21750.03750.21250.1075
Recover0.21500.03000.18750.1050
0.7H20.22250.05000.20000.0800
H2S0.22250.05000.21250.1000
Recover0.22250.03750.19250.0950
Table 2. Fitted resistances of MEAs operated at various current density levels under different gases.
Current Density
(A cm−2)
Anode GasRΩ
(Ω cm2)
Ran
(Ω cm2)
Rca
(Ω cm2)
Rm
(Ω cm2)
0.2H20.21750.13750.23750.2875
H2S0.21750.16250.25250.3025
Recover0.21750.13750.23750.2875
0.3H20.20000.07500.25000.2875
H2S0.21500.10750.25000.2625
Recover0.21500.09750.22250.2975
0.4H20.18750.06250.30000.3125
H2S0.19250.08750.26250.3500
Recover0.19500.07500.31750.2975
0.5H20.18750.06250.37500.4250
H2S0.18500.08750.40000.4125
Recover0.18750.06250.38500.4250

