Optimization and Tunability of 2D Graphene and 1D Carbon Nanotube Electrocatalysts Structure for PEM Fuel Cells

 ,
,
Abstract
:
1. Introduction
2. Results
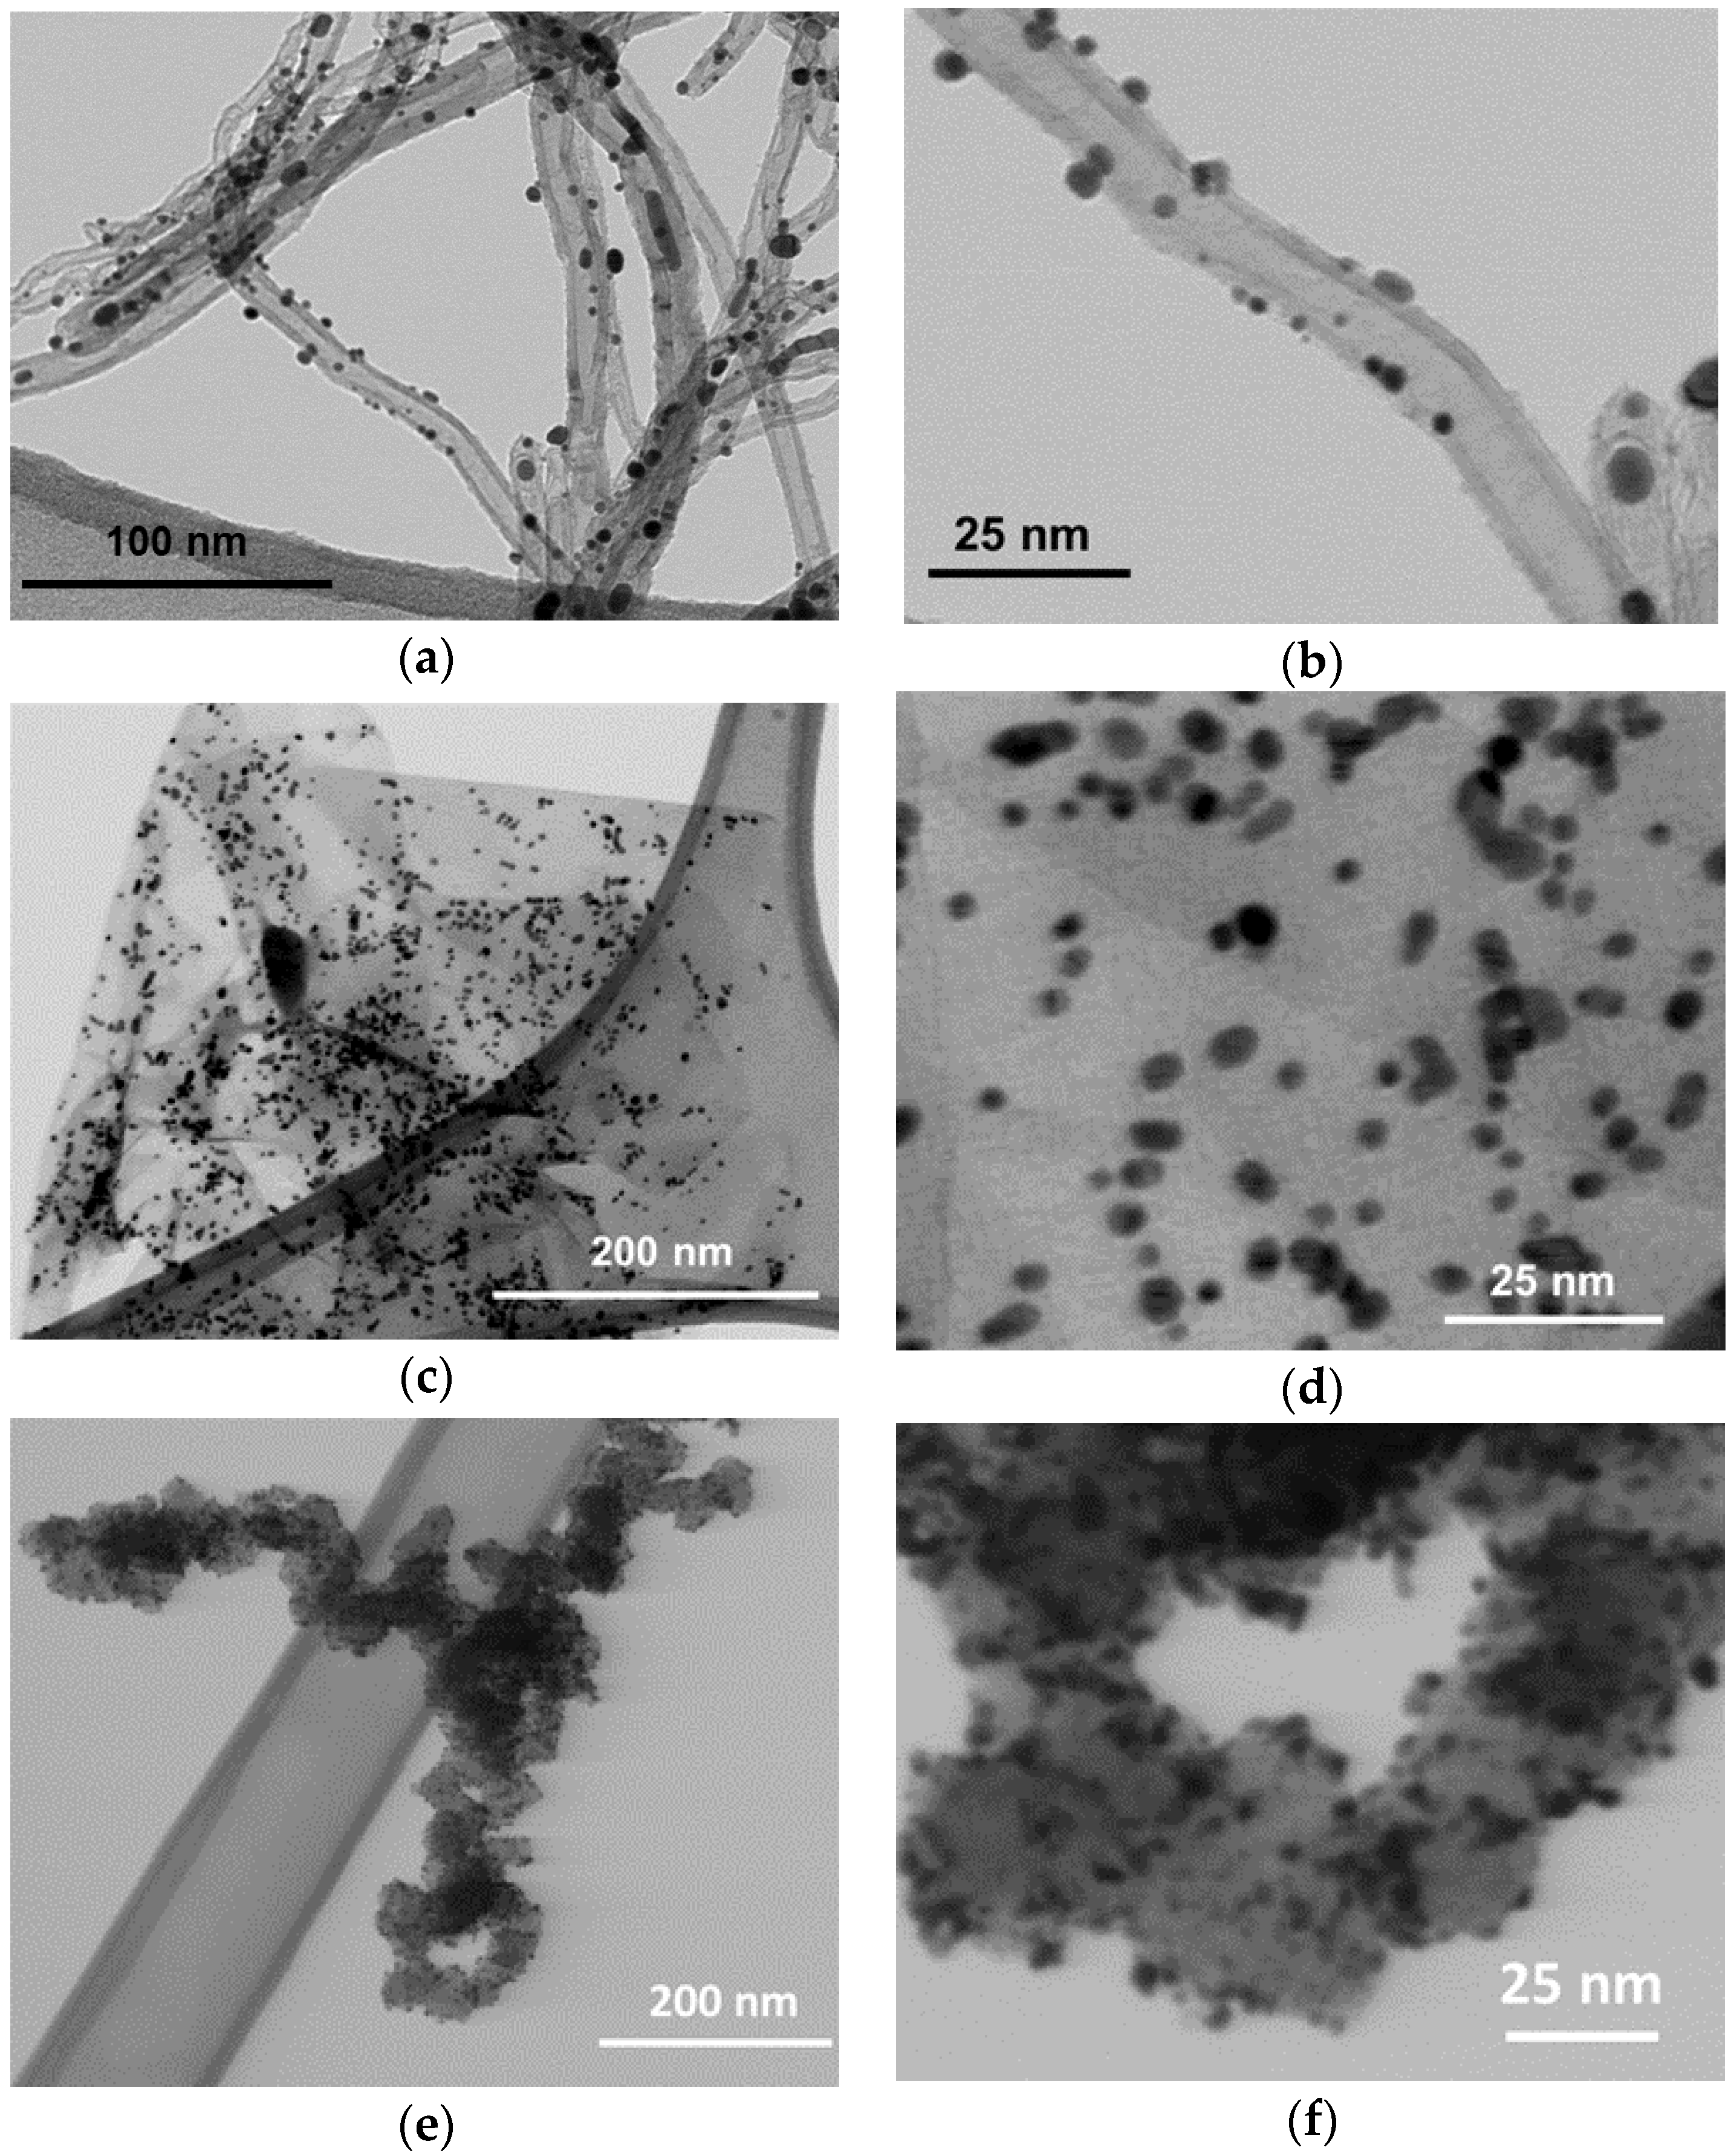
2.1. STEM, UV and TGA Analyses
2.2. RDE
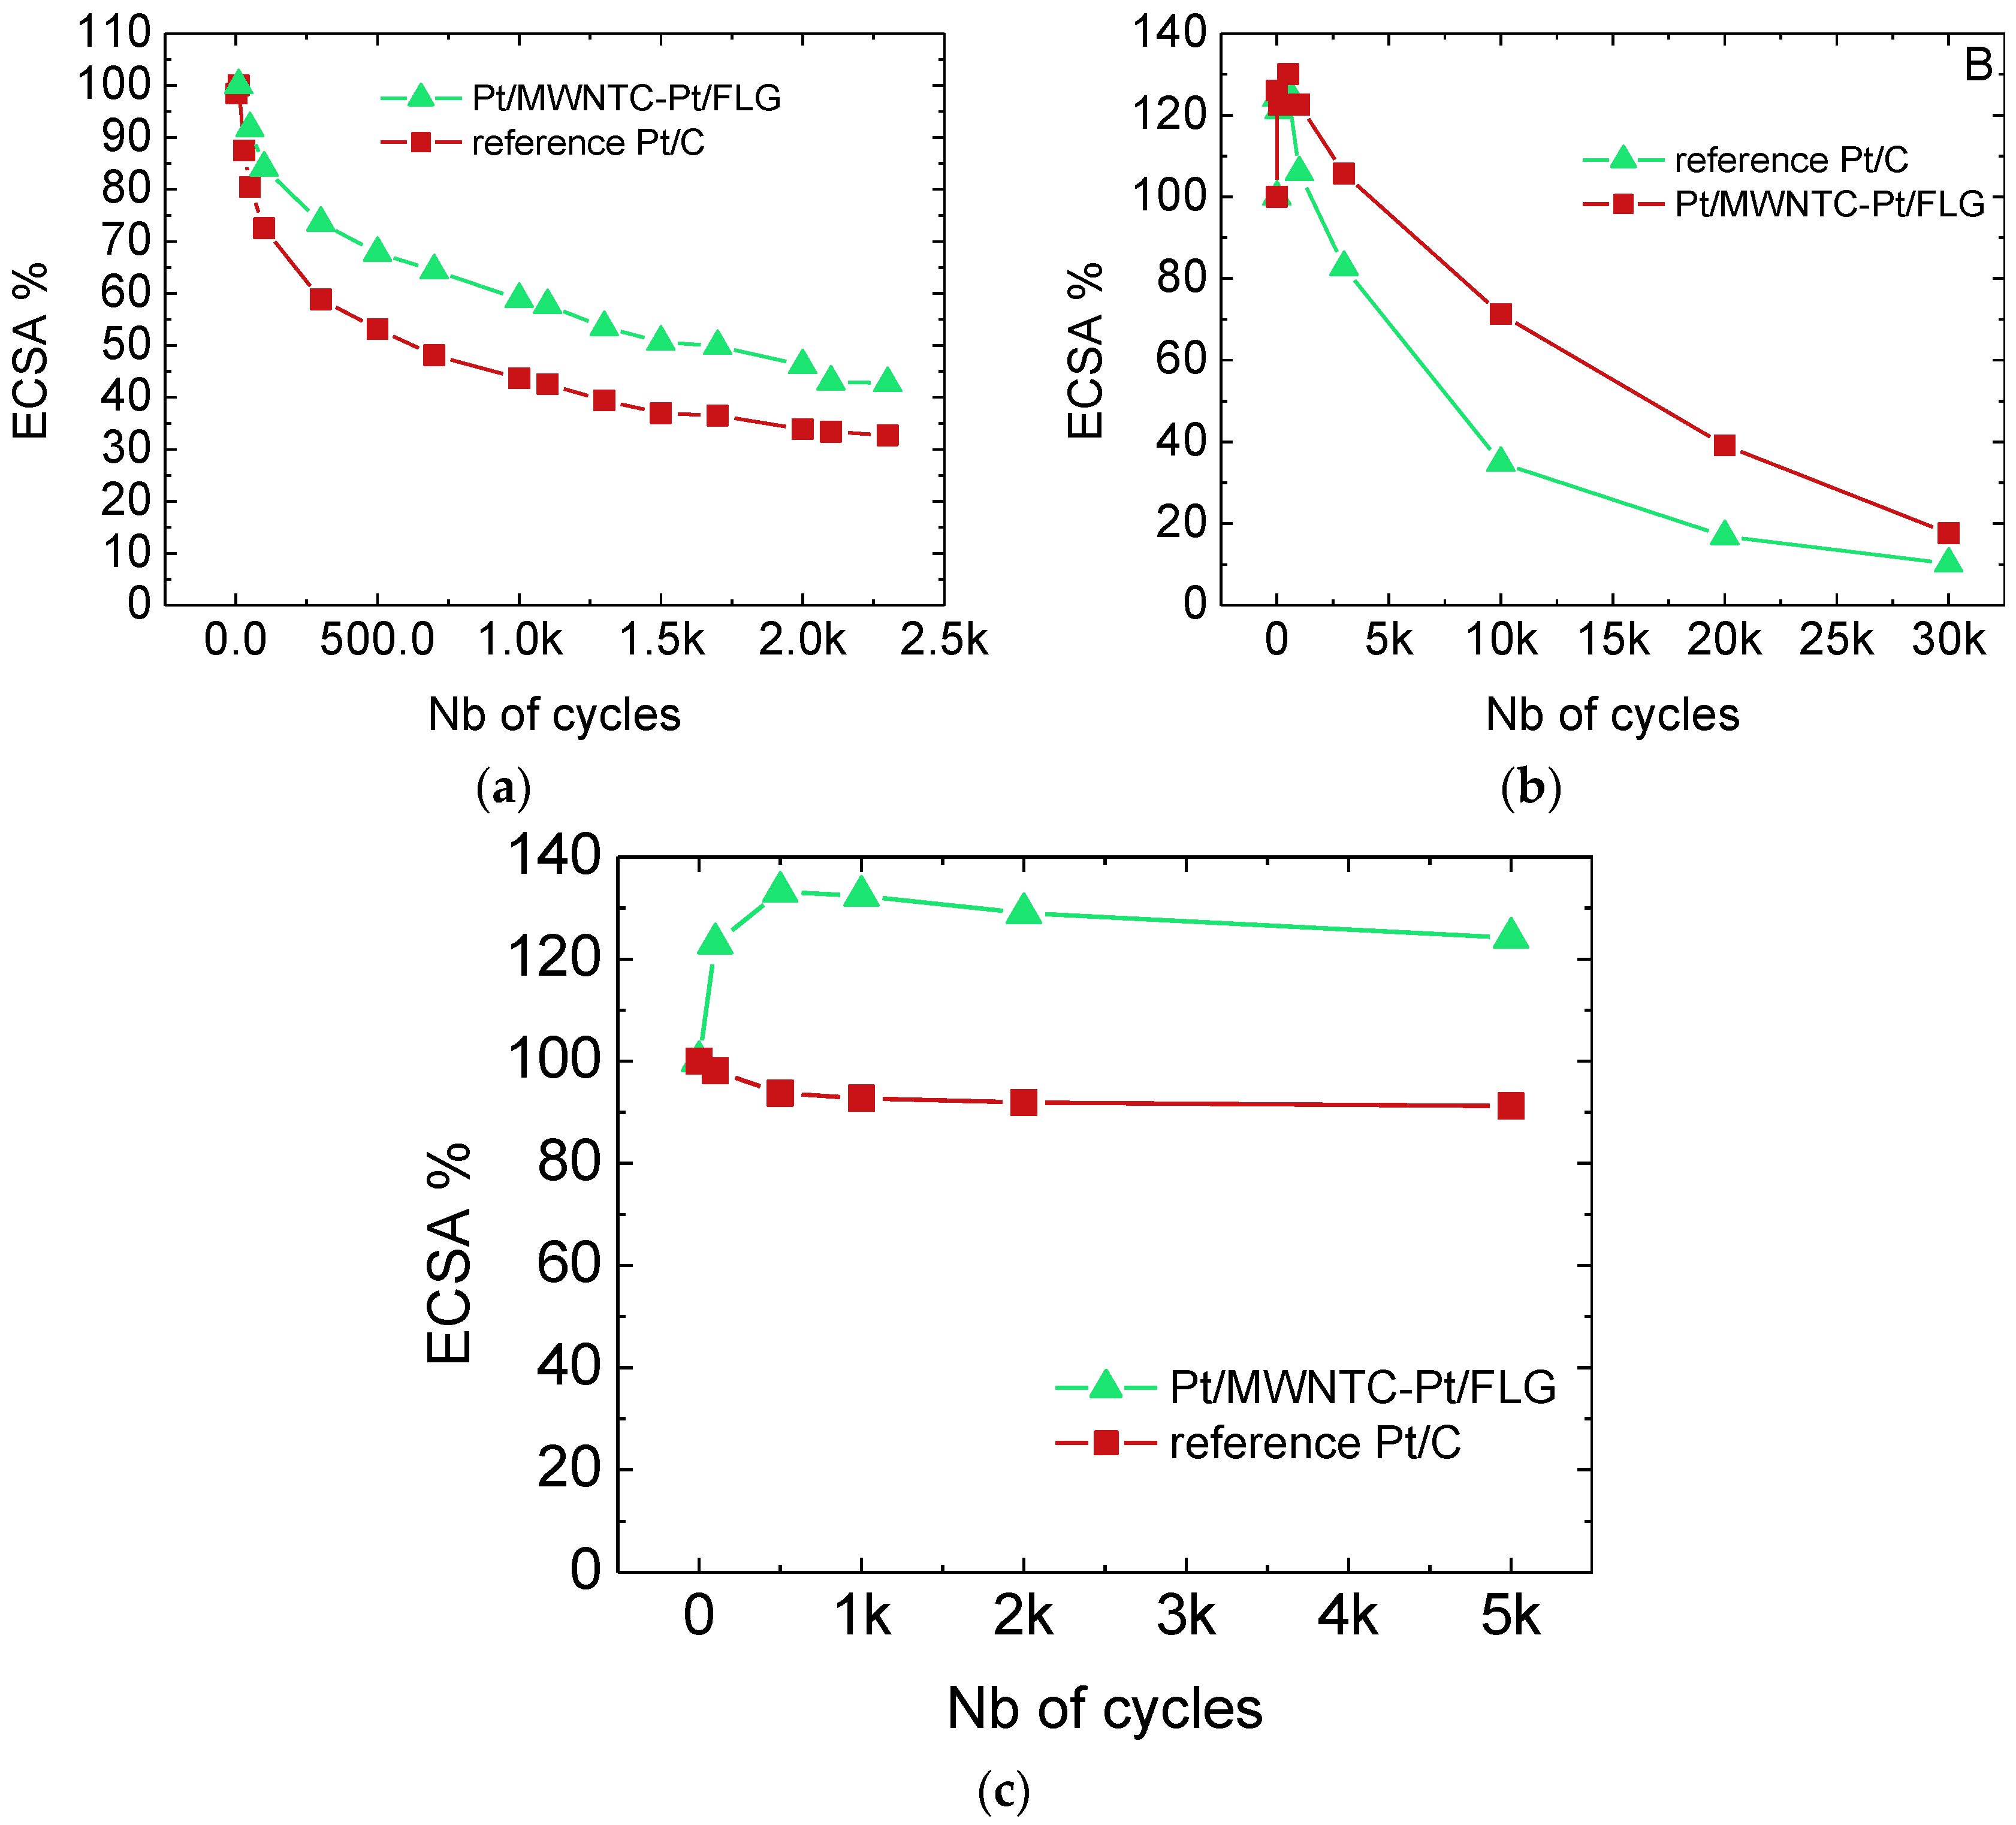
2.3. Ageing Test
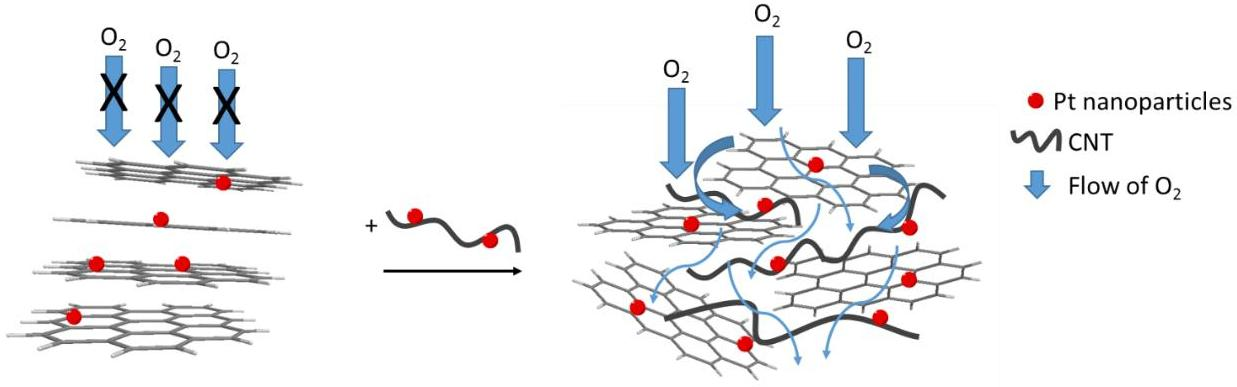
3. Discussion
4. Materials and Methods
4.1. Catalyst Preparation
4.2. Electrochemical Methods
4.3. Electron Microscopy
4.4. UV Quantification
4.5. TGA
Author Contributions
Funding
Acknowledgments
Conflicts of Interest
References
- Chen, S.; Wei, Z. Recent Advances of Electrocatalyst, Catalyst Utilization and Water Management in Polymer Electrolyte Membrane Fuel Cells. Available online: http://www.ingentaconnect.com/content/asp/sam/2015/00000007/00000010/art00011 (accessed on 16 July 2018).
- Gasteiger, H.A.; Marković, N.M. Just a Dream—Or Future Reality? Science 2009, 324, 48–49. [Google Scholar] [CrossRef] [PubMed]
- Shao, Y.; Yin, G.; Gao, Y. Understanding and approaches for the durability issues of Pt-based catalysts for PEM fuel cell. J. Power Sources 2007, 171, 558–566. [Google Scholar] [CrossRef]
- Uchimura, M.; Sugawara, S.; Suzuki, Y.; Zhang, J.; Kocha, S.S. Electrocatalyst Durability under Simulated Automotive Drive Cycles. ECS Trans. 2008, 16, 225–234. [Google Scholar] [CrossRef]
- Lv, H.; Li, D.; Strmcnik, D.; Paulikas, A.P.; Markovic, N.M.; Stamenkovic, V.R. Recent advances in the design of tailored nanomaterials for efficient oxygen reduction reaction. Nano Energy 2016, 29, 149–165. [Google Scholar] [CrossRef]
- Strasser, P.; Kühl, S. Dealloyed Pt-based core-shell oxygen reduction electrocatalysts. Nano Energy 2016, 29, 166–177. [Google Scholar] [CrossRef]
- Gasteiger, H.A.; Baker, D.R.; Carter, R.N.; Gu, W.; Liu, Y.; Wagner, F.T.; Yu, P.T. Hydrogen and Fuel Cells: Fundamentals, Technologies and Applications; Contributions to the 18th World Hydrogen Energy Conference 2010, Essen; Stolten, D., Ed.; Wiley-VCH: Weinheim, Germany, 2011; ISBN 978-3-527-32711-9. [Google Scholar]
- Sharma, S.; Pollet, B.G. Support materials for PEMFC and DMFC electrocatalysts—A review. J. Power Sources 2012, 208, 96–119. [Google Scholar] [CrossRef]
- Speder, J.; Zana, A.; Spanos, I.; Kirkensgaard, J.J.K.; Mortensen, K.; Hanzlik, M.; Arenz, M. Comparative degradation study of carbon supported proton exchange membrane fuel cell electrocatalysts—The influence of the platinum to carbon ratio on the degradation rate. J. Power Sources 2014, 261, 14–22. [Google Scholar] [CrossRef]
- Stevens, D.A.; Hicks, M.T.; Haugen, G.M.; Dahn, J.R. Ex Situ and In Situ Stability Studies of PEMFC Catalysts Effect of Carbon Type and Humidification on Degradation of the Carbon. J. Electrochem. Soc. 2005, 152, A2309–A2315. [Google Scholar] [CrossRef]
- Wu, J.; Yuan, X.Z.; Martin, J.J.; Wang, H.; Zhang, J.; Shen, J.; Wu, S.; Merida, W. A review of PEM fuel cell durability: Degradation mechanisms and mitigation strategies. J. Power Sources 2008, 184, 104–119. [Google Scholar] [CrossRef]
- Yaldagard, M.; Jahanshahi, M.; Seghatoleslami, N. Carbonaceous Nanostructured Support Materials for Low Temperature Fuel Cell Electrocatalysts—A Review. World J. Nano Sci. Eng. 2013, 3, 121–153. [Google Scholar] [CrossRef]
- Antolini, E. Carbon supports for low-temperature fuel cell catalysts. Appl. Catal. B Environ. 2009, 88, 1–24. [Google Scholar] [CrossRef]
- Kangasniemi, K.H.; Condit, D.A.; Jarvi, T.D. Characterization of Vulcan Electrochemically Oxidized under Simulated PEM Fuel Cell Conditions. J. Electrochem. Soc. 2004, 151, E125–E132. [Google Scholar] [CrossRef]
- Mukundan, R.; James, G.; Ayotte, D.; Davey, J.R.; Langlois, D.; Spernjak, D.; Torraco, D.; Balasubramanian, S.; Weber, A.Z.; More, K.L.; et al. Accelerated Testing of Carbon Corrosion and Membrane Degradation in PEM Fuel Cells. ECS Trans. 2013, 50, 1003–1010. [Google Scholar] [CrossRef] [Green Version]
- Roen, L.M.; Paik, C.H.; Jarvi, T.D. Electrocatalytic Corrosion of Carbon Support in PEMFC Cathodes. Electrochem. Solid-State Lett. 2004, 7, A19–A22. [Google Scholar] [CrossRef]
- Speder, J.; Zana, A.; Spanos, I.; Kirkensgaard, J.J.K.; Mortensen, K.; Arenz, M. On the influence of the Pt to carbon ratio on the degradation of high surface area carbon supported PEM fuel cell electrocatalysts. Electrochem. Commun. 2013, 34, 153–156. [Google Scholar] [CrossRef]
- Durst, J.; Lamibrac, A.; Charlot, F.; Dillet, J.; Castanheira, L.F.; Maranzana, G.; Dubau, L.; Maillard, F.; Chatenet, M.; Lottin, O. Degradation heterogeneities induced by repetitive start/stop events in proton exchange membrane fuel cell: Inlet vs. outlet and channel vs. land. Appl. Catal. B Environ. 2013, 138–139, 416–426. [Google Scholar] [CrossRef]
- Dubau, L.; Castanheira, L.; Maillard, F.; Chatenet, M.; Lottin, O.; Maranzana, G.; Dillet, J.; Lamibrac, A.; Perrin, J.-C.; Moukheiber, E.; et al. A review of PEM fuel cell durability: Materials degradation, local heterogeneities of aging and possible mitigation strategies. Wiley Interdiscip. Rev. Energy Environ. 2014, 3, 540–560. [Google Scholar] [CrossRef]
- Cognard, G.; Ozouf, G.; Beauger, C.; Dubau, L.; López-Haro, M.; Chatenet, M.; Maillard, F. Insights into the stability of Pt nanoparticles supported on antimony-doped tin oxide in different potential ranges. Électrochim. Acta 2017, 245, 993–1004. [Google Scholar] [CrossRef]
- Bom, D.; Andrews, R.; Jacques, D.; Anthony, J.; Chen, B.; Meier, M.S.; Selegue, J.P. Thermogravimetric Analysis of the Oxidation of Multiwalled Carbon Nanotubes: Evidence for the Role of Defect Sites in Carbon Nanotube Chemistry. Nano Lett. 2002, 2, 615–619. Available online: https://pubs.acs.org/doi/abs/10.1021/nl020297u (accessed on 17 July 2018). [CrossRef]
- Wang, X.; Li, W.; Chen, Z.; Waje, M.; Yan, Y. Durability investigation of carbon nanotube as catalyst support for proton exchange membrane fuel cell. J. Power Sources 2006, 158, 154–159. [Google Scholar] [CrossRef]
- Cheng, Y.; Lu, S.; Zhang, H.; Varanasi, C.V.; Liu, J. Synergistic Effects from Graphene and Carbon Nanotubes Enable Flexible and Robust Electrodes for High-Performance Supercapacitors. Nano Lett. 2012, 12, 4206–4211. Available online: https://pubs.acs.org/doi/abs/10.1021/nl301804c (accessed on 17 July 2018). [CrossRef] [PubMed]
- Zhou, X.; Qiao, J.; Yang, L.; Zhang, J. A Review of Graphene-Based Nanostructural Materials for Both Catalyst Supports and Metal-Free Catalysts in PEM Fuel Cell Oxygen Reduction Reactions. Adv. Energy Mater. 2014, 4, 1301523. [Google Scholar] [CrossRef]
- Fu, K.; Wang, Y.; Qian, Y.; Mao, L.; Jin, J.; Yang, S.; Li, G. Synergistic Effect of Nitrogen Doping and MWCNT Intercalation for the Graphene Hybrid Support for Pt Nanoparticles with Exemplary Oxygen Reduction Reaction Performance. Materials 2018, 11, 642. [Google Scholar] [CrossRef] [PubMed]
- Chen, Y.; Wang, J.; Liu, H.; Banis, M.N.; Li, R.; Sun, X.; Sham, T.-K.; Ye, S.; Knights, S. Nitrogen Doping Effects on Carbon Nanotubes and the Origin of the Enhanced Electrocatalytic Activity of Supported Pt for Proton-Exchange Membrane Fuel Cells. J. Phys. Chem. C 2011, 115, 3769–3776. [Google Scholar] [CrossRef] [Green Version]
- Higgins, D.C.; Meza, D.; Chen, Z. Nitrogen-Doped Carbon Nanotubes as Platinum Catalyst Supports for Oxygen Reduction Reaction in Proton Exchange Membrane Fuel Cells. J. Phys. Chem. C 2010, 114, 21982–21988. [Google Scholar] [CrossRef]
- Liu, Z.; Gan, L.M.; Hong, L.; Chen, W.; Lee, J.Y. Carbon-supported Pt nanoparticles as catalysts for proton exchange membrane fuel cells. J. Power Sources 2005, 139, 73–78. [Google Scholar] [CrossRef]
- Saha, M.S.; Neburchilov, V.; Ghosh, D.; Zhang, J. Nanomaterials-supported Pt catalysts for proton exchange membrane fuel cells. Wiley Interdiscip. Rev. Energy Environ. 2012, 2, 31–51. [Google Scholar] [CrossRef]
- Wang, Y.; Shao, Y.; Matson, D.W.; Li, J.; Lin, Y. Nitrogen-Doped Graphene and Its Application in Electrochemical Biosensing. ACS Nano 2010, 4, 1790–1798. [Google Scholar] [CrossRef] [PubMed]
- Nores-Pondal, F.J.; Vilella, I.M.J.; Troiani, H.; Granada, M.; de Miguel, S.R.; Scelza, O.A.; Corti, H.R. Catalytic activity vs. size correlation in platinum catalysts of PEM fuel cells prepared on carbon black by different methods. Int. J. Hydrog. Energy 2009, 34, 8193–8203. [Google Scholar] [CrossRef]
- Fang, B.; Kim, M.-S.; Kim, J.H.; Song, M.Y.; Wang, Y.-J.; Wang, H.; Wilkinson, D.P.; Yu, J.-S. High Pt loading on functionalized multiwall carbon nanotubes as a highly efficient cathode electrocatalyst for proton exchange membrane fuel cells. J. Mater. Chem. 2011, 21, 8066–8073. [Google Scholar] [CrossRef]
- Will, F.G. Hydrogen Adsorption on Platinum Single Crystal Electrodes I. Isotherms and Heats of Adsorption. J. Electrochem. Soc. 1965, 112, 451–455. [Google Scholar] [CrossRef]
- Ferreira, P.J.; Shao-Horn, Y.; Morgan, D.; Makharia, R.; Kocha, S.; Gasteiger, H.A. Instability of Pt/C Electrocatalysts in Proton Exchange Membrane Fuel Cells A Mechanistic Investigation. J. Electrochem. Soc. 2005, 152, A2256–A2271. [Google Scholar] [CrossRef]
- Cheng, K.; He, D.; Peng, T.; Lv, H.; Pan, M.; Mu, S. Porous graphene supported Pt catalysts for proton exchange membrane fuel cells. Électrochim. Acta 2014, 132, 356–363. [Google Scholar] [CrossRef]
- Higgins, D.C.; Hassan, F.M.; Seo, M.H.; Choi, J.Y.; Hoque, M.A.; Lee, D.U.; Chen, Z. Shape-controlled octahedral cobalt disulfide nanoparticles supported on nitrogen and sulfur-doped graphene/carbon nanotube composites for oxygen reduction in acidic electrolyte. J. Mater. Chem. A 2015, 3, 6340–6350. [Google Scholar] [CrossRef]
- Grinou, A.; Yun, Y.S.; Cho, S.Y.; Park, H.H.; Jin, H.-J. Dispersion of Pt Nanoparticle-Doped Reduced Graphene Oxide Using Aniline as a Stabilizer. Materials 2012, 5, 2927–2936. [Google Scholar] [CrossRef] [Green Version]
- Choi, S.M.; Seo, M.H.; Kim, H.J.; Kim, W.B. Synthesis and characterization of graphene-supported metal nanoparticles by impregnation method with heat treatment in H2 atmosphere. Synth. Met. 2011, 161, 2405–2411. [Google Scholar] [CrossRef]


| Electrocatalyst | Mean Particle Diameter TEM (nm) |
|---|---|
| Pt/C | 3.4 |
| Pt/MWCNTs | 3.5 |
| Pt/FGLs | 4.3 |
| Electrocatalyst | Mean Particle Diameter TEM (nm) | Surface TEM (m²/gpt) | Real Electrochemical Surface (m²/gpt) | Pt Utilization % |
|---|---|---|---|---|
| Pt/C | 3.4 | 82 | 47 | 57 |
| Pt/MWCNTs | 3.5 | 80 | 32 | 40 |
| Pt/FGLs | 4.3 | 65 | 19 | 29 |
| Pt/(FGLs + MWCNTs) 75:25 | 4.0 | 70 | 53 | 76 |
© 2018 by the authors. Licensee MDPI, Basel, Switzerland. This article is an open access article distributed under the terms and conditions of the Creative Commons Attribution (CC BY) license (http://creativecommons.org/licenses/by/4.0/).
Share and Cite
Remy, E.; Thomas, Y.R.J.; Guetaz, L.; Fouda-Onana, F.; Jacques, P.-A.; Heitzmann, M. Optimization and Tunability of 2D Graphene and 1D Carbon Nanotube Electrocatalysts Structure for PEM Fuel Cells. Catalysts 2018, 8, 377. https://doi.org/10.3390/catal8090377
Remy E, Thomas YRJ, Guetaz L, Fouda-Onana F, Jacques P-A, Heitzmann M. Optimization and Tunability of 2D Graphene and 1D Carbon Nanotube Electrocatalysts Structure for PEM Fuel Cells. Catalysts. 2018; 8(9):377. https://doi.org/10.3390/catal8090377
Chicago/Turabian StyleRemy, Emeline, Yohann. R. J. Thomas, Laure Guetaz, Frédéric Fouda-Onana, Pierre-André Jacques, and Marie Heitzmann. 2018. "Optimization and Tunability of 2D Graphene and 1D Carbon Nanotube Electrocatalysts Structure for PEM Fuel Cells" Catalysts 8, no. 9: 377. https://doi.org/10.3390/catal8090377