1. Introduction
The increase in global energy demand, depletion of fossil fuel reserves and climate change issues have drawn attention to renewable alternatives, particularly to biomass [
1,
2,
3], considering its CO
2 neutrality for fuel applications and widespread availability [
1,
4]. Products such as heat, power, biomaterials, chemical compounds, and transportation fuels can be obtained from biomass [
5]. Considering this purpose, thermochemical, chemical-catalytical or biological processes are used. Regarding the first category, combustion, gasification and pyrolysis are most common. Although considered the simplest way to convert biomass in either power or heat, combustion shows high emissions and ash generation [
5]. Gasification is considered a very efficient method to obtain fuels, but it requires a high investment due to large-scale installations, storage and transportation [
6]. Therewith, pyrolysis has been considered a promising process as it balances simple operation techniques with reasonable costs.
Pyrolysis is a thermochemical process in which the biomass is heated and converted in an inert atmosphere into a liquid fraction called bio-oil, a carbon-rich solid (biochar) and a mixture of non-condensable gases [
7]. The bio-oil obtained has poorer physical and chemical characteristics if compared to liquid fossil fuels. The heating value is usually lower, only 40–50% compared to conventional fossil fuels (42–45 MJ/Kg), mainly due to the high oxygen and water content. Additionally, it shows high viscosity, low chemical stability and solid particles [
8,
9,
10] due to incomplete solid separation or polymerization reactions during storage, for example. Carboxylic acids present in the bio-oil composition lead to high acidity (pH value around 2–3.7), resulting in a bio-oil with potentially corrosive properties. Furthermore, it is highly unstable during storage due to ongoing chemical reactions, resulting in larger molecules by polymerization, etherification and esterification [
9], for example. Additionally, it is immiscible with fossil fuels and tends to undergo phase separation when stored for a long time. Considering these poor fuel properties, the direct application of bio-oil is limited to furnaces and boilers, being unsuitable for application in gas turbines, diesel engines and other applications without further treatment [
11]. Concerning bio-oil production today, wood with low ash content is used, leading to relatively “well-natured” bio-oils. Using ash-rich feedstocks, bio-oil yield and quality is decreased, while the tendency for phase separation increases.
To improve these properties and obtain a product resembling diesel fuel, bio-oil requires an additional upgrading treatment. Upgraded bio-oil can then be used as feedstock for producing chemicals, such as phenols for resin production, additives for fertilizers and pharmaceutical industries, as well as flavoring agents in the food industry [
12]. Regarding terms of energetic use, upgraded bio-oil might be used as feedstock in oil refineries and fuels in engines [
13].
A variety of upgrading techniques already have been proposed, such as catalytic cracking, hydrodeoxygenation (HDO) and esterification in supercritical fluids [
14]. Among them, HDO appears to be a propitious route, due to its flexibility with respect to the biomass feed, the good economy of the input materials, and its compatibility with refinery infrastructures [
15]. HDO is a high-pressure catalytic treatment in which oxygen is removed by hydrogen resulting in water, which is environmentally benign [
16]. Usually, sulfides, noble metals and transition metal catalysts are used [
17]. Noble metals such as Pt, Pd and Ru have been evaluated widely for HDO and are often the first choice in hydrogenation reactions. Additionally, they have a low tendency to be poisoned by the sulfur present in the bio-oil [
18]. Their relatively high costs, however, prevent them from being widely used. Recently, nickel-based catalysts have become more attractive, considering their lower price, availability, activity and reduced hydrogen consumption [
10,
19]. Jin et al. [
20] evaluated a series of nickel-based catalysts on different supports (SiO
2, Al
2O
3, AC and SBA–15 mesoporous silica) for the HDO of anisole, used as a model compound. Boscagli et al. [
21] investigated the HDO of the bio-oil light phase over a variety of nickel-based catalysts (NiCu/Al
2O
3, Ni/SiO
2, Ni/ZrO
2, Ni/TiO
2 and NiW/AC). Dongil et al. [
22] studied the HDO of guaiacol over nickel-based catalysts, using different carbon-based supports.
The combination of nickel in bimetallic catalysts has also attracted attention for HDO, especially in combination with copper. Ardiyanti et al. [
23] evaluated the application of NiCu at different loadings supported in δ–Al
2O
3 for upgrading of model compounds and fast-pyrolysis bio-oil. Dongil et al. [
24] investigated the effect of Cu loading on nickel catalysts supported in carbon nanotubes over the HDO of guaiacol. Mortensen et al. [
25] screened different catalysts, including NiCu/SiO
2 for phenol HDO and, more recently, Boscagli et al. [
26] tested NiCu/Al
2O
3 for the HDO of phenol and bio-oils reusing the catalyst after a regeneration step.
The investigation of nickel and nickel–copper catalysts on SiO
2 and ZrO
2 supports with real feedstock (fast-pyrolysis bio-oil) is of interest, especially with respect to the lower acidity in comparison to Al
2O
3, a commonly studied support for HDO catalysts [
27]. Many studies are focused on alumina-supported catalysts (Al
2O
3) [
23,
26] and upgrading applying model compounds [
20,
22] but supports with higher stability are required. The alumina-support is well known for its acidity, tendency for increased coke formation, low water tolerance, and conversion to boehmite, resulting in the oxidation and deactivation of the active metal [
15,
28,
29]. According to He et al. [
28], the selection of the support for HDO of bio-oils, must consider the resistance to the water content, the acidity of the supports to reduce coke formation, the porosity and its ability to keep the active metal dispersed for the activation of hydrogen. Hence, the investigation of different supports, such as SiO
2 and ZrO
2, appears interesting, especially when including catalyst regeneration in consecutive cycles of HDO-regeneration, evaluating the thermal stability of the catalyst [
30]. Presently, only a few works have investigated the regeneration and evaluation of the reuse of the catalyst [
26]. Most works, in fact, only consider one regeneration step and do not contemplate Ni catalysts [
26,
31,
32]. It is an essential step to reduce costs, minimizing the waste generation at the same time helping to increase the reusability and recyclability of the catalysts, extending its lifetime [
33]. Additionally, previous studies considered the HDO of model compounds whereas others considered the application of fast pyrolysis bio-oil. Usually, different temperature, pressure and reactor designs are used, which makes the comparison of the performance of different nickel-based catalysts difficult.
The current work synthesizes, characterizes and evaluate four nickel-based catalysts for a multi-phase fast-pyrolysis bio-oil upgrading. Supports with higher stability (SiO2 and ZrO2) are selected. The catalyst with the best performance is then reused in subsequent HDO-regeneration steps, resulting in four consecutive reactions. Finally, the performance and the catalytic activity along the HDO-regeneration steps are assessed and discussed.
3. Discussion
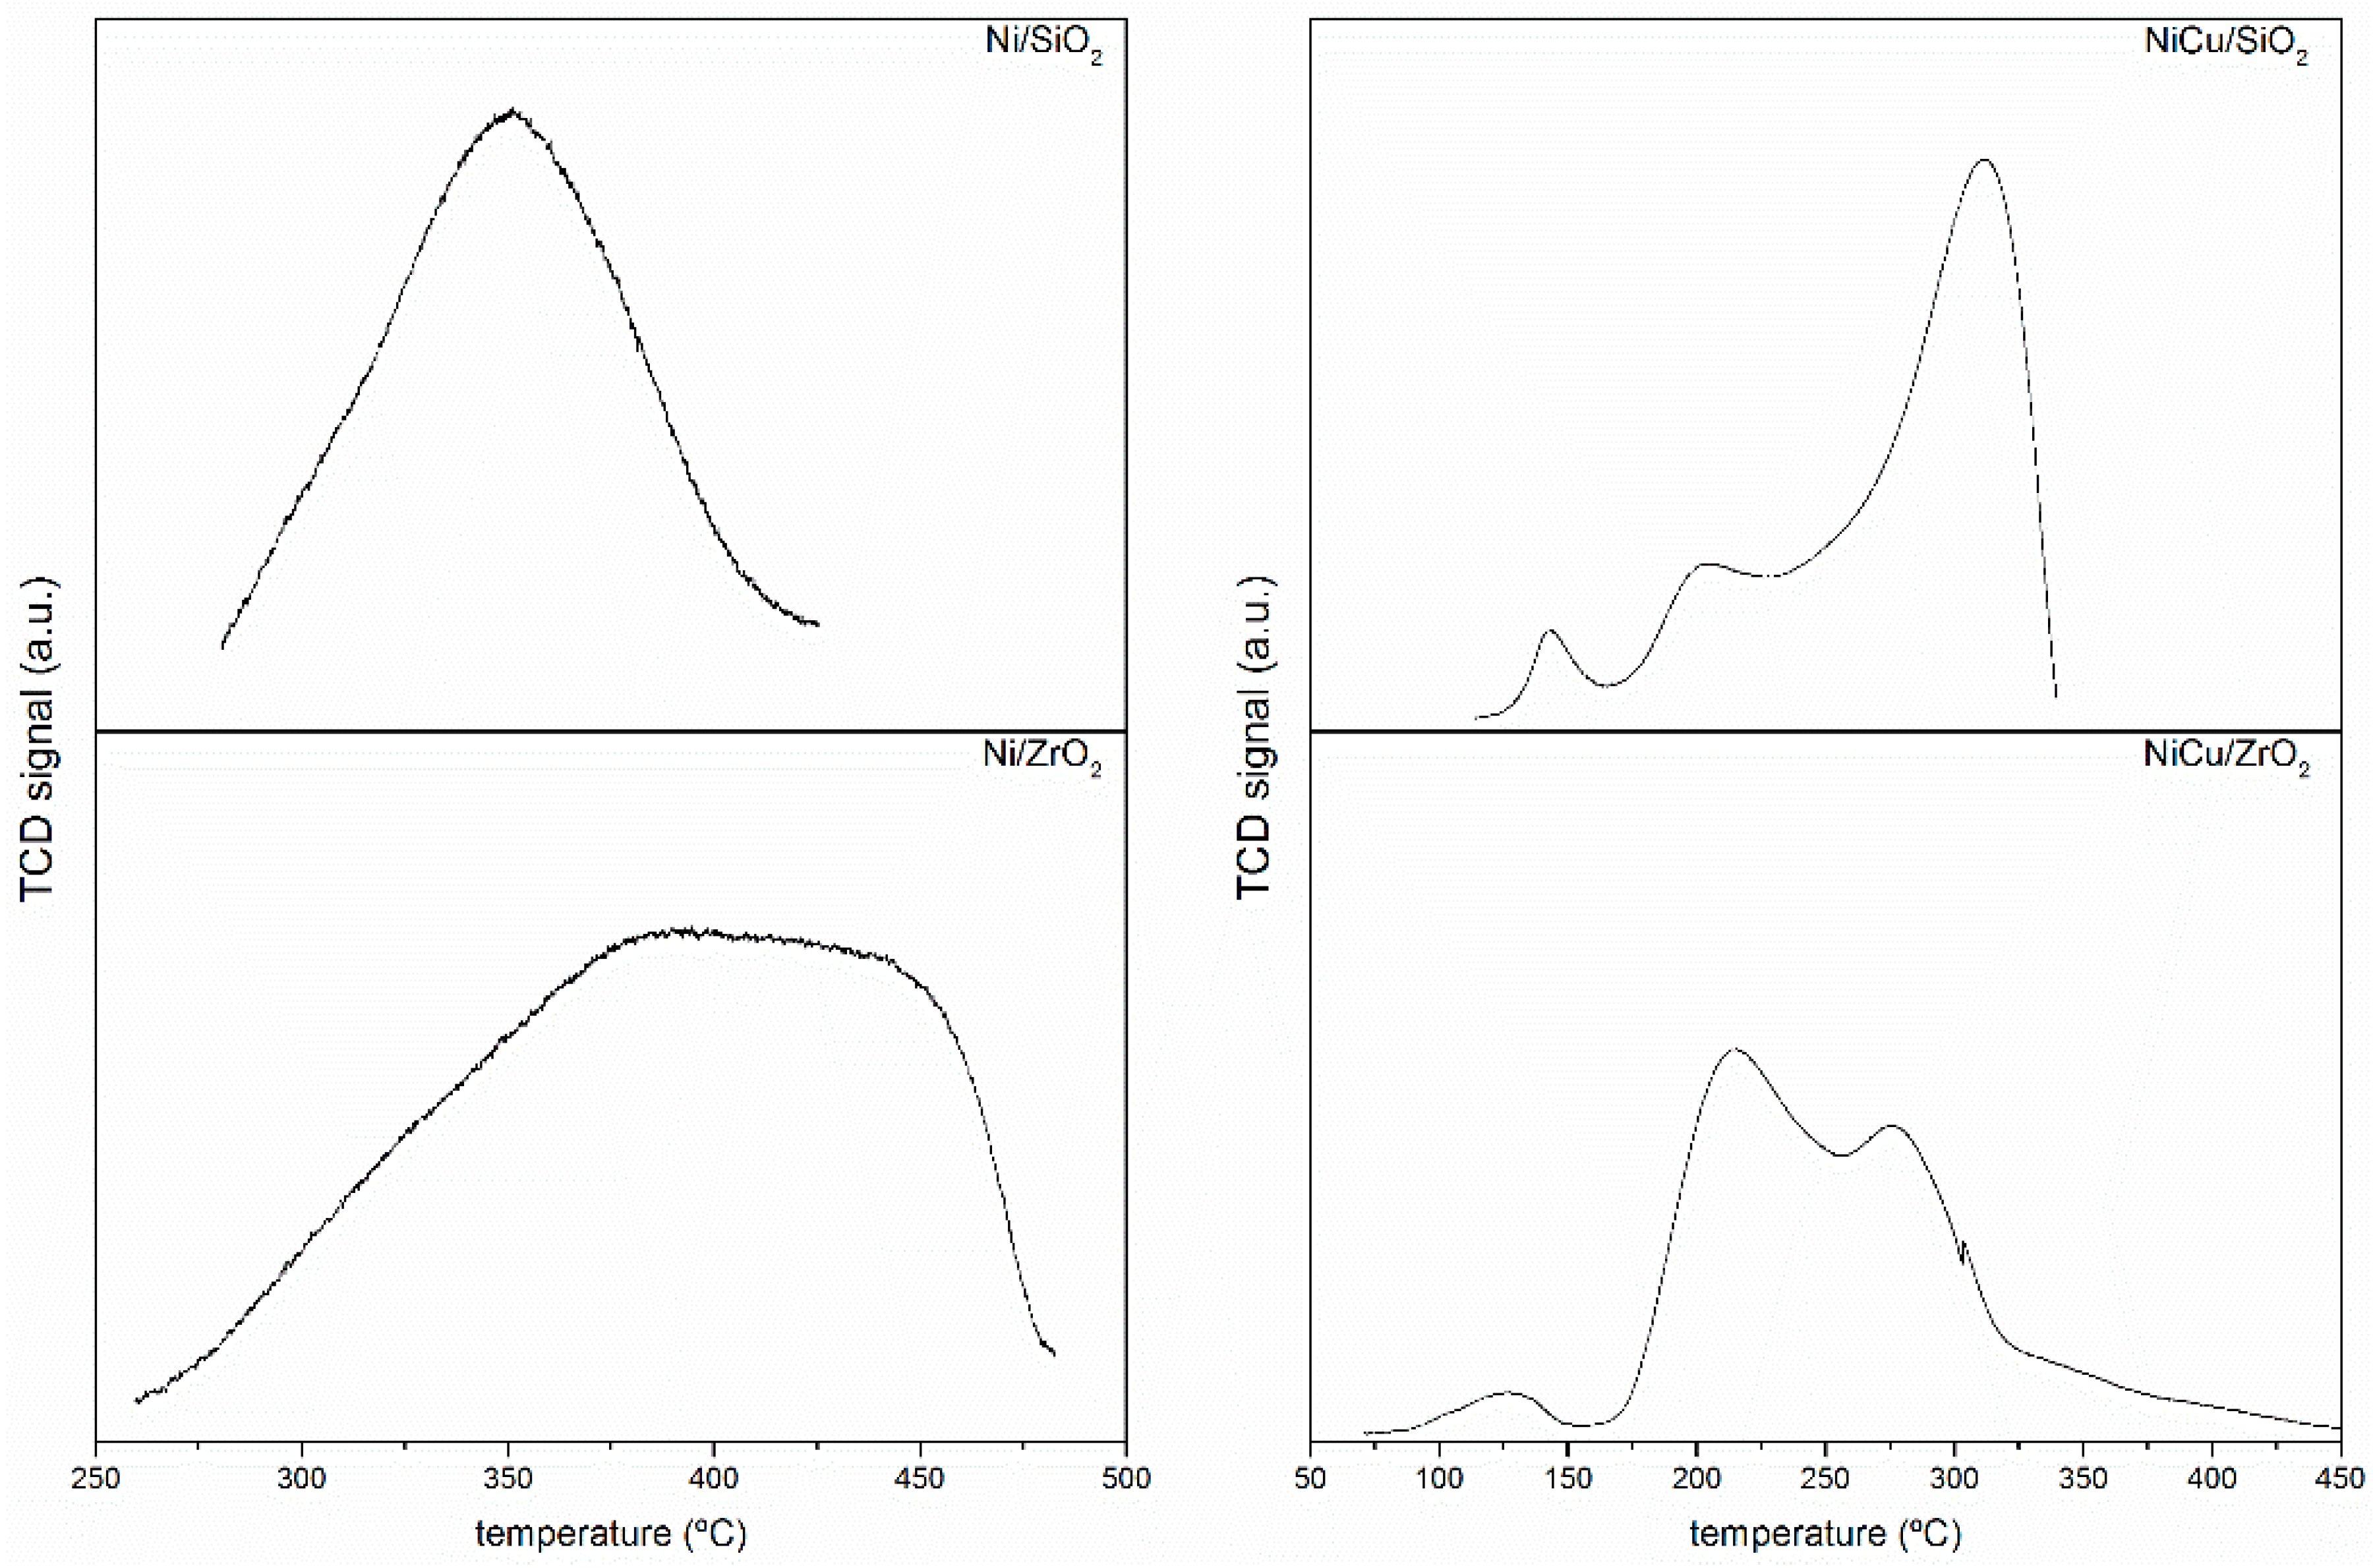
The synthesis and evaluation of nickel-based catalysts showed differences among the catalysts evaluated. The temperature programmed reduction (H
2-TPR) showed that the catalysts, with the addition of copper as a promoter and higher loading of nickel, had lowered the reduction temperature of nickel oxides, which is in agreement with previous studies [
30,
38].
The evaluation of the catalysts for hydrodeoxygenation (HDO) reactions showed that upgraded bio-oil obtained with Ni/SiO
2 showed the best properties in terms of low oxygen concentration, low water concentration and high HHV. The higher HDO activity for this catalyst can be correlated with its higher surface area in comparison to the other catalysts tested in this study, which could be beneficial to increase the dispersion of the active components, resulting in a more active catalyst [
20,
64]. Coincidently, the ZrO
2-supported catalysts showed a lower HDO activity, which might be attributed to the lower surface area of this support [
42]. Similar to the current study’s findings, Dongil et al. [
24] observed lower HDO activity for NiCu catalysts in comparison to monometallic Ni catalysts. The authors attributed the lower guaiacol HDO to the larger particle size, the presence of NiO particles as well as to copper particles located at the nickel active sites. Furthermore, a higher crystallite size of bimetallic catalysts, as observed for both NiCu catalysts, also might play a role in the lower HDO activity; the higher crystallite size decreases the number of step/corner sites, which, according to Mortensen et al. [
15], are more active for breaking C-O bonds.
Coke formation is another important parameter for the selection of the catalyst. Observed for both Ni/SiO
2 and NiCu/SiO
2, the volume of the micropores was reduced significantly after the reactions. Coke is known for blocking the pores, covering the catalyst active sites, resulting in partial or even complete loss of activity [
61], therefore, it is considered one of the main causes of deactivation in HDO reactions [
8,
15,
28]. Considering that the catalyst acidity is connected directly to coke formation [
8], the lower coke formation observed with Ni/SiO
2 could be related to the low acidity of silica [
28]. Due to the amphoteric nature of ZrO
2, reduced coke formation would be expected [
28]; However, SiO
2 was more resistant to coke formation. The addition of Cu also seems to contribute to the slightly higher amount of coke deposited on the bimetallic catalysts. Stated by Zhang et al. [
42], the addition of copper increases the acidity of the catalyst, which can result in higher coke deposition [
27], as observed. Hence, the lowest coke deposition observed for Ni/SiO
2 can be related to the lower acidity compared to NiCu/SiO
2 and higher resistance of SiO
2 in comparison to ZrO
2.
Reactive compounds, such as aldehydes, were converted completely after the upgrading. The reduction of these very reactive compounds results in a more stable oil [
15,
29]. The lower conversion of aromatic compounds over all the catalysts evaluated also is interesting; if further upgrading is intended, aiming at fuel production, the presence of aromatic compounds could result in a high octane number gasoline [
29].
Different selectivity among mono and bimetallic catalysts was attributed mostly to the addition of copper [
69], with a minor contribution of nickel loading [
22]. Furfural, also a very reactive compound [
72], mainly seemed to be hydrogenated to tetrahydrofurfuryl alcohol over NiCu catalysts. Additionally, the presence of propylene glycol leads to the conclusion that hydroxyacetone was mainly hydrogenated to this compound over bimetallic catalysts. Concurring with other authors, the addition of copper seems to increase the hydrogenation [
24], increasing the hydrogen consumption. Furthermore, the higher hydrogen consumption observed for NiCu catalysts is in agreement with literature [
21,
23] giving evidence that the addition of a second metal can increase the hydrogenation activity of the catalyst [
69]. Stated by Mortensen et al. [
15], the H/C and O/C is used to evaluate the quality of the upgraded product. A higher H/C ratio is intended, whereas a lower O/C ratio is desired. In this case, it was observed that the higher H/C ratio for NiCu/SiO
2 agrees with the higher consumption of H
2 observed for this catalyst, but it was not reflected in the O/C ratio. The lowest O/C was obtained for Ni/SiO
2 (0.18), being much lower in comparison to the O/C ratio of the feed (0.47). It is important to note higher hydrogenation results in higher consumption of hydrogen [
57,
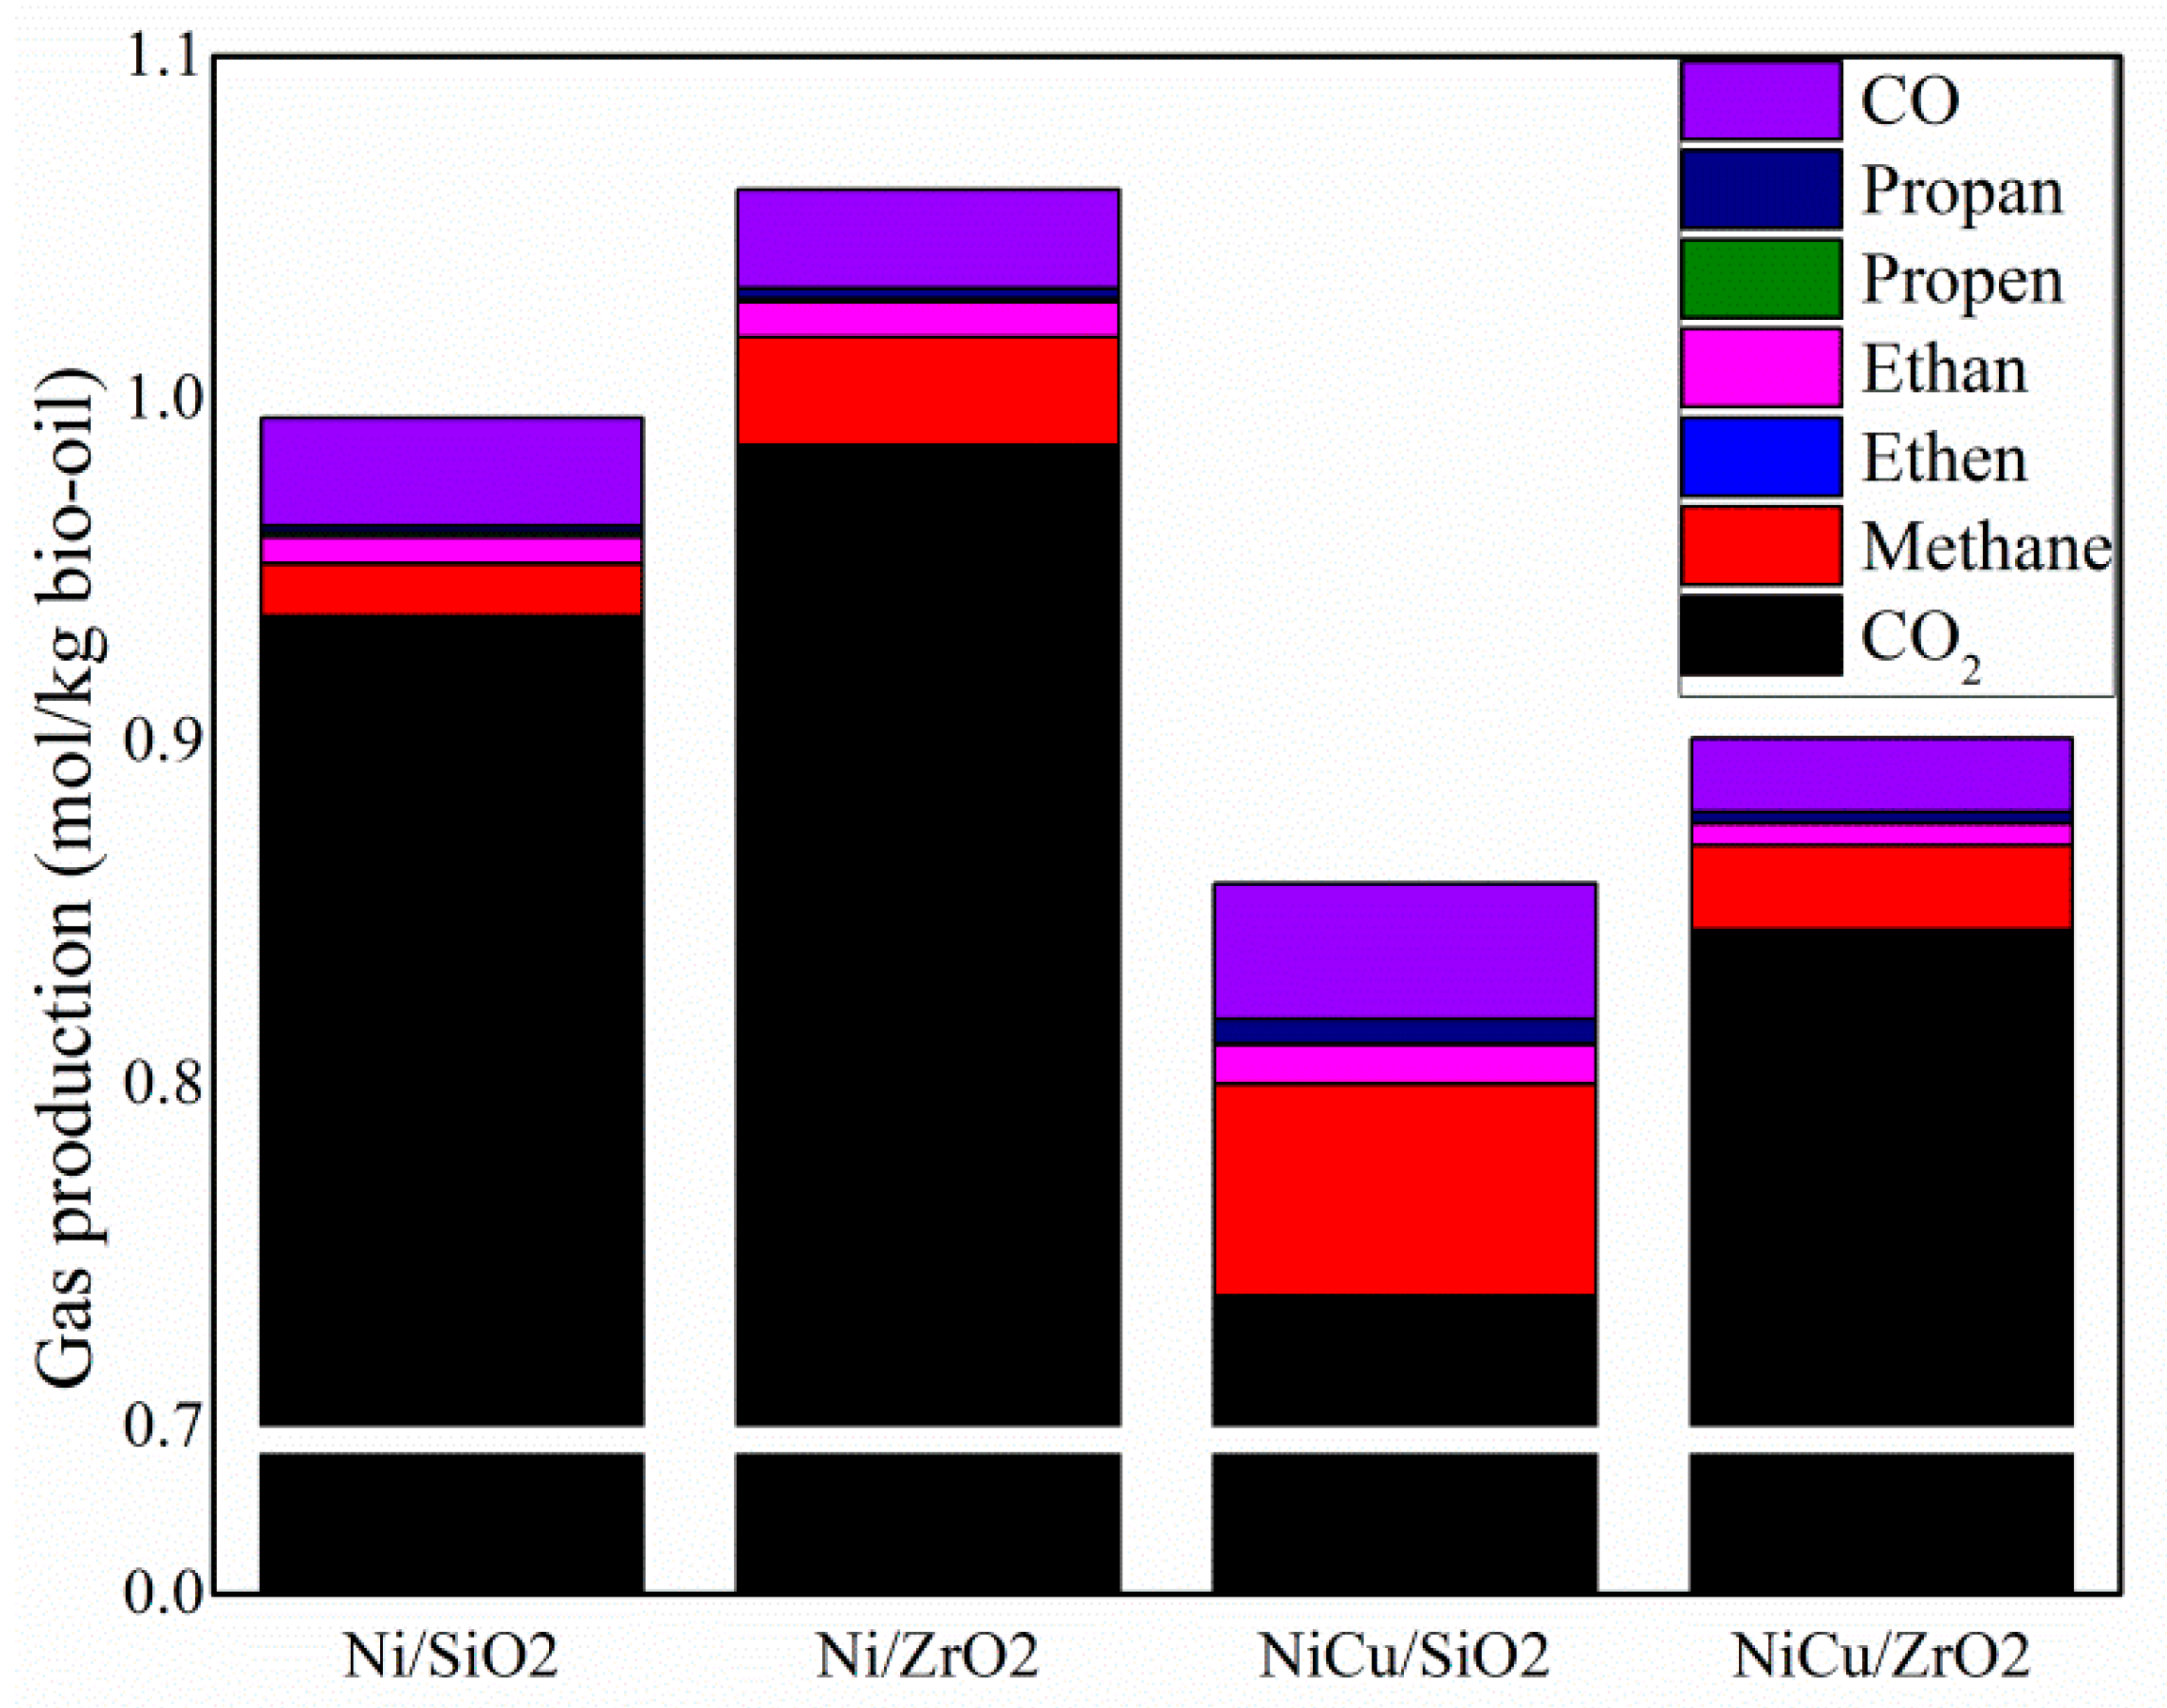
73], but it is not necessarily reflected in the reduction of the oxygen content. Moreover, the higher consumption of hydrogen can also result in higher methane formation [
35], considering that during the hydrocracking the consumption of hydrogen is higher compared to hydrotreating [
74]. This behavior was observed for NiCu/SiO
2. The catalyst showed not just the higher hydrogen consumption, but also a higher methane formation. The desired catalyst should be able to remove the larger amount of oxygen with minimal hydrogen consumption [
24] as hydrogen consumption, bio-oil yield and catalyst deactivation are among the most important parameters to be considered in the HDO process [
75]. Ni/SiO
2, therefore, was considered the more appropriate catalyst in terms of H
2 consumption and HDO activity.
After the reaction, compounds such as calcium (only over ZrO
2) and sulfur were observed on the spent catalysts by two different analytical techniques, Inductively Coupled Plasma Emission Spectroscopy (ICP-OES) and Scanning Electron Microscopy/Energy Dispersive X-ray spectroscopy (SEM-EDX). Calcium, observed in higher concentrations in comparison to sulfur over the zirconia-supported catalysts, on the one hand acts as a poisoning agent, reducing the mobility and re-dispersion of the active metal centers over the support and, on the other hand, can reduce sintering, due to the reduction in the atom mobility, resistance to dissociation and migration [
61].
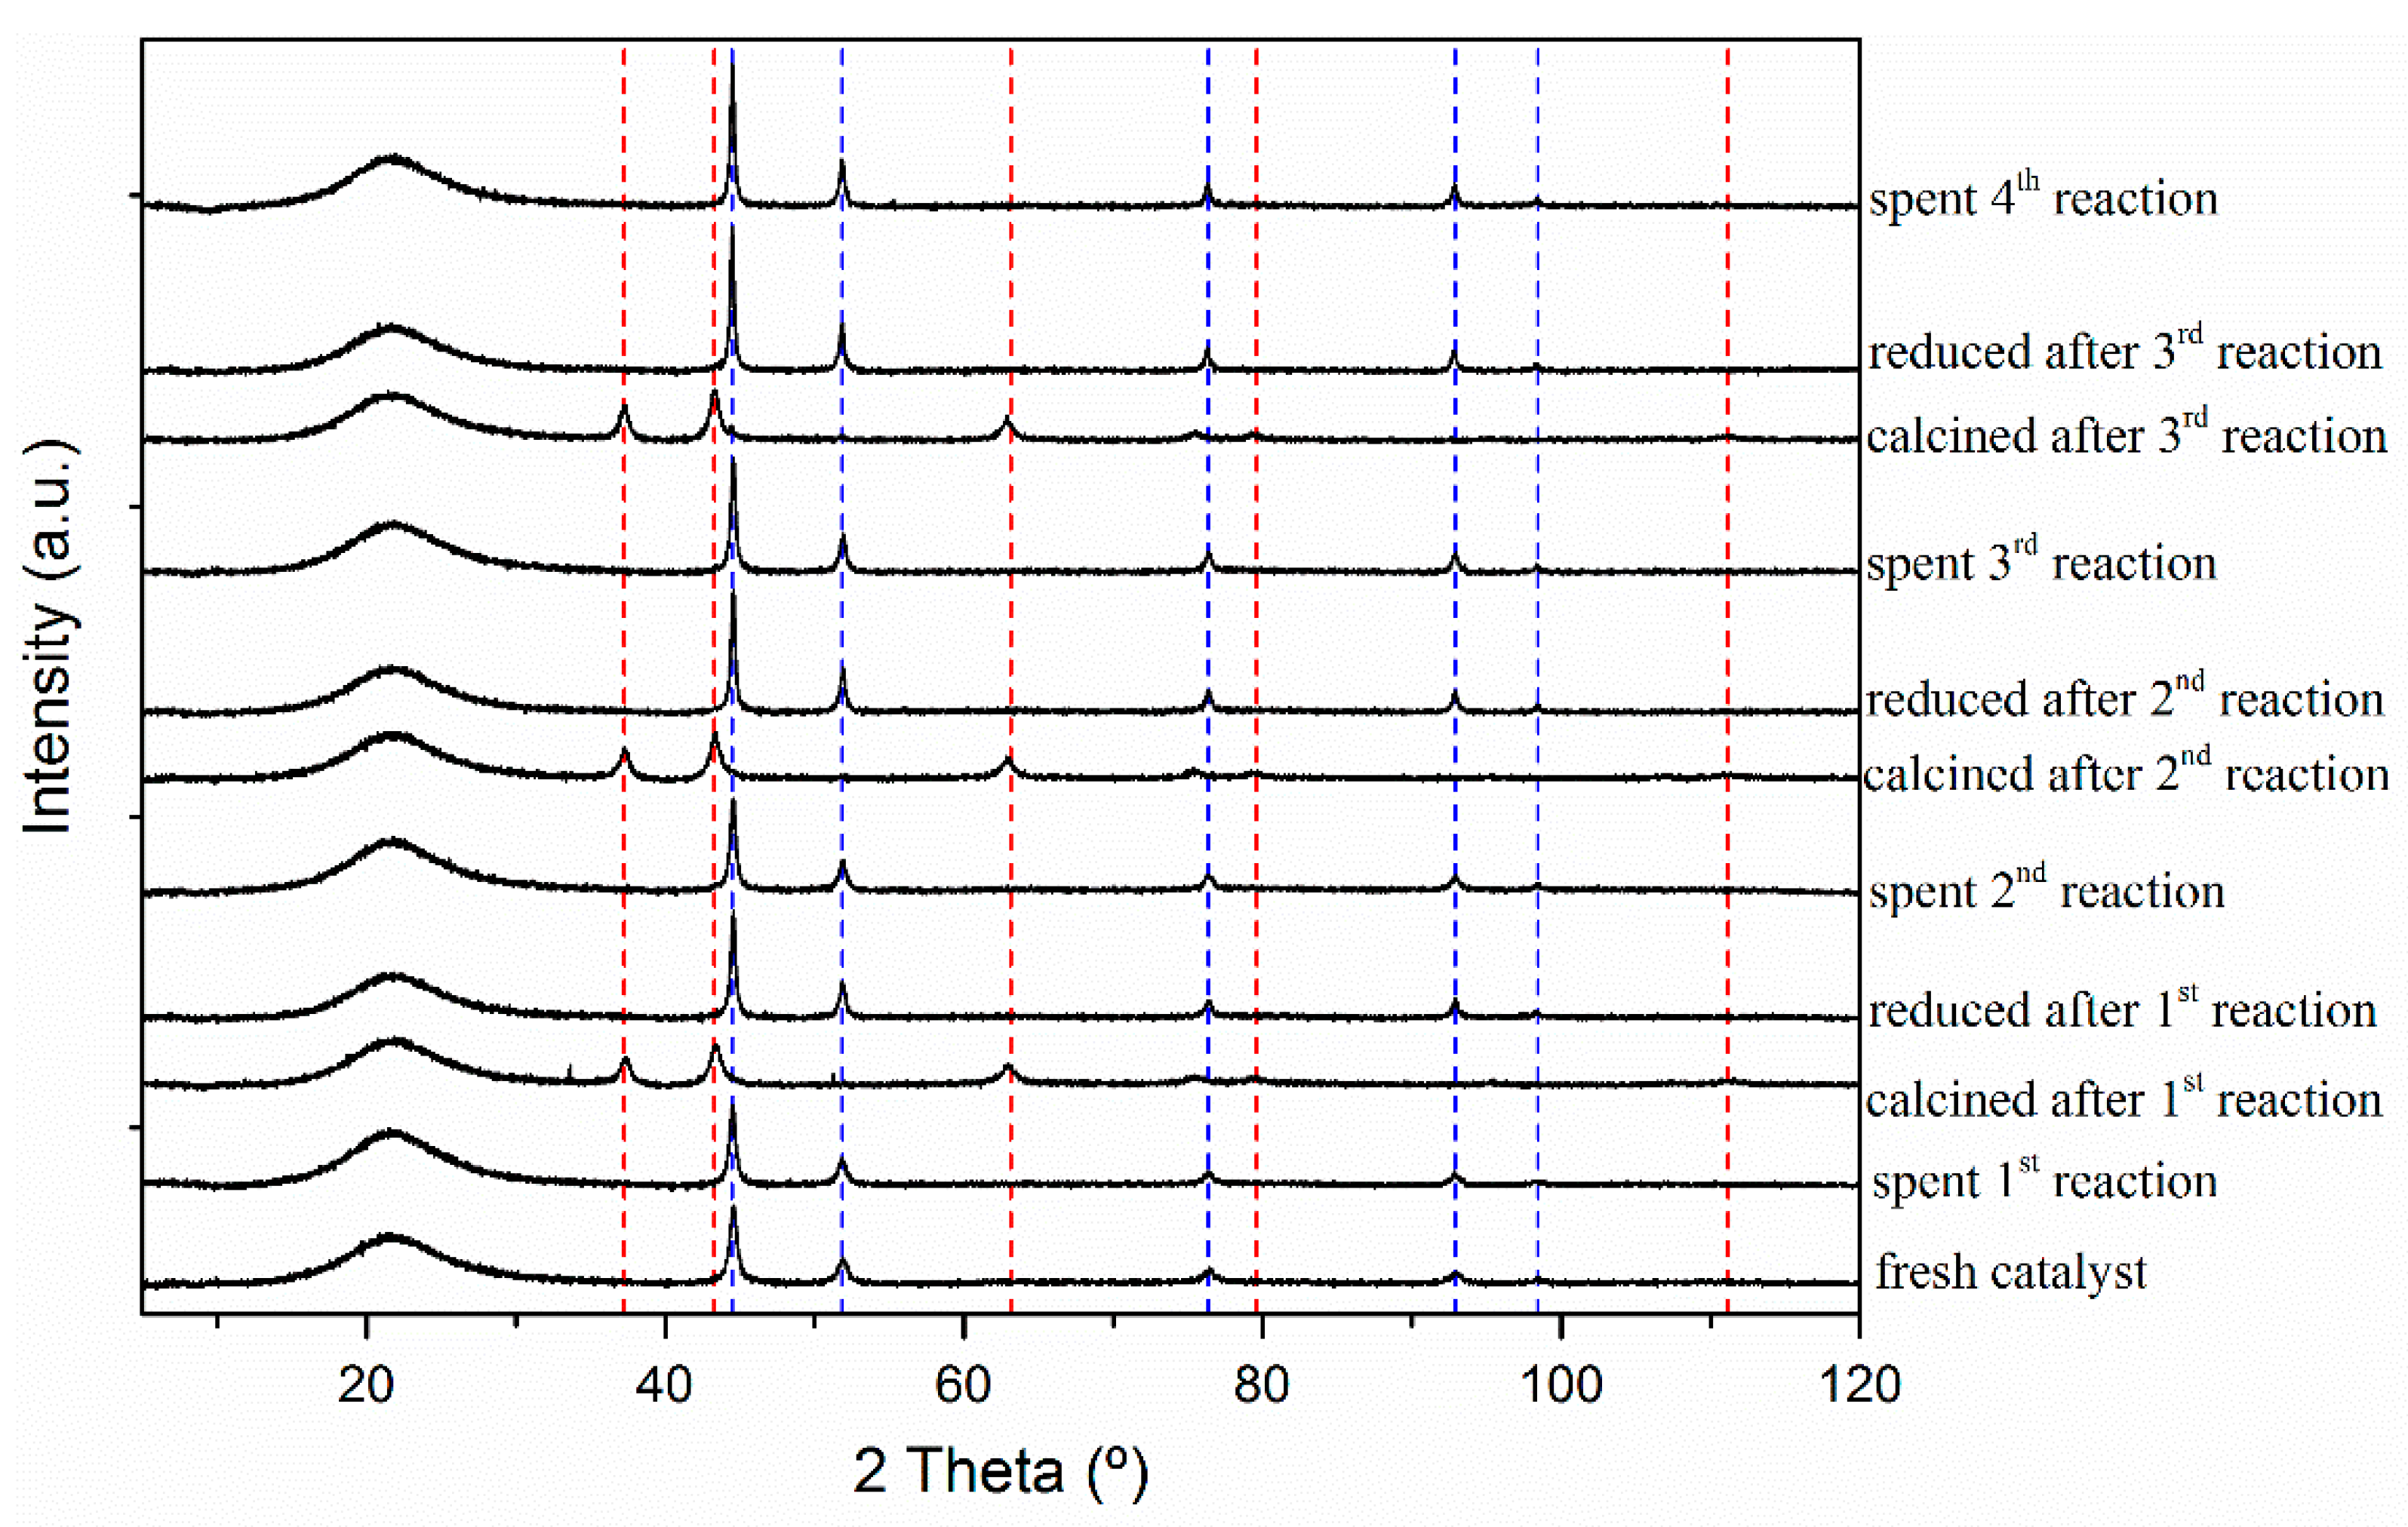
Despite the detection of sulfur on the catalyst’s surface, structural changes were not observed after the reactions by Powder XRD, as observed in previous investigations. Mortensen et al. [
66] observed a reflection at approximately 2θ = 45.2°, attributed to NiS during the evaluation of the influence of sulfur over the conversion of guaiacol with Ni/ZrO
2. Boscagli et al. [
26] observed the formation of Ni
3S
2, which was persistent to regeneration and changed the catalyst structure. The concentration of sulfur in the feed, in this case, varies significantly in both works. While Mortensen et al. used a model mixture containing 0.05 wt.% of sulfur, Boscagli et al. used feedstocks with a higher concentration of sulfur (light bio-oil phase with 0.05 wt.% of sulfur and straw bio-oil obtained at 450 °C with 0.3 wt.% of sulfur). The high concentration of sulfur resulted in a spent catalyst with a much higher concentration of sulfur on the catalyst (0.6–2.0 wt.%, SEM-EDX), in comparison to the current study’s findings (feed sulfur concentration = 0.012 wt.% and spent catalysts ≤0.1–0.4 wt.%, SEM-EDX). Even without structural changes, sulfur is one of the most persistent poisons for nickel catalysts. It is irreversibly chemisorbed and responsible for blocking the reaction-adsorption active site, modifying electronically the neighbor atom of metals and, thereby, reducing the ability to adsorb and dissociate H
2, at the same time influencing the diffusion or reactants, blocking their contact with the active site [
61].
Along with the consecutive reactions with Ni/SiO
2, comparable carbon and hydrogen concentrations and a slightly higher oxygen concentration was observed in the upgraded bio-oils. The oxygen concentration reached20.34 wt.% after the fourth reaction. It was higher compared to the first reaction (17.86 wt.%) but still much lower compared to the feed (35.84 wt.%, dry basis). It gives evidence of a low rate of deactivation and the possibility to reuse the catalyst. The increase in the oxygen concentration can be correlated with the reduction in the H
2 uptake, in agreement with lower HDO activity of Ni/SiO
2 in comparison to the fresh catalyst [
76]. The current authors assumed that the reduced activity can be correlated mainly to sintering, poisoning and coke deposition (although easily removed during the calcination step), as the leaching was negligible. The crystallite size increased over the cycles in the same proportion that the HDO activity was reduced along the consecutive reactions. The fresh catalyst showed a crystallite size of 17.7 nm, reaching 37.3 nm after the fourth reuse. Thus, the number of active surfaces available were reduced with the increase of the crystallite size [
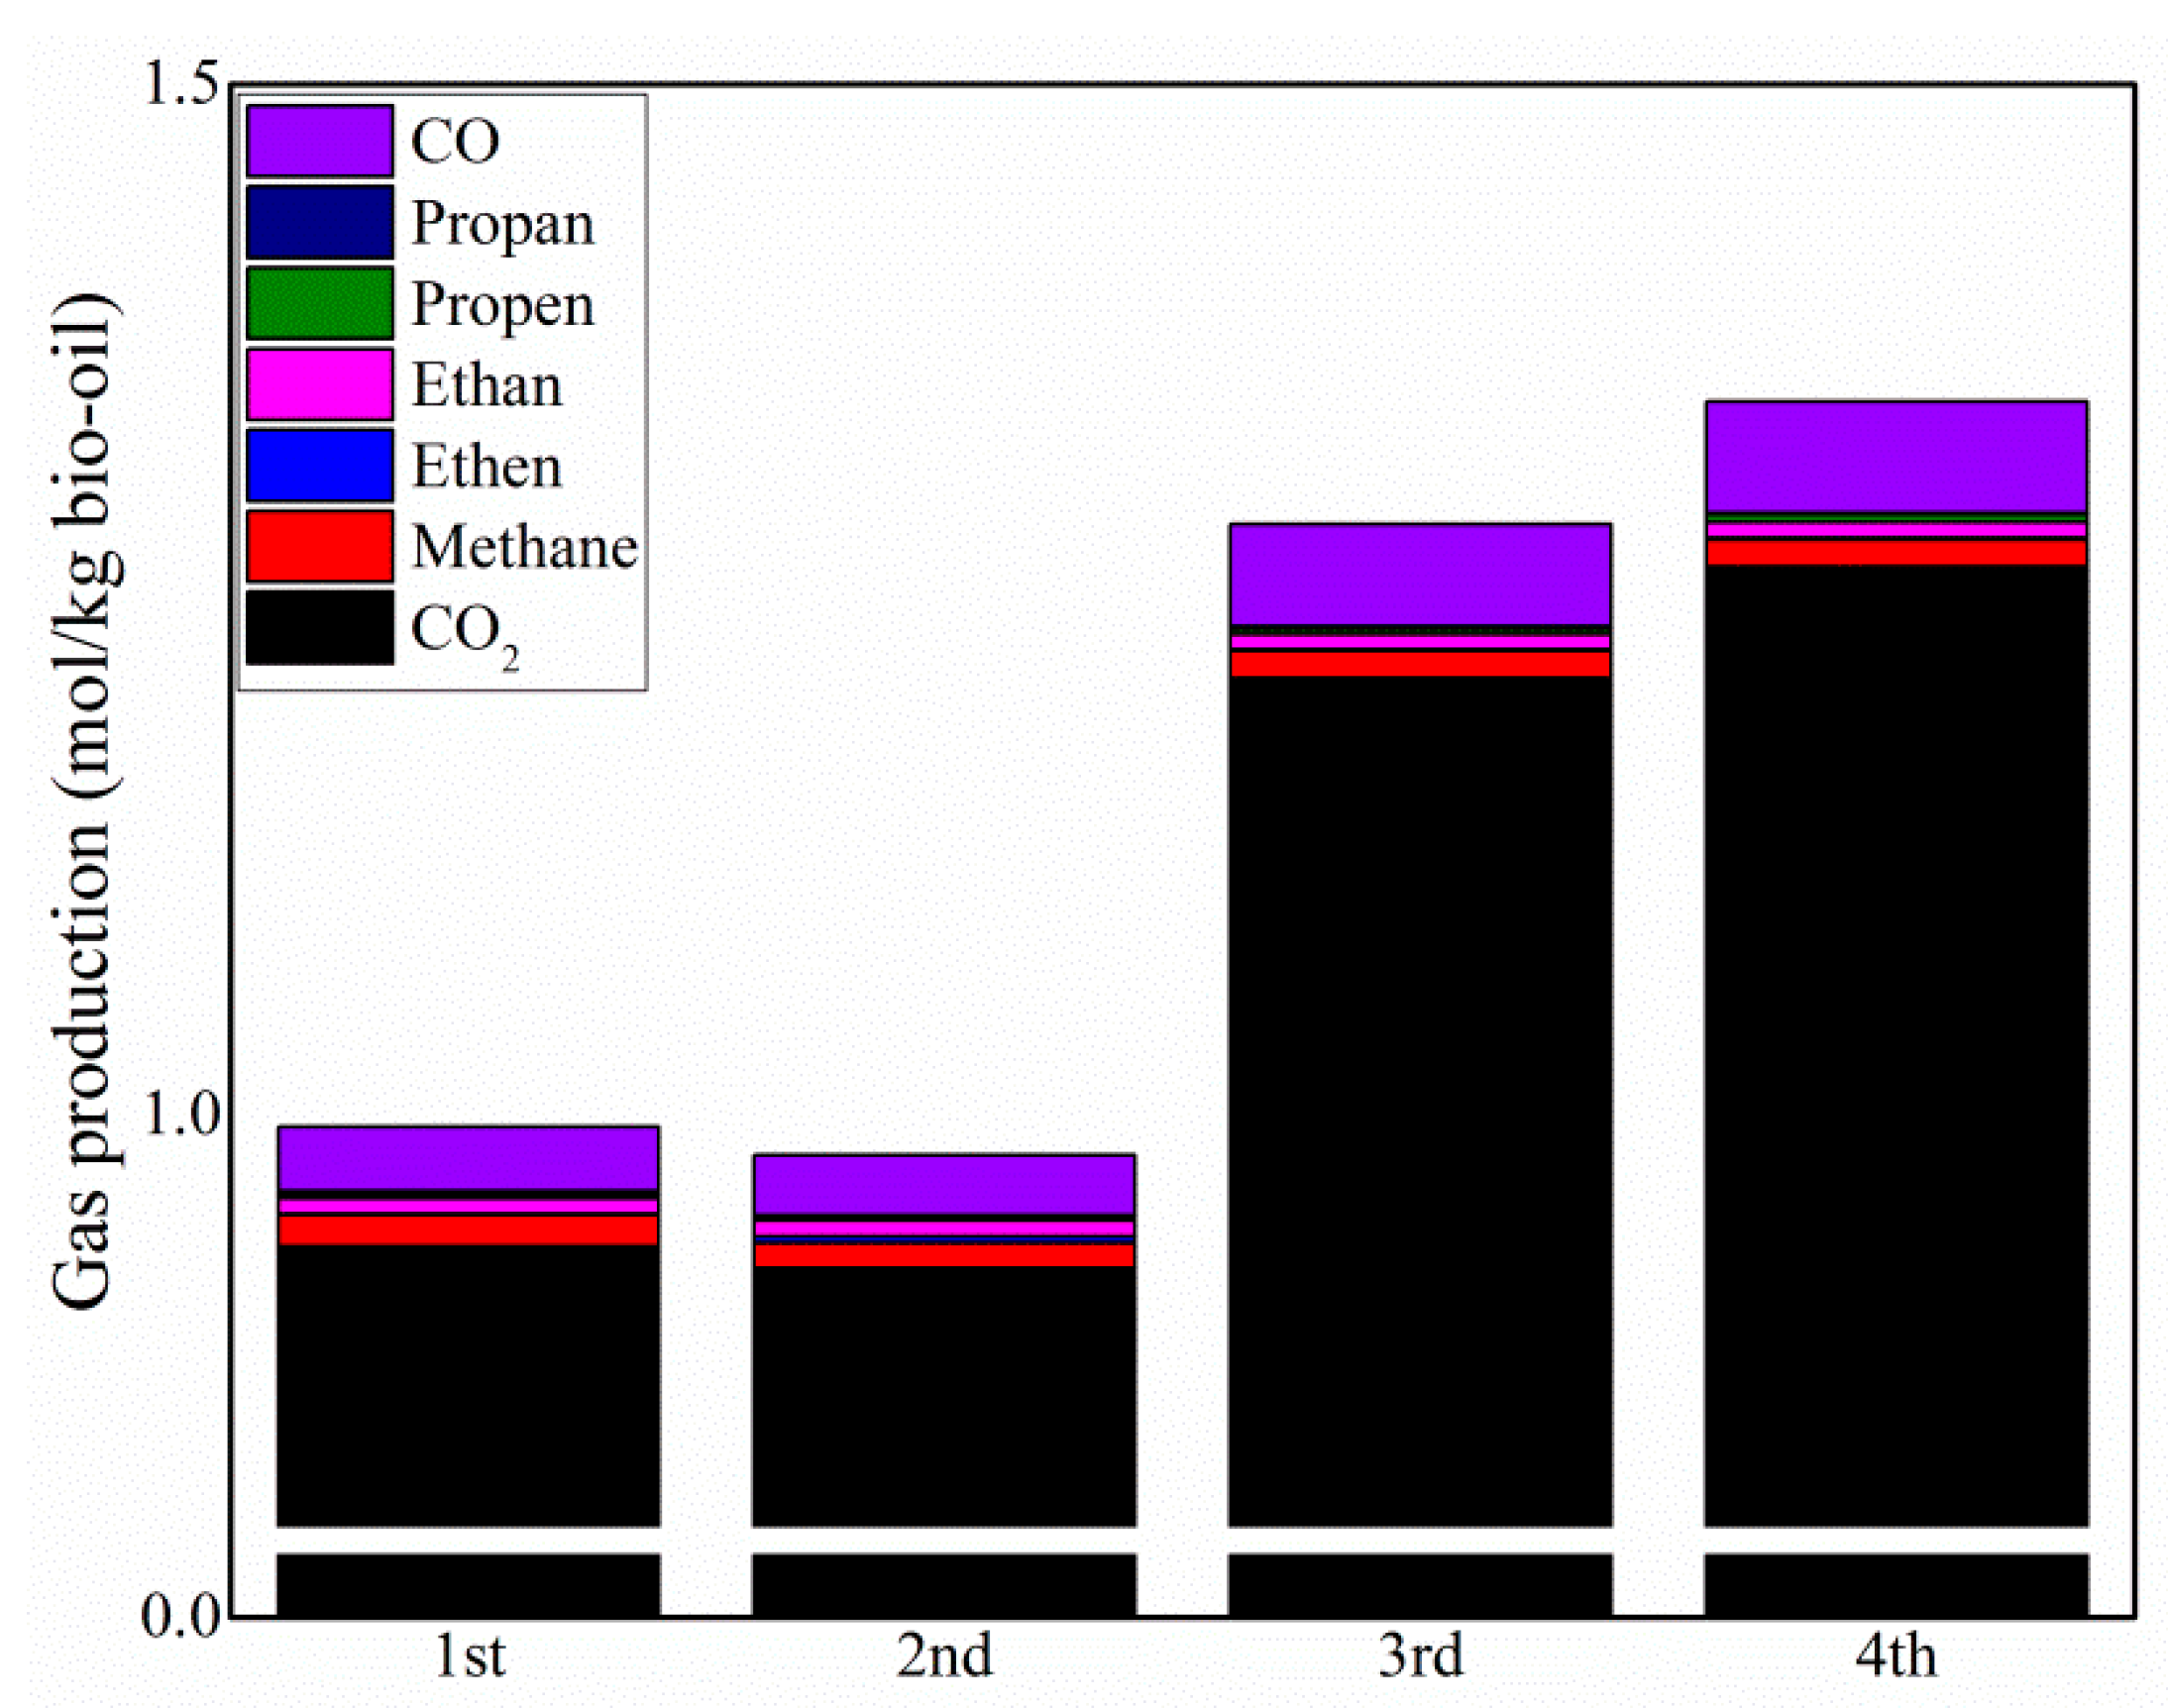
61]. Furthermore, the lower H
2 uptake can also result in a higher amount of CO
2 formation, as observed along the cycles, considering the higher the hydrogen uptake, the lower the CO
2 production [
46]. Curiously, the sulfur concentration remained approximately constant along the cycles. Furthermore, no differences were observed in the XRD diffractions. The current authors concluded that sulfur was strongly adsorbed on the catalyst, affecting surface-sensitive reactions, resulting only in partial loss of activity of the catalytic surface [
61].
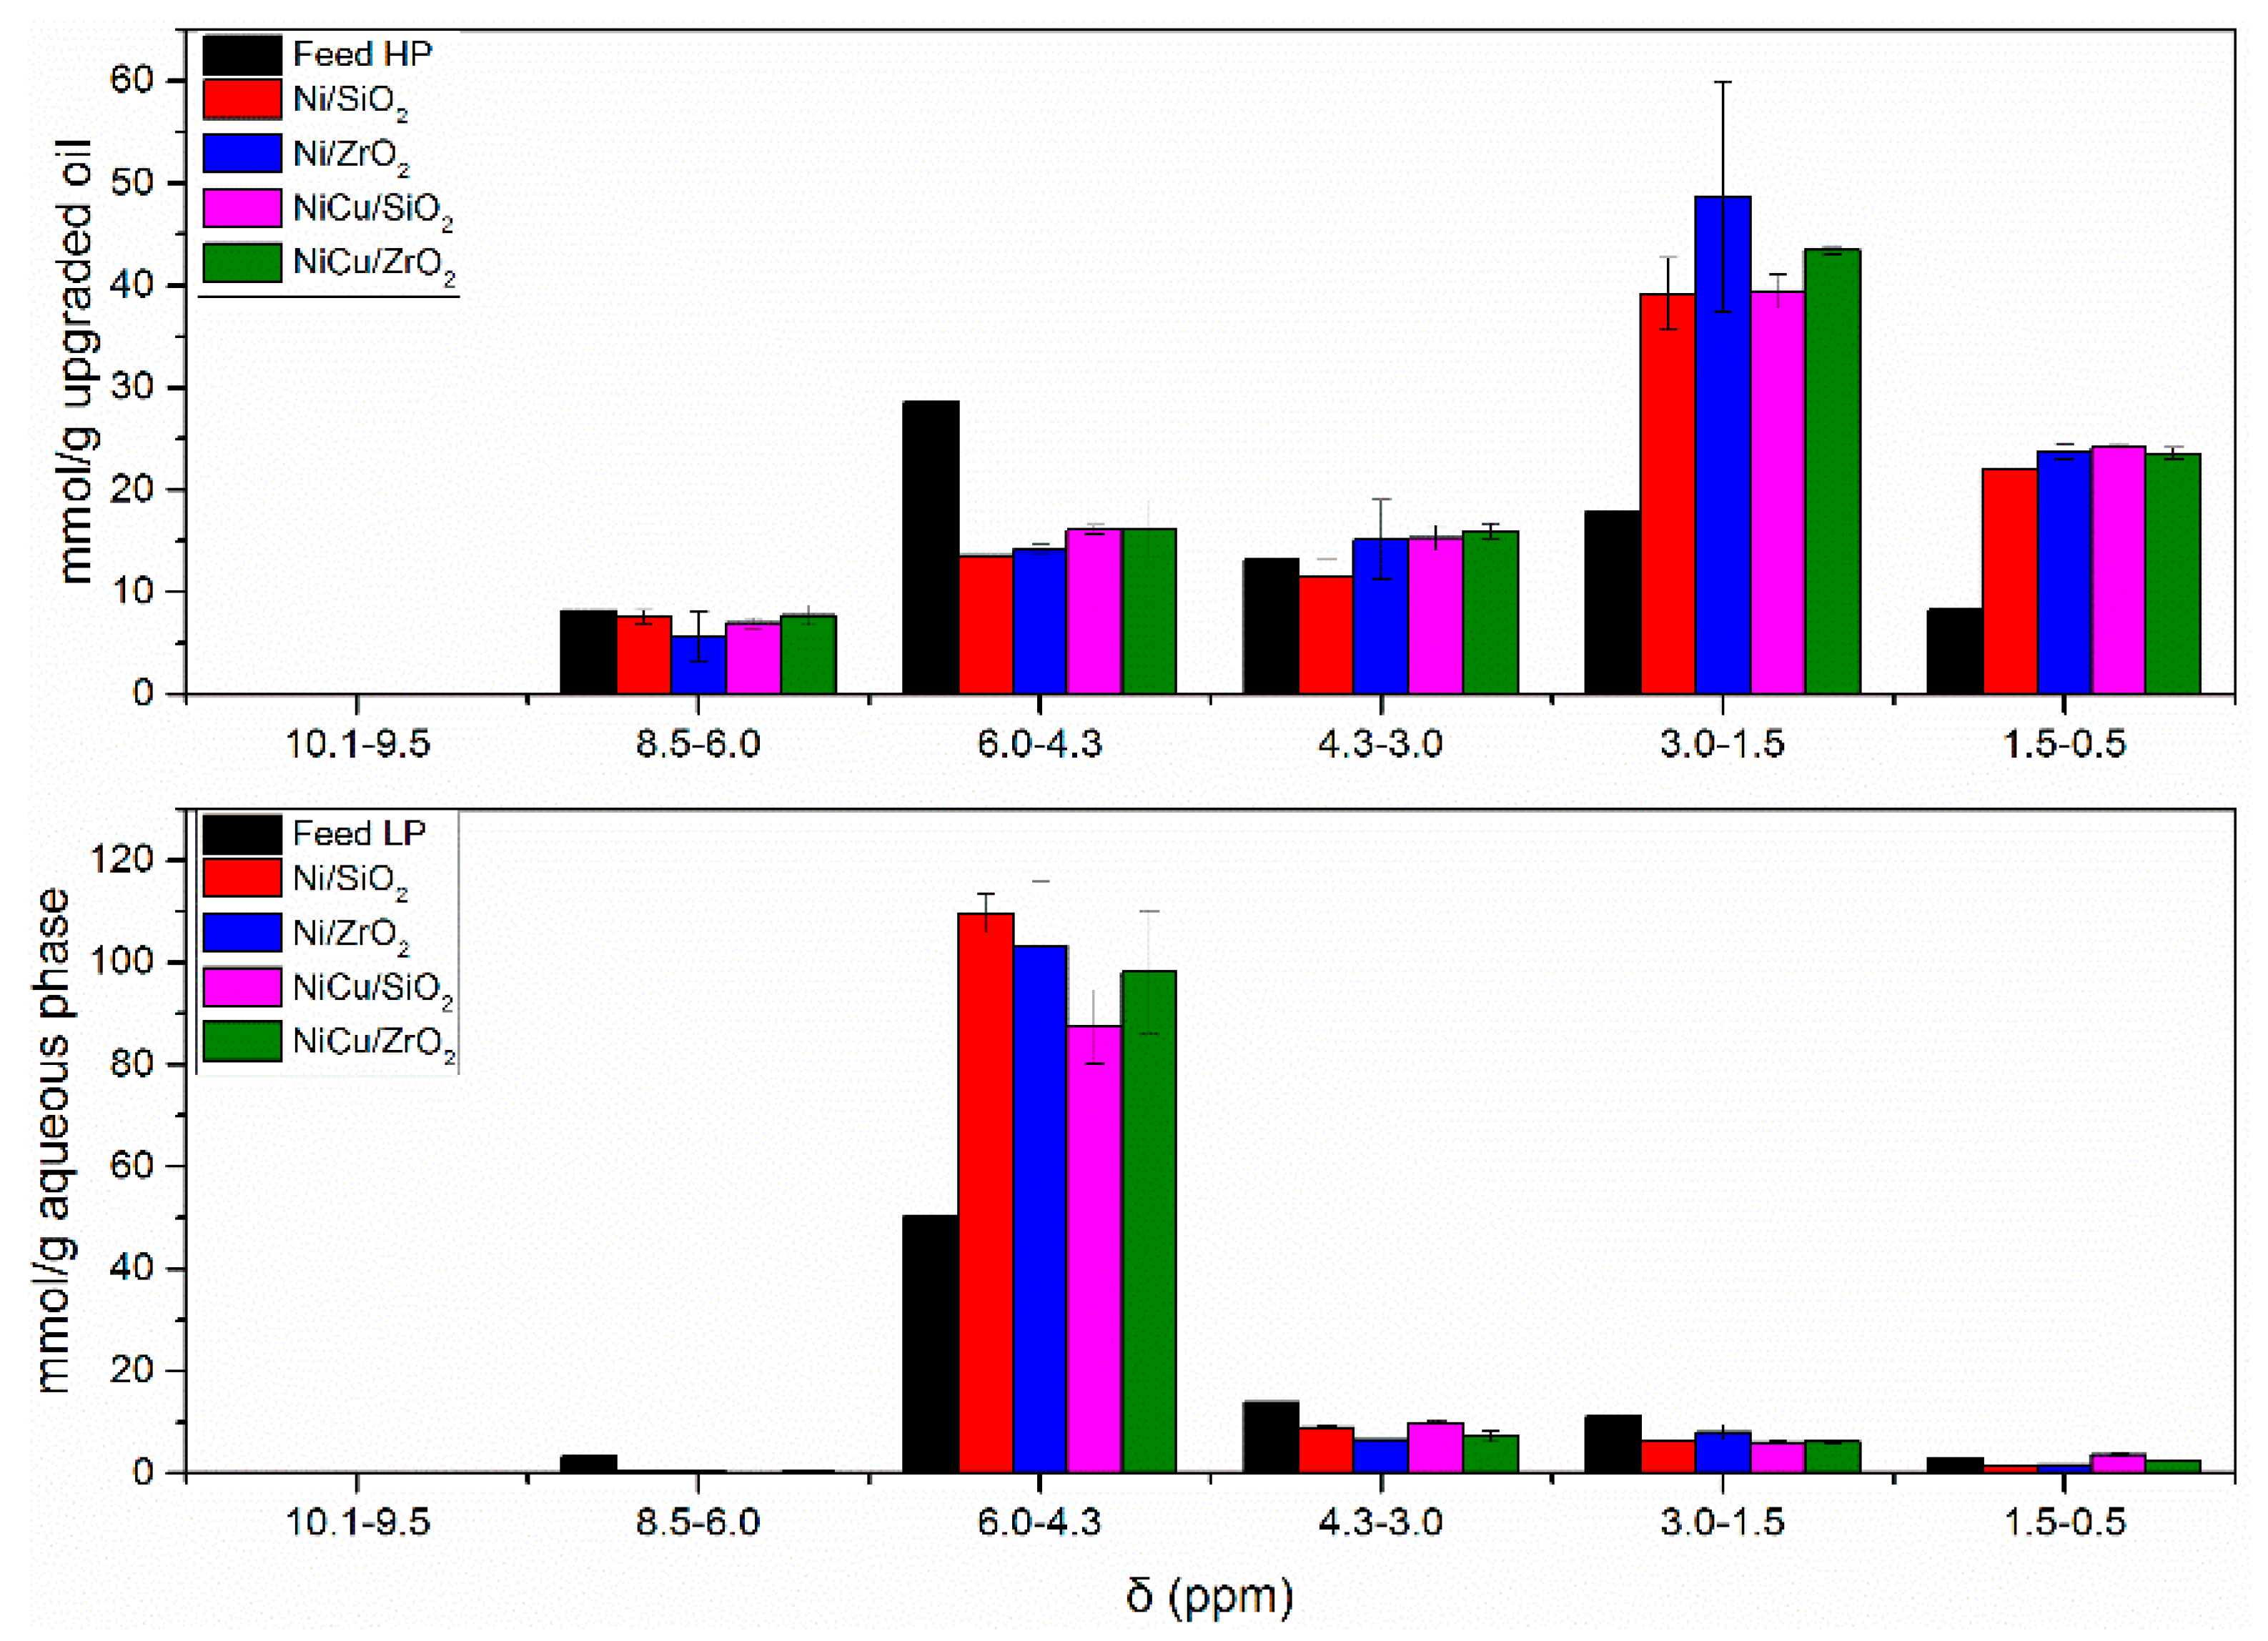
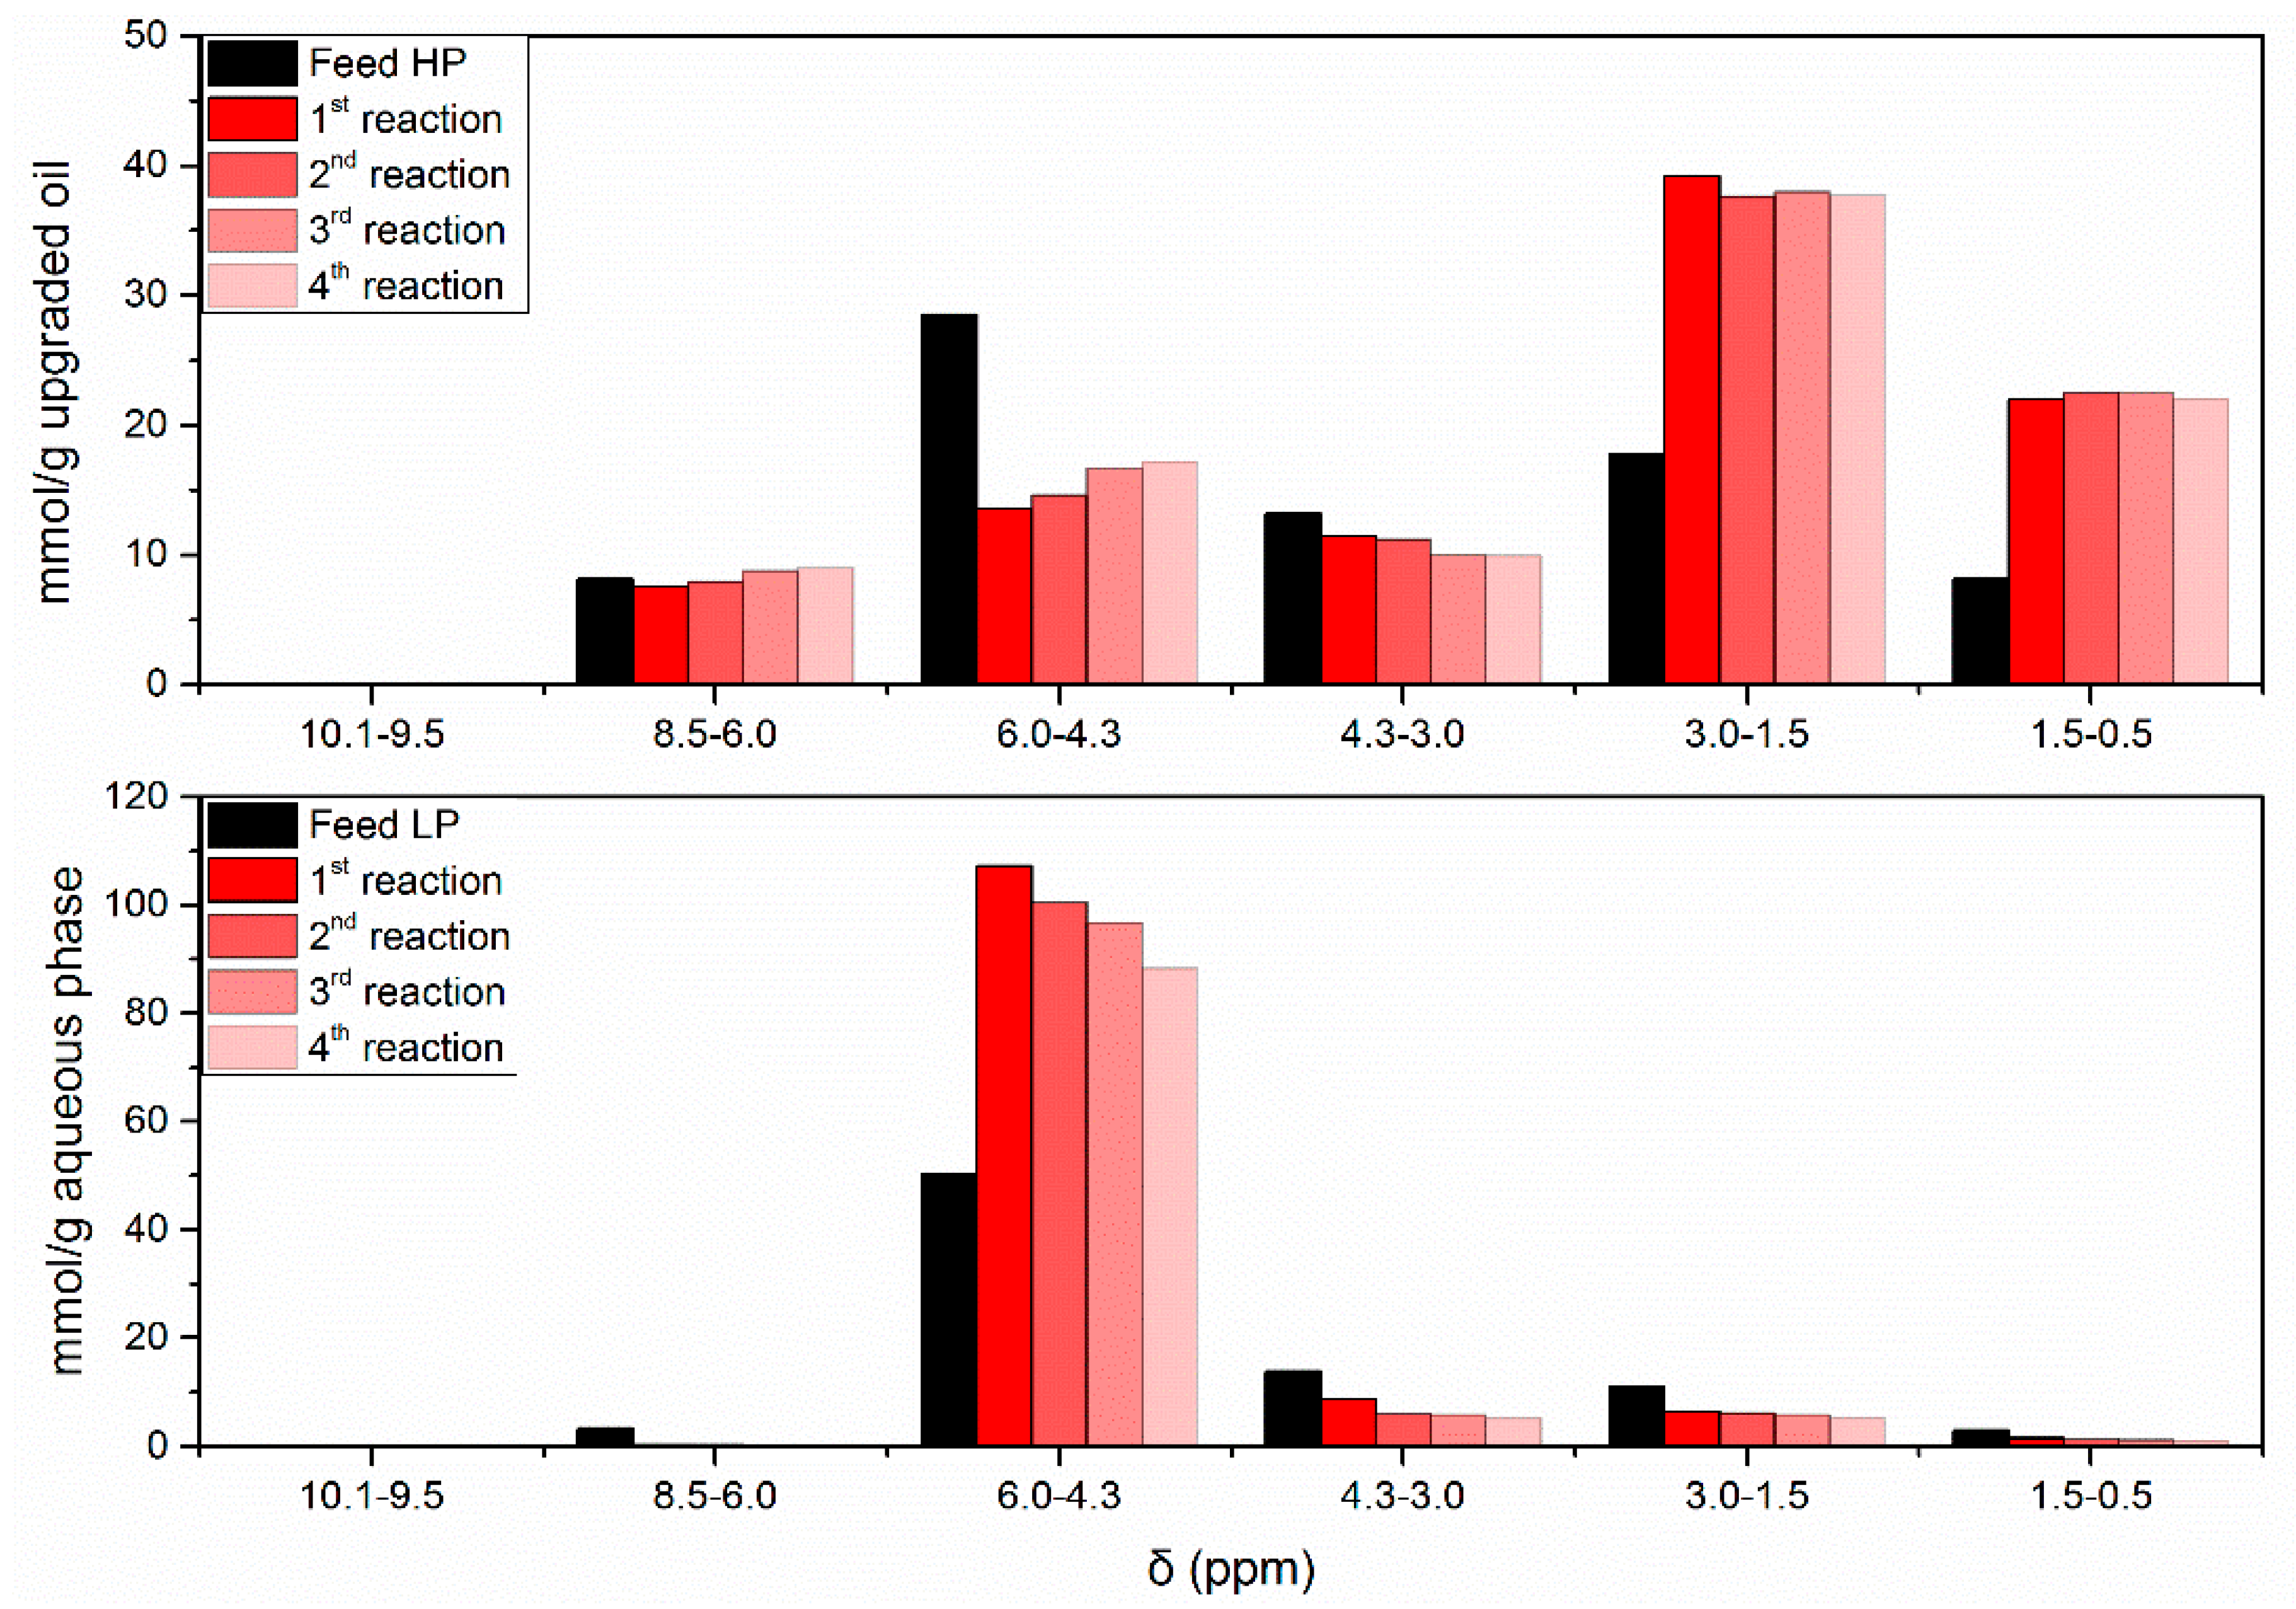
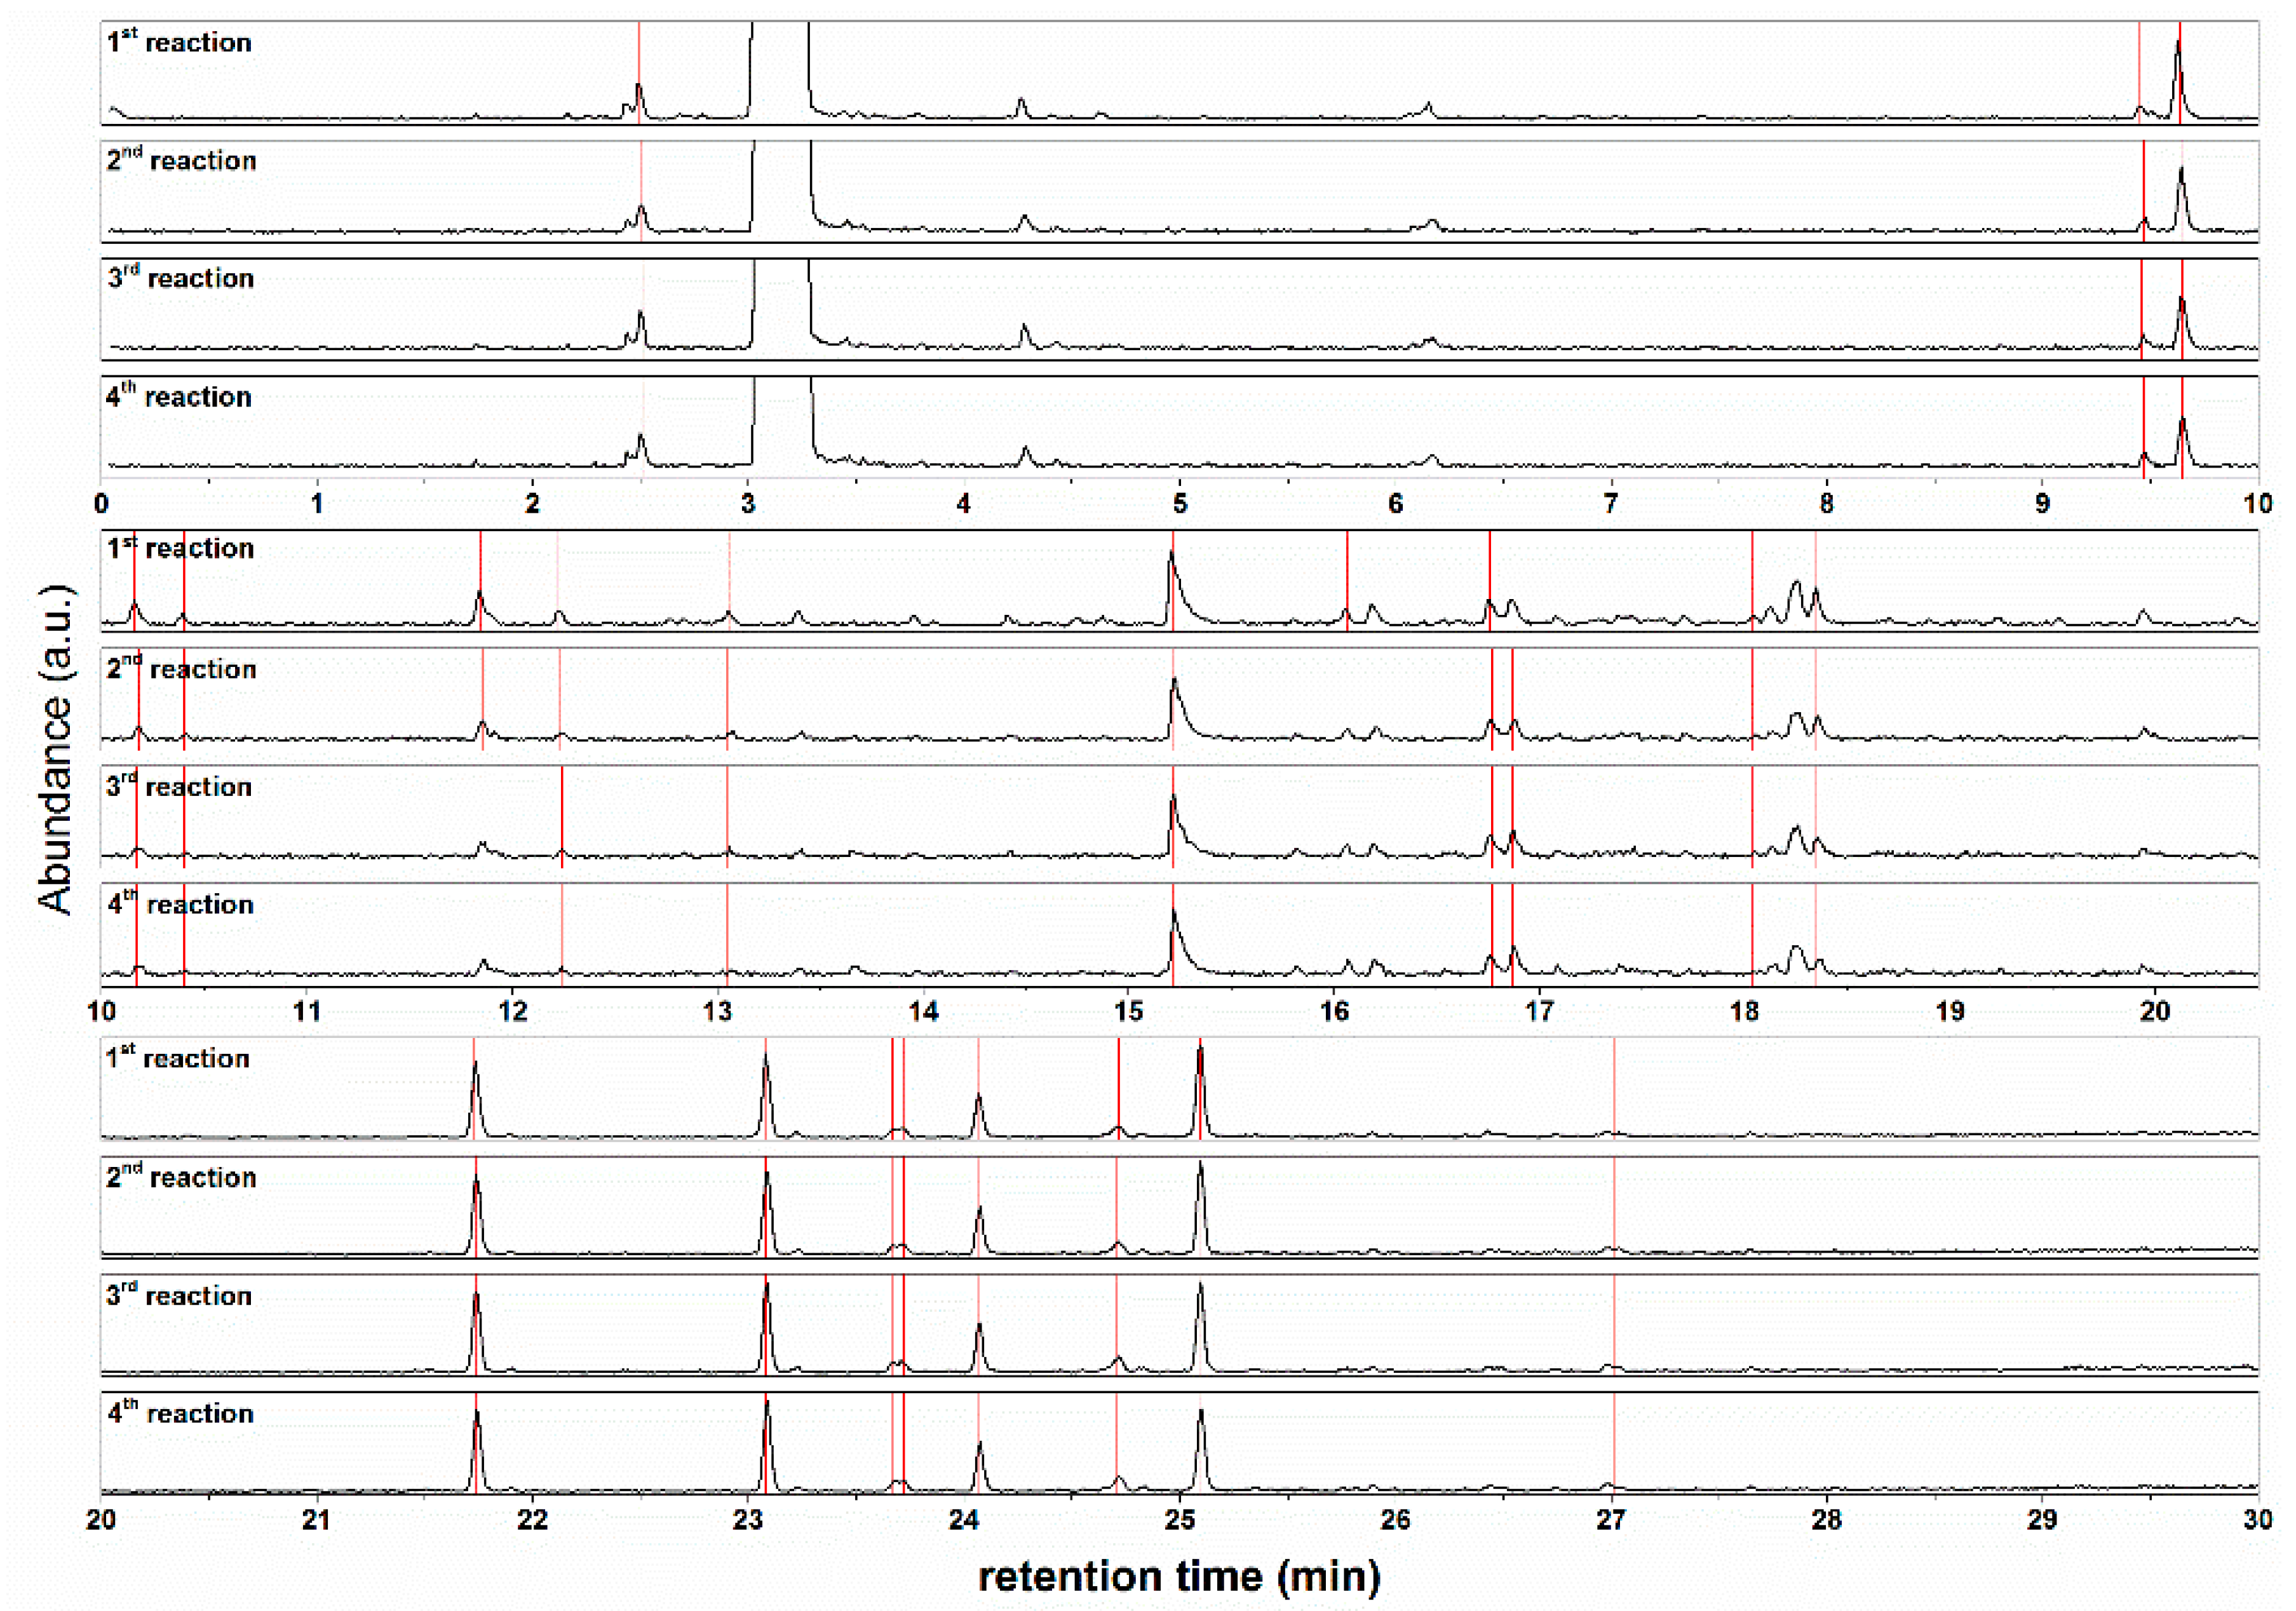
The results obtained by
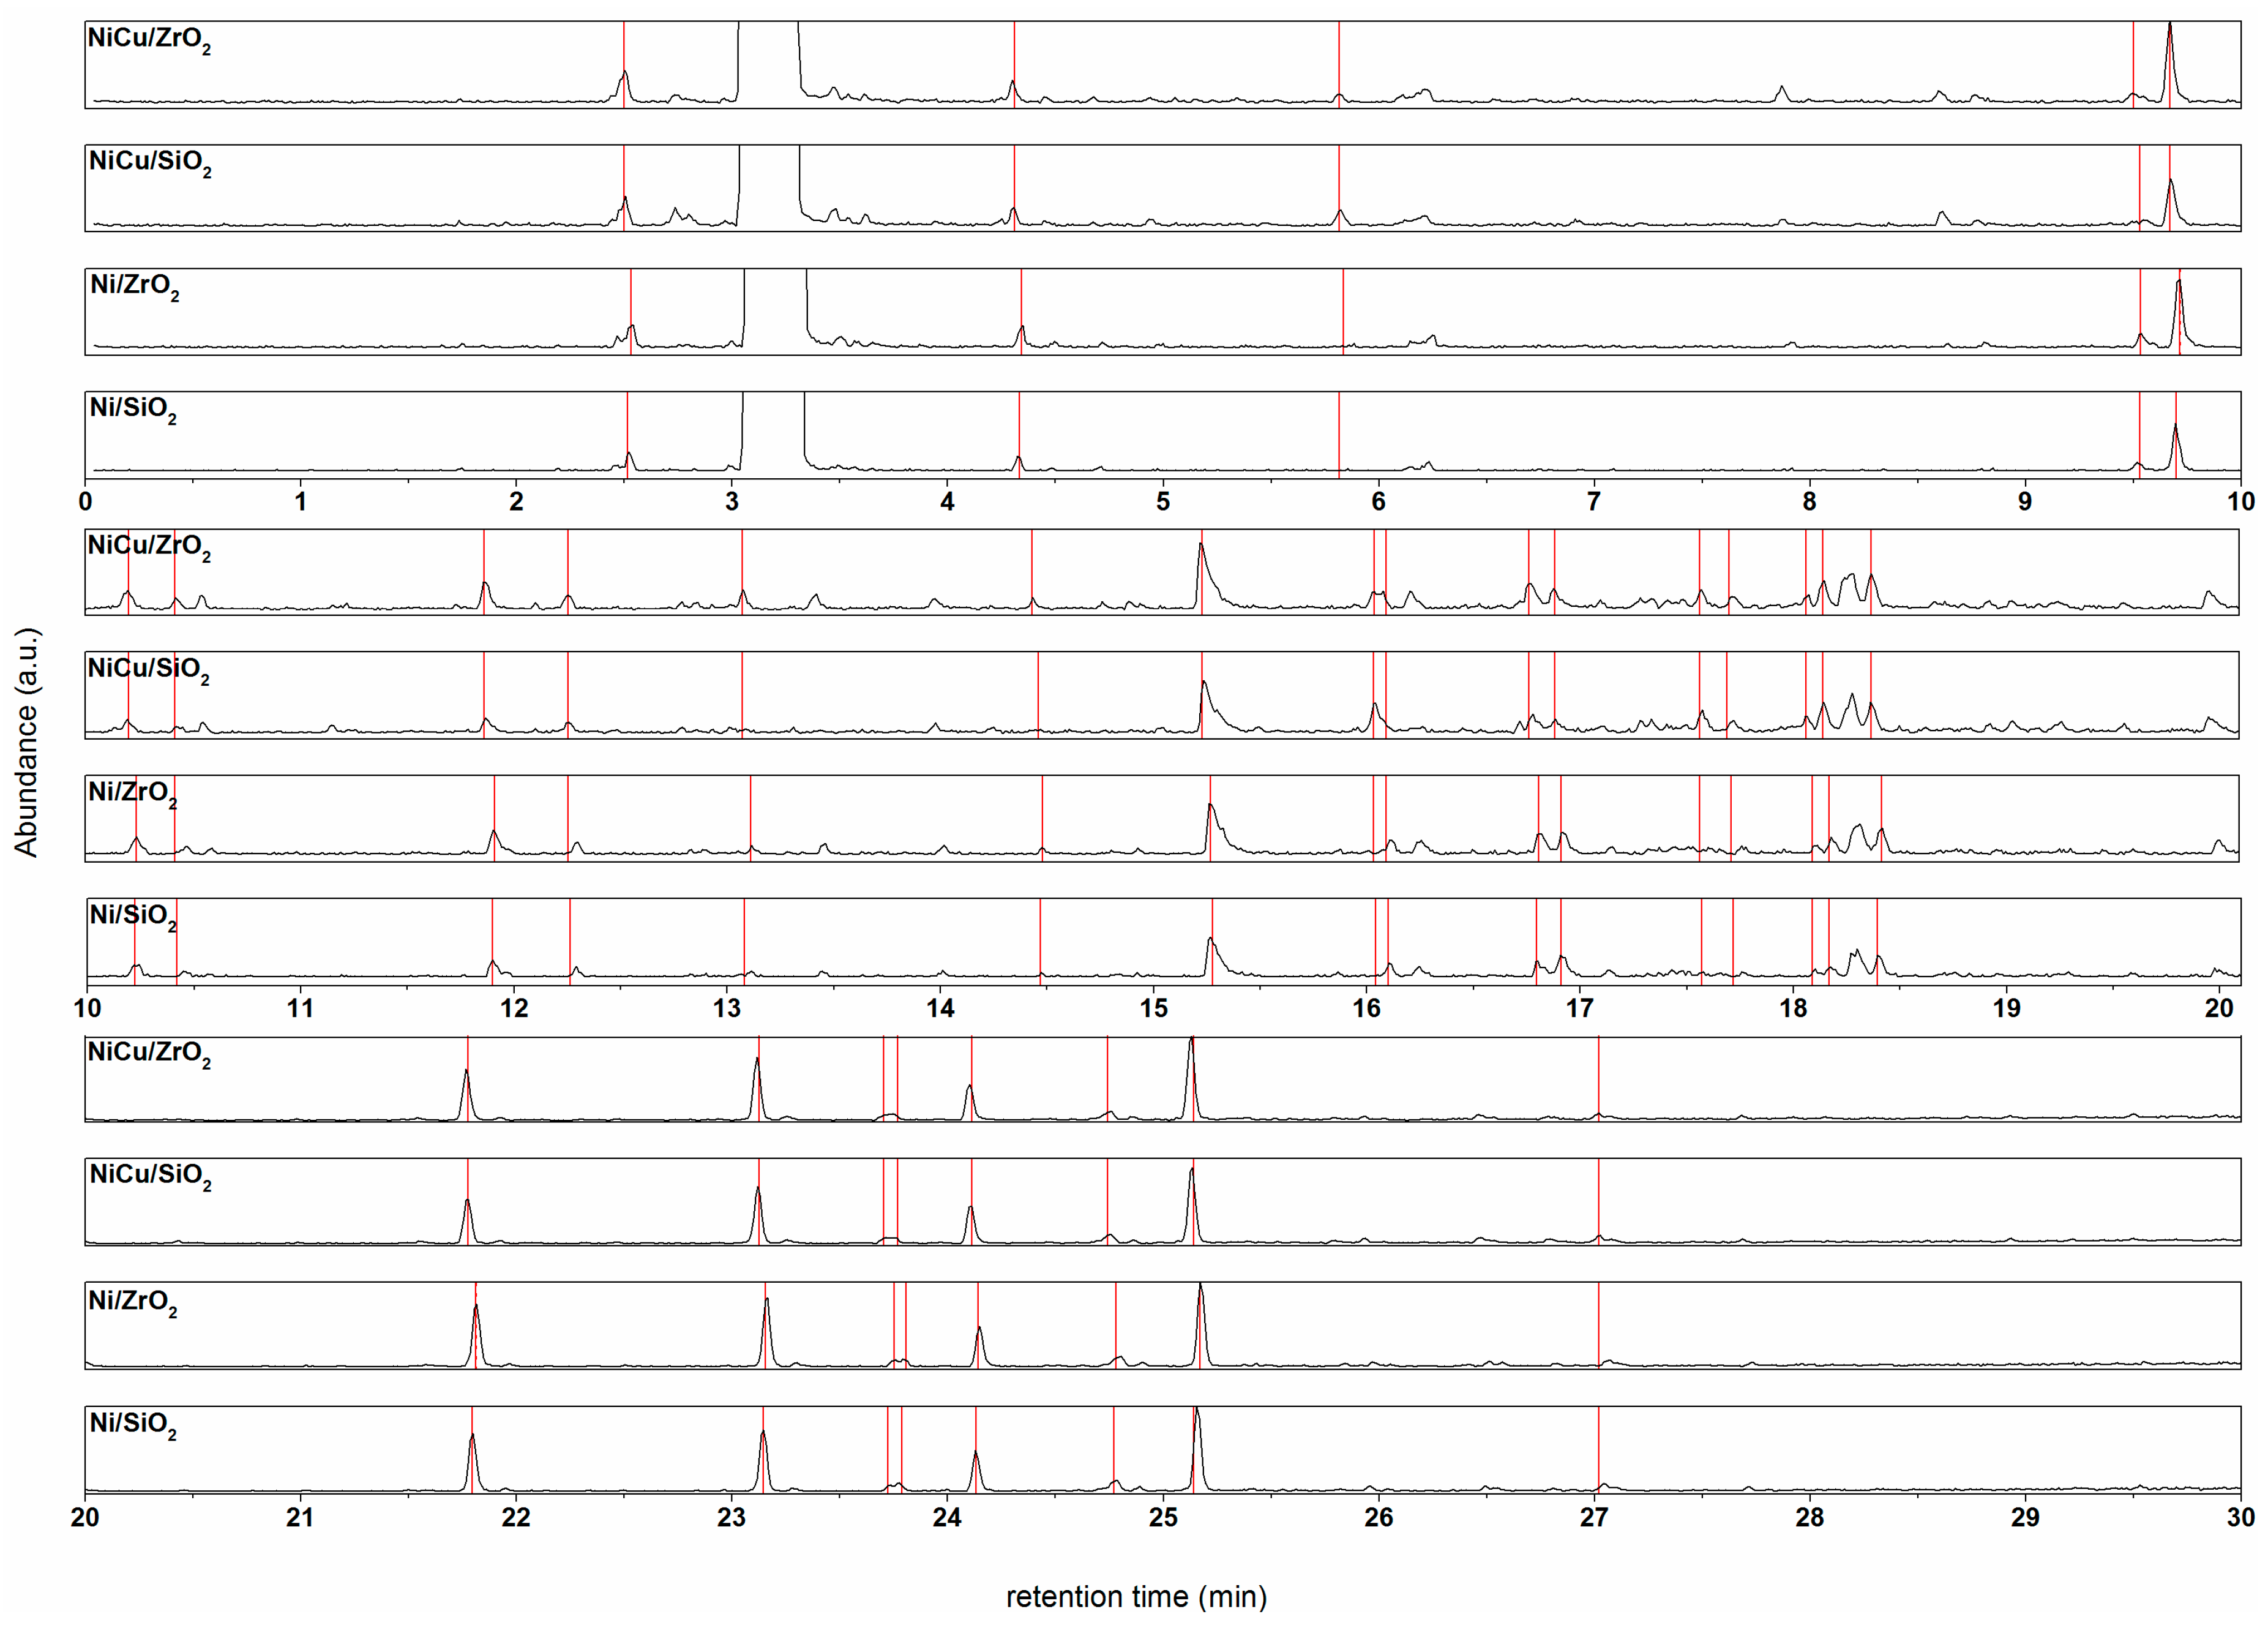
1H-NMR showed that the concentration of protons in the region related to water and carbohydrates increased along the cycles in the upgraded bio-oils. Moreover, the gas chromatography-mass spectrometer (GC-MS), showed that the peak of some sugar derivatives became smaller over the consecutive cycles. It was assumed that the catalytic conversion of sugars was possibly affected by the lower activity of Ni/SiO
2 along the cycles. This assumption corroborates the results of GC-MS, from which the intensity of sugar derivative compounds (γ-valerolactone γ-butyrolactone 2-ethyl-cyclopentanone 2-methyl-2-propanol) have been reduced as the number of cycles increased. Considering the assumption that the conversion of sugars through hydrogenation is reduced with the increase in the number of consecutive reactions, higher amounts of coke formation could be expected, considering that the thermal polymerization of the sugar fraction can lead to increased char deposition [
35,
46,
77] over the cycles. The results of SEM-EDX showed a slightly higher carbon deposition over the spent catalyst after the fourth reaction.
Since poisoning substances might affect some specific reactions [
61], the investigation of model compound conversions as well as the effect of poisonings, over single compounds, could contribute to the understanding of the selectivity changes observed along the cycles. Considering the difficulty for regeneration of sulfur-poisoned catalysts, due to the harsh conditions required (700 °C in steam) [
61], its influence over the conversion of model compounds should be investigated in detail. Since deactivation mechanisms are difficult to be monitored in batch experiments [
66], continuously operated reactors are more appropriate for this investigation.


 and
and 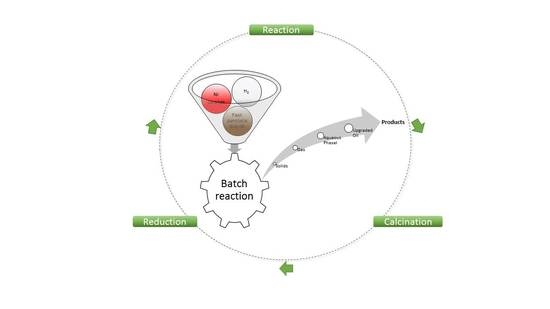


