Prediction of In-Situ Gasification Chemical Looping Combustion Effects of Operating Conditions


1
Key Laboratory of Energy Thermal Conversion and Control of Ministry of Education, School of Energy and Environment, Southeast University, Nanjing 210096, China
2
Faculty of Engineering, University of Nottingham, Nottingham NG7 2RD, UK
*
Authors to whom correspondence should be addressed.
Catalysts 2018, 8(11), 526; https://doi.org/10.3390/catal8110526
Submission received: 16 October 2018
/
Revised: 4 November 2018
/
Accepted: 5 November 2018
/
Published: 7 November 2018
(This article belongs to the Special Issue Catalytic Methods in Flow Chemistry)
Abstract
:Chemical Looping Combustion (CLC) has been considered as one of the most promising technologies to implement CO2 capture with low energy penalty. A comprehensive three-dimensional numerical model integrating gas–solid flow and reactions, based on the authors’ previous work (Energy Fuels 2013, 27, 2173–2184), is applied to simulate the in-situ Gasification Chemical Looping Combustion (iG-CLC) process in a circulating fluidized bed (CFB) riser fuel reactor. Extending from the previous work, the present study further validates the model and investigates the effects of several important operating conditions, i.e., solids flux, steam flow and operating pressure, on the gas–solid flow behaviors, CO2 concentration and fuel conversion, comprehensively. The simulated fuel reactor has a height of 5 m and an internal diameter of 60 mm. The simulated oxygen carrier is a Norwegian ilmenite and the simulated fuel is a Colombian bituminous coal. The results of this simulation work have shown that an increase in the solids flux can promote CO2 concentration, but may also have a negative effect on carbon conversion. A decrease in the steam flow leads to positive effects on not only the CO2 concentration but also the carbon conversion. However, the reduction of steam flow is limited by the CFB operation process. An increase in the operating pressure can improve both the CO2 concentration and carbon conversion and therefore, the CFB riser fuel reactor of a practical iG-CLC system is recommended to be designed and operated under a certain pressurized conditions.
1. Introduction
Chemical Looping Combustion (CLC) is one of the most promising technologies to implement CO2 capture with low energy penalty [1,2,3]. Since the introduction of CLC, numerous CLC studies on gaseous fuels have been conducted [4,5,6,7,8,9,10,11]. However, the more abundant reserves and higher carbon intensity of coal compared to gaseous fuels make the adoption of coal in the CLC system more attractive [12,13,14,15,16,17].
At present, the application of coal-fueled CLC mainly involves two possible options. The first approach is the so-called in-situ Gasification Chemical Looping Combustion (iG-CLC) which is usually based on the concept of Dual Interconnected Fluidized Bed (DIFB), as shown in Figure 1 [16,17]. Specifically, in the fuel reactor, the particles of the oxygen carrier are mixed with the coal particles and react with the gas products from coal pyrolysis and gasification. With a high conversion of combustion gases, the flue gas leaving the fuel reactor would mainly contain CO2 and H2O. For the particles (i.e., reduced oxygen carrier and unreacted char) entrained by the flue gas, they are directed into the separation system (including separators and a carbon stripper) to achieve the solid–solid and gas–solid separations. Through the separation process, the char particles are sent back to the fuel reactor while the particles of oxygen carrier are sent to the air reactor for re-oxidation. Thus, by virtue of the circulation of oxygen carrier particles to transport oxygen from the air reactor to the fuel reactor, the direct contact of coal and air can be avoided during the combustion process, and hence, highly purified CO2 can be easily acquired at the outlet of the fuel reactor via the condensation of steam. The second possibility can be accomplished by a process integrating coal gasification and chemical looping combustion (IGCC-CLC) [18,19,20,21]. In this process, the syngas produced from coal gasification is used as the fuel of the downstream CLC system for power generation with CO2 capture. Nevertheless, the defect of this approach is that the addition of a gasifier will increase system complexity and decrease efficiency. As mentioned by Spallina et al. [20] and Hamers et al. [21], a kind of packed-bed CLC reactor, which enables more operation flexibility and has no need for gas–solid separation, should be a potential candidate of this approach.
During the iG-CLC process, the oxygen carrier may suffer deactivation due to the presence of organic sulfur in the solid fuel and mass loss from elutriation, agglomeration and mixing with the coal ash [22,23]. Hence, it is very important to search for low-cost and long-lasting oxygen carriers. In this respect, natural iron ores, owing to their low-cost, adequate oxygen transport capacity, favorable reactivity and environmental friendliness, together with good mechanical stability, have been regarded as one of the most feasible oxygen carrier candidates for the iG-CLC [24,25,26,27,28].
Currently, the iG-CLC approach has been investigated in some pilot-scale units with different reactor designs, preliminarily demonstrating the feasibility and potential of iG-CLC [16,18,29,30,31,32,33,34,35,36]. However, in view of the gathered results, there are still several challenges affecting the development of this technology: (1) The existence of unburned gaseous compounds at the outlet of fuel reactor results in unsatisfactory combustion efficiency, and CO2 capture concentration [37,38,39]. (2) The conversion of char is unfavorable due to the slow gasification rate under the operating temperatures of the fuel reactor (usually 800–950 °C). Thus, a part of unreacted char particles off the fuel reactor may enter and burn in the air reactor, which will lead to the reduction of carbon capture efficiency [39,40,41]. It can be found that both of the two issues are directly related with the fuel reactor. Hence, a feasible iG-CLC system should have a good selection of its fuel reactor type/structure which can promise smooth operations and efficient fuel conversions. In this respect, circulating fluidized bed (CFB) reactors, owing to their inherent advantages in terms of favorable gas–solid contacts over the whole reactor height with a relatively lower solids inventory, are becoming a competitive candidate for the fuel reactor of iG-CLC [16,17,31,32,33,35,36]. A deep understanding of the effects of operating conditions on the flow and reaction performance of the CFB fuel reactor allows for the optimization of the system operations to achieve the best whole-system fuel conversion, and the highest CO2 concentration and carbon capture efficiency at the outlet of the fuel reactor. However, some important operational information, such as the effects of operating conditions on instantaneous flow behaviors and heterogeneous reaction characteristics, is still largely missing and rarely available for the iG-CLC process with a CFB fuel reactor.
With the advancement of computer hardware and numerical methods, Computational Fluid Dynamics (CFD) modeling is now able to predict fairly accurate gas–solid flow behaviors and chemical reactions. Therefore, it has been accepted as a reliable technique to make up for the disadvantages of experimental methods (e.g., instantaneous gas–solid hydrodynamics and reaction dynamics), and further give some forward guidance for deeper experimental studies [42,43,44,45,46,47]. Previous publications on the simulation studies of CLC mainly focused on CLC of gaseous fuels [48,49,50,51,52,53] and few were on the CLC performance of solid fuels. Mahalatkar et al. [54] spearheaded a 2D model to simulate the flow and reaction process in a bubbling fluidized bed (BFB) fuel reactor. Su et al. [55] simulated the iG-CLC process in a dual circulation fluidized bed system, where the gas leakage, flow pattern and combustion efficiency were obtained and analyzed. Shao et al. [56] developed a 3D full-loop iG-CLC model which successfully predicted some important flow behaviors of the whole system. However, the coupling of the reaction model into the hydrodynamics model had not been achieved in their work, and hence, only cold-state flow characteristics were presented. Alobaid et al. [57] and May et al. [58] developed 3D models for fuel and/or air reactor of the world’s second largest CLC pilot plant at Technische Universität Darmstadt, enabling scale-up investigations for the optimization of process and solid–fluid interactions. Besides, an in-house thermochemical reaction model was successfully combined with the Euler–Euler model in their work. Generally speaking, by far, the simulation studies on iG-CLC technology mainly concentrated on the model feasibility tests, but the in-depth investigations of flow and reaction mechanisms in the fuel reactor are still lacking.
In our previous work, we successfully developed a comprehensive 3D numerical model of a CFB fuel reactor based upon the experimental system of others [59] to study the fundamental performance of iG-CLC, including fuel conversions and reaction rates [22]. With the present work, aiming to improving the existing problems, in terms of insufficient combustion efficiency, CO2 concentration, and carbon capture efficiency, in the iG-CLC process, we have conducted in-depth simulations of the effects of the important operating conditions, i.e., solids flux, steam flow and operating pressure, on the iG-CLC performance. The main contributions of this simulation work are listed as follows: (1) further validation of a three-dimensional numerical model, including the kinetic theory of granular flow and complicated heterogeneous reactions, for the simulation of the iG-CLC system with a CFB as the fuel reactor; (2) predictions of detailed flow dynamic characteristics in the fuel reactor under different hot-state conditions; (3) in-depth study of the effects of important operating parameters on the reaction performance by integrating the gas–solid flow mechanisms; (4) effective complement of the limitations of current experimental conditions on flow and reaction mechanisms, and further offering valuable guidance for the design and operation of future iG-CLC plants.
2. Results and Discussion
Table 1 lists the main operating parameters in this simulation work, except for the three variables to be mentioned below.
Nine different cases were simulated to study the effects of operating conditions including solids flux, steam flow and operating pressure on the flow behavior and reaction performance in the fuel reactor. Here, CO2 concentration and single-loop conversion of carbon are the two main research objects to reflect the reaction performance. A high CO2 concentration at the exit of the fuel reactor means high combustion efficiency with efficient CO2 capture. The higher the single-loop conversion of carbon in the fuel reactor, the higher the carbon capture efficiency and the thermal power that could be achieved. In order to investigate the effect of each parameter on the reaction performance more rationally, all other parameters of the cases to be compared had been kept constant when the parameter to be investigated was changed. Table 2 lists the nine simulation cases with the specified operating conditions, where case 1 is selected as the reference condition for the analysis of basic flow and reaction behaviors.
2.1. Further Validation of the Hydrodynamics and Reaction Models
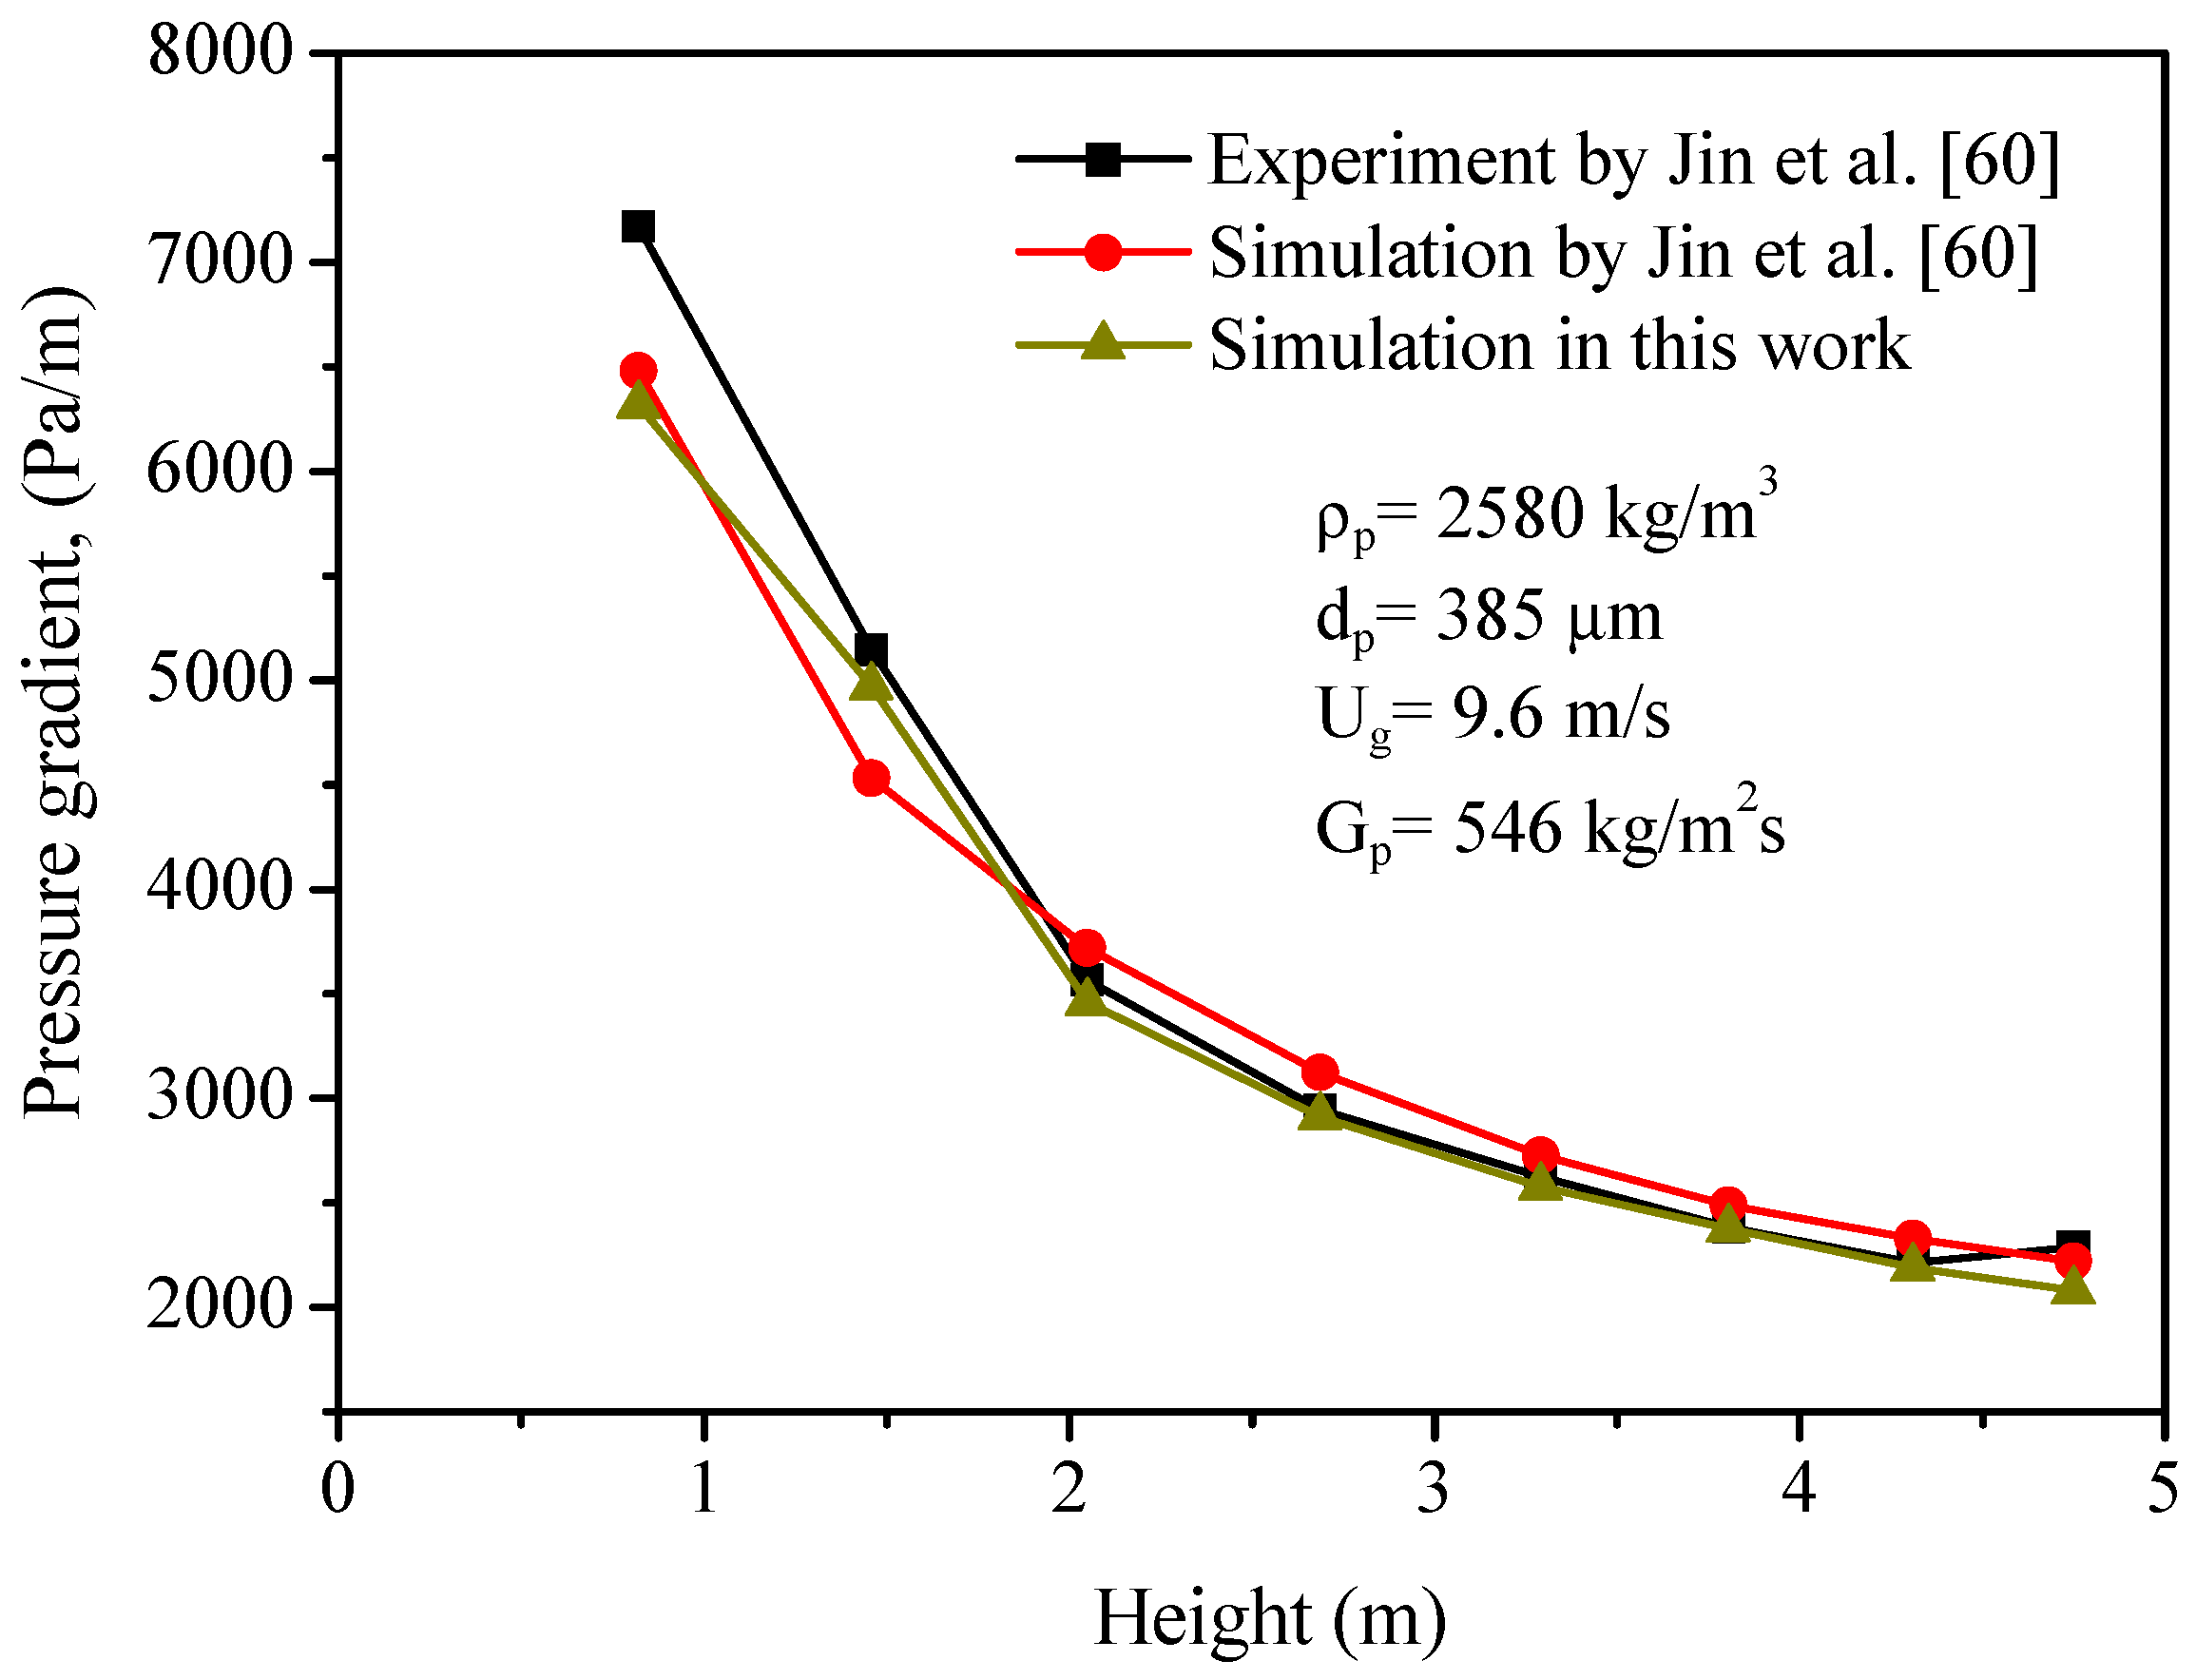
Before carrying out the comprehensive modeling of iG-CLC, a further validation of the hydrodynamics model was carried out by comparing the model predictions with the experimental data of a different CFB [60] from that used for validation of hydrodynamics model with our previous study [22,59]. The dimensions of the modeled CFB were the same as those of the experimental facility used by Jin et al. [60], except for a small difference in the exit geometry. The simulation parameters were also set accordingly to their experimental conditions. Figure 2 shows the comparison between the computed and experimental axial pressure gradient profiles. The modeling results were very close to the experimental data, and the maximum relative error between the simulation and the experiment was less than 12%. Additionally, our calculations were also close to the previous simulation predictions by Jin et al. [60]. Hence, the hydrodynamics model adopted in this study can be considered suitable for the simulation of gas–solid flow in the CFB fuel reactor.
In order to verify the reaction model adopted in this study, we carried out a comparison of reaction performance in a BFB fuel reactor between the simulation using our reaction model and the previous experimental data [28]. The simulation conditions were set to be consistent with the experimental operation conditions (temperature-1163 K, the steam flow-190 LN/h, and the coal feeding flow-62 g/h). Figure 3 shows the comparison of dry basis gas concentrations at the fuel reactor outlet between the experimental data and our simulations. It shows that the simulation results were generally in agreement with the experimental data, indicating that the reaction model is valid. A similar validation of the reaction model using the experimental data obtained under different conditions (temperature-1163 K, the steam flow-190 LN/h, and the coal feeding flow-83 g/h) from the same literature [28] had also been performed in our previous work [22].
From the above, we can conclude that both the hydrodynamics model and the reaction model which make up the comprehensive model of this study have been further validated in advance of the present simulation studies. Therefore, the simulated results on the gas–solid flow patterns and reaction performance in the coal-fired CFB fuel reactor using the comprehensive model can be considered to be valid.
2.2. Distributions of Solids Holdup and Gas–solid Components
Figure 4a displays the distribution of solids holdup with the reactor height at the quasi-equilibrium state (here, the time of 70 s was selected as a representative) under the reference condition. To enhance the clarity of presentation, the colored contours of the solids holdup in three 0.1 m-long sections of the reactor at different height levels (0.5–0.6 m, 2.5–2.6 m, 4.5–4.6 m) are shown in Figure 4a. Similar approaches have been adopted for other colored contours in Figure 4b–f. It can be seen that the solids holdup keeps decreasing along with the bed height in general, except a slight increase near the top of riser due to the effect of the L-shaped exit configuration [61]. The volume averages of solids holdup and axial solid velocity in the fuel reactor are about 0.07 and 0.70 m/s, respectively. Accordingly, the solids inventory and residence time in the fuel reactor can be calculated as 60.3 kg/MWth and 7.1 s, respectively.
The patterns of the char mass fraction in the solid phase and the gas concentrations in the gas phase at 70 s under the reference condition are presented in Figure 4b–f. At the bottom of the reactor, the rapid reaction of coal pyrolysis leads to the generation of char in abundance so that the mass fraction of char in the solid phase reaches the peak in this section. Then, the mass fraction of char begins to decrease along with the reactor height due to the continuing consumption of char from the gasification reactions. Similarly, H2 is generated from coal pyrolysis and gasification, but is quickly consumed through the combustion reactions of intermediate gasification products and oxygen carrier. Thus, we could observe a decreasing concentration of H2 along with the reactor height. The trends of CO and CH4 are consistent with that of H2. Figure 4f presents the distribution of CO2 concentration in the fuel reactor. As the product gas, the distribution of CO2 is almost opposite to that of reactant gases (i.e., H2, CO and CH4). The more detailed discussions about the flow patterns and component distributions in the bed could be found in our previous preliminary study [22].
It should be noted that the single-loop conversion of carbon and CO2 dry-basis concentration at the outlet under the reference condition reach 65.6% and 90.2%, respectively, which are comparable to the previous experimental results by Berguerand and Lyngfelt [12]. In their 10 kWth system, the single-loop conversion of carbon was in the range of 50–80% while the CO2 dry-basis concentration ranged between 78% and 81%. This indicates the CFB riser with high solids flux is a potential candidate for the fuel reactor of iG-CLC [23,36,62], and the operating conditions adopted in this study are appropriate and feasible.
2.3. Effect of Solids Flux
Because a higher solids flux can enhance the solids holdup and heat carrying capacity, CFBs with high solids mass fluxes (Gp ≥200 kg/m2·s) are considered as promising reactors for some special processes such as the production of maleic anhydride, combustion and gasification [63,64,65]. In the future commercial operation of iG-CLC, it is more important to achieve high CO2 concentration than to acquire low solids inventories when the cheap oxygen carriers with a relatively low reactivity are used. Hence, it is very interesting to study the iG-CLC performance under the condition of a high solids flux. Simulations with Cases 1–3 have been performed with different solids fluxes ranging from 100 kg/m2·s to 300 kg/m2·s to investigate the effect of solids flux on the performance of iG-CLC when the steam flow and operating pressure are kept at constant values of 7.5 m3/h (under the operating temperature and pressure) and 0.55 MPa, respectively. In these cases, the steam to the fixed carbon ratio (H2O/C) is kept at the value of 0.85. With the coal feeding rate being kept at a constant value of 10 kg/h, changing the solids flux from 100 kg/m2·s to 300 kg/m2·s results in a change of the mass flow ratio of oxygen carrier to coal from about 101.7–305.2.
Figure 5 shows the apparent solids holdups (i.e., volumetric solids fraction) along the fuel reactor height as a function of solids flux. It can be seen that the range of solids holdup is much wider in the lower region than that in the upper region at a given solids flux, implying that the particle concentration distribution is more uniform in the upper dilute region. Meanwhile, we can observe a significant increase of solids holdup with the increasing solids flux. Moreover, the increase of solids flux promotes the realization of a fully/largely high-density CFB (αp ≥ 0.1). When the solids flux increases from 100–300 kg/m2·s, the height of the high-density solids flow region increases from 0.9 m to about 1.8 m. These computational results are consistent with the experimental results of several groups of researchers [22,23,61,66,67].
Figure 6 presents the CO2 concentration (dry basis) at the outlet vs. time curves with different solids fluxes. The concentration of CO2 at a given solids flux has a slight oscillation around a constant value after reaching the quasi-equilibrium state (t ≥30 s). We can observe that the increase of solids flux results in an increase in the CO2 concentration at the fuel reactor outlet. The average dry basis concentration of CO2 is about 90.2% for the solids flux of 100 kg/m2·s and increases to 96.3% for the solids flux of 300 kg/m2·s. The increase in the CO2 concentration at the outlet of the reactor is believed to be the results of higher solids holdups (Figure 5) and better gas–solid contacts which promote the gas–solid reactions, according to reactions (8)–(10) (see Section 3.2).
Figure 7 shows the profiles of the mean axial velocities of the solids along the reactor height with different solids fluxes. It can be observed that the particles are generally accelerating along with the riser, which is largely due to the drive of gases. At the same time, the axial solids velocities increase with the solids flux. This can be explained by the fact that the gas phase is accelerated with higher solids fluxes and holdups, which further leads to higher particle velocities. These modeling results are consistent with the experimental observations of Pärssinen and Zhu [59].
Figure 8 shows the effect of the solids flux on the single-loop conversion of carbon in the fuel reactor. The conversion of carbon decreases from 65.6% to 50.1% with the increase of solids flux from 100 kg/m2·s to 300 kg/m2·s. As mentioned above, the increase in the solids velocity with a higher solids flux would result in a decrease in the solids residence time, which leads to a reduction of char conversion. On the other hand, according to reactions (6)–(7) (see Section 3.2), the increases in the fuel gas conversion and CO2 concentration with a higher solids flux will promote the gasification of char, i.e., the conversion of char. Hence, the net effect of the solids flux on the single-loop conversion of carbon is a combination of the positive (due to the increased gasification reactions (6)–(7) and the negative (due to the reduced solids residence time) effects. In the end, under the modeling conditions of this study, higher solids fluxes have been found to have some negative effects on the carbon conversion, indicating that the change of solids velocity with different solids fluxes may play a leading role in the carbon conversion.
2.4. Effect of Steam Flow
Steam (H2O) plays a very important role in the iG-CLC process. It is not only the fluidizing gas but also the main gasification agent. Hence, it is necessary to understand the effect of steam flow on the iG-CLC performance. Cases 4–6 are designed to study the influence of steam flow on the flow patterns and reaction characteristics. The steam flow selected is in the range of 6–10 m3/h (under the operating temperature and pressure) with the solids flux, coal feeding rate and operating pressure being fixed at values of 220 kg/m2·s, 10 kg/h and 0.6 MPa, respectively. Thus, in these cases, the steam to the fixed carbon ratio (H2O/C) ranges from 0.74 to 1.23, whereas the mass flow ratio of the oxygen carrier to the coal feeding rate is kept at a constant value of 223.8.
Figure 9 presents the profiles of the apparent solids holdups along the fuel reactor height as a function of steam flow. The solids holdup generally increases with the decreasing steam flow at a given height [23], and the variation of solids holdup is smaller in the higher riser region. These results illustrate that a higher steam flow has a negative effect on the formation of high-density flow structure, which agrees with the experimental observations of Wang et al. [23], Wang et al. [61] and Li et al. [66].
Figure 10 shows the mean axial velocities of solids with different steam flows as a function of the fuel reactor height. As expected, the axial velocity of the solids decreases with the decreasing steam flow at a specified height. The axial velocity profiles of Wang et al. [61] and Pärssinen and Zhu [59] agree well with the results of our simulation but with higher particle velocities due to the higher gas velocities used in their studies.
Figure 11 shows the effect of the steam flow on the CO2 concentration (dry basis) at the outlet of the fuel reactor. Decreasing the steam flow gives rise to an increase in CO2 concentration at the outlet. The average concentration of CO2 (dry basis) is 93.7% for the steam flow of 10 m3/h and increases to 96.1% when the steam flow is decreased to 6 m3/h. The increase of CO2 concentration with a reduced steam flow is believed to be related to the higher solids holdup and the lower gas velocity, which further enhance the gas–solid contacts and the residence time, promoting gas–solid reactions (8)–(10).
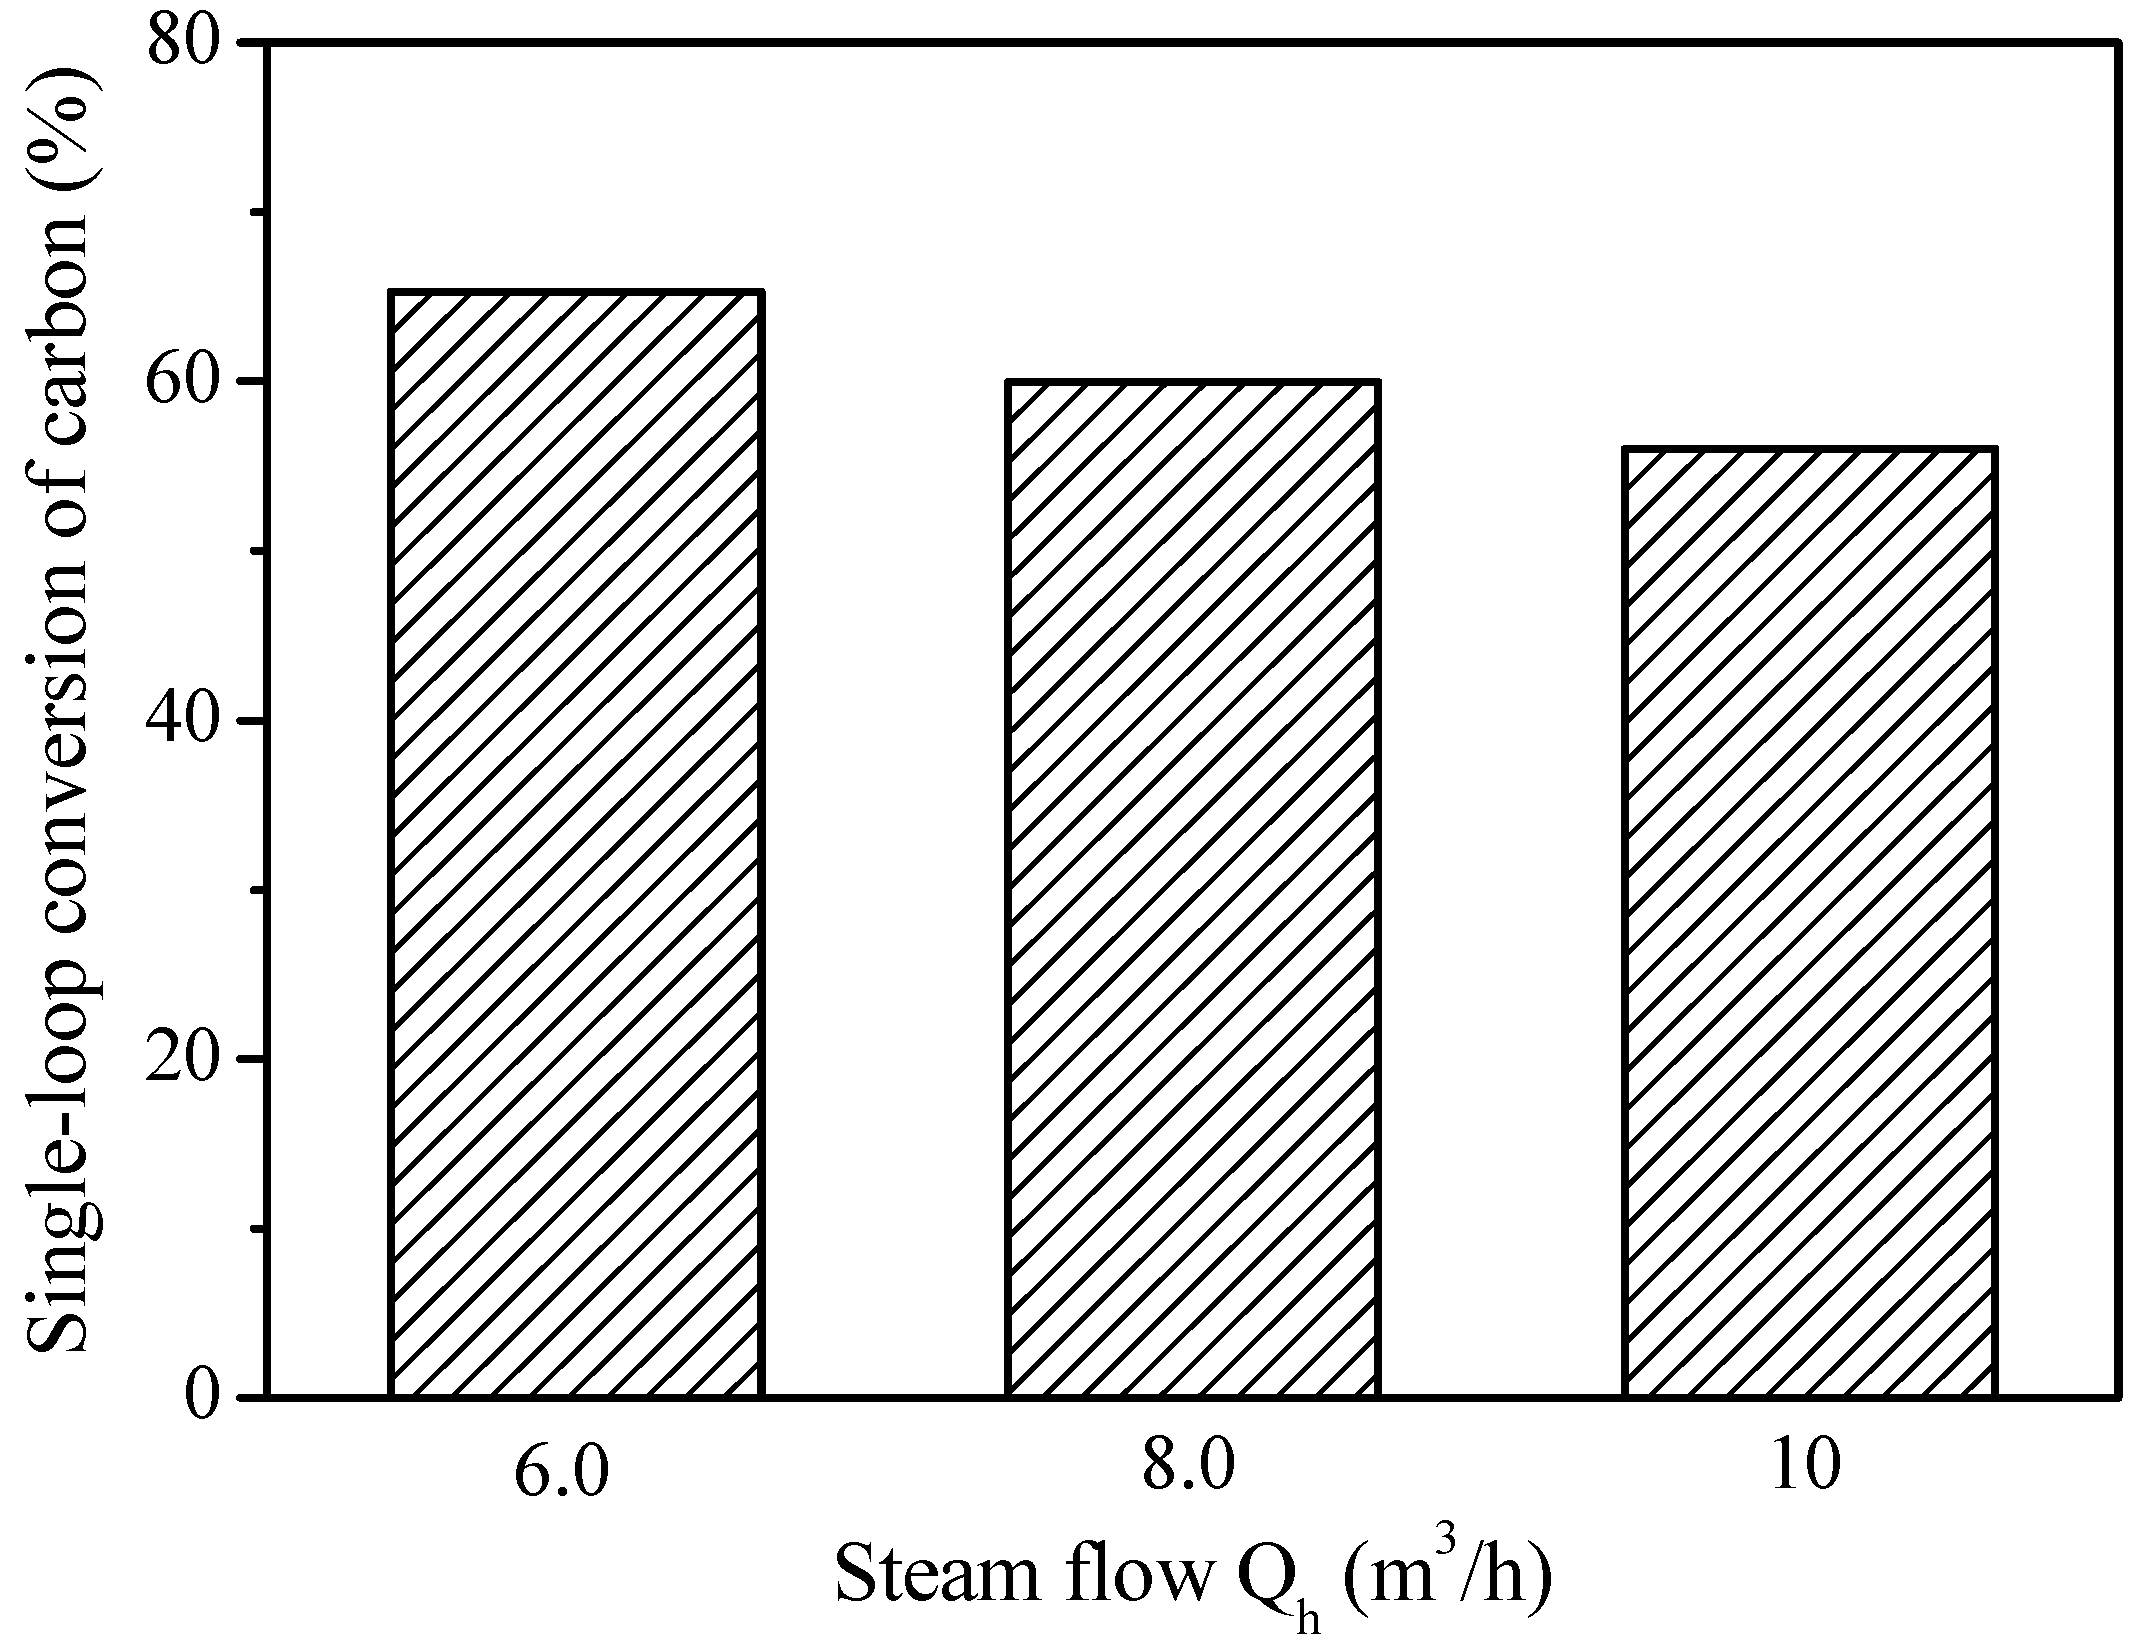
Figure 12 presents the influence of steam flow on the single-loop carbon conversion in the fuel reactor. The carbon conversion increases from 56.0% to 65.3% when the steam flow decreases from 10 m3/h to 6 m3/h. When the steam flow is reduced, the solid residence time is increased, and the char gasification can be enhanced due to the increases in the fuel gas conversion and CO2 concentration (according to reactions (6)–(7)), leading to an increase in carbon conversion.
However, although a decrease in the steam flow can be beneficial to the CO2 concentration at the exit and the carbon conversion, lower steam flow would go against the rapid circulation of the particles, which would lead to an increase in the solid inventory and a reduction in the heat transfer efficiency of the oxygen carrier. Moreover, too low steam flow cannot even drive the particle flow for circulating. Hence, in order to ensure the proper circulation and fluidization of the particles, the reduction in the steam flow needs to be limited by the operation process.
2.5. Effect of Operating Pressure
Because coal gasification is the rate-controlling step in the process of iG-CLC, an increase in the partial pressure of the gasification agent can have a significant influence on the performance of iG-CLC [13,68]. Meanwhile, in a pressurized CLC system, electric power can be saved to compress the CO2 flow to the high pressure needed for transportation and storage [7,51]. Hence, a study on the pressurized iG-CLC performance is necessary. Simulations with Cases 7–9 have been performed with different operating pressures ranging from 0.4 MPa to 0.8 MPa to investigate the effect of the operating pressure on the gas–solid flow and reaction behaviors with the solids flux, coal feeding rate and steam flow being kept at constant values of 200 kg/m2·s, 10 kg/h and 7 m3/h (under the operating temperature and pressure), respectively. In these cases, the steam to the fixed carbon ratio (H2O/C) is in the range of 0.14–1.15, whereas the mass flow ratio of the oxygen carrier to the coal feeding rate is kept at a constant value of 203.5.
Figure 13 shows the effect of the operating pressure on the distribution profiles of the apparent solids holdups along the fuel reactor height. Generally, the solids holdup goes up with the increasing operating pressure at a given height. An increase in the operating pressure also leads to an increase in the height of the high-density flow region, indicating the active effect of pressure on the forming of a fully high-density CFB [69]. Figure 14 displays the mean axial velocities of solids with different operating pressures as a function of height. It can be observed that the axial solid velocity decreases with the increasing pressure at a specified height.
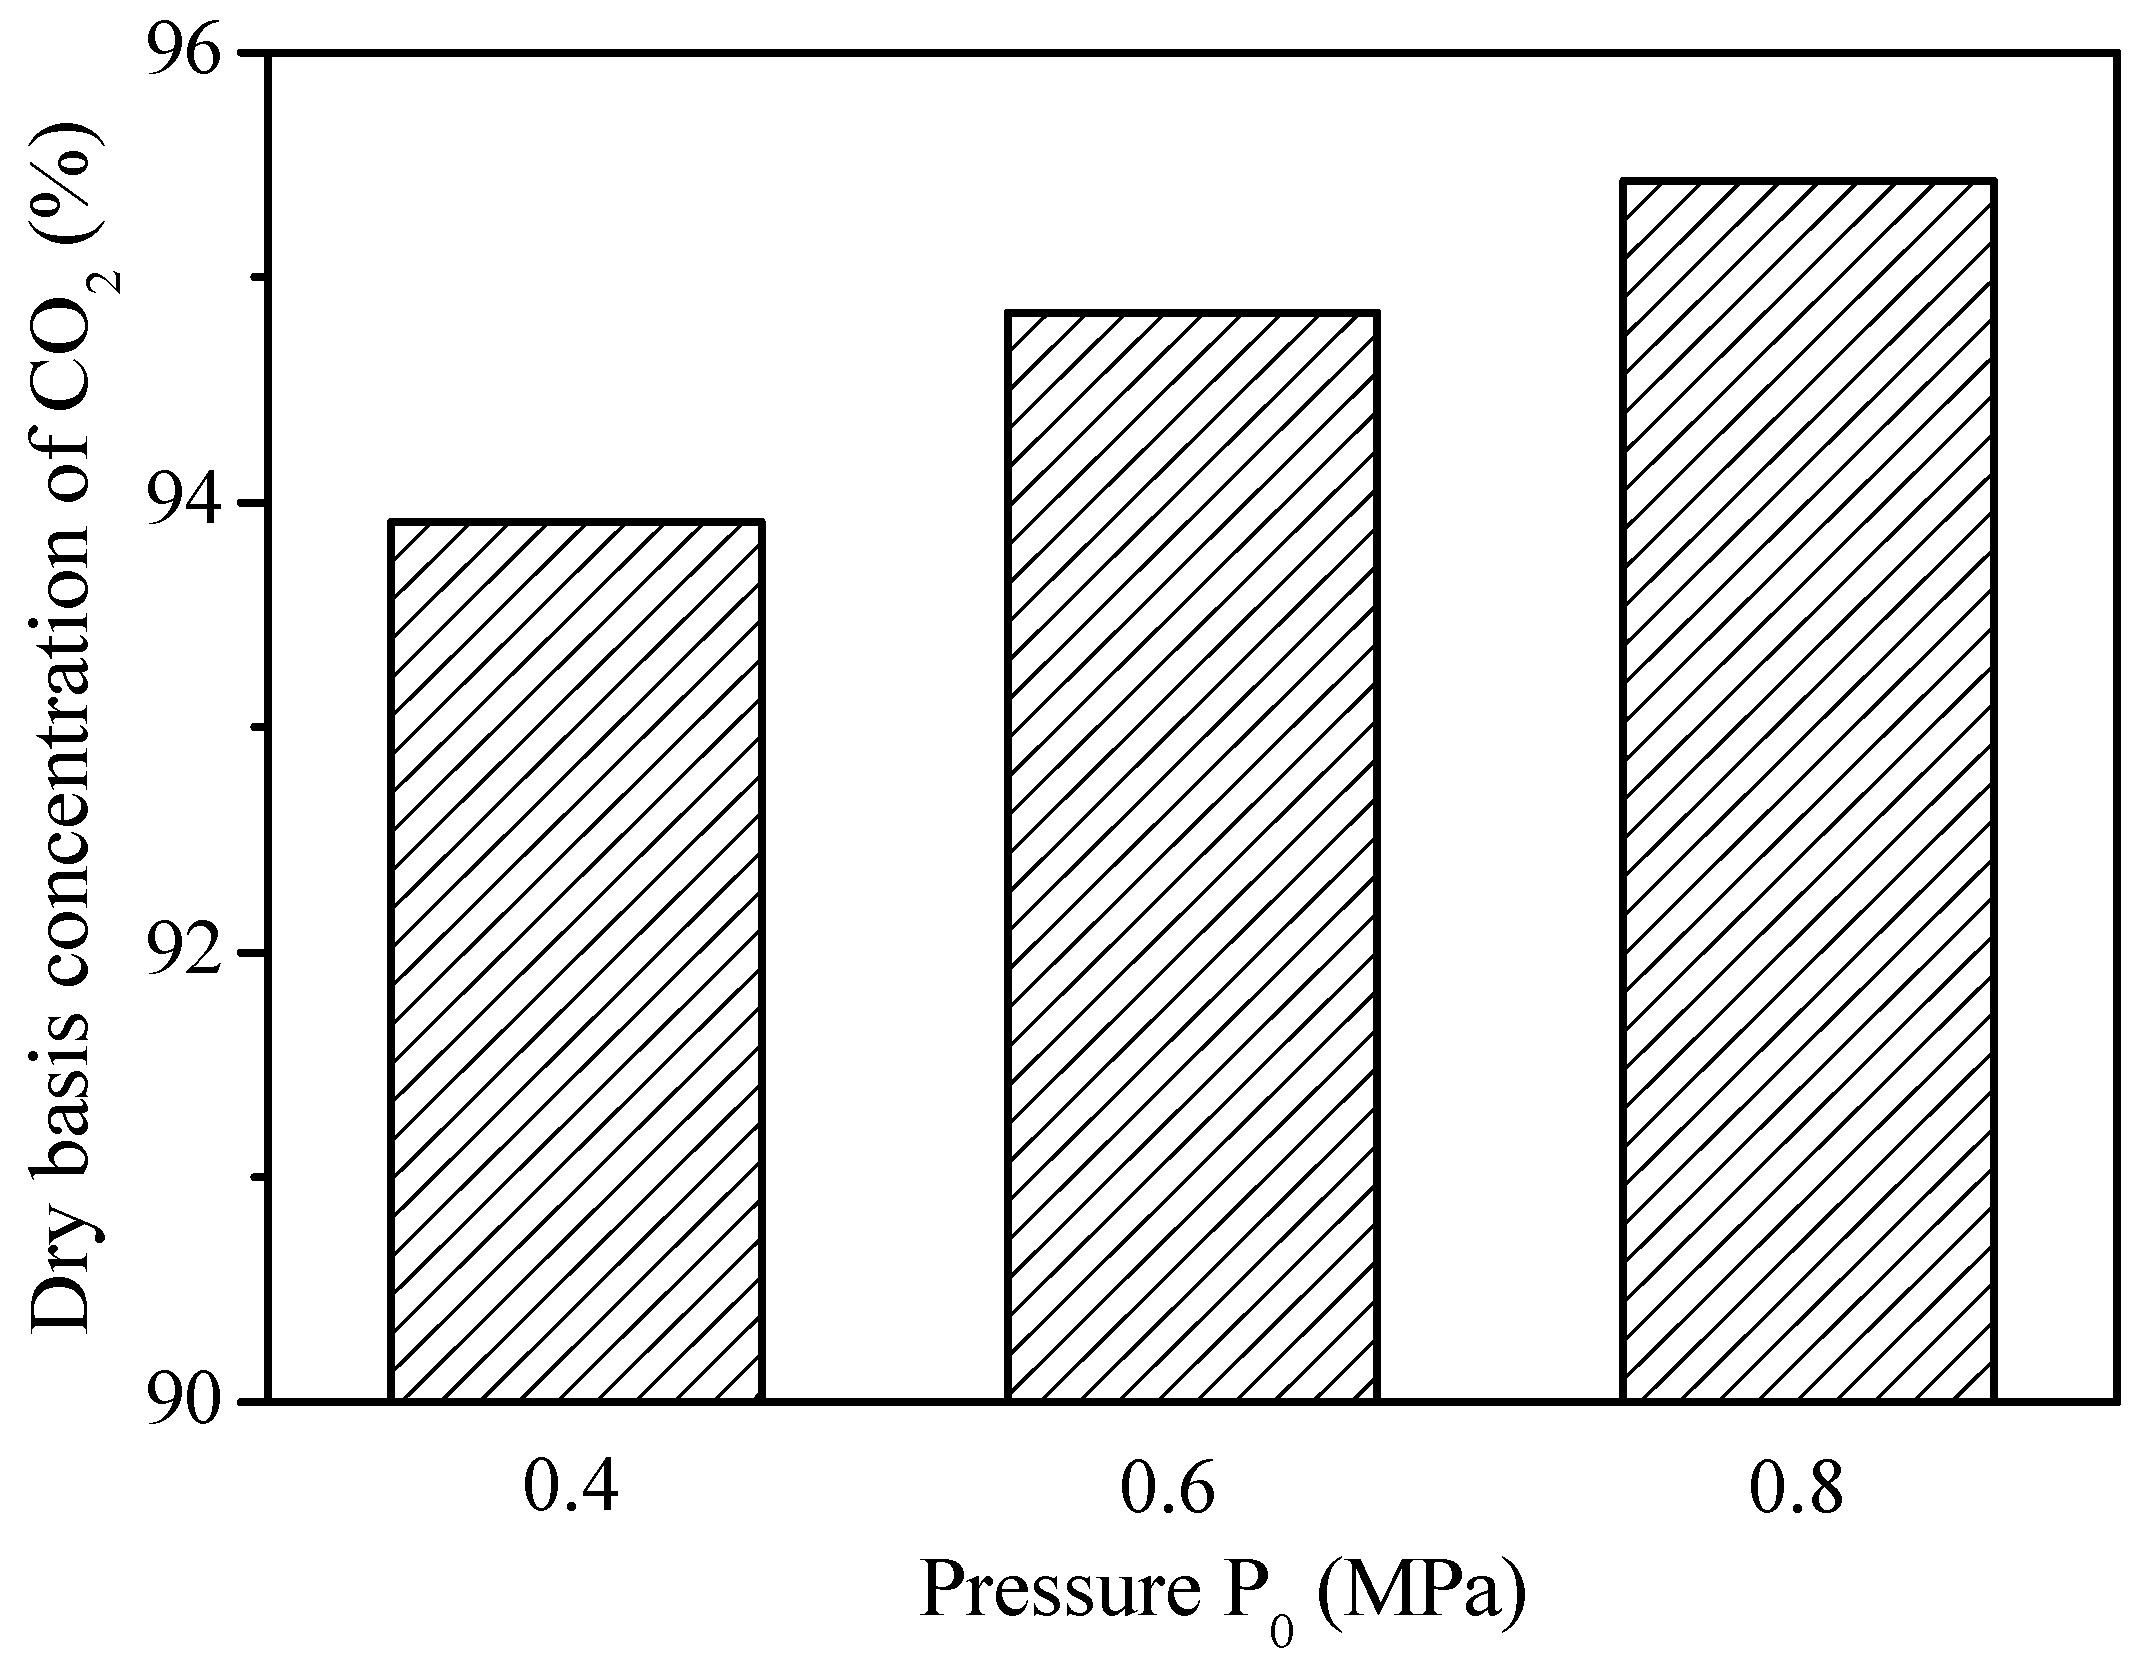
Figure 15 presents the influence of pressure on the CO2 concentration (dry basis) at the outlet of the fuel reactor. An increase in operating pressure leads to an increase in CO2 concentration. The average concentration of CO2 (dry basis) increases from 93.9% to 95.4% when the pressure rises from 0.4 MPa to 0.8 MPa. According to the chemical reactions of iG-CLC, particularly, reactions (8)–(10), the increase of CO2 concentration under a higher pressure condition may be attributed to the following three factors. Firstly, the concentrations of gasification intermediates are increased at elevated pressures, and this promotes the reduction reactions (8)–(10) with the oxygen carrier. Secondly, as shown in Figure 13, the increased operating pressure augments the solids holdup, which further enhances the gas–solid contact and promotes gas–solid reactions. Finally, the gas residence time is longer in the pressurized condition [13,68].
Figure 16 shows the influence of the operating pressure on the single-loop conversion of carbon in the fuel reactor. The carbon conversion goes up substantially from 48.4% to 70.8% with the operating pressure increasing from 0.4 MPa to 0.8 MPa. The elevated steam partial pressure and longer gas residence time facilitate char gasification according to reactions (6)–(7) [68]. Moreover, the elevated pressure leads to a decrease in solids velocity, thus, longer solid residence time and higher char conversion. The predicted results shown in Figure 16 are consistent with the experimental observations of Xiao et al. [26] who conducted their experiments with a fixed bed reactor.
Several researchers (e.g., García-Labiano et al. [7]) found the negative effect of the increasing total pressure on the reduction reaction performance of oxygen carrier. However, for iG-CLC, the rate-controlling step of the whole reaction process is the gasification reactions (6)–(7) of char instead of the subsequent reduction reactions of oxygen carrier [22,39,40,41]. In addition, the possible negative effect for the ilmenite adopted in this study has not been mentioned in the experimental research by Abad et al. [24] and Cuadrat et al. [70] Therefore, the possible negative effect of high operating pressures on the reduction reactions of the oxygen carrier was neglected in this study.
3. Materials and Methods
The comprehensive hydrodynamics and reaction models adopted in this study are based on our previous study [22]. But in order to carry out further and independent validations, we selected a new CFB fuel reactor with a different bed height and diameter from that simulated previously [22,59]. As shown in Figure 17, the fuel reactor simulated in this study is a circulating fluidized bed (CFB) riser with a height of 5 m and an internal diameter of 60 mm by reference to the previous experiments [60,61].
3.1. Governing Equations
In this study, a Euler–Euler model is used to simulate the hydrodynamics of gas–solid flow in the fuel reactor, coupled with chemical reaction models. The standard k–ε model is applied to simulate the gas phase turbulence and the kinetic theory of granular flow (KTGF) is adopted to simulate the solid phase. The mass, momentum and energy conservation equations are applied to both gas and solid phases. The species conservation equations are solved for individual species in each phase. Here, the conservation equations for gas phase (i.e., Equations (1)–(3)) and the species transport equation for gas species (i.e., Equation (4)) are given as the representatives [22,47]. Meanings of the symbols can be found in the nomenclature.
The closure models applied in this simulation to describe constitutive relations are given in Table 3.
In this study, considering the small bed temperature variation along the whole reactor height and the excellent performance of interphase heat transfer in the circulating fluidized bed, the reactor is assumed to be isothermal and the differences of temperature between gas–solid phases are ignored for simplification. The detailed descriptions of governing equations can be found in our previous publication [22].
3.2. Chemical Reactions
As part of the comprehensive numerical model, the complex homogeneous and heterogeneous chemical reactions are considered and coupled into the solver by setting the source terms of continuity, momentum and species transport equations. On this basis, the consumption of the reactants and the harvest of the products during the reaction processes can be calculated in real time [49].
The reactions occurring in the fuel reactor involve the coal pyrolysis (5), the gasification of char (6) and (7), and the oxidation reactions of the intermediate gasification products with the oxygen carrier (8)–(10). All these reactions are included by user defined functions (UDF). The detailed reaction steps are summarized below.
First, coal pyrolysis occurs through reaction (5):
The char is gasified with H2O and CO2 by reactions (6)–(7):
As shown in Reaction (5), the volatile matter in coal was assumed to be released in the form of H2, CO, CH4 and CO2. Other small amounts of light hydrocarbons and tars in the volatiles were not considered in this study [22,70].
The main active components of the Norwegian ilmenite, adopted as the oxygen carrier in this study, include Fe2TiO5 and Fe2O3. Here, the Integrated Rate of Reduction (IRoR) model was adopted, with which the Fe2TiO5 was considered as a mixture of Fe2O3 and TiO2; FeTiO3, a mixture of FeO and TiO2; Fe3O4, a mixture of Fe2O3 and FeO; and TiO2, as an inert material [22,24,74]. Thus, the reduction reactions of ilmenite can be simplified as the following reactions (8)–(10):
The reaction rates are represented by the Arrhenius law with the pre-exponential factors and activation energies obtained from the previous literatures [25,70,75]. Further details on the reaction kinetics and the model can be found from our previous publication [22].
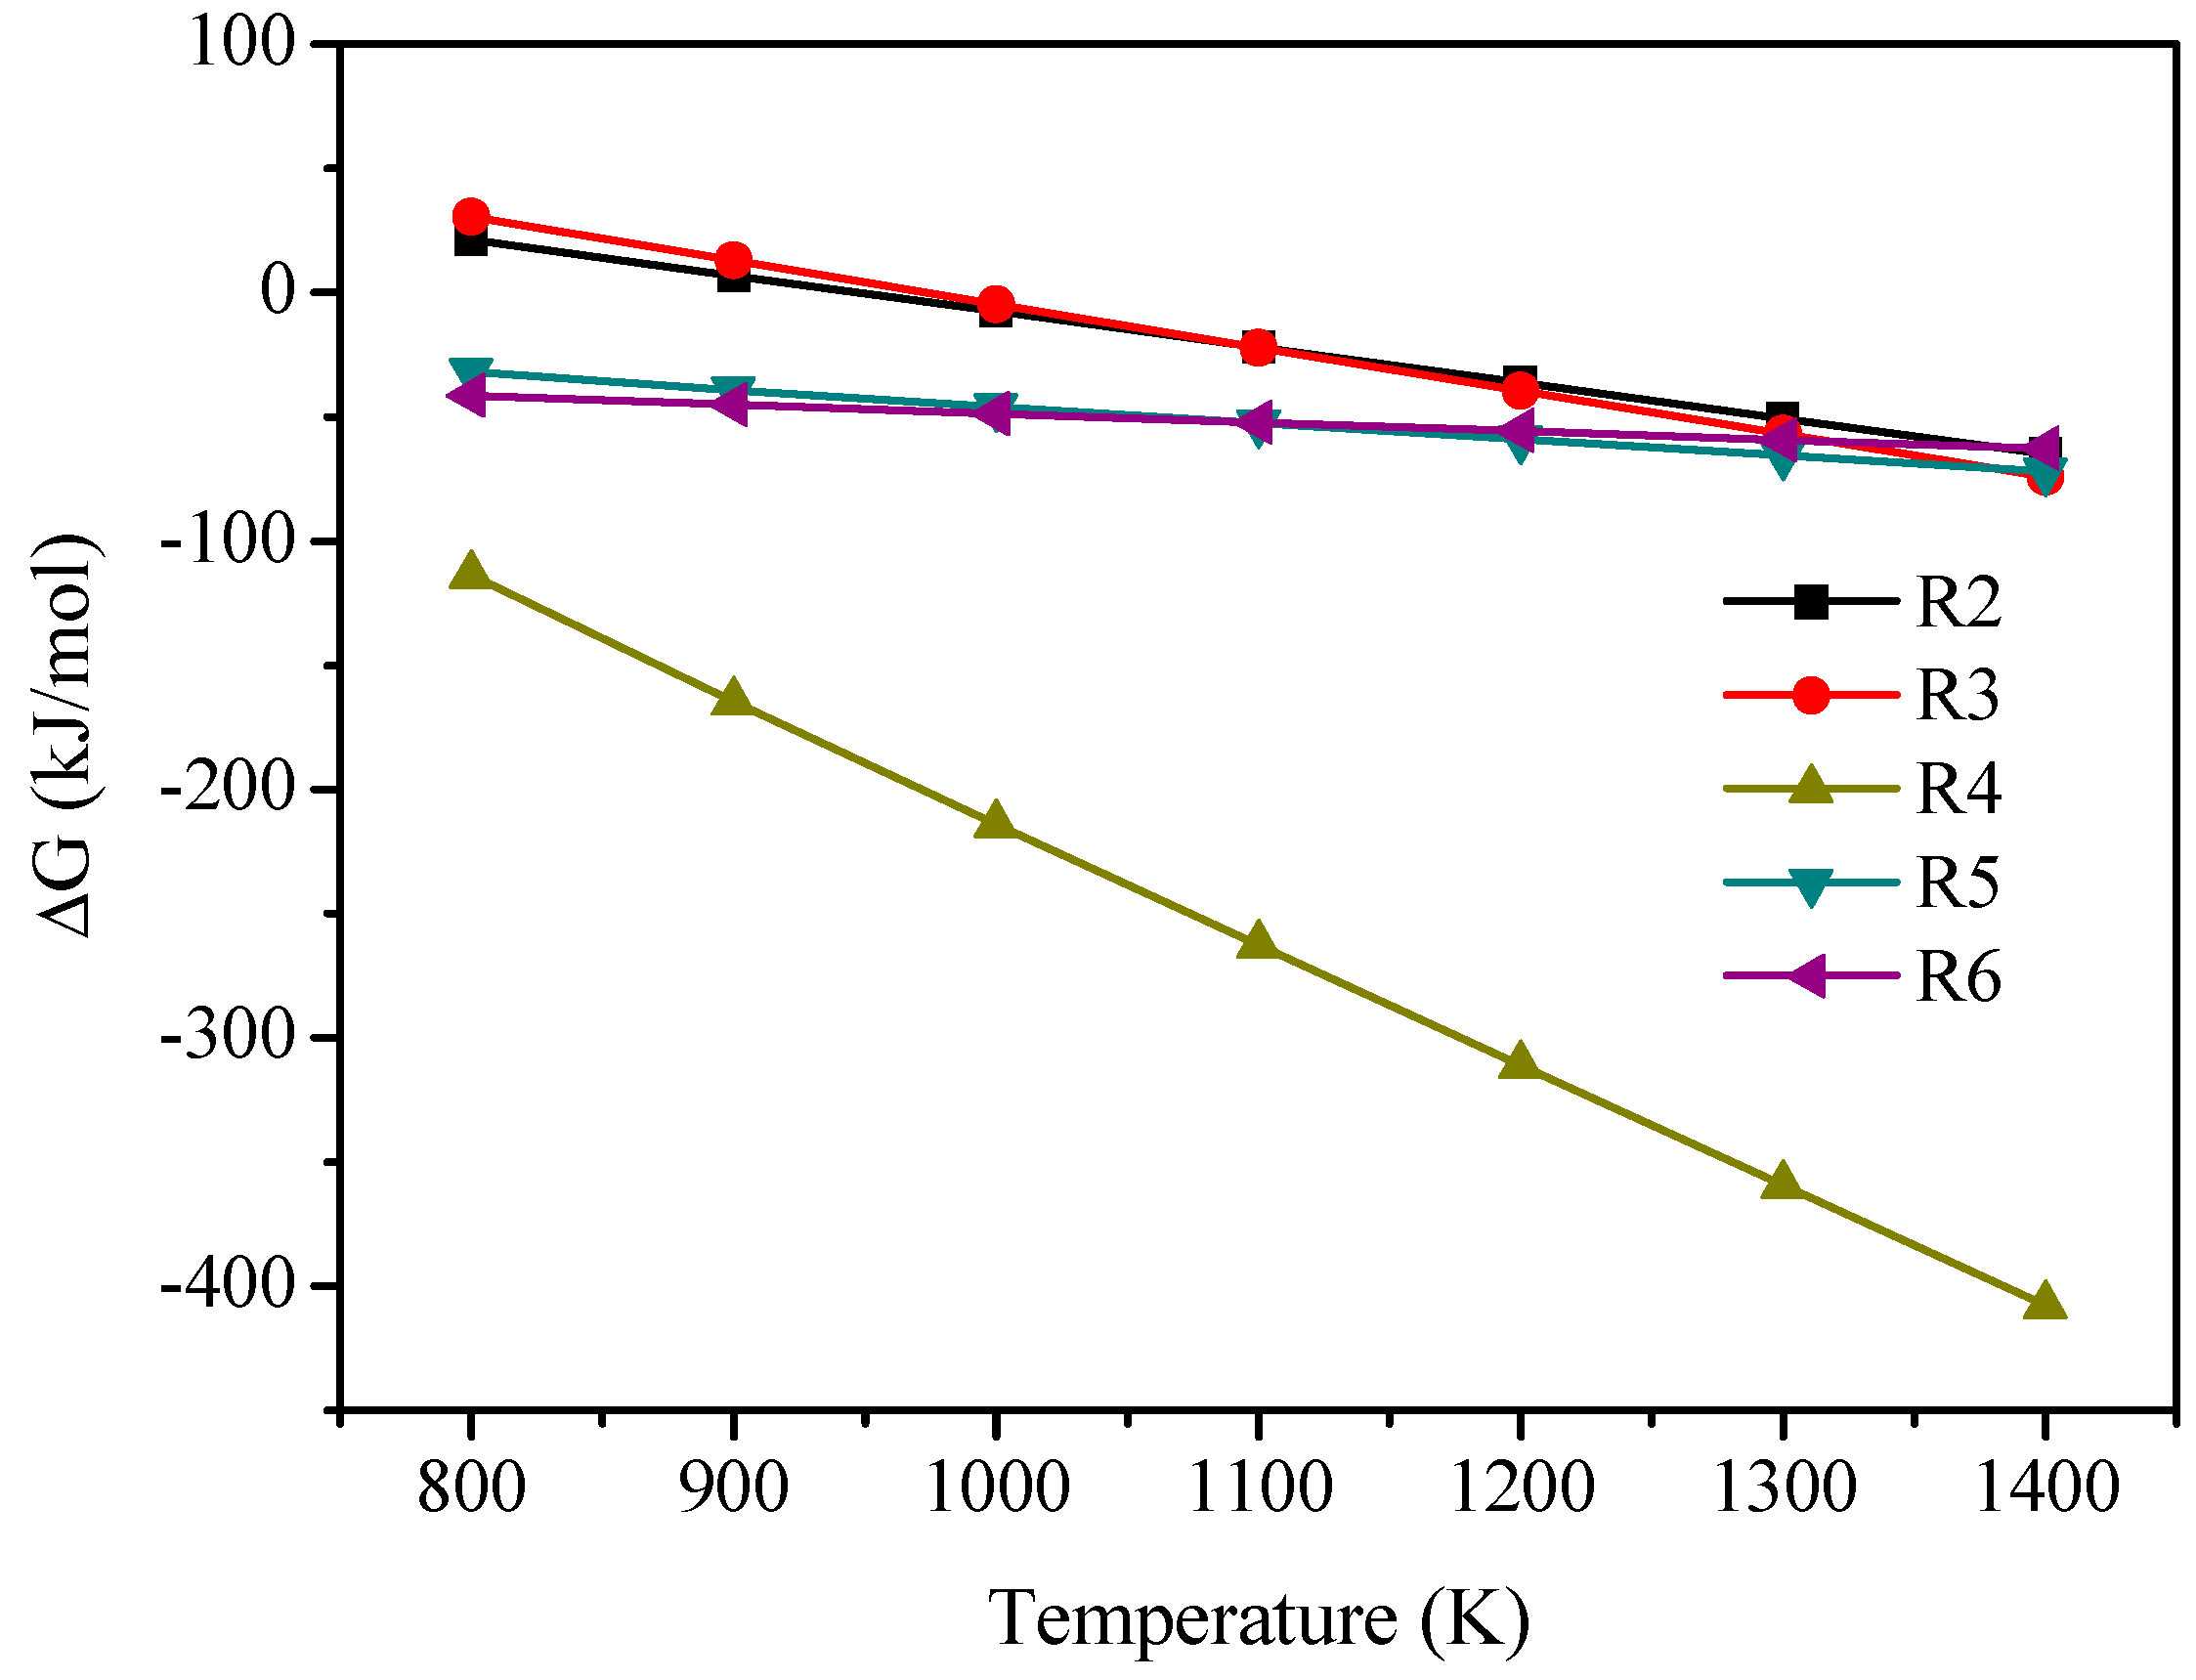
Figure 18 shows the standard Gibbs free energy changes for the main reactions (6)–(10) in the fuel reactor calculated over a wide range of operating temperatures. It can be seen that the Gibbs free energy decreases with an increase in the reaction temperature for all of these reactions. As the reaction affinity is enhanced with a decrease in the Gibbs free energy [76], high temperatures favor the reactions in the fuel reactor. Therefore, we selected a relatively high temperature of 1273 K as the temperature of the fuel reactor to be simulated.
3.3. Data Evaluation
The dry basis component concentration (fi) in the exhaust gas is calculated as follows [22]:
where xi is the molar fraction of species i (e.g., CO, CO2, CH4 or H2) in the gas phase.
The single-loop conversion of carbon (XC) is calculated as [22]:
where YC is the mass fraction of carbon in the original coal, QCoal,in is the mass flux of coal at the solids inlet and QC,out is the mass flux of unreacted char at the outlet.
The solids flux (i.e., solid circulation rate) Gp is calculated as:
where Up,f is the particle velocity at the feed inlet, αp,f is the particle volume fraction at the feed inlet, Af is the sectional area of the feed inlet, and As is the sectional area of the steam inlet (i.e., the sectional area of the fuel reactor).
3.4. Numerical Considerations
In this study, simulations were carried out in three-dimensional (3D) domains. The pressure-based solver was employed for solving the governing equations. The phase-coupled semi-implicit method for pressure-linked equations (PC-SIMPLEs) algorithm was applied to deal with the pressure–velocity coupling. After mesh independence analyses, the hexahedral grids were applied in the dilute zone and tetrahedral grids were applied in the dense region near the inlets. The total mesh number is about 51,000. After the time step-independence analysis, a time step of 1 × 10⁻³ s with the convergence criterion of 1 × 10⁻⁴ was set for this study.
As shown in Figure 17, the velocity inlet boundary condition was adopted at both of the steam inlet and feed inlet. The outflow boundary condition was used at the outlet. At the walls, the no-slip wall condition was assumed [22,45,48]. The maximum particle packing was limited to 0.64. Physical parameters of the gas and solid mixtures obeyed the volume/mass-weighted-mixing law. The fuel reactor was initially filled with steam (H2O), the solid particles of coal and oxygen carrier were then fed into the reactor at the beginning of a simulation.
The oxygen carrier material used in the simulations was assumed to be the Norwegian ilmenite [22,24,25]. The particle diameter of the ilmenite was assumed to be uniform (150 μm). The fuel adopted for the simulation was a Colombian bituminous coal [22,70] with a uniform diameter of 200 μm. Further details on the properties of the Norwegian ilmenite and the Colombian coal can be found from our previous publication [22].
4. Conclusions
A comprehensive three-dimensional numerical model including the kinetic theory of granular flow and complicated gas–solid reactions was developed to simulate the iG-CLC process in a circulating fluidized bed (CFB) fuel reactor. Extending from the previous basic simulations and after further validations, the model has been used to study the effects of some important operating conditions, i.e., solids flux, steam flow and operating pressure, on the gas–solid flow behaviors, CO2 concentration and fuel conversion. The following conclusions can be drawn from the present study:
- (1)
- The single-loop conversion of carbon and CO2 dry-basis concentration at the fuel reactor outlet under the reference condition are comparable to those from the previous experimental system, demonstrating the CFB riser with high solids flux is a potential candidate for the fuel reactor of iG-CLC.
- (2)
- An increase in the solids flux results in an increase in the CO2 concentration at the outlet, which is believed to be mainly due to the increased solids holdup and better gas–solid contacts that promote gas–solid reactions. However, a higher solids flux has a slightly negative effect on the single-loop carbon conversion. This is mainly due to the decrease in the solids residence time.
- (3)
- A decrease in the steam flow gives rise to an increase in CO2 concentration at the fuel reactor outlet because of the higher solids holdup and the lower gas velocity, which further enhances the gas–solid contacts and the residence time of gas for reactions. In addition, a decrease in the steam flow promotes the single-loop conversion of carbon mainly as a result of the increased solids residence time. However, in order to ensure the circulation and fluidization of the particles, there exists a minimum requirement for the steam flow under the conditions of the given operating temperature, pressure and particle flows.
- (4)
- An increase in the operating pressure leads to an increase in the CO2 concentration at the outlet of the fuel reactor due to the higher concentrations of gasification intermediates, higher solids holdup and the lower gas velocity, which promote the reduction reactions (8)–(10) with the oxygen carrier. The elevated steam partial pressure and longer gas residence time facilitate the char gasification. Moreover, the elevated pressure leads to a decrease in solids velocity, thus longer solids residence time and higher carbon conversion. Therefore, it should be beneficial for a practical CFB fuel reactor of iG-CLC system to be designed and operated under a certain pressurized conditions.
Author Contributions
Conceptualization, X.W. and B.J.; investigation, X.W.; formal analysis, X.W. and H.L.; supervision, B.Z.; writing—original draft preparation, X.W.; writing—review and editing, H.L., and Y.Z.
Funding
This research was funded by the National Natural Science Foundation of China (grant numbers 51806035, 51741603, 51676038), the Natural Science Fund project in Jiangsu Province (grant number BK20170669), the Fundamental Research Funds for the Central Universities (grant number 2242018K40117), and the Guangdong Provincial Key Laboratory of New and Renewable Energy Research and Development (grant number Y707s41001).
Conflicts of Interest
The authors declare no conflict of interest.
Nomenclature
| Af | sectional area of the feed inlet [m2] |
| As | sectional area of the fuel reactor [m2] |
| fi | dry basis concentration of gas component |
| acceleration due to gravity [m/s2] | |
| Gp | solids flux [kg/(m2·s)] |
| H | specific enthalpy [J/kg] |
| Ji | diffusion flux of species i [kg/(m2·s)] |
| p | pressure [Pa] |
| P0 | operating pressure [MPa] |
| QC,out | mass flux of unreacted char at the outlet [kg/h] |
| QCoal,in | mass flux of coal at the solids inlet [kg/h] |
| Qh | steam flow under the operating temperature and pressure [m3/h] |
| mass source term [kg/(m3·s)] | |
| Si | net rate of production of species i [kg/(m3·s)] |
| Up,f | particle velocity at the feed inlet [m/s] |
| v | velocity [m/s] |
| xi | molar fraction of species i in the gas phase |
| XC | single-loop conversion of carbon [%] |
| Y | mass fraction |
| volume fraction | |
| drag [kg/(m3·s)] | |
| thermal conductivity [W/(m2·K)] | |
| density [kg/m3] | |
| stress-strain tensor [Pa] |
References
- Lyngfelt, A.; Leckner, B.; Mattisson, T. A fluidized-bed combustion process with inherent CO2 separation; application of chemical-looping combustion. Chem. Eng. Sci. 2001, 56, 3101–3113. [Google Scholar] [CrossRef]
- Abad, A.; Mattisson, T.; Lyngfelt, A.; Johansson, M. The use of iron oxide as oxygen carrier in a chemical-looping reactor. Fuel 2007, 86, 1021–1035. [Google Scholar] [CrossRef]
- Mattisson, T.; García-Labiano, F.; Kronberger, B.; Lyngfelt, A.; Adánez, J.; Hofbauer, H. Chemical-Looping Combustion using syngas as fuel. Int. J. Greenh. Gas Control 2007, 1, 158–169. [Google Scholar] [CrossRef]
- Ishida, M.; Jin, H.; Okamoto, T. A fundamental study of a new kind of medium material for chemical-looping combustion. Energy Fuels 1996, 10, 958–963. [Google Scholar] [CrossRef]
- Jin, H.; Okamoto, T.; Ishida, M. Development of a novel chemical-looping combustion: Synthesis of a solid looping material of NiO/NiAl2O4. Ind. Eng. Chem. Res. 1999, 38, 126–132. [Google Scholar] [CrossRef]
- Cho, P.; Mattisson, T.; Lyngfelt, A. Comparison of iron-, nickel-, copper-and manganese-based oxygen carriers for chemical-looping combustion. Fuel 2004, 83, 1215–1225. [Google Scholar] [CrossRef]
- Garcia-Labiano, F.; Adanez, J.; de Diego, L.F.; Gayán, P.; Abad, A. Effect of pressure on the behavior of copper-, iron-, and nickel-based oxygen carriers for chemical-looping combustion. Energy Fuels 2006, 20, 26–33. [Google Scholar] [CrossRef]
- De Diego, L.F.; García-Labiano, F.; Gayán, P.; Celaya, J.; Palacios, J.M.; Adánez, J. Operation of a 10 kWth chemical-looping combustor during 200 h with a CuO-Al2O3 oxygen carrier. Fuel 2007, 86, 1036–1045. [Google Scholar] [CrossRef] [Green Version]
- Adánez, J.; Dueso, C.; de Diego, L.F.; García-Labiano, F.; Gayán, P.; Abad, A. Methane combustion in a 500 Wth chemical-looping combustion system using an impregnated Ni-based oxygen carrier. Energy Fuels 2008, 23, 130–142. [Google Scholar] [CrossRef]
- Kolbitsch, P.; Bolhàr-Nordenkampf, J.; Pröll, T.; Hofbauer, H. Operating experience with chemical looping combustion in a 120kW dual circulating fluidized bed (DCFB) unit. Int. J. Greenh. Gas Control 2010, 4, 180–185. [Google Scholar] [CrossRef]
- Ma, J.; Zhao, H.; Tian, X.; Wei, Y.; Zhang, Y.; Zheng, C. Continuous Operation of Interconnected Fluidized Bed Reactor for Chemical Looping Combustion of CH4 Using Hematite as Oxygen Carrier. Energy Fuels 2015, 29, 3257–3267. [Google Scholar] [CrossRef]
- Berguerand, N.; Lyngfelt, A. Design and operation of a 10 kWth chemical-looping combustor for solid fuels-testing with South African coal. Fuel 2008, 87, 2713–2726. [Google Scholar] [CrossRef]
- Leion, H.; Mattisson, T.; Lyngfelt, A. Solid fuels in chemical-looping combustion. Int. J. Greenh. Gas Control 2008, 2, 180–193. [Google Scholar] [CrossRef]
- Shen, L.H.; Wu, J.H.; Xiao, J. Experiments on chemical looping combustion of coal with a NiO based oxygen carrier. Combust. Flame 2009, 156, 721–728. [Google Scholar] [CrossRef]
- Fan, L.S.; Li, F. Chemical looping technology and its fossil energy conversion applications. Ind. Eng. Chem. Res. 2010, 49, 10200–10211. [Google Scholar] [CrossRef]
- Abad, A.; Gayán, P.; de Diego, L.F.; García-Labiano, F.; Adánez, J. Fuel reactor modelling in chemical-looping combustion of coal: 1. Model formulation. Chem. Eng. Sci. 2013, 87, 277–293. [Google Scholar] [CrossRef] [Green Version]
- García-Labiano, F.; de Diego, L.F.; Gayán, P.; Abad, A.; Adánez, J. Fuel reactor modelling in chemical-looping combustion of coal: 2-simulation and optimization. Chem. Eng. Sci. 2013, 87, 173–182. [Google Scholar] [CrossRef] [Green Version]
- Forero, C.R.; Gayán, P.; de Diego, L.F.; Abad, A.; García-Labiano, F.; Adánez, J. Syngas combustion in a 500 Wth chemical-looping combustion system using an impregnated Cu-based oxygen carrier. Fuel Process. Technol. 2009, 90, 1471–1479. [Google Scholar] [CrossRef] [Green Version]
- Jin, H.; Ishida, M. A new type of coal gas fueled chemical-looping combustion. Fuel 2004, 83, 2411–2417. [Google Scholar] [CrossRef]
- Spallina, V.; Gallucci, F.; Romano, M.C.; Chiesa, P.; Lozza, G.; van Sint Annaland, M. Investigation of heat management for CLC of syngas in packed bed reactors. Chem. Eng. J. 2013, 225, 174–191. [Google Scholar] [CrossRef]
- Hamers, H.P.; Romano, M.C.; Spallina, V.; Chiesa, P.; Gallucci, F.; van Sint Annaland, M. Energy analysis of two stage packed-bed chemical looping combustion configurations for integrated gasification combined cycles. Energy 2015, 85, 489–502. [Google Scholar] [CrossRef] [Green Version]
- Wang, X.; Jin, B.; Zhang, Y.; Zhang, Y.; Liu, X. Three Dimensional Modeling of a Coal-Fired Chemical Looping Combustion Process in the Circulating Fluidized Bed Fuel Reactor. Energy Fuels 2013, 27, 2173–2184. [Google Scholar] [CrossRef]
- Wang, X.; Jin, B.; Liu, X.; Zhang, Y.; Liu, H. Experimental investigation on flow behaviors in a novel in situ gasification chemical looping combustion apparatus. Ind. Eng. Chem. Res. 2013, 52, 14208–14218. [Google Scholar] [CrossRef]
- Abad, A.; Adánez, J.; Cuadrat, A.; García-Labiano, F.; Gayán, P.; Luis, F. Kinetics of redox reactions of ilmenite for chemical-looping combustion. Chem. Eng. Sci. 2011, 66, 689–702. [Google Scholar] [CrossRef] [Green Version]
- Adánez, J.; Cuadrat, A.; Abad, A.; Gayán, P.; de Diego, L.; García-Labiano, F. Ilmenite activation during consecutive redox cycles in chemical-looping combustion. Energy Fuels 2010, 24, 1402–1413. [Google Scholar] [CrossRef]
- Xiao, R.; Song, Q.; Song, M.; Lu, Z.; Zhang, S.; Shen, L. Pressurized chemical-looping combustion of coal with an iron ore-based oxygen carrier. Combust. Flame 2010, 157, 1140–1153. [Google Scholar] [CrossRef]
- Cuadrat, A.; Abad, A.; Adánez, J.; de Diego, L.; García-Labiano, F.; Gayán, P. Behavior of ilmenite as oxygen carrier in chemical-looping combustion. Fuel Process. Technol. 2012, 94, 101–112. [Google Scholar] [CrossRef] [Green Version]
- Cuadrat, A.; Abad, A.; García-Labiano, F.; Gayán, P.; de Diego, L.; Adánez, J. Effect of operating conditions in Chemical-Looping Combustion of coal in a 500 Wth unit. Int. J. Greenh. Gas Control 2012, 6, 153–163. [Google Scholar] [CrossRef] [Green Version]
- Bayham, S.; McGiveron, O.; Tong, A.; Chung, E.; Kathe, M.; Wang, D.; Zeng, L.; Fan, L.S. Parametric and dynamic studies of an iron-based 25-kWth coal direct chemical looping unit using sub-bituminous coal. Appl. Energy 2015, 145, 354–363. [Google Scholar] [CrossRef]
- Linderholm, C.; Schmitz, M. Chemical-looping combustion of solid fuels in a 100 kW dual circulating fluidized bed system using iron ore as oxygen carrier. J. Environ. Chem. Eng. 2016, 4, 1029–1039. [Google Scholar] [CrossRef]
- Ma, J.; Zhao, H.; Tian, X.; Wei, Y.; Rajendran, S.; Zhang, Y.; Bhattacharya, S.; Zheng, C. Chemical looping combustion of coal in a 5 kWth interconnected fluidized bed reactor using hematite as oxygen carrier. Appl. Energy 2015, 157, 304–313. [Google Scholar] [CrossRef]
- Pérez-Vega, R.; Abad, A.; García-Labiano, F.; Gayán, P.; Luis, F.; Adánez, J. Coal combustion in a 50 kWth Chemical Looping Combustion unit: Seeking operating conditions to maximize CO2 capture and combustion efficiency. Int. J. Greenh. Gas Control 2016, 50, 80–92. [Google Scholar] [CrossRef]
- Ströhle, J.; Orth, M.; Epple, B. Design and operation of a 1 MWth chemical looping plant. Appl. Energy 2014, 113, 1490–1495. [Google Scholar] [CrossRef]
- Thon, A.; Kramp, M.; Hartge, E.-U.; Heinrich, S.; Werther, J. Operational experience with a system of coupled fluidized beds for chemical looping combustion of solid fuels using ilmenite as oxygen carrier. Appl. Energy 2014, 118, 309–317. [Google Scholar] [CrossRef]
- Xiao, R.; Chen, L.; Saha, C.; Zhang, S.; Bhattacharya, S. Pressurized chemical-looping combustion of coal using an iron ore as oxygen carrier in a pilot-scale unit. Int. J. Greenh. Gas Control 2012, 10, 363–373. [Google Scholar] [CrossRef]
- Wang, X.; Jin, B.; Zhu, X.; Liu, H. Experimental Evaluation of a Novel 20 kWth in Situ Gasification Chemical Looping Combustion Unit with an Iron Ore as the Oxygen Carrier. Ind. Eng. Chem. Res. 2016, 55, 11775–11784. [Google Scholar] [CrossRef]
- Gayán, P.; Abad, A.; de Diego, L.F.; García-Labiano, F.; Adánez, J. Assessment of technological solutions for improving chemical looping combustion of solid fuels with CO2 capture. Chem. Eng. J. 2013, 233, 56–69. [Google Scholar] [CrossRef]
- Abad, A.; Mendiara, T.; Gayán, P.; García-Labiano, F.; de Diego, L.F.; Bueno, J.A.; Pérez-Vega, R.; Adánez, J. Comparative Evaluation of the Performance of Coal Combustion in 0.5 and 50 kWth Chemical Looping Combustion units with ilmenite, redmud or iron ore as oxygen carrier. Energy Procedia 2017, 114, 285–301. [Google Scholar] [CrossRef]
- Adánez, J.; Abad, A.; Mendiara, T.; Gayán, P.; de Diego, L.F.; García-Labiano, F. Chemical looping combustion of solid fuels. Prog. Energy Combust. 2018, 65, 6–66. [Google Scholar] [CrossRef]
- Cheng, M.; Sun, H.; Li, Z.; Cai, N. Annular carbon stripper for chemical-looping combustion of coal. Ind. Eng. Chem. Res. 2017, 56, 1580–1593. [Google Scholar] [CrossRef]
- Wang, P.; Means, N.; Howard, B.H.; Shekhawat, D.; Berry, D. The reactivity of CuO oxygen carrier and coal in Chemical-Looping with Oxygen Uncoupled (CLOU) and In-situ Gasification Chemical-Looping Combustion (iG-CLC). Fuel 2018, 217, 642–649. [Google Scholar] [CrossRef]
- Chen, X.; Shi, D.; Gao, X.; Luo, Z. A fundamental CFD study of the gas–solid flow field in fluidized bed polymerization reactors. Powder Technol. 2011, 205, 276–288. [Google Scholar] [CrossRef]
- Maghrebi, R.; Yaghobi, N.; Seyednejadian, S.; Tabatabaei, M.H. CFD modeling of catalyst pellet for oxidative coupling of methane: Heat transfer and reaction. Particuology 2013, 11, 506–513. [Google Scholar] [CrossRef]
- Shah, M.T.; Utikar, R.P.; Pareek, V.K. CFD study: Effect of pulsating flow on gas–solid hydrodynamics in FCC riser. Particuology 2017, 31, 25–34. [Google Scholar] [CrossRef]
- Wang, X.; Jin, B.; Wang, Y.; Hu, C. Three-dimensional multi-phase simulation of the mixing and segregation of binary particle mixtures in a two-jet spout fluidized bed. Particuology 2015, 22, 185–193. [Google Scholar] [CrossRef]
- Wang, X.; Jin, B.; Zhong, W. Three-dimensional simulation of fluidized bed coal gasification. Chem. Eng. Process. 2009, 48, 695–705. [Google Scholar] [CrossRef]
- Zhou, W.; Zhao, C.S.; Duan, L.B.; Qu, C.R.; Chen, X.P. Two-dimensional computational fluid dynamics simulation of coal combustion in a circulating fluidized bed combustor. Chem. Eng. J. 2011, 166, 306–314. [Google Scholar] [CrossRef]
- Deng, Z.; Xiao, R.; Jin, B.; Song, Q.; Huang, H. Multiphase CFD Modeling for a Chemical Looping Combustion Process (Fuel Reactor). Chem. Eng. Technol. 2008, 31, 1754–1766. [Google Scholar] [CrossRef]
- Jung, J.; Gamwo, I. Multiphase CFD-based models for chemical looping combustion process: Fuel reactor modeling. Powder Technol. 2008, 183, 401–409. [Google Scholar] [CrossRef]
- Mahalatkar, K.; Kuhlman, J.; Huckaby, E.; O’Brien, T. Computational fluid dynamic simulations of chemical looping fuel reactors utilizing gaseous fuels. Chem. Eng. Sci. 2011, 66, 469–479. [Google Scholar] [CrossRef]
- Wang, X.; Jin, B.; Zhang, Y.; Zhong, W.; Yin, S. Multiphase Computational Fluid Dynamics (CFD) Modeling of Chemical Looping Combustion Using a CuO/Al2O3 Oxygen Carrier: Effect of Operating Conditions on Coal Gas Combustion. Energy Fuels 2011, 25, 3815–3824. [Google Scholar] [CrossRef]
- Wang, X.; Jin, B.; Zhong, W.; Zhang, Y.; Song, M. Three-dimensional simulation of a coal gas fueled chemical looping combustion process. Int. J. Greenh. Gas Control 2011, 5, 1498–1506. [Google Scholar] [CrossRef]
- Wang, S.; Lu, H.; Zhao, F.; Liu, G. CFD studies of dual circulating fluidized bed reactors for chemical looping combustion processes. Chem. Eng. J. 2014, 236, 121–130. [Google Scholar] [CrossRef]
- Mahalatkar, K.; Kuhlman, J.; Huckaby, E.; O’Brien, T. CFD simulation of a chemical-looping fuel reactor utilizing solid fuel. Chem. Eng. Sci. 2011, 66, 3617–3627. [Google Scholar] [CrossRef]
- Su, M.; Zhao, H.; Ma, J. Computational fluid dynamics simulation for chemical looping combustion of coal in a dual circulation fluidized bed. Energy Convers. Manag. 2015, 105, 1–12. [Google Scholar] [CrossRef]
- Shao, Y.; Zhang, Y.; Wang, X.; Wang, X.; Jin, B.; Liu, H. Three-dimensional full loop modeling and optimization of an in situ gasification chemical looping combustion system. Energy Fuels 2017, 31, 13859–13870. [Google Scholar] [CrossRef]
- Alobaid, F.; Ohlemüller, P.; Ströhle, J.; Epple, B. Extended Euler–Euler model for the simulation of a 1 MWth chemical–looping pilot plant. Energy 2015, 93, 2395–2405. [Google Scholar] [CrossRef]
- May, J.; Alobaid, F.; Ohlemüller, P.; Stroh, A.; Ströhle, J.; Epple, B. Reactive two–fluid model for chemical–looping combustion–Simulation of fuel and air reactors. Int. J. Greenh. Gas Control 2018, 76, 175–192. [Google Scholar] [CrossRef]
- Pärssinen, J.; Zhu, J. Particle velocity and flow development in a long and high-flux circulating fluidized bed riser. Chem. Eng. Sci. 2001, 56, 5295–5303. [Google Scholar] [CrossRef]
- Jin, B.; Wang, X.; Zhong, W.; Tao, H.; Ren, B.; Xiao, R. Modeling on high-flux circulating fluidized bed with Geldart group B particles by kinetic theory of granular flow. Energy Fuels 2010, 24, 3159–3172. [Google Scholar] [CrossRef]
- Wang, X.; Jin, B.; Zhong, W.; Zhang, M.; Huang, Y.; Duan, F. Flow behaviors in a high-flux circulating fluidized bed. Int. J. Chem. React. Eng. 2008, 6, A79. [Google Scholar] [CrossRef]
- Wang, X.; Jin, B.; Liu, H.; Wang, W.; Liu, X.; Zhang, Y. Optimization of in Situ Gasification Chemical Looping Combustion through Experimental Investigations with a Cold Experimental System. Ind. Eng. Chem. Res. 2015, 54, 5749–5758. [Google Scholar] [CrossRef]
- Contractor, R.M.; Patience, G.S.; Garnett, D.I.; Horowitz, H.S.; Sisler, G.M.; Bergna, H.E. A new process for n-butane oxidation to maleic anhydride using a circulating fluidized bed reactor. In Circulating Fluidized Bed Technology IV; Avidan, A., Ed.; AIChE: New York, NY, USA, 1994. [Google Scholar]
- Mei, J.S.; Shadle, L.J.; Yue, P.; Monazam, E.R. Hydrodynamics of a transport reactor operating in dense suspension upflow conditions for coal combustion applications. In Proceedings of the 18th International Conference on Fluidized Bed Combustion, Toronto, ON, Canada, 22–25 May 2005. [Google Scholar]
- Morton, F.; Pinkston, T.; Salazar, N.; Stalls, D. Orlando gasification project: Demonstration of a nominal 285 MW coal-based transport gasifier. In Proceedings of the 23rd Annual International Pittsburgh Coal Conference, Pittsburgh, PA, USA, 25–28 September 2006. [Google Scholar]
- Li, Z.; Wu, C.; Wei, F.; Jin, Y. Experimental study of high-density gas—Solids flow in a new coupled circulating fluidized bed. Powder Technol. 2004, 139, 214–220. [Google Scholar] [CrossRef]
- Malcus, S.; Cruz, E.; Rowe, C.; Pugsley, T. Radial solid mass flux profiles in a high-suspension density circulating fluidized bed. Powder Technol. 2002, 125, 5–9. [Google Scholar] [CrossRef]
- Liu, G.; Niksa, S. Coal conversion submodels for design applications at elevated pressures. Part II. Char gasification. Prog. Energy Combust. Sci. 2004, 30, 679–717. [Google Scholar] [CrossRef]
- Yin, S.; Jin, B.; Zhong, W.; Lu, Y.; Zhang, Y.; Shao, Y.; Liu, H. Solids holdup of high flux circulating fluidized bed at elevated pressure. Chem. Eng. Technol. 2012, 35, 904–910. [Google Scholar] [CrossRef]
- Cuadrat, A.; Abad, A.; Gayán, P.; de Diego, L.F.; García-Labiano, F.; Adánez, J. Theoretical approach on the CLC performance with solid fuels: Optimizing the solids inventory. Fuel 2012, 97, 536–551. [Google Scholar] [CrossRef] [Green Version]
- Benyahia, S.; Syamlal, M.; O’Brien, T.J. Study of the ability of multiphase continuum models to predict core-annulus flow. AIChE J. 2007, 53, 2549–2568. [Google Scholar] [CrossRef]
- Gidaspow, D.; Bezburuah, R.; Ding, J. Hydrodynamics of circulating fluidized beds: Kinetic theory approach. In Proceedings of the 7th Engineering Foundation Conference on Fluidization, Brisbane, Australia, 3–8 May 1992. [Google Scholar]
- Lun, C.K.K.; Savage, S.B.; Jeffrey, D.J.; Chepurniy, N. Kinetic theories for granular flow: Inelastic particles in Couette flow and slightly inelastic particles in a general flowfield. J. Fluid Mech. 1984, 140, 223–256. [Google Scholar] [CrossRef]
- Donskoi, E.; McElwain, D.; Wibberley, L. Estimation and modeling of parameters for direct reduction in iron ore/coal composites: Part II. Kinetic parameters. Metall. Mater. Trans. B 2003, 34, 255–266. [Google Scholar] [CrossRef]
- Smoot, L.; Smith, P. Coal Combustion and Gasification; Plenum Press: New York, NY, USA, 1985. [Google Scholar]
- Carrero-Mantilla, J.; Llano-Restrepo, M. Chemical equilibria of multiple-reaction systems from reaction ensemble Monte Carlo simulation and a predictive equation of state: Combined hydrogenation of ethylene and propylene. Fluid Phase Equilibr. 2006, 242, 189–203. [Google Scholar] [CrossRef]
Figure 1.
Schematic diagram of in-situ Gasification Chemical Looping Combustion system. Reprinted with permission from references [16,17]. Copyright 2013 Elsevier.
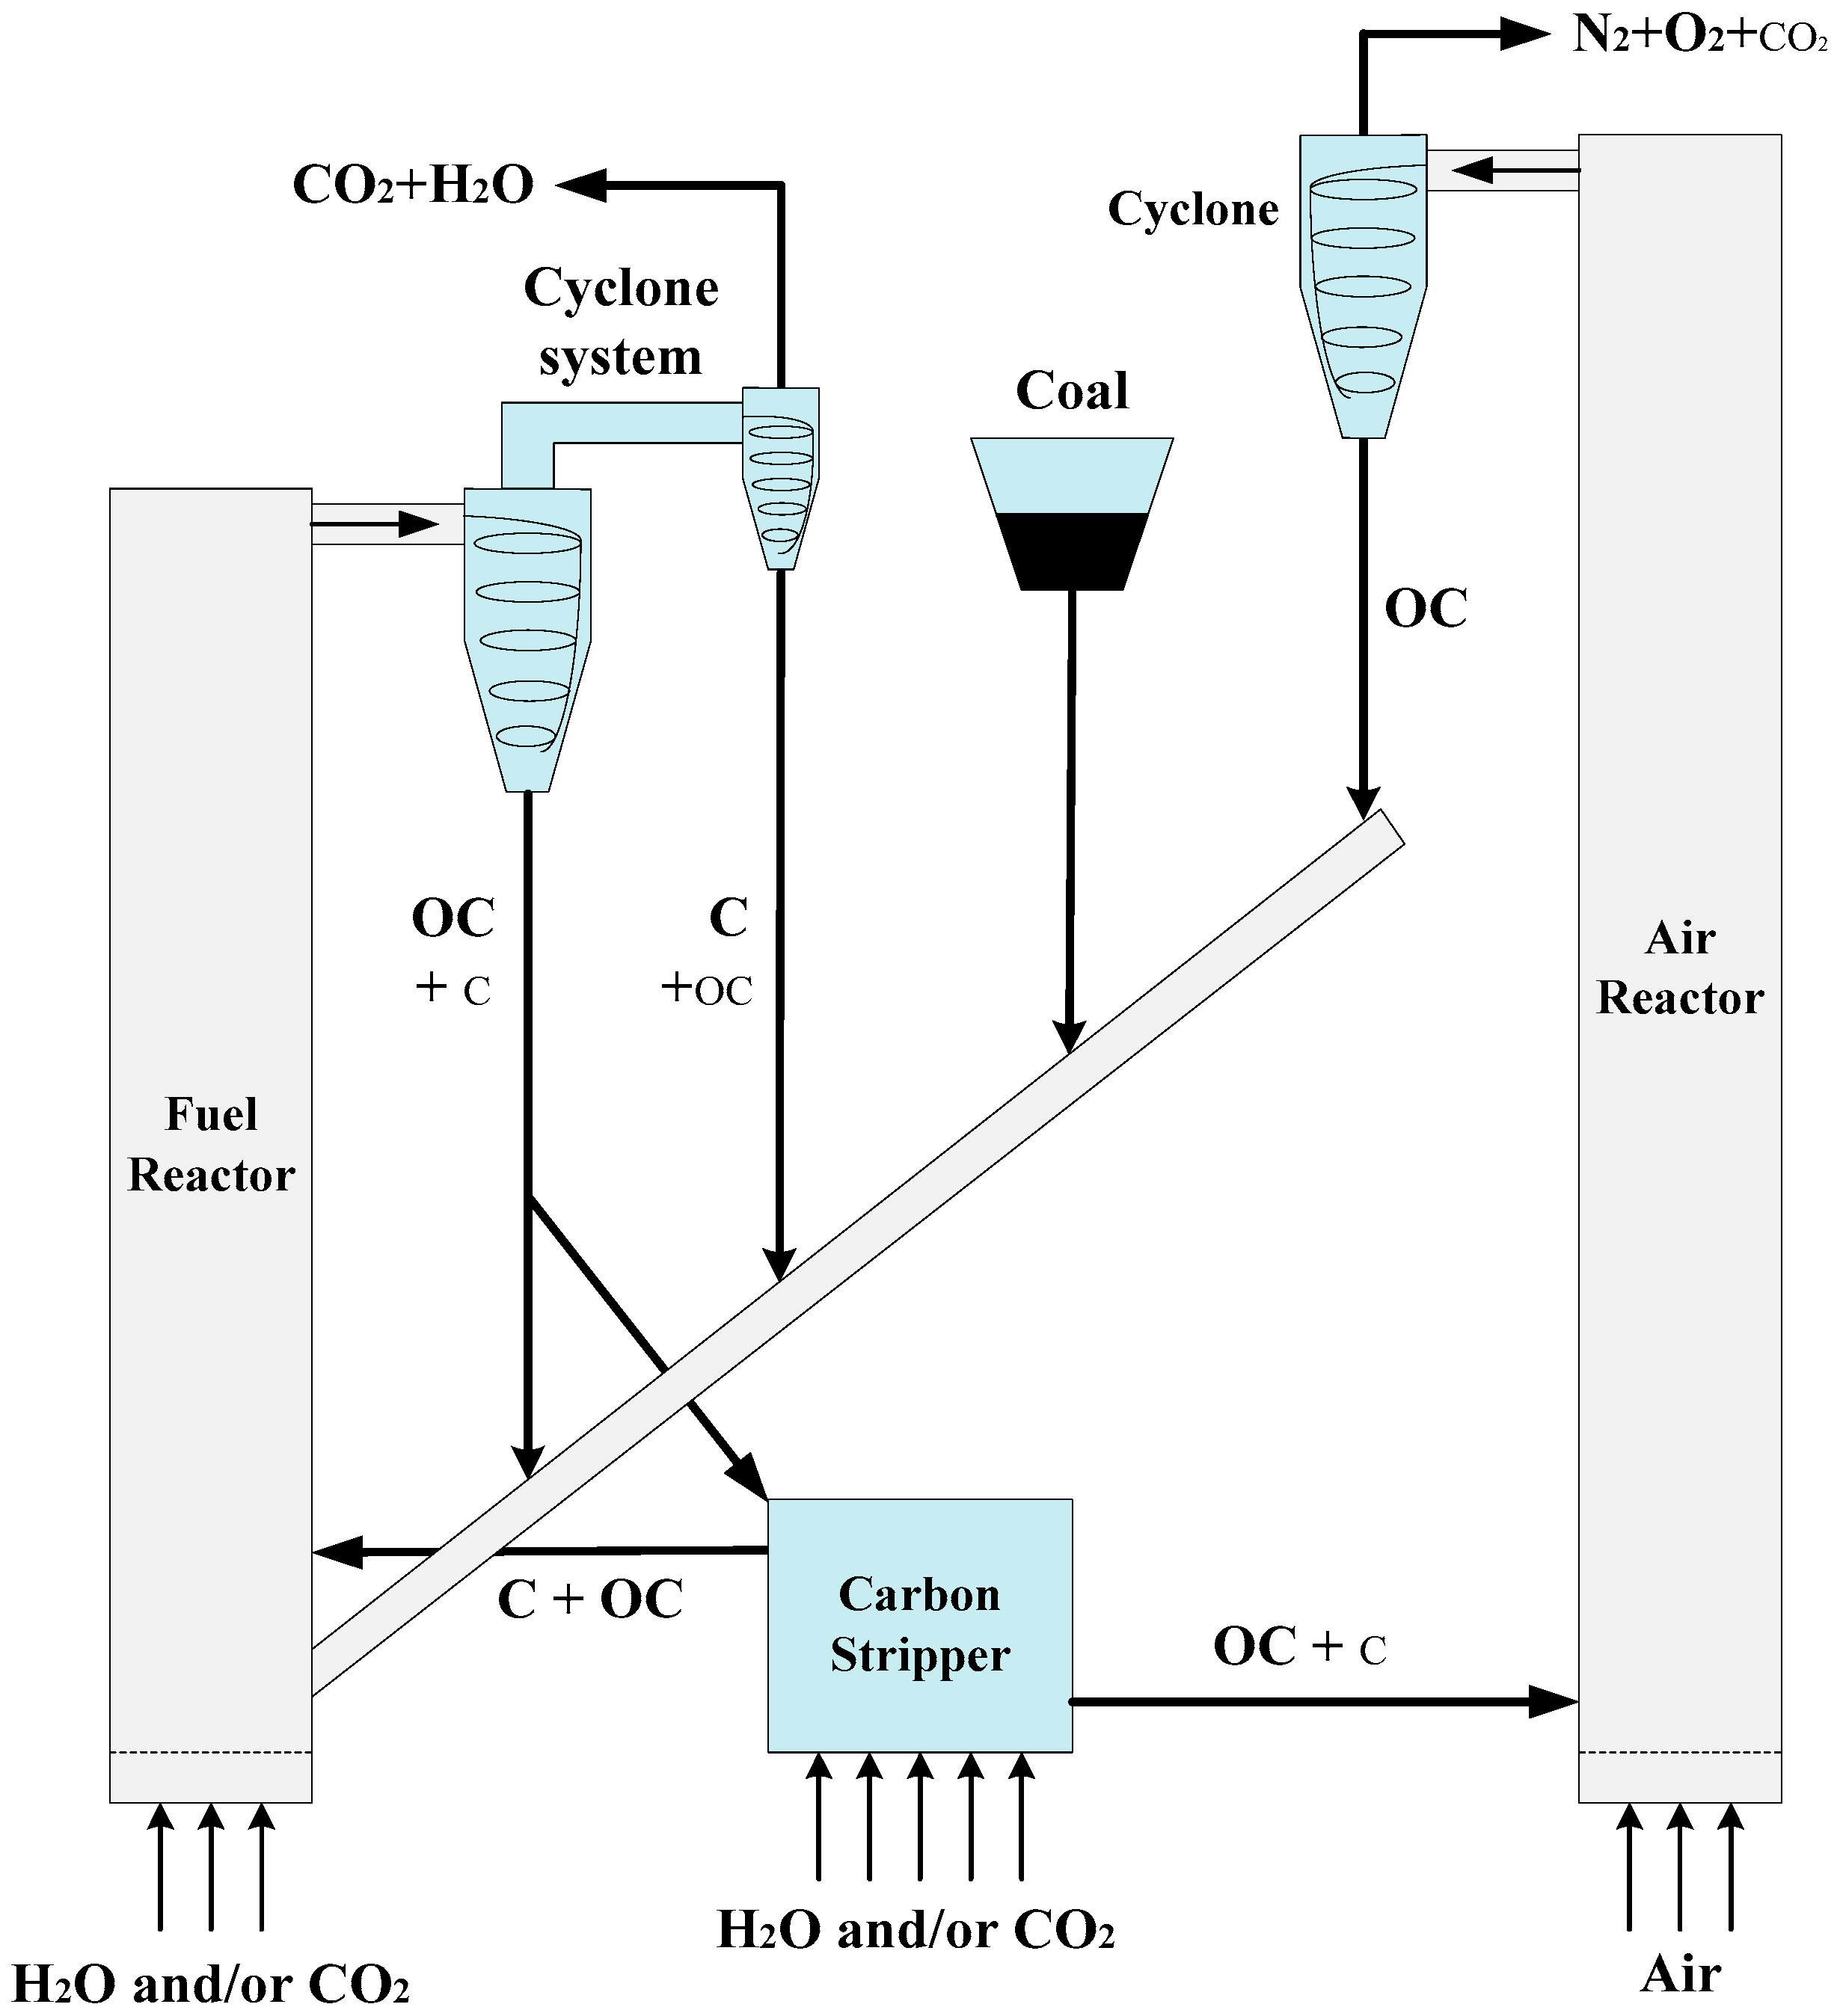
Figure 2.
Comparisons of axial pressure gradient profiles between the experiment and simulation.
Figure 3.
Comparison of dry basis gas concentrations at the fuel reactor outlet between the experiment and simulation.
Figure 3.
Comparison of dry basis gas concentrations at the fuel reactor outlet between the experiment and simulation.
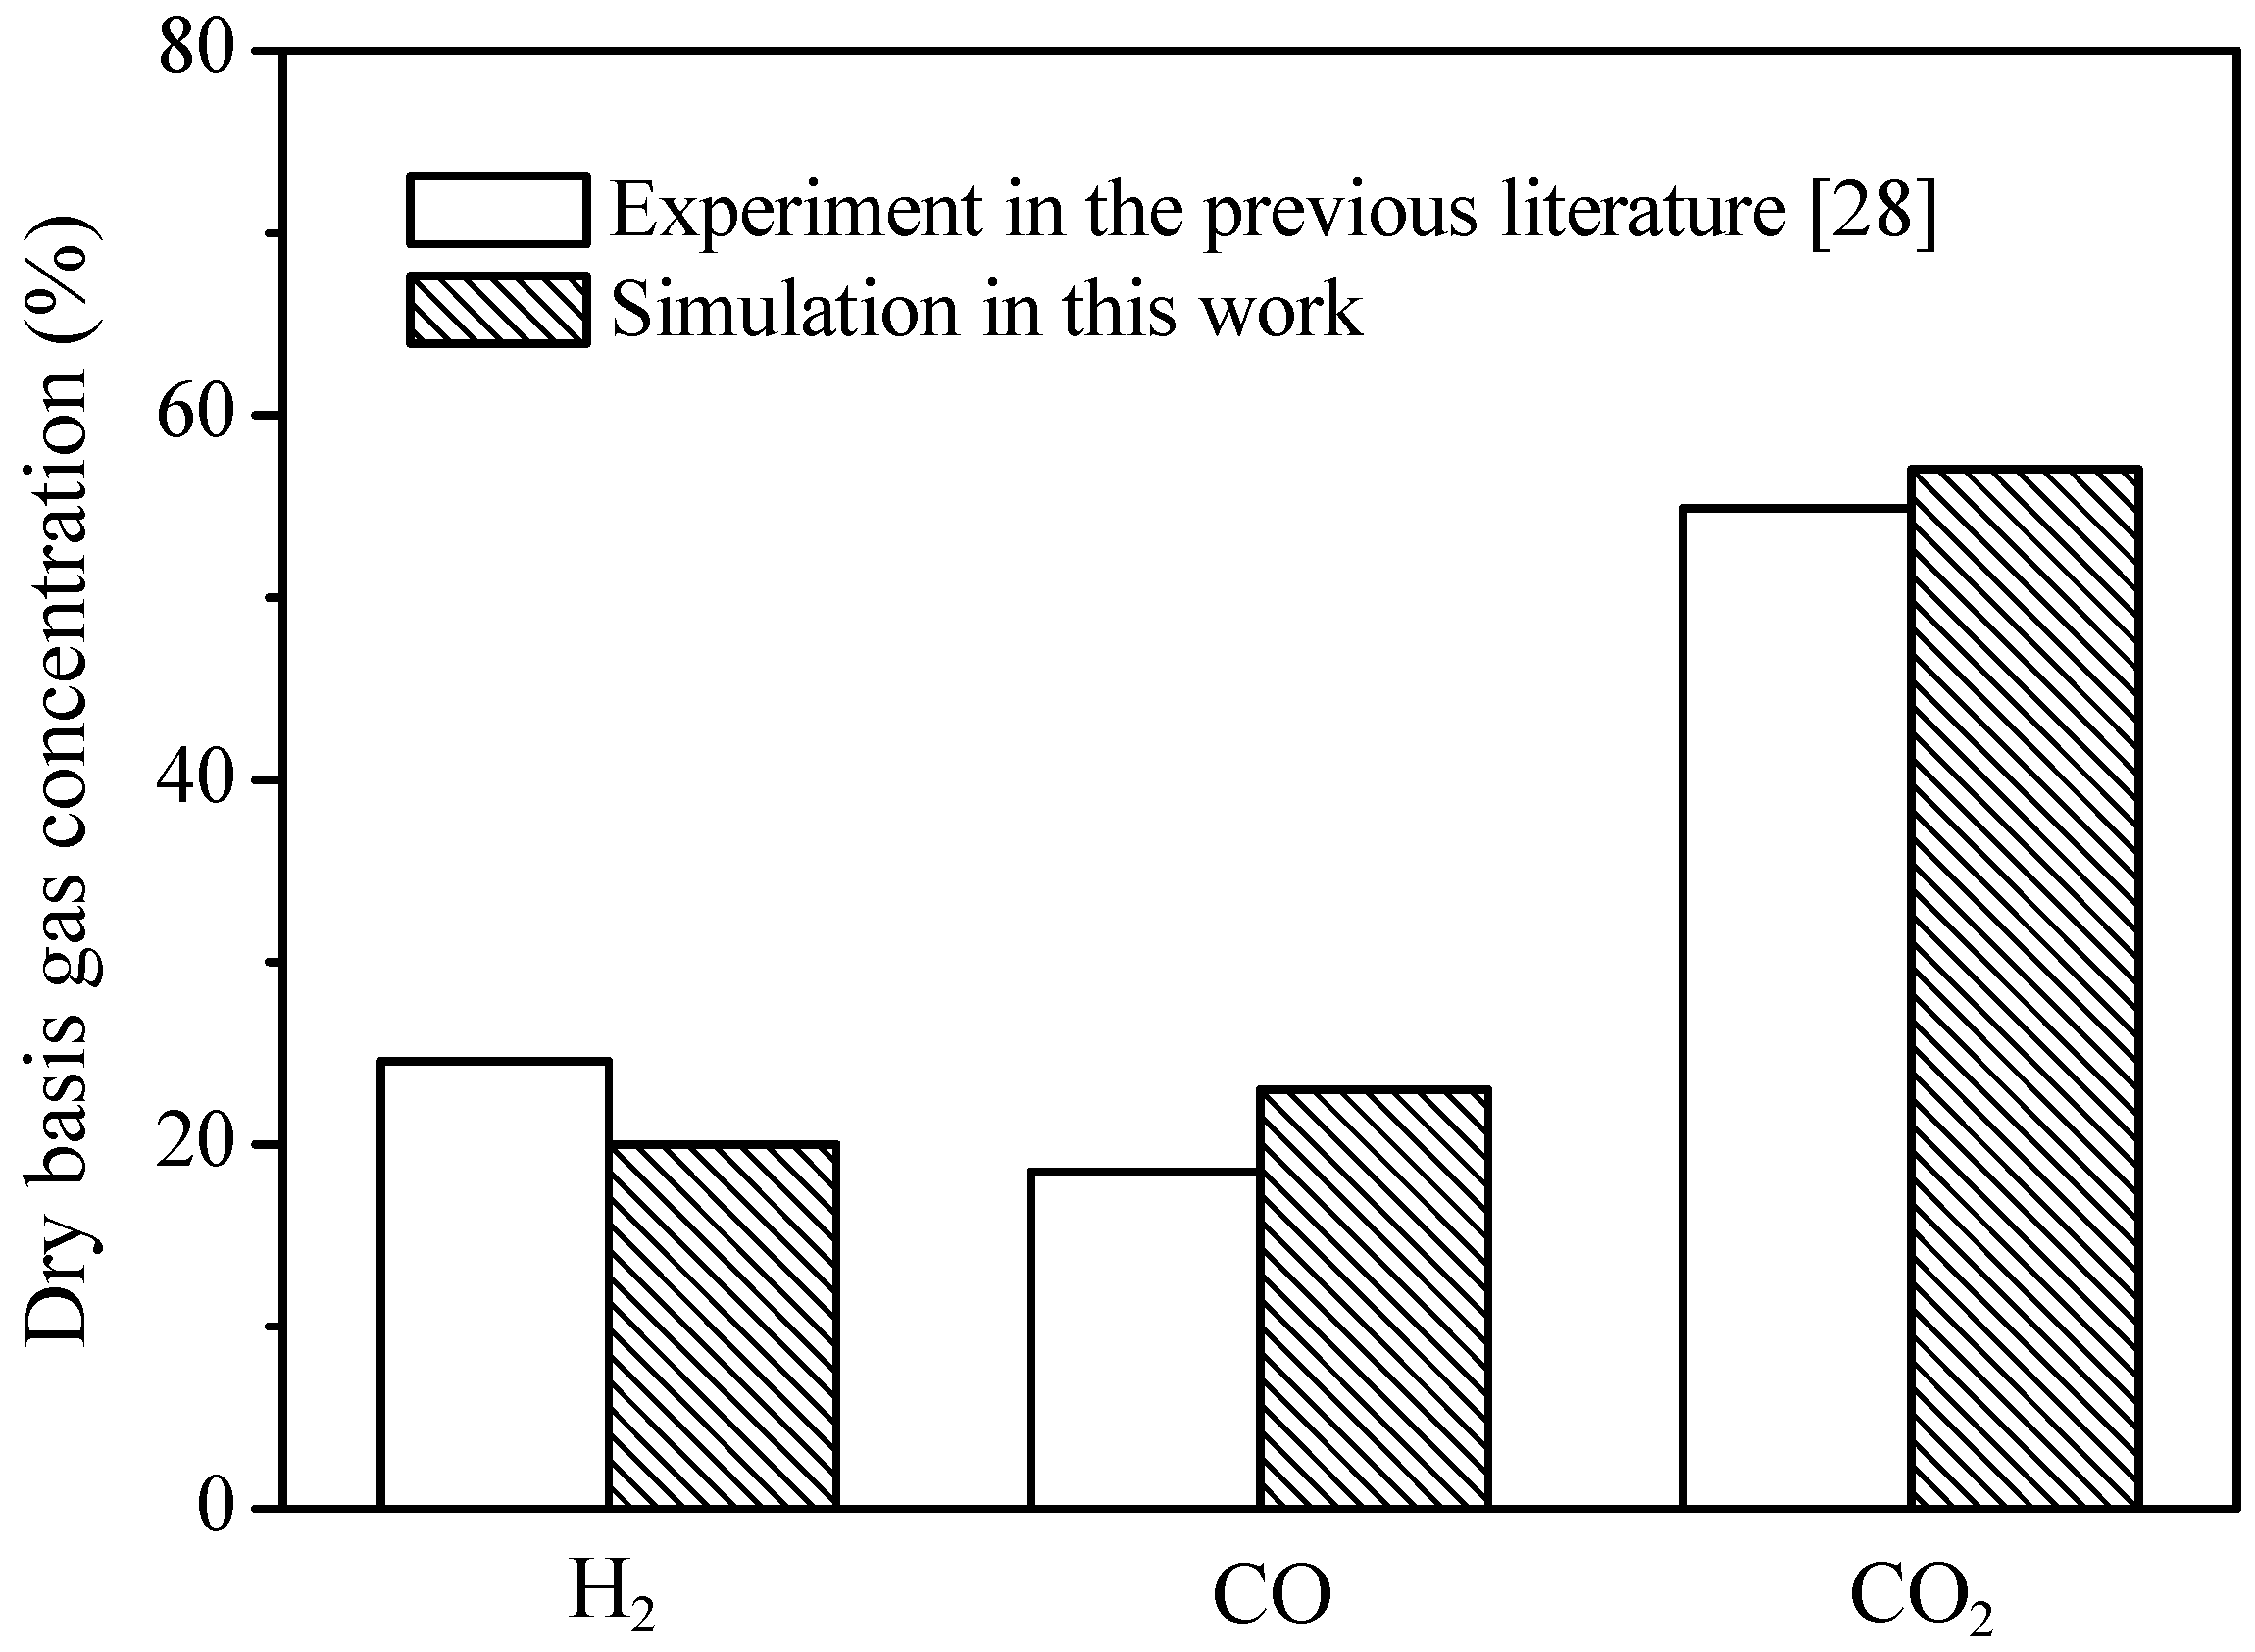
Figure 4.
Axial (x = 0) distributions of solids holdup and gas–solid components along the bed height at 70 s with the reference condition: Gp = 100 kg/m2·s, Qh = 7.5 m3/h, P0 = 0.55 MPa. (a) solids holdup; (b) mass fraction of char in solid phase; (c–f) molar fractions of gas species in gas phase.
Figure 4.
Axial (x = 0) distributions of solids holdup and gas–solid components along the bed height at 70 s with the reference condition: Gp = 100 kg/m2·s, Qh = 7.5 m3/h, P0 = 0.55 MPa. (a) solids holdup; (b) mass fraction of char in solid phase; (c–f) molar fractions of gas species in gas phase.

Figure 5.
Mean solids holdups in different heights as a function of solids flux.
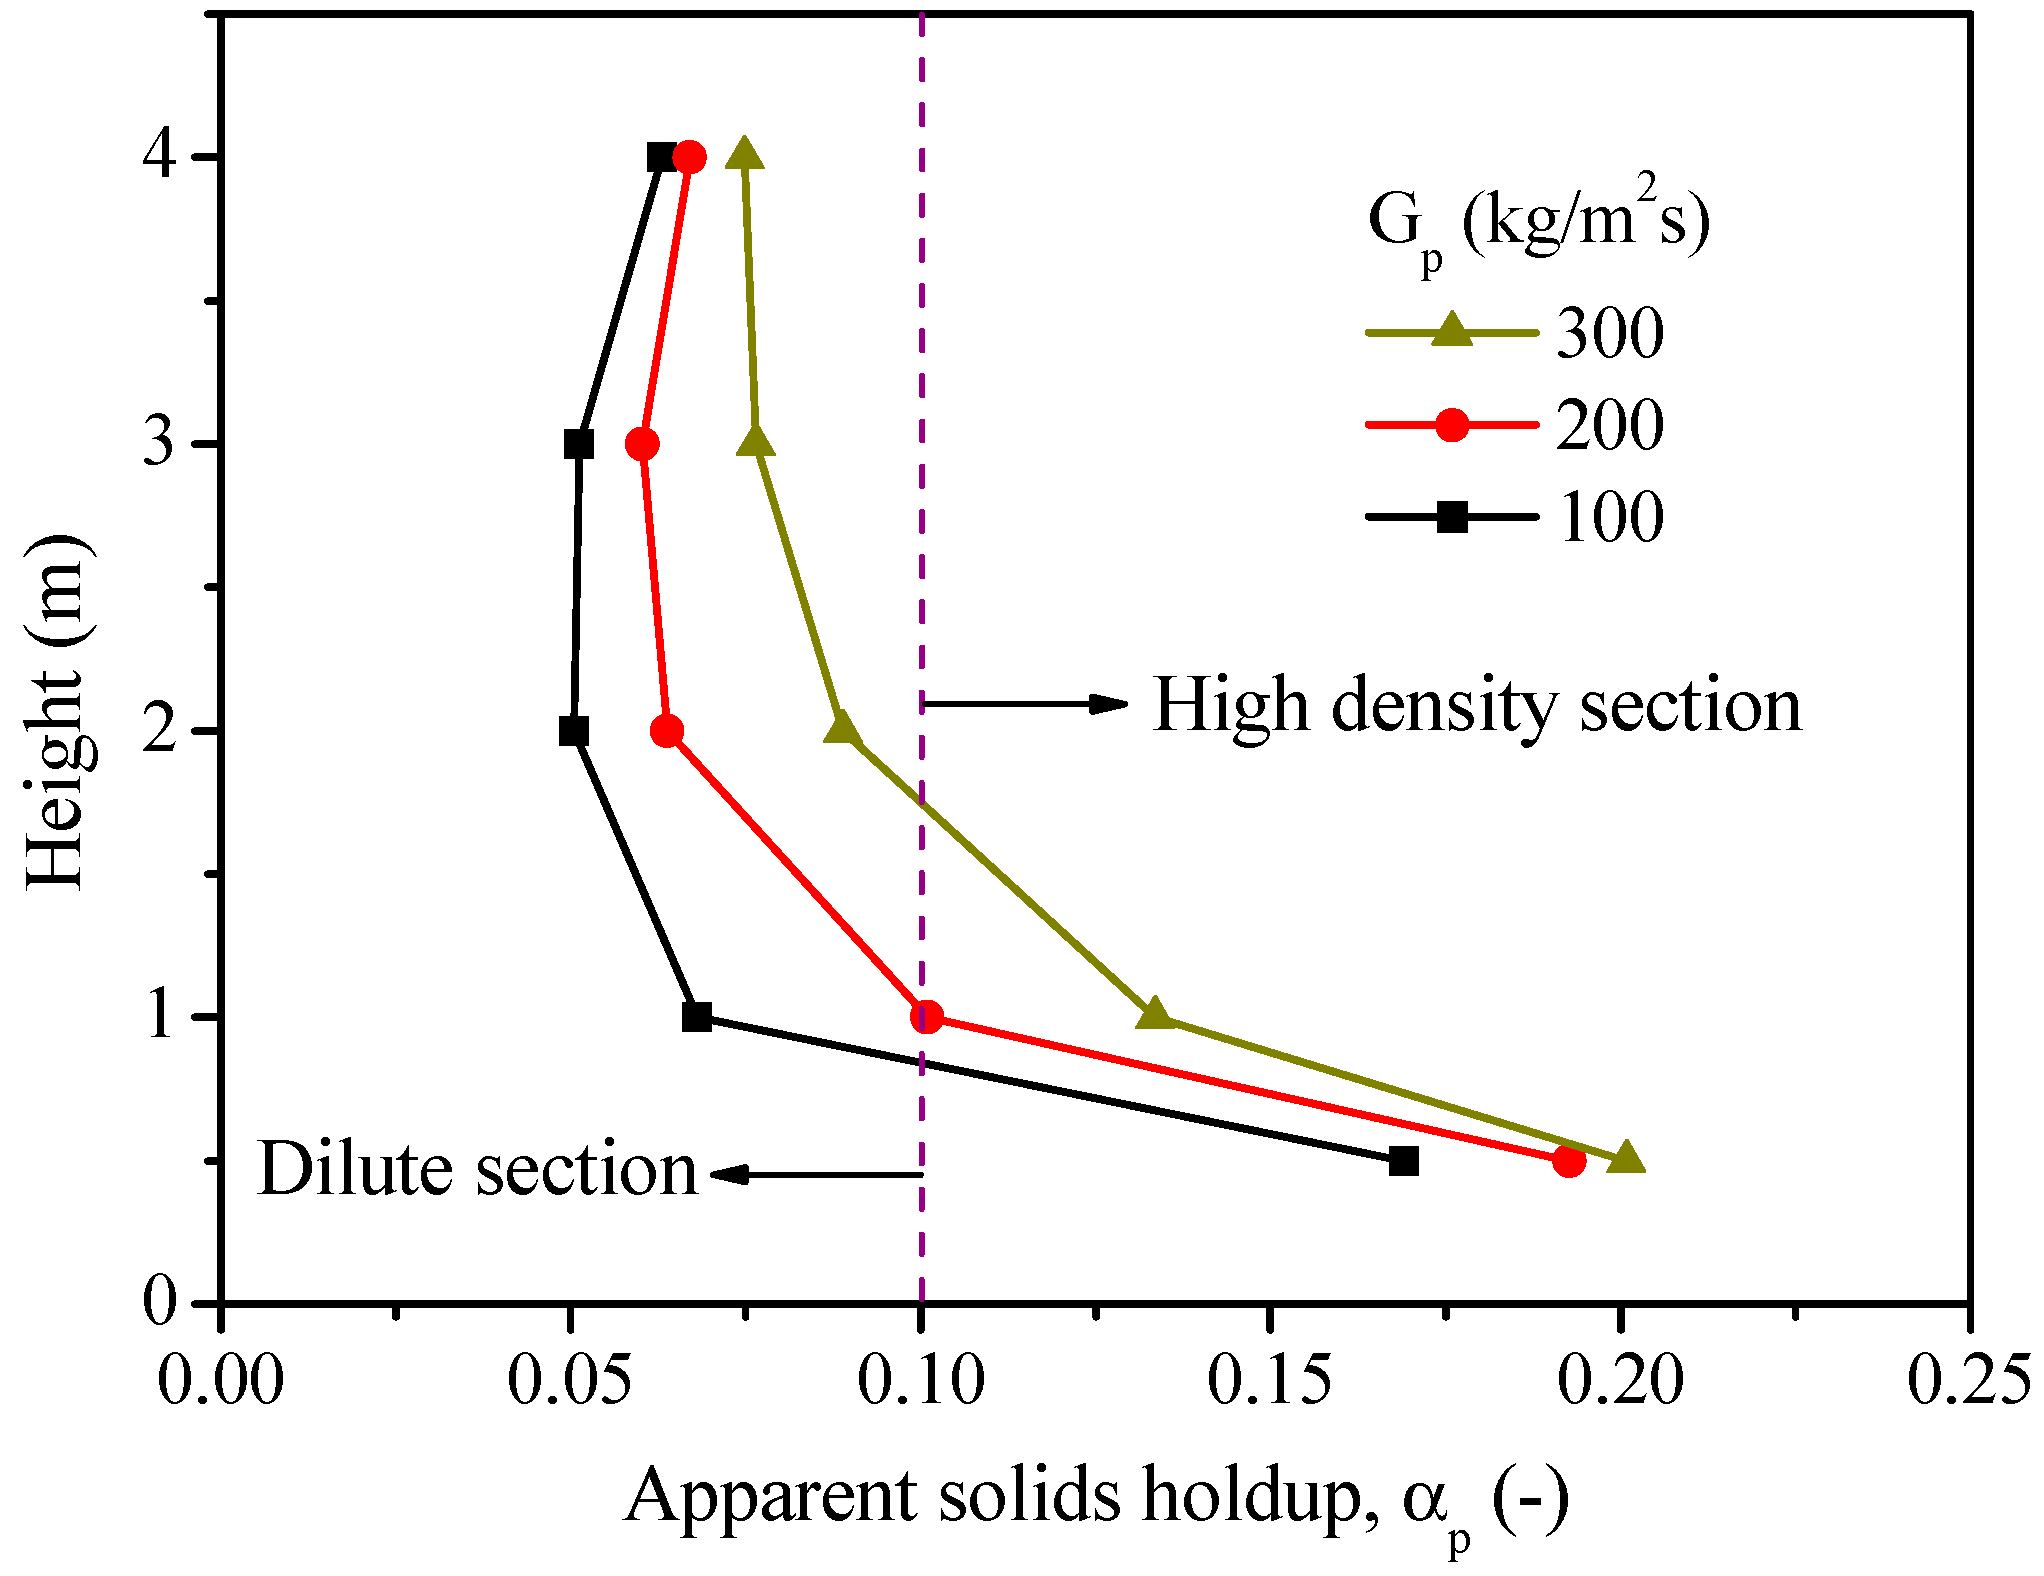
Figure 6.
Effect of solids flux on the CO2 concentration (dry basis) at the outlet of the fuel reactor.
Figure 6.
Effect of solids flux on the CO2 concentration (dry basis) at the outlet of the fuel reactor.
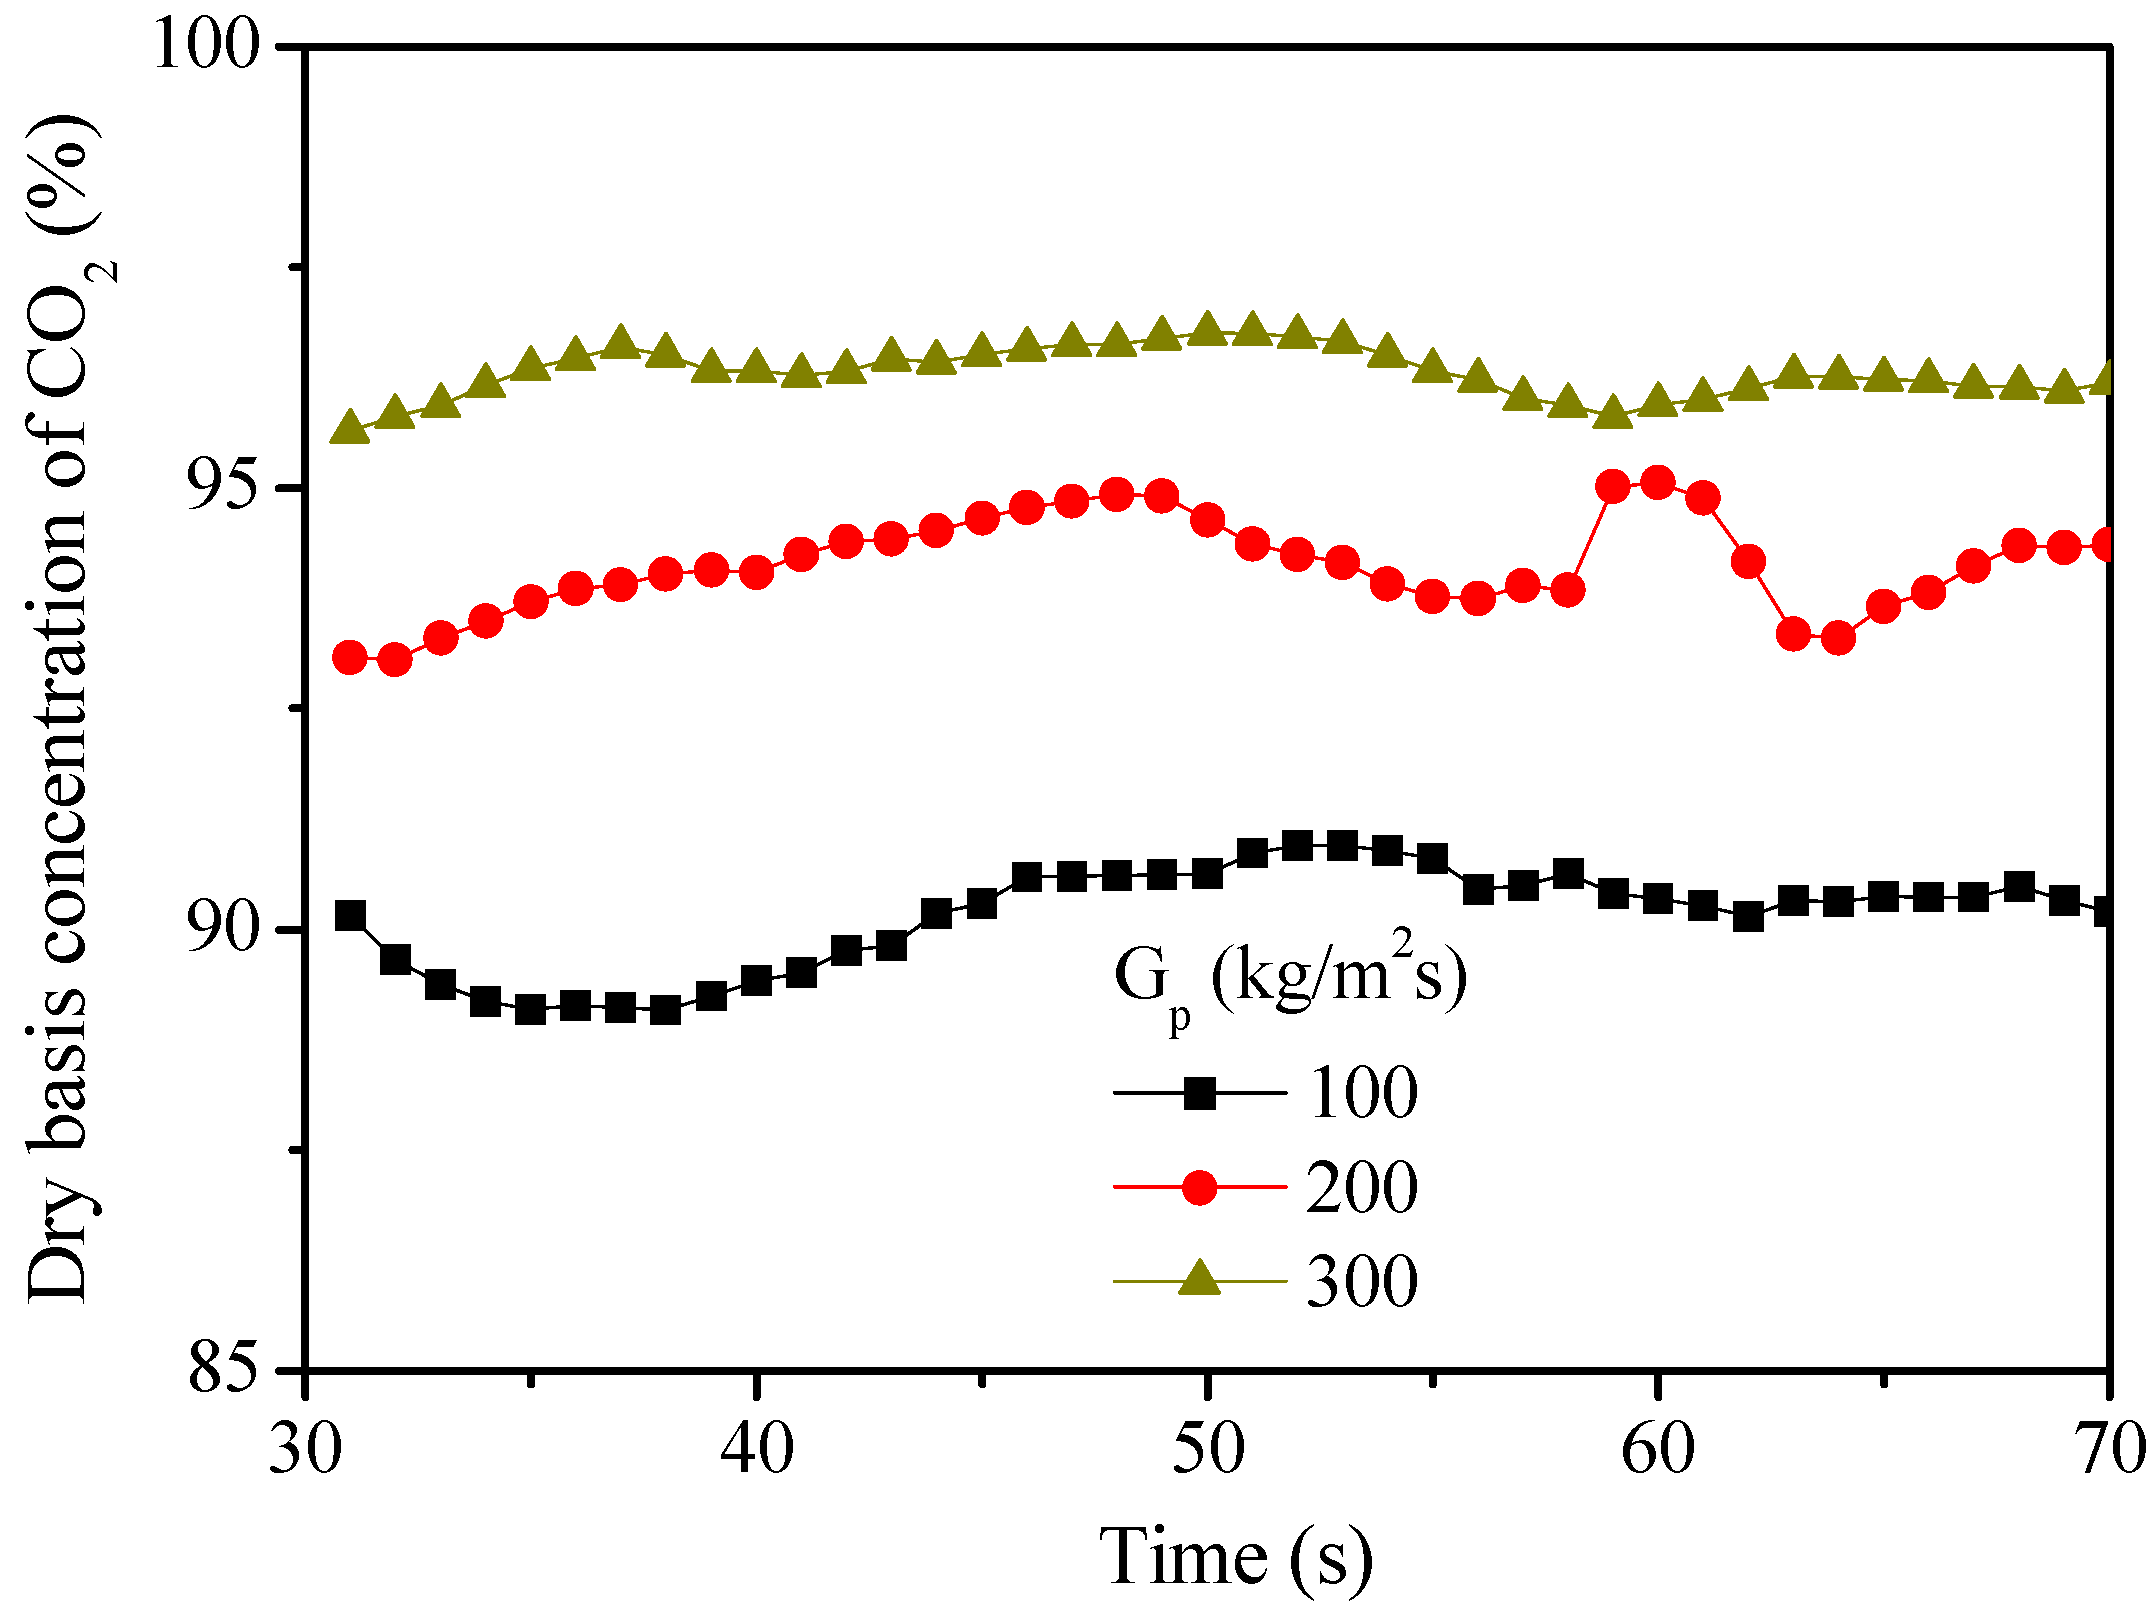
Figure 7.
Distribution of mean axial solids velocities as a function of height with different solids fluxes.
Figure 7.
Distribution of mean axial solids velocities as a function of height with different solids fluxes.
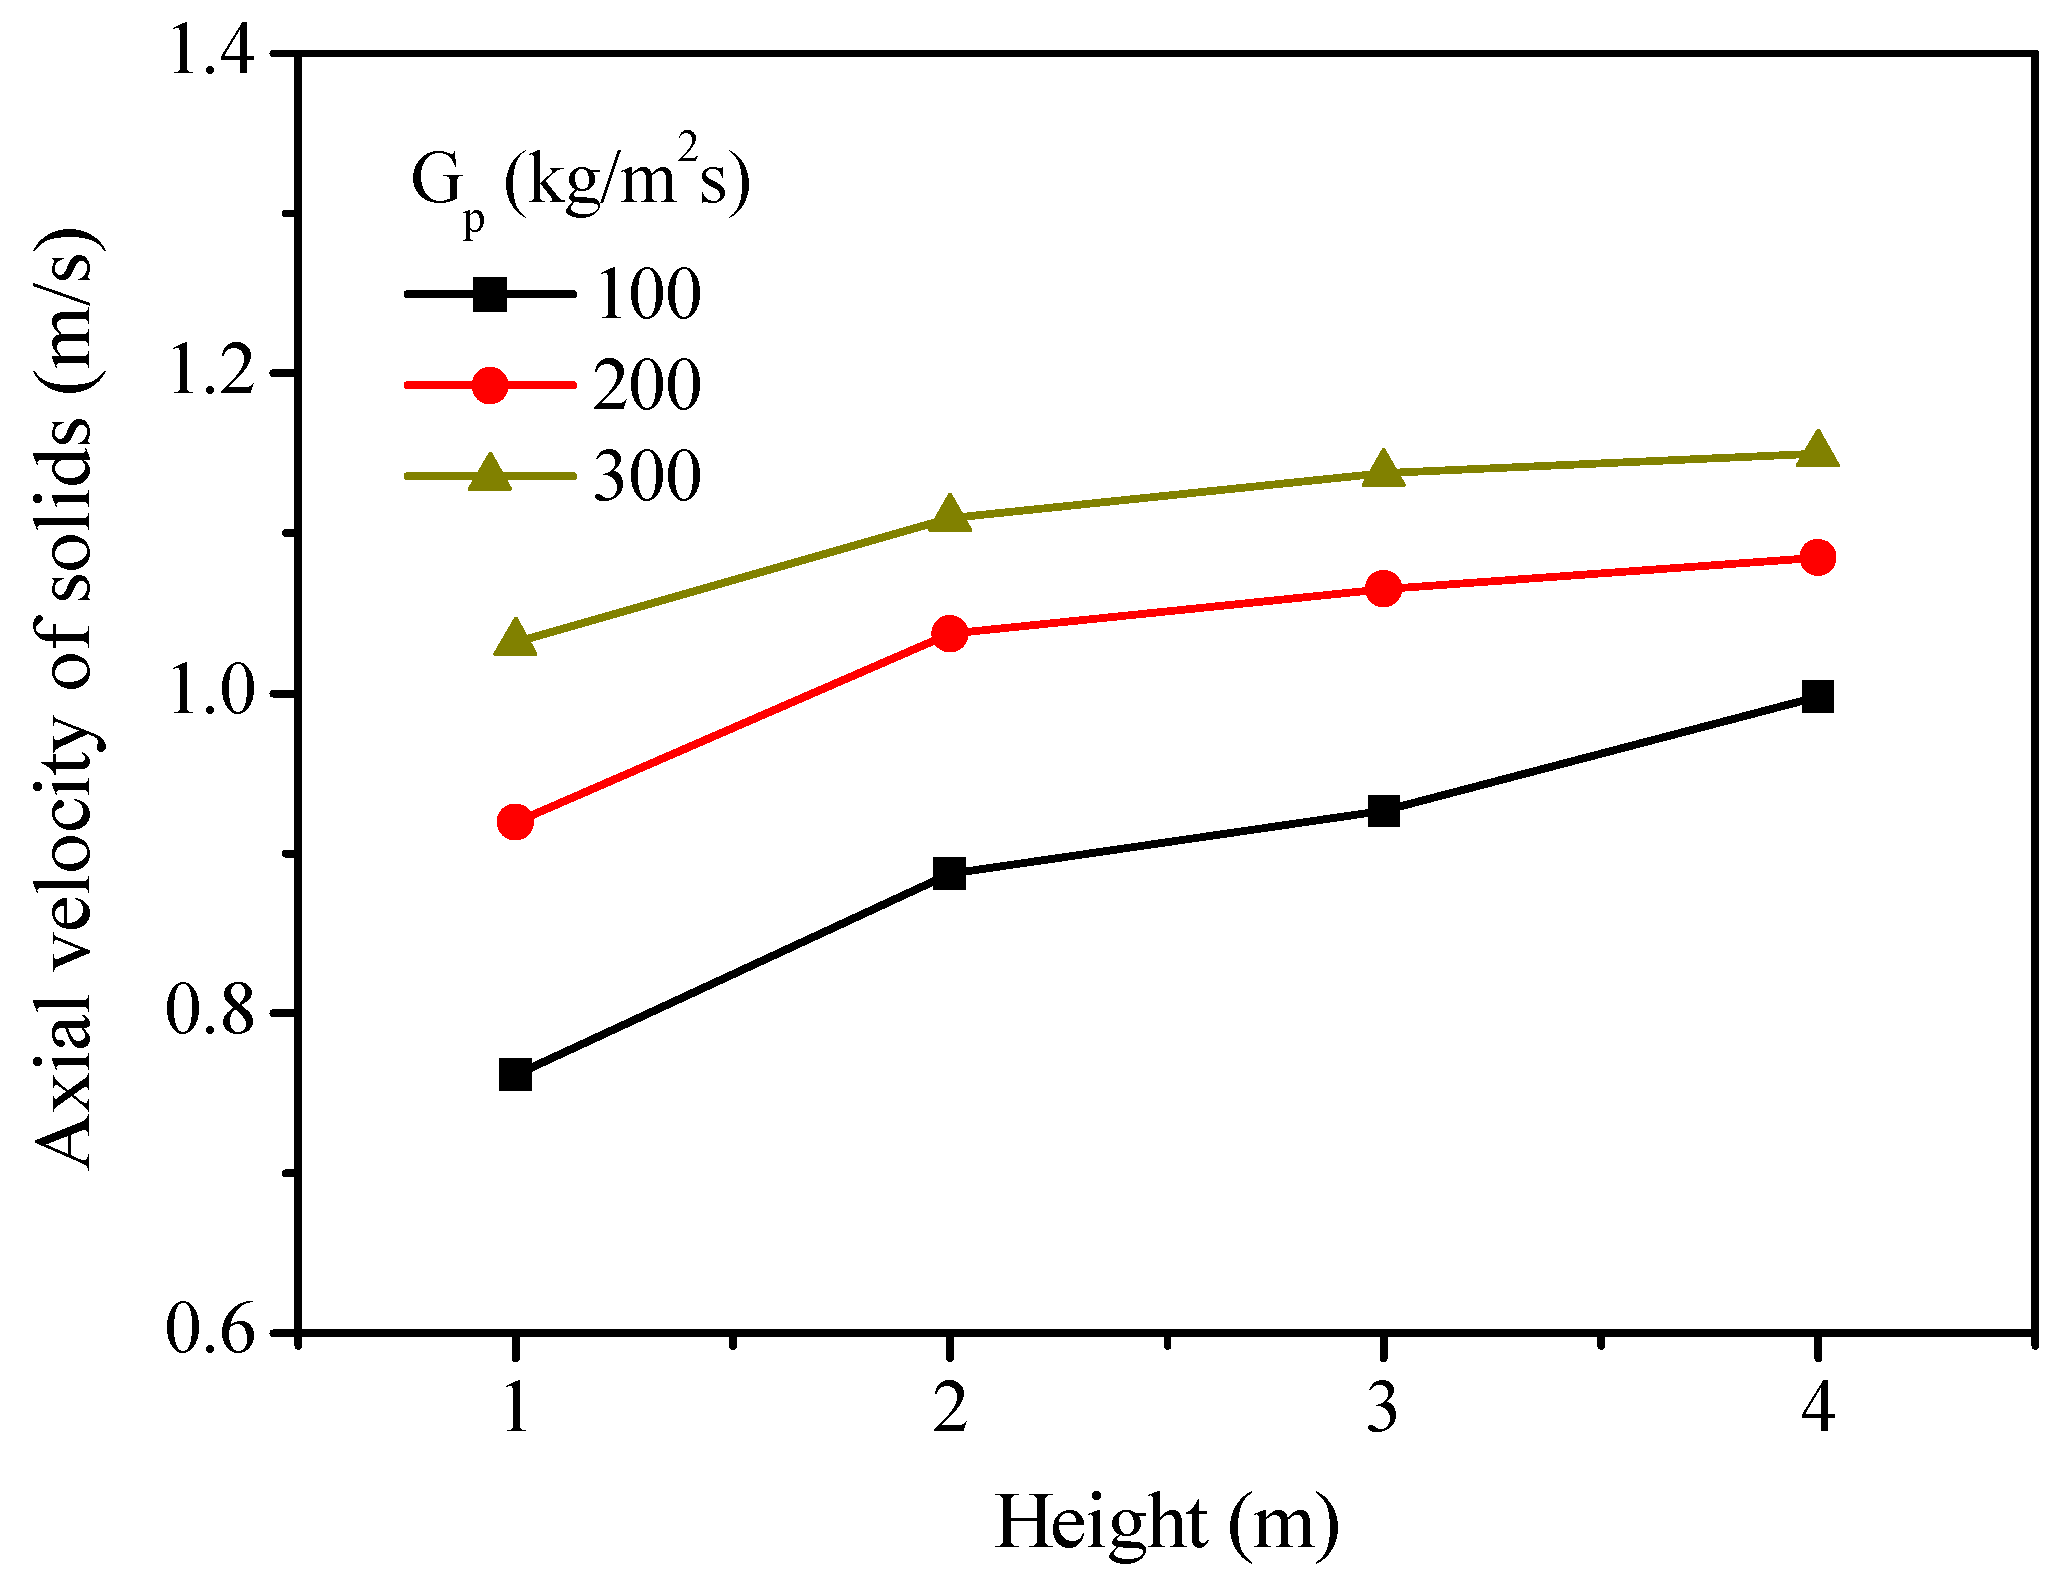
Figure 8.
Effect of solids flux on the single-loop conversion of carbon in the fuel reactor.
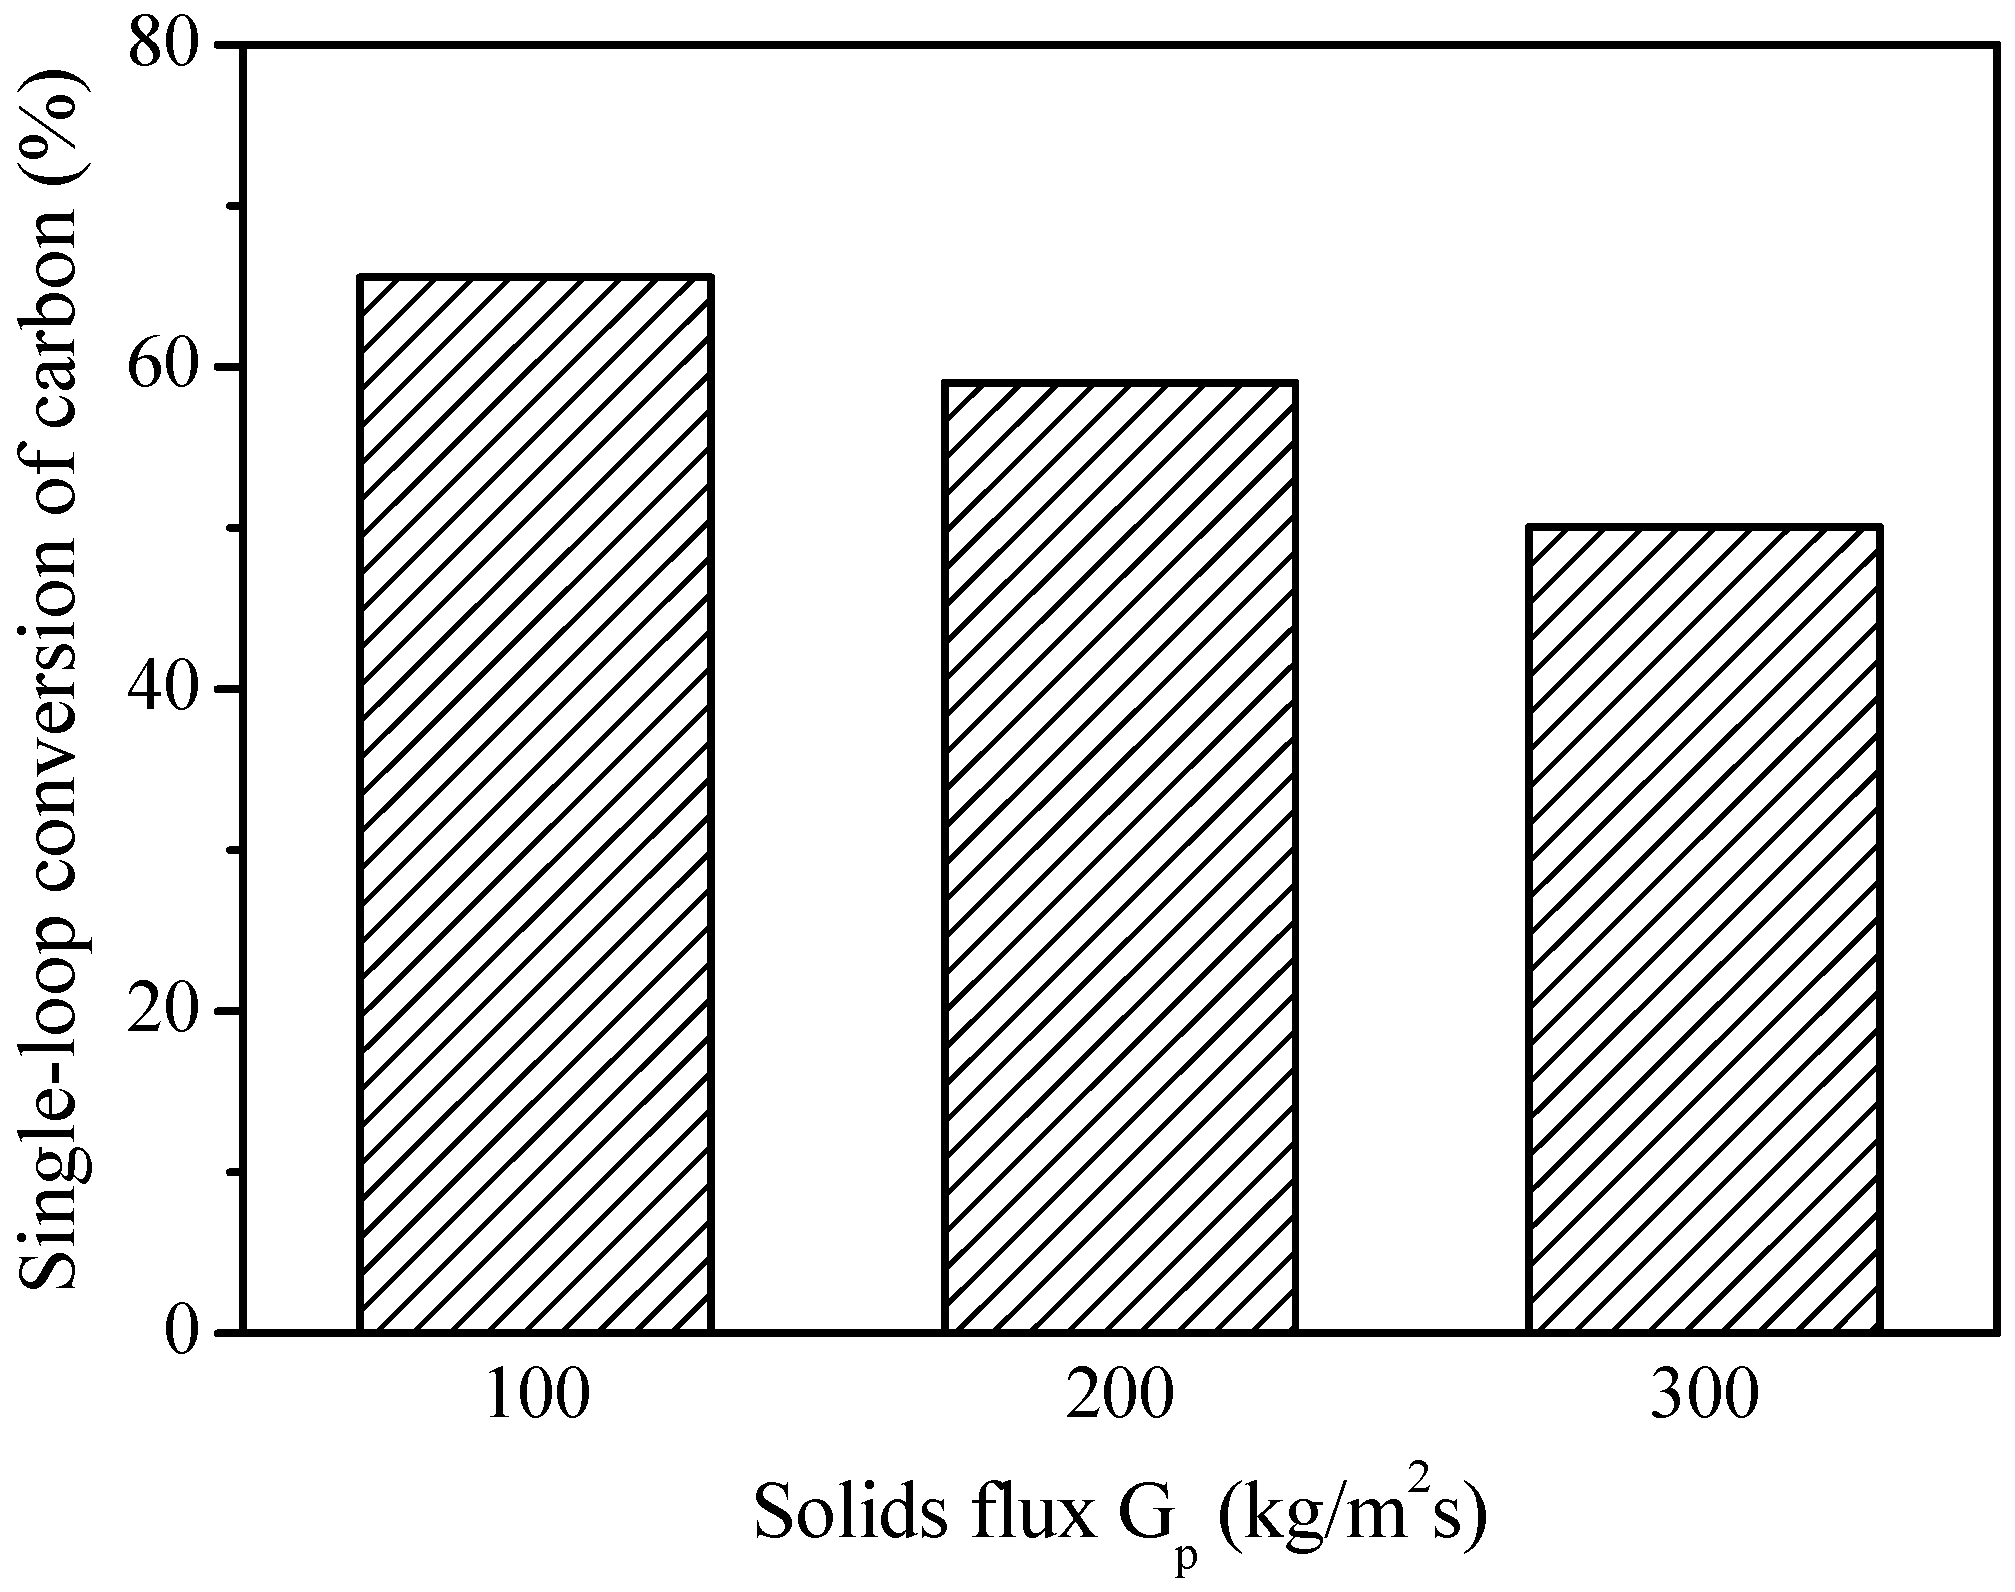
Figure 9.
Mean solids holdups as a function of steam flow in different heights.
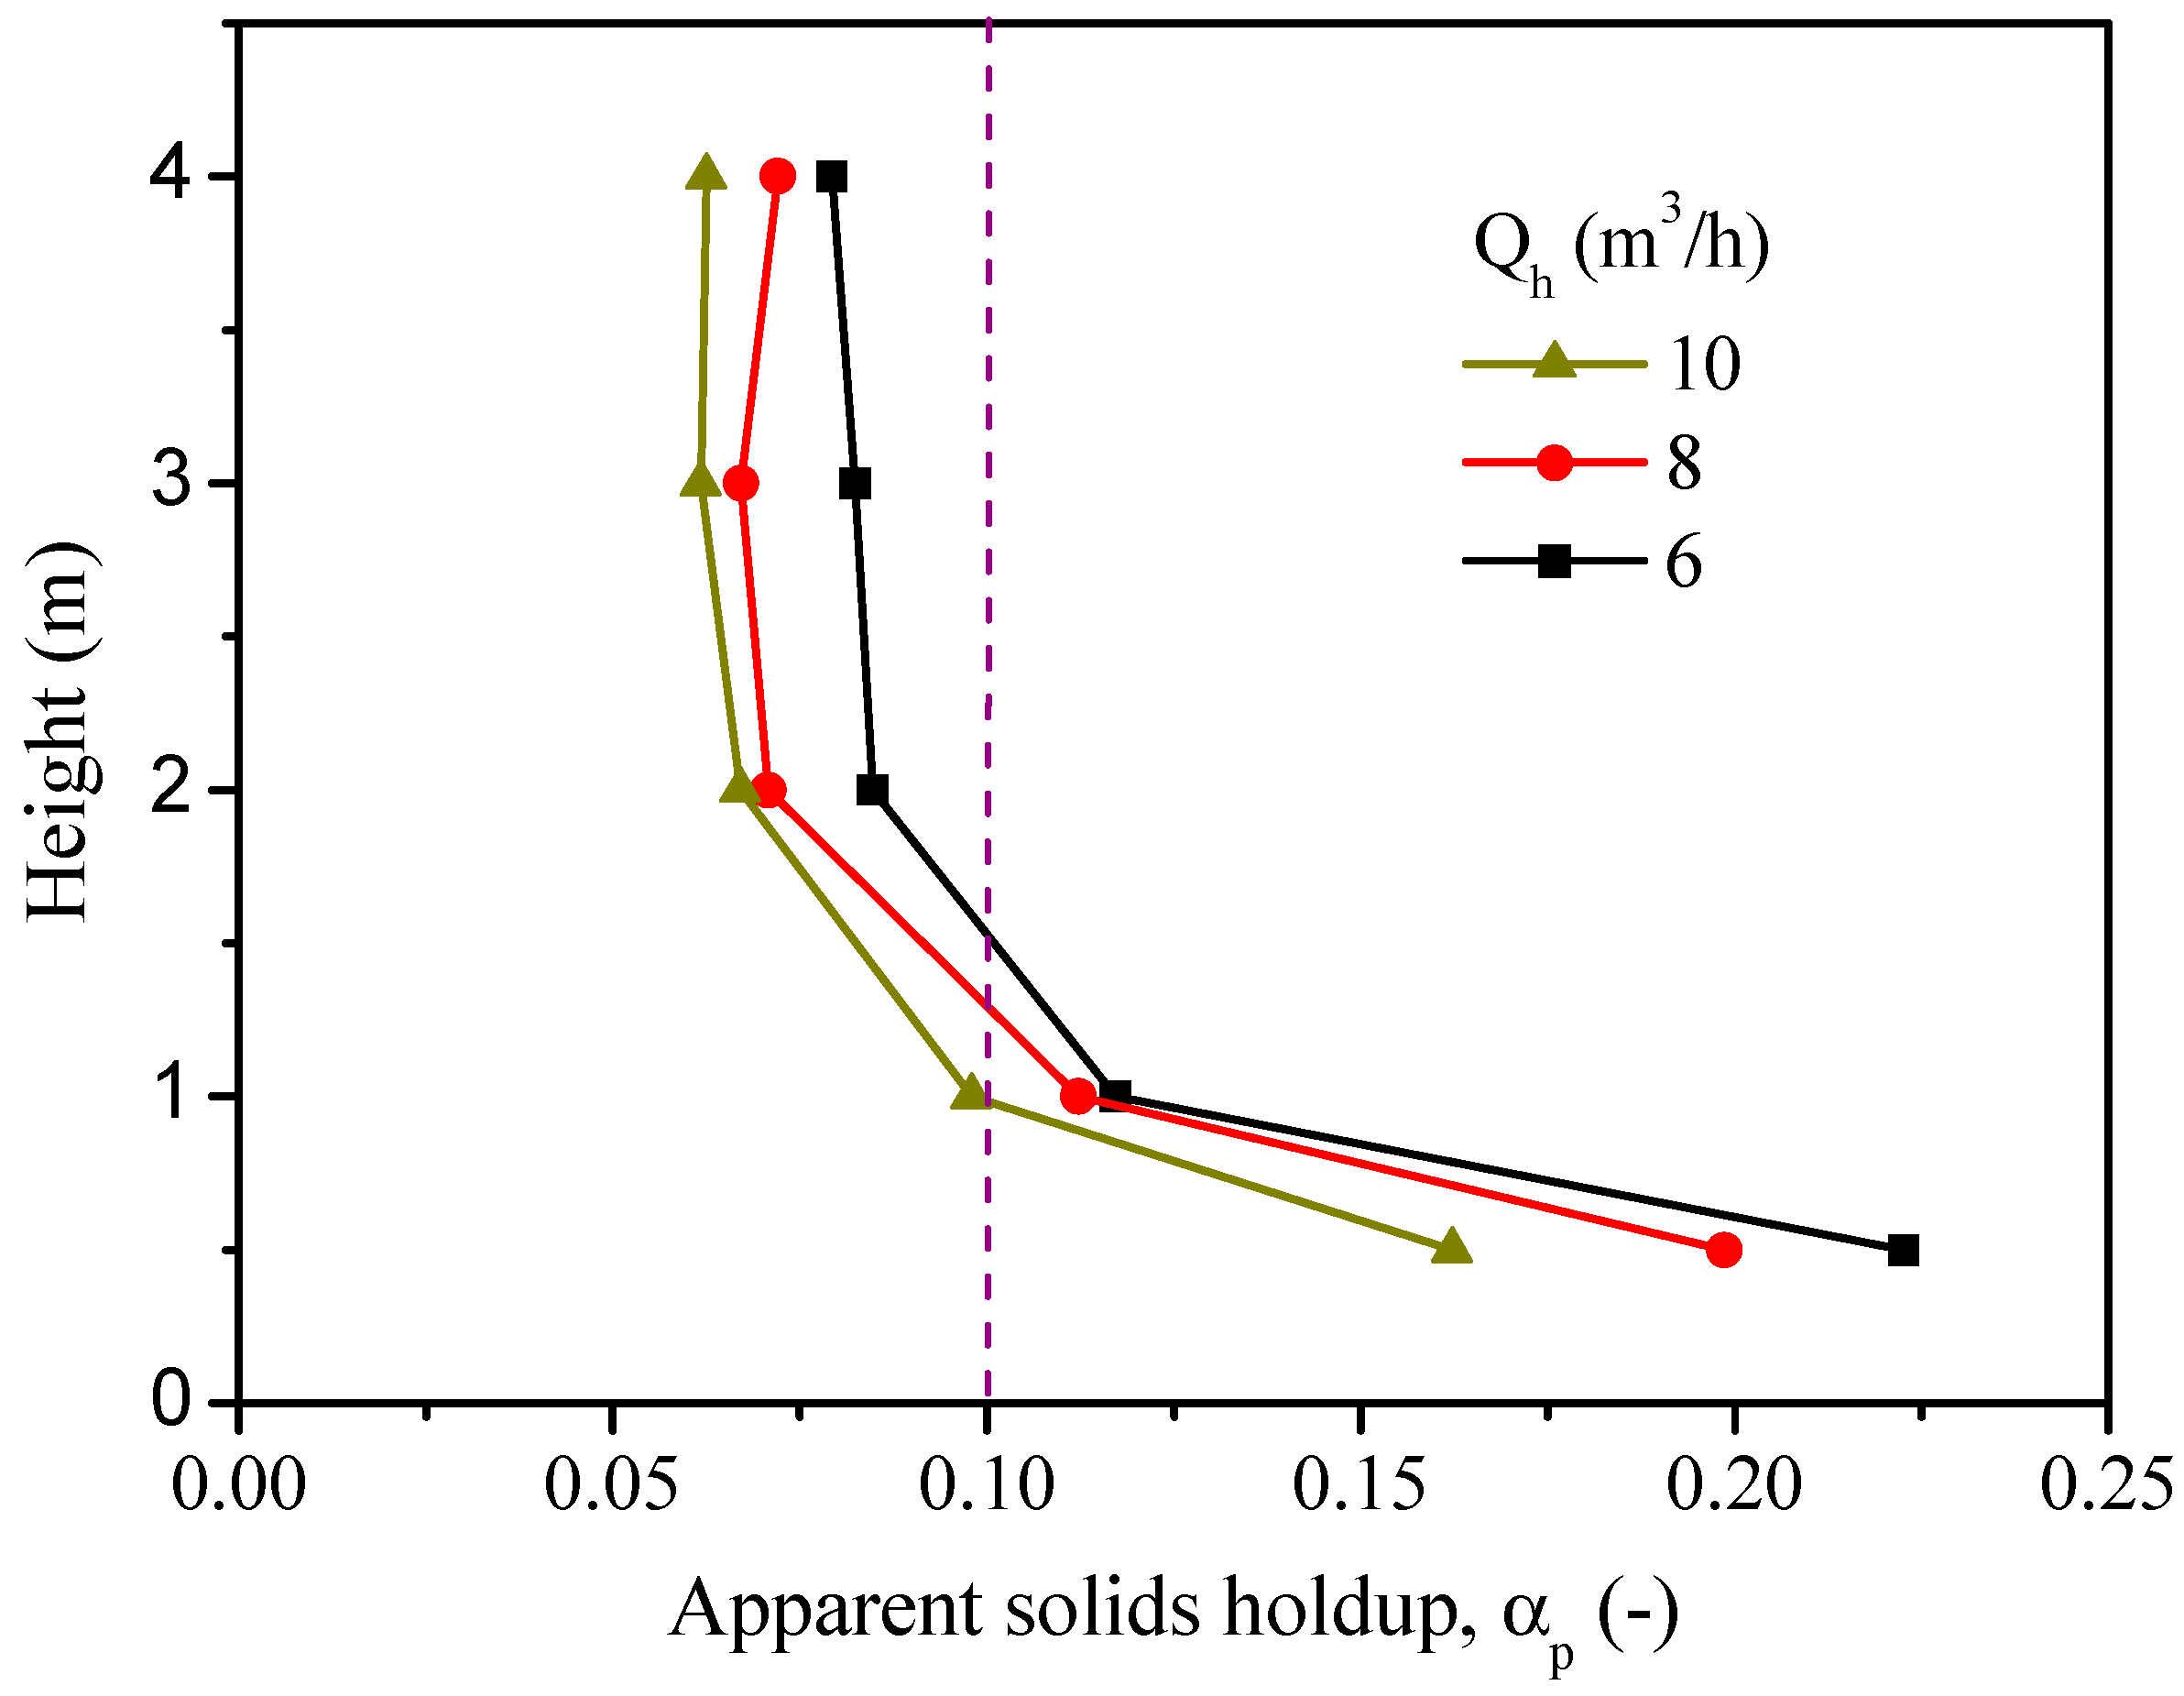
Figure 10.
Solids axial velocities in different steam flow as a function of height.
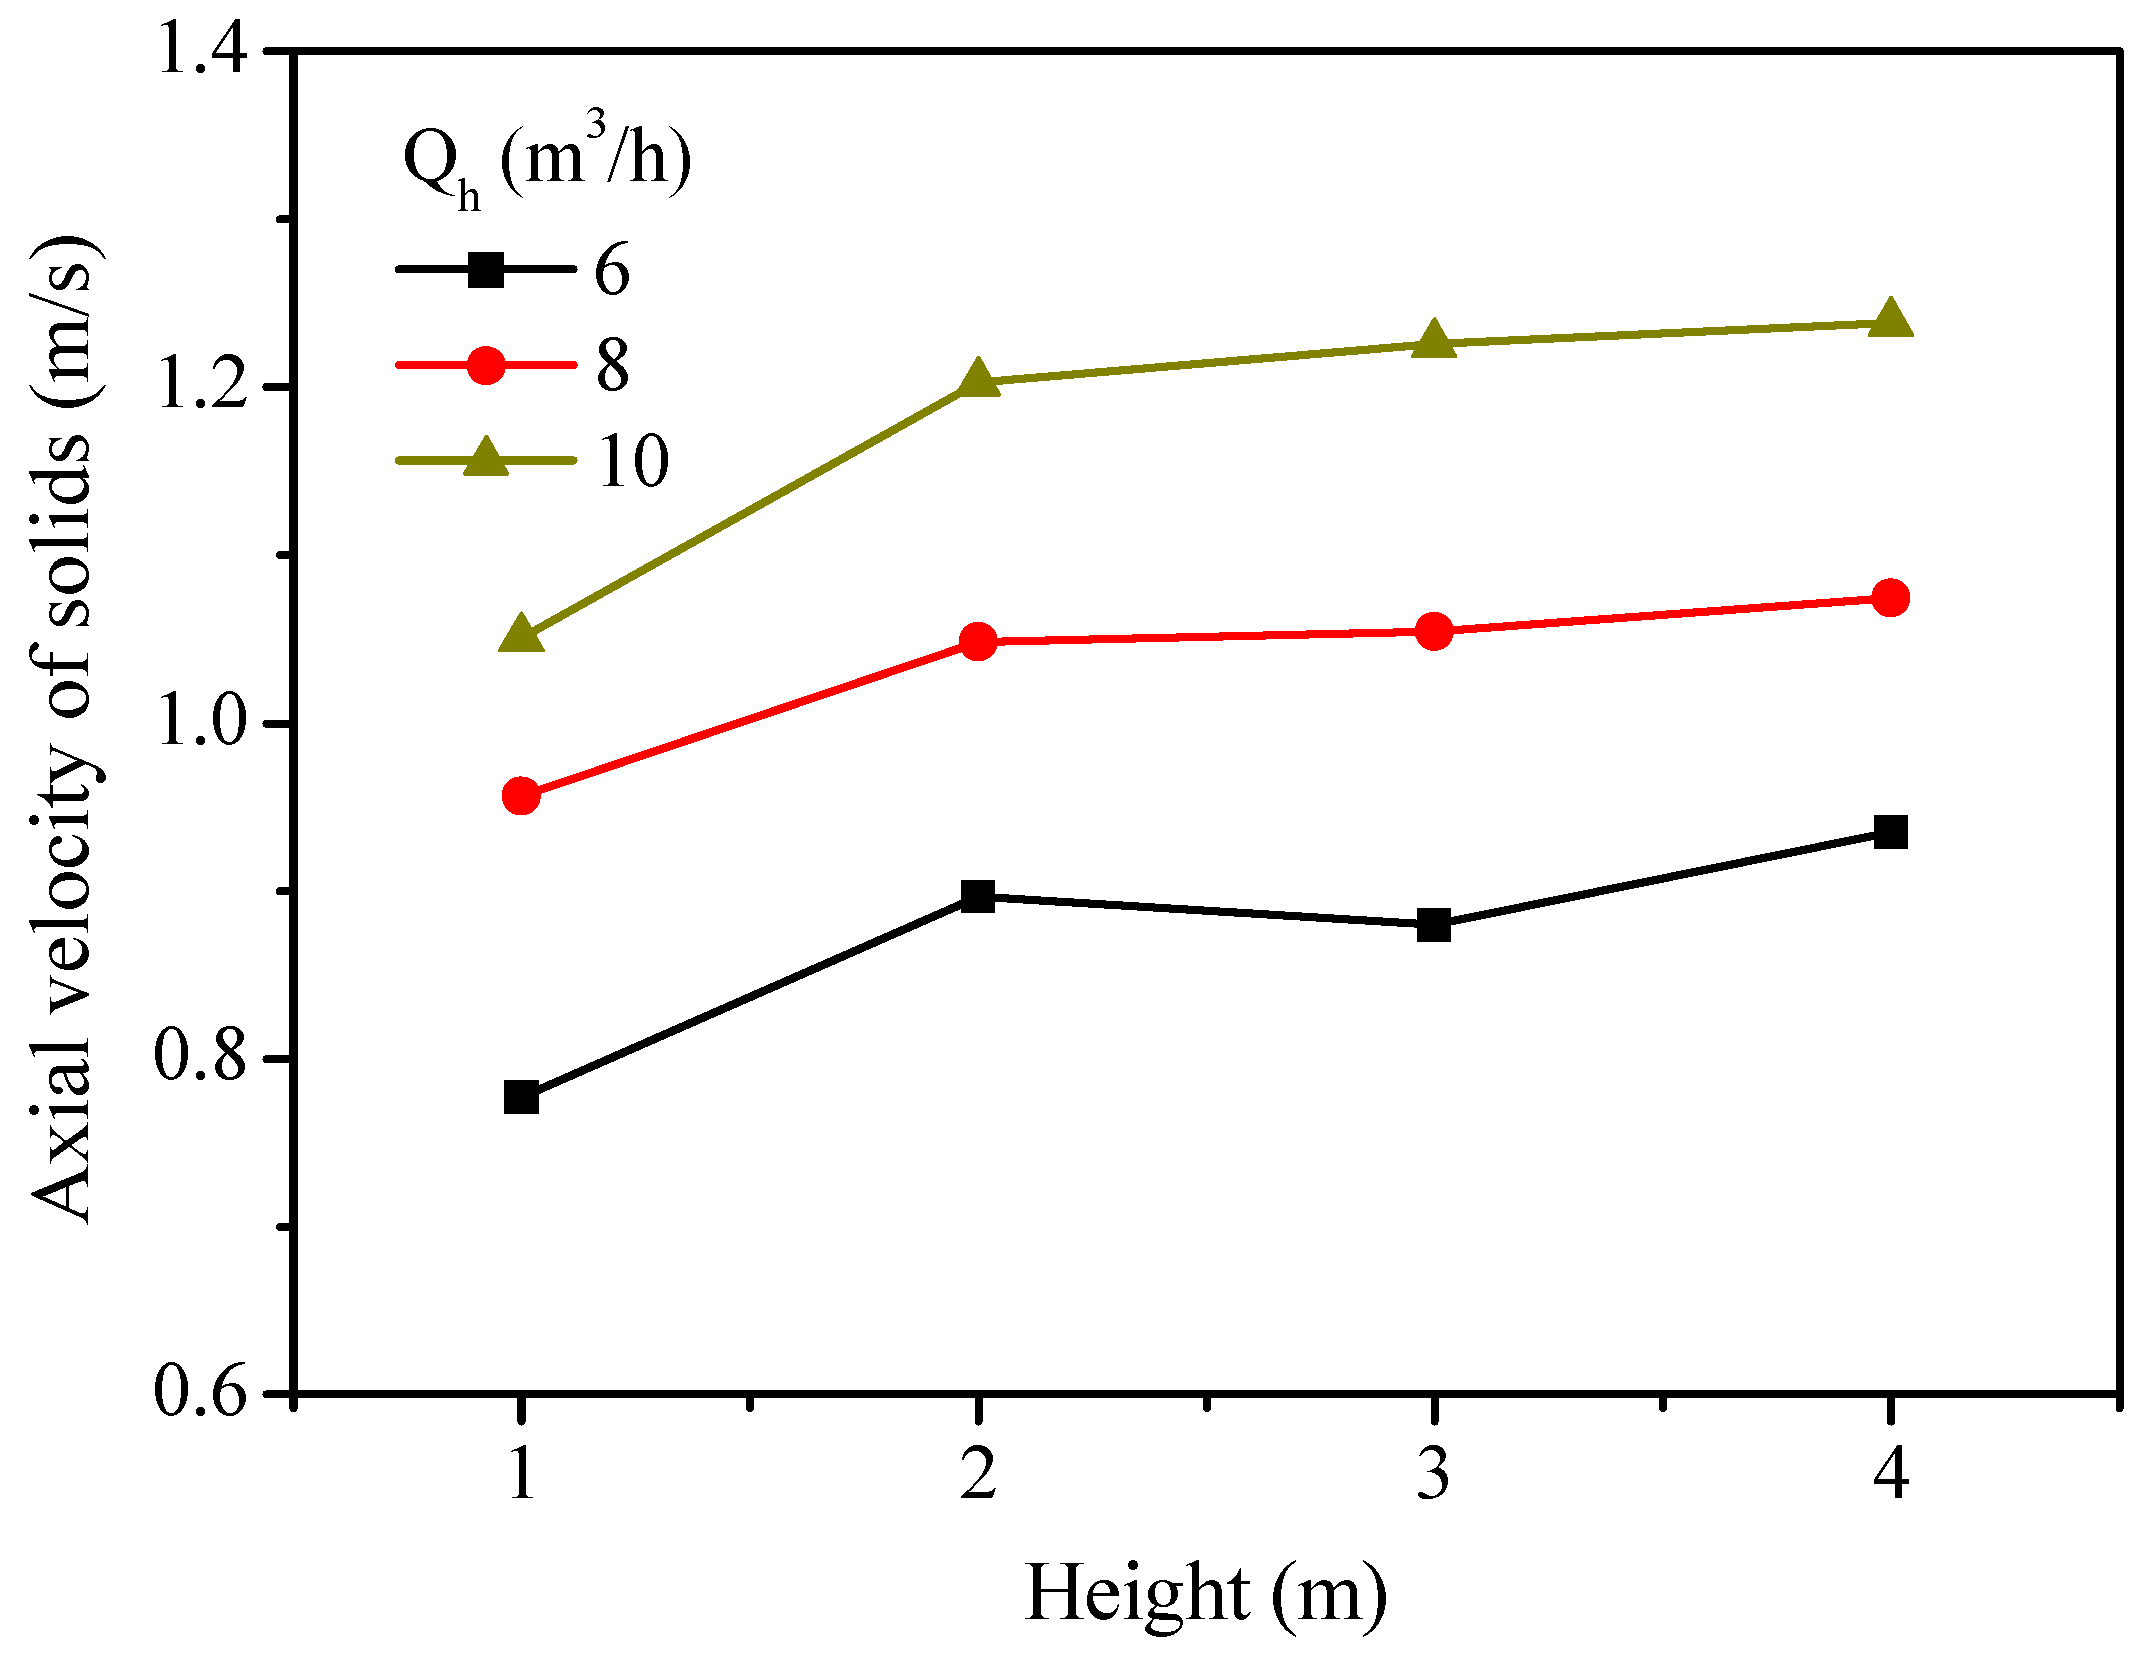
Figure 11.
Effect of steam flow on the CO2 concentration (dry basis) at the outlet of the fuel reactor.
Figure 11.
Effect of steam flow on the CO2 concentration (dry basis) at the outlet of the fuel reactor.
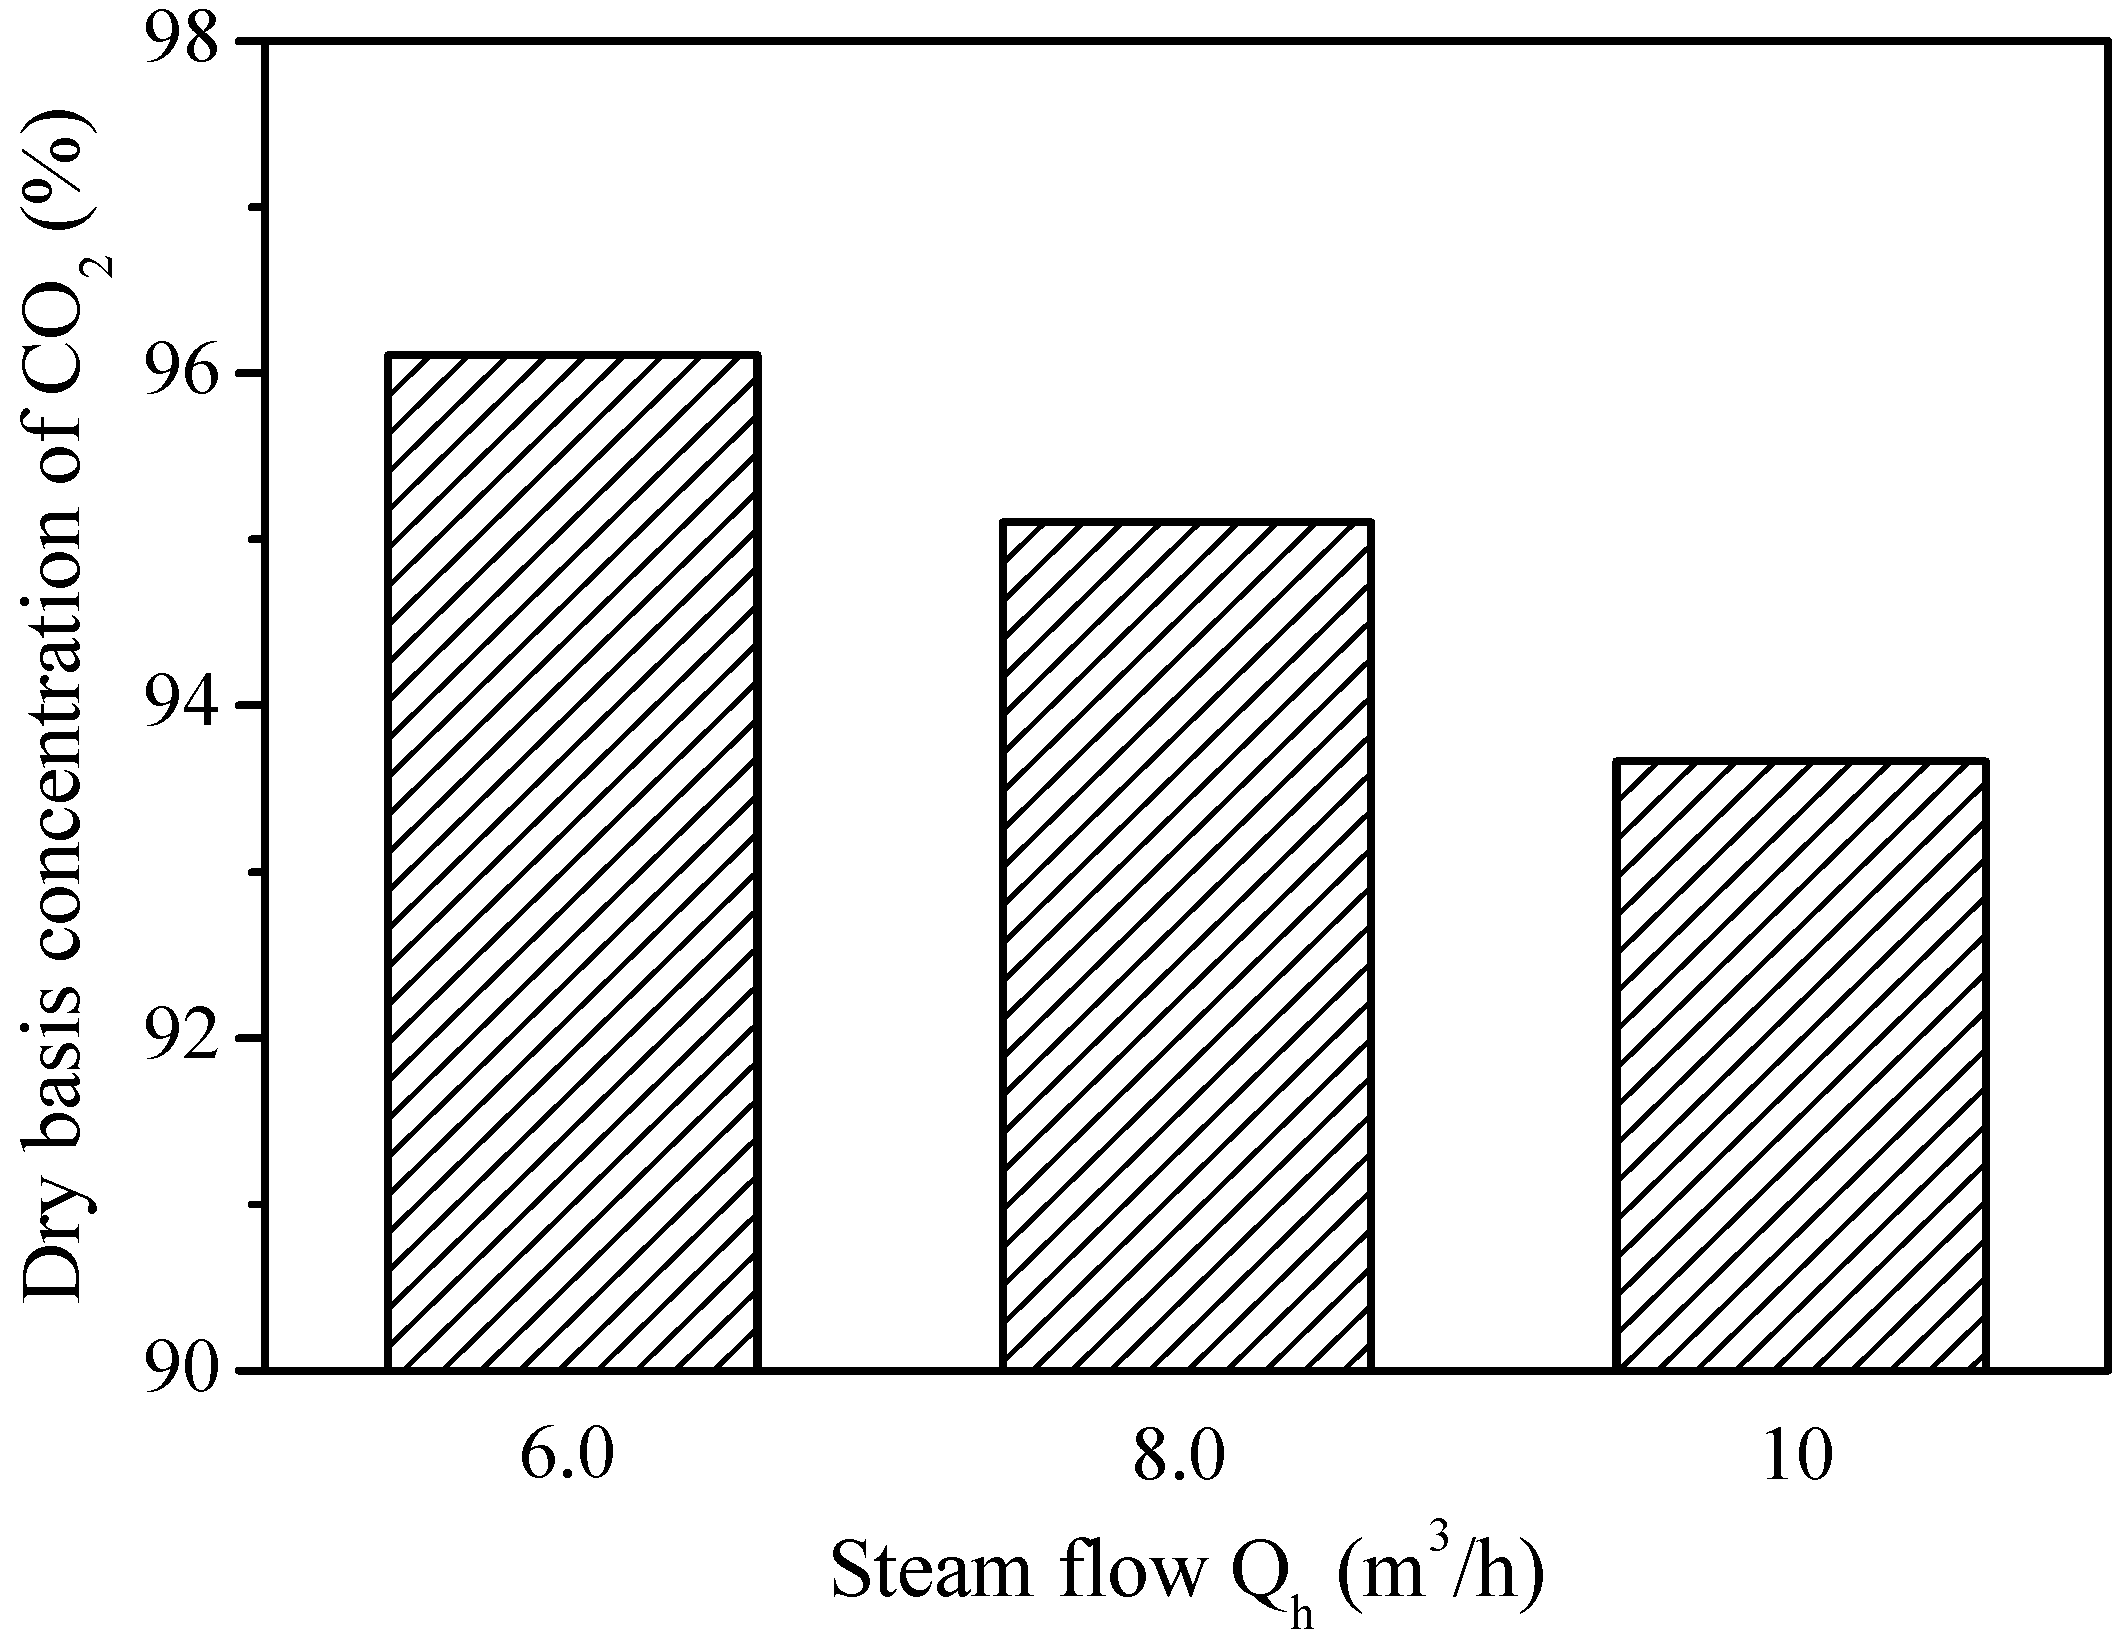
Figure 12.
Effect of steam flow on the single-loop conversion of carbon in the fuel reactor.
Figure 13.
Effect of operating pressure on the profile of the solids holdups along the reactor height.
Figure 13.
Effect of operating pressure on the profile of the solids holdups along the reactor height.
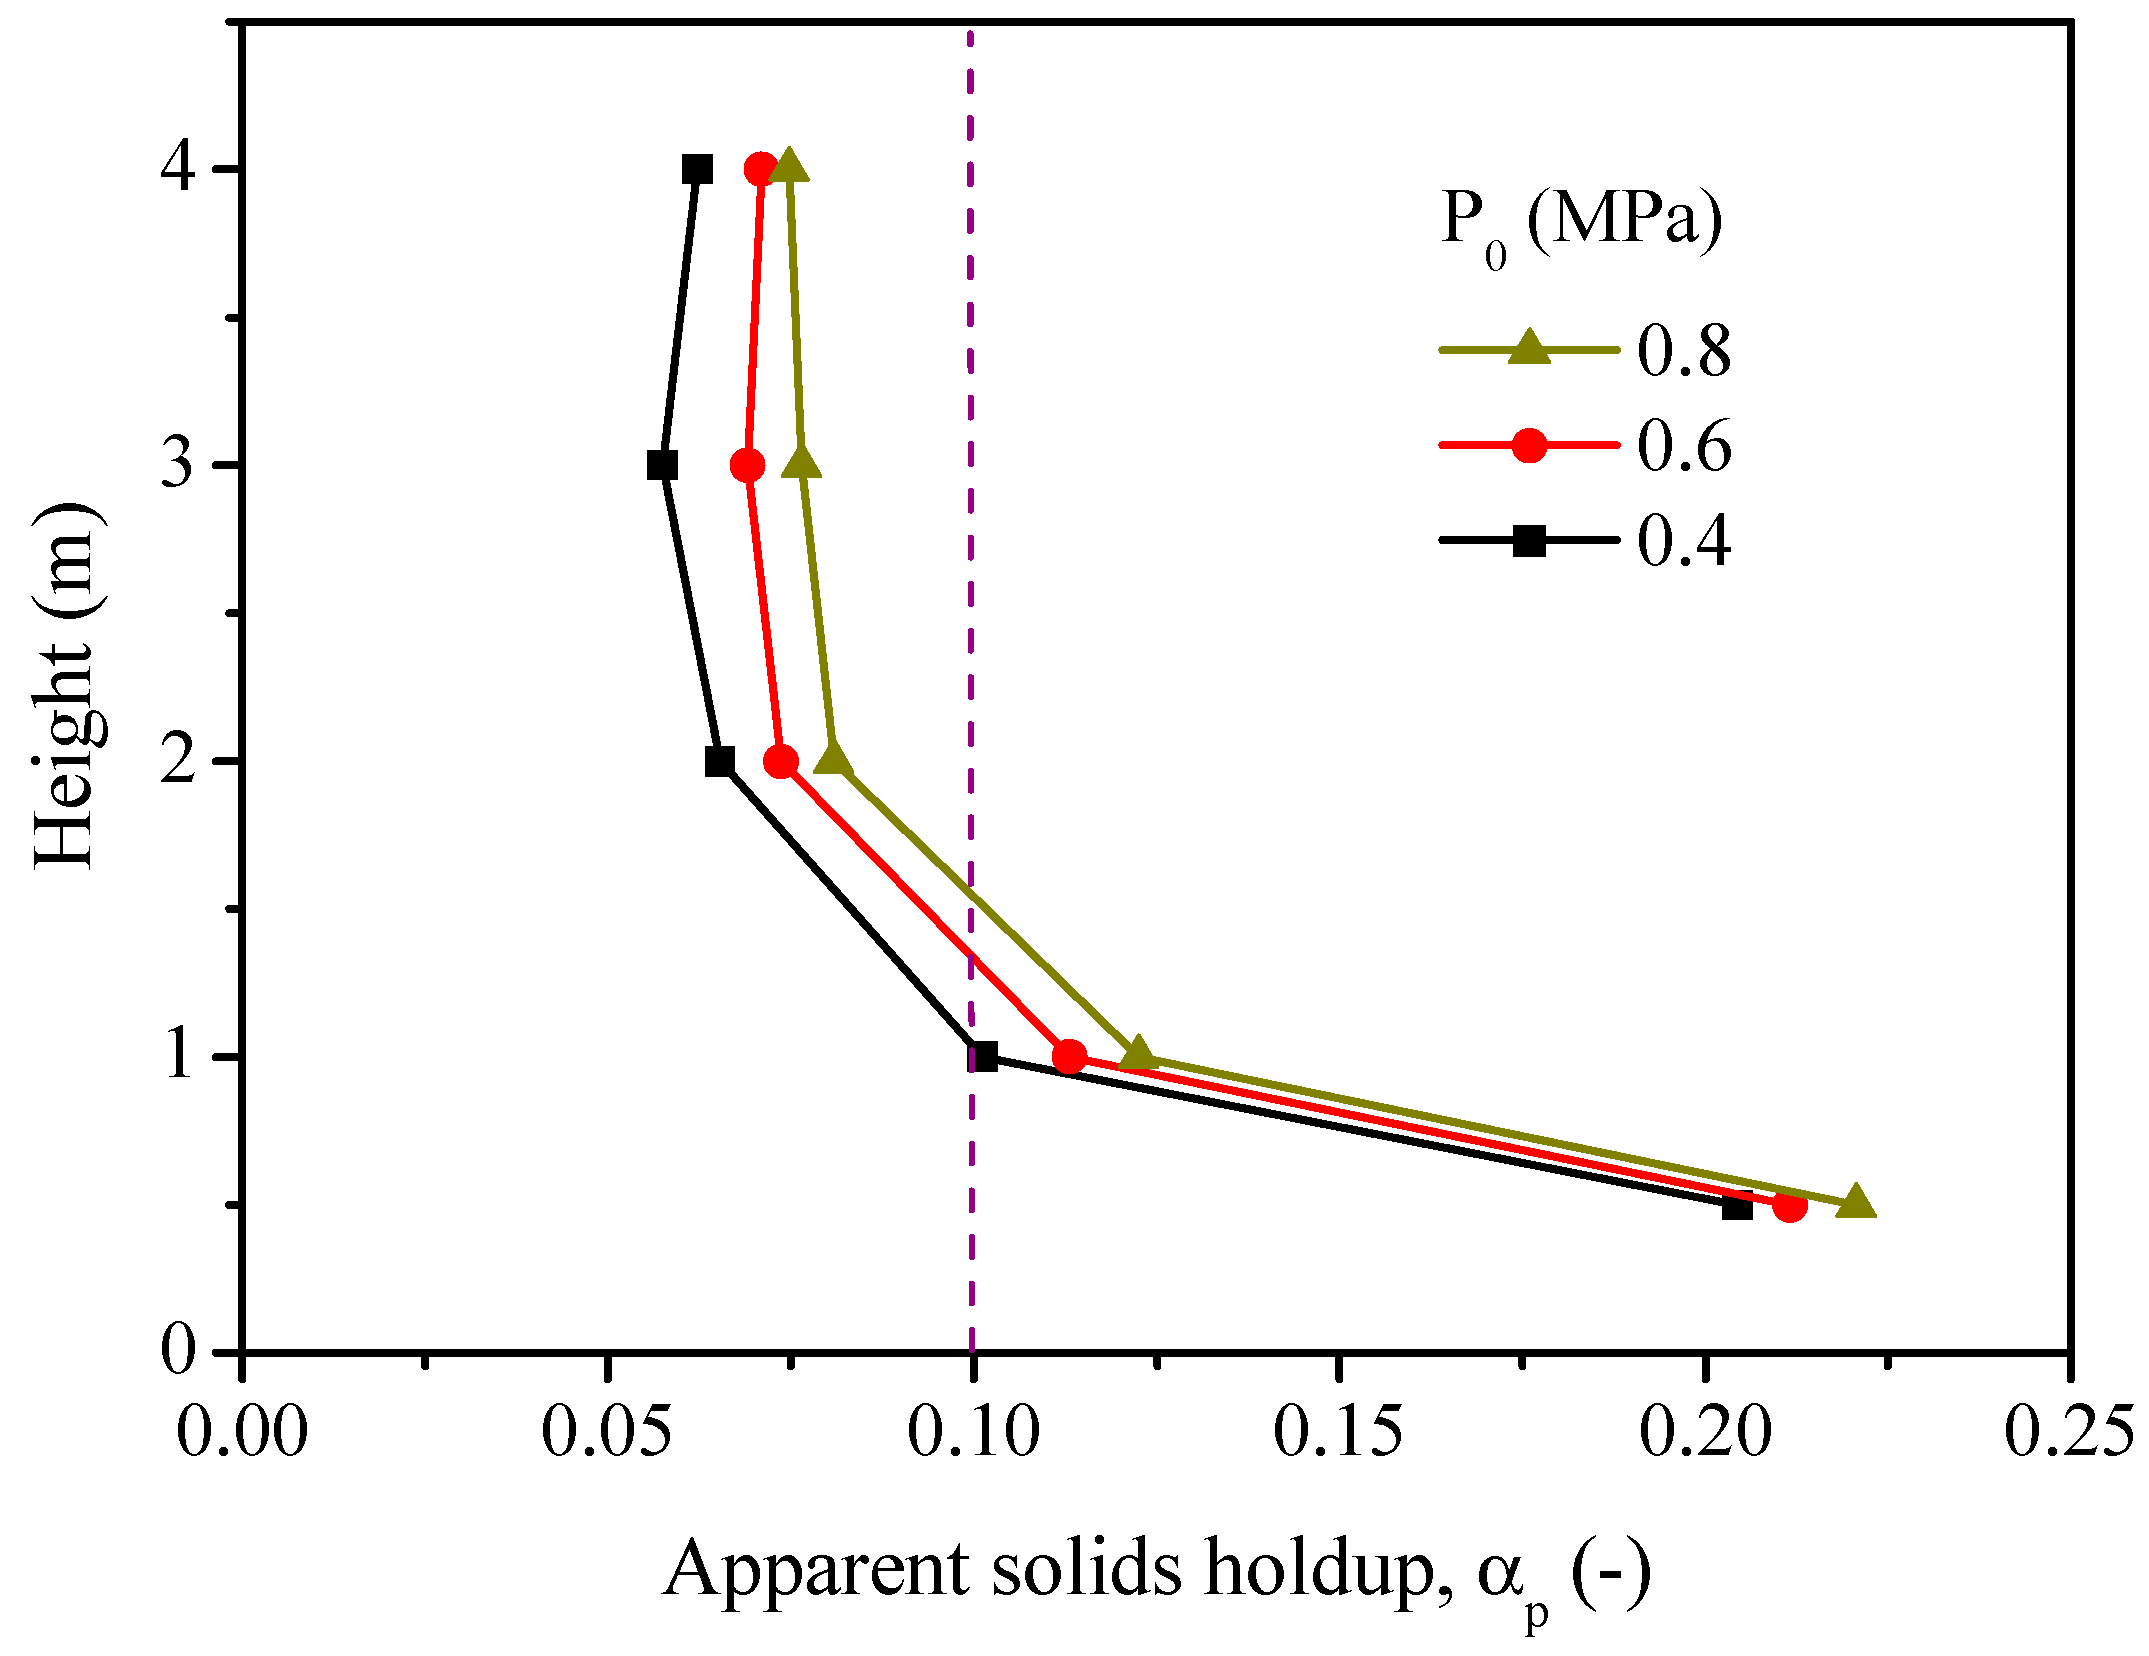
Figure 14.
Distribution of axial velocities of solids with different pressures as a function of height.
Figure 14.
Distribution of axial velocities of solids with different pressures as a function of height.
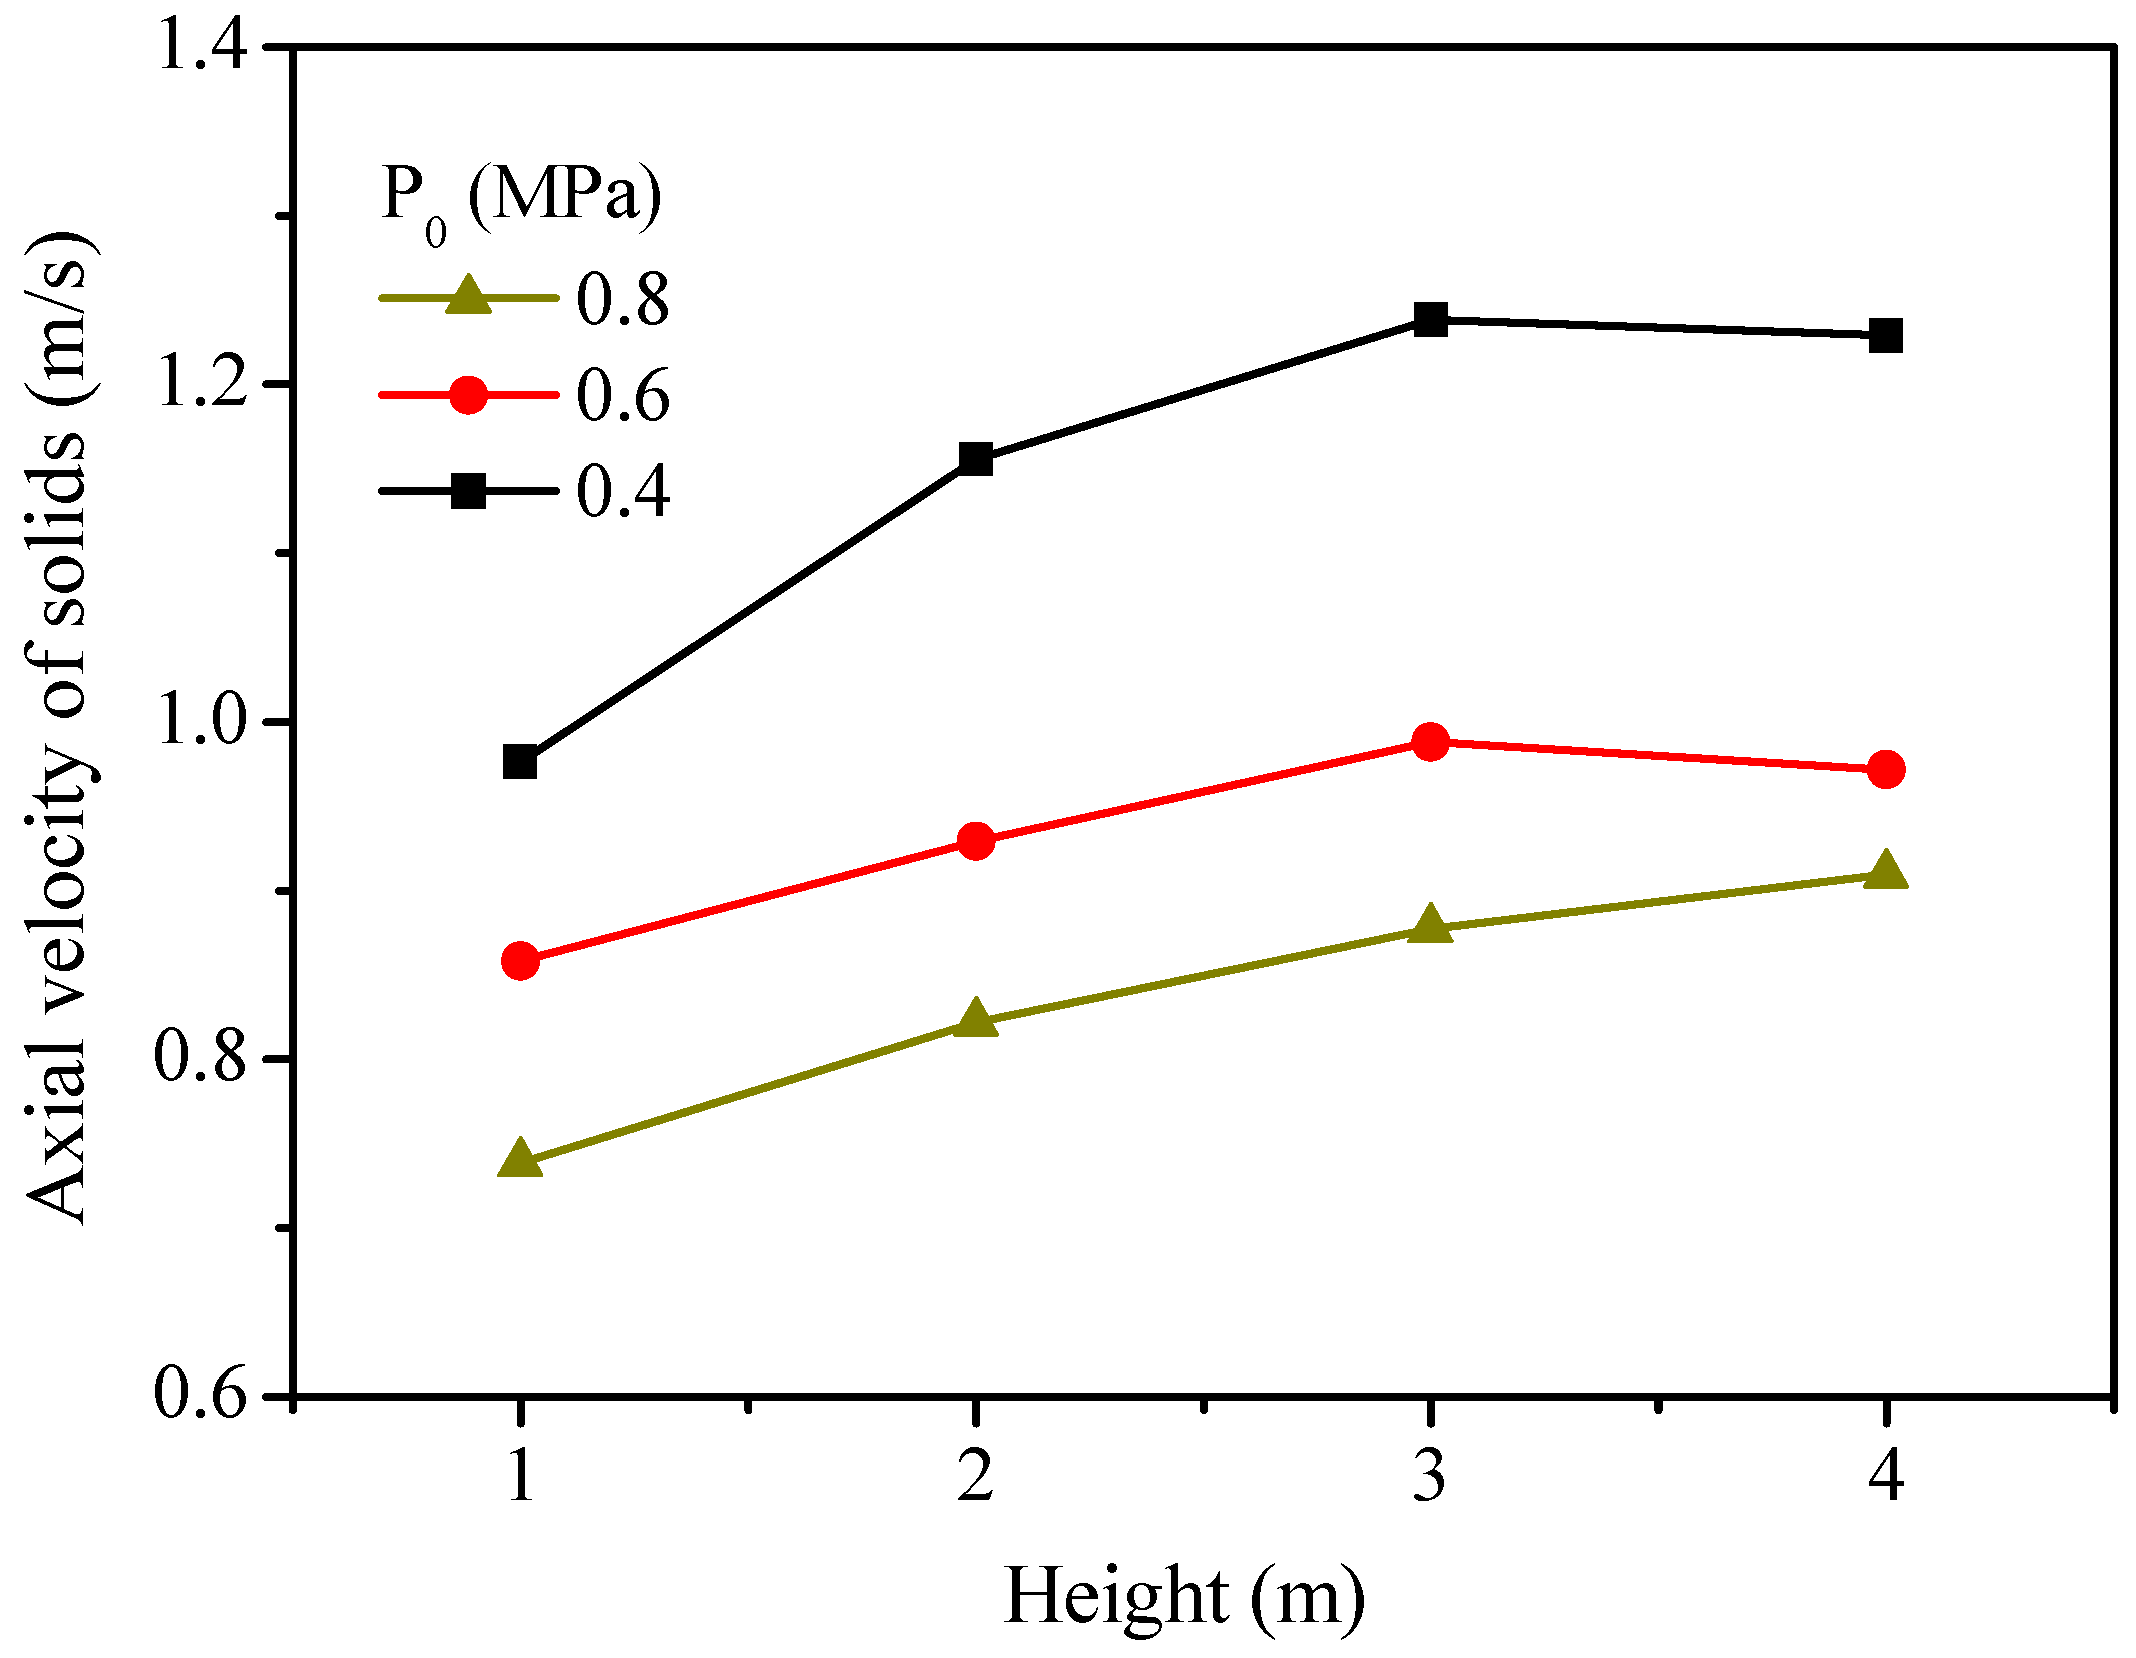
Figure 15.
Effect of pressure on the CO2 concentration (dry basis) at the outlet of the fuel reactor.
Figure 15.
Effect of pressure on the CO2 concentration (dry basis) at the outlet of the fuel reactor.
Figure 16.
Influence of operating pressure on the single-loop carbon conversion in the fuel reactor.
Figure 16.
Influence of operating pressure on the single-loop carbon conversion in the fuel reactor.
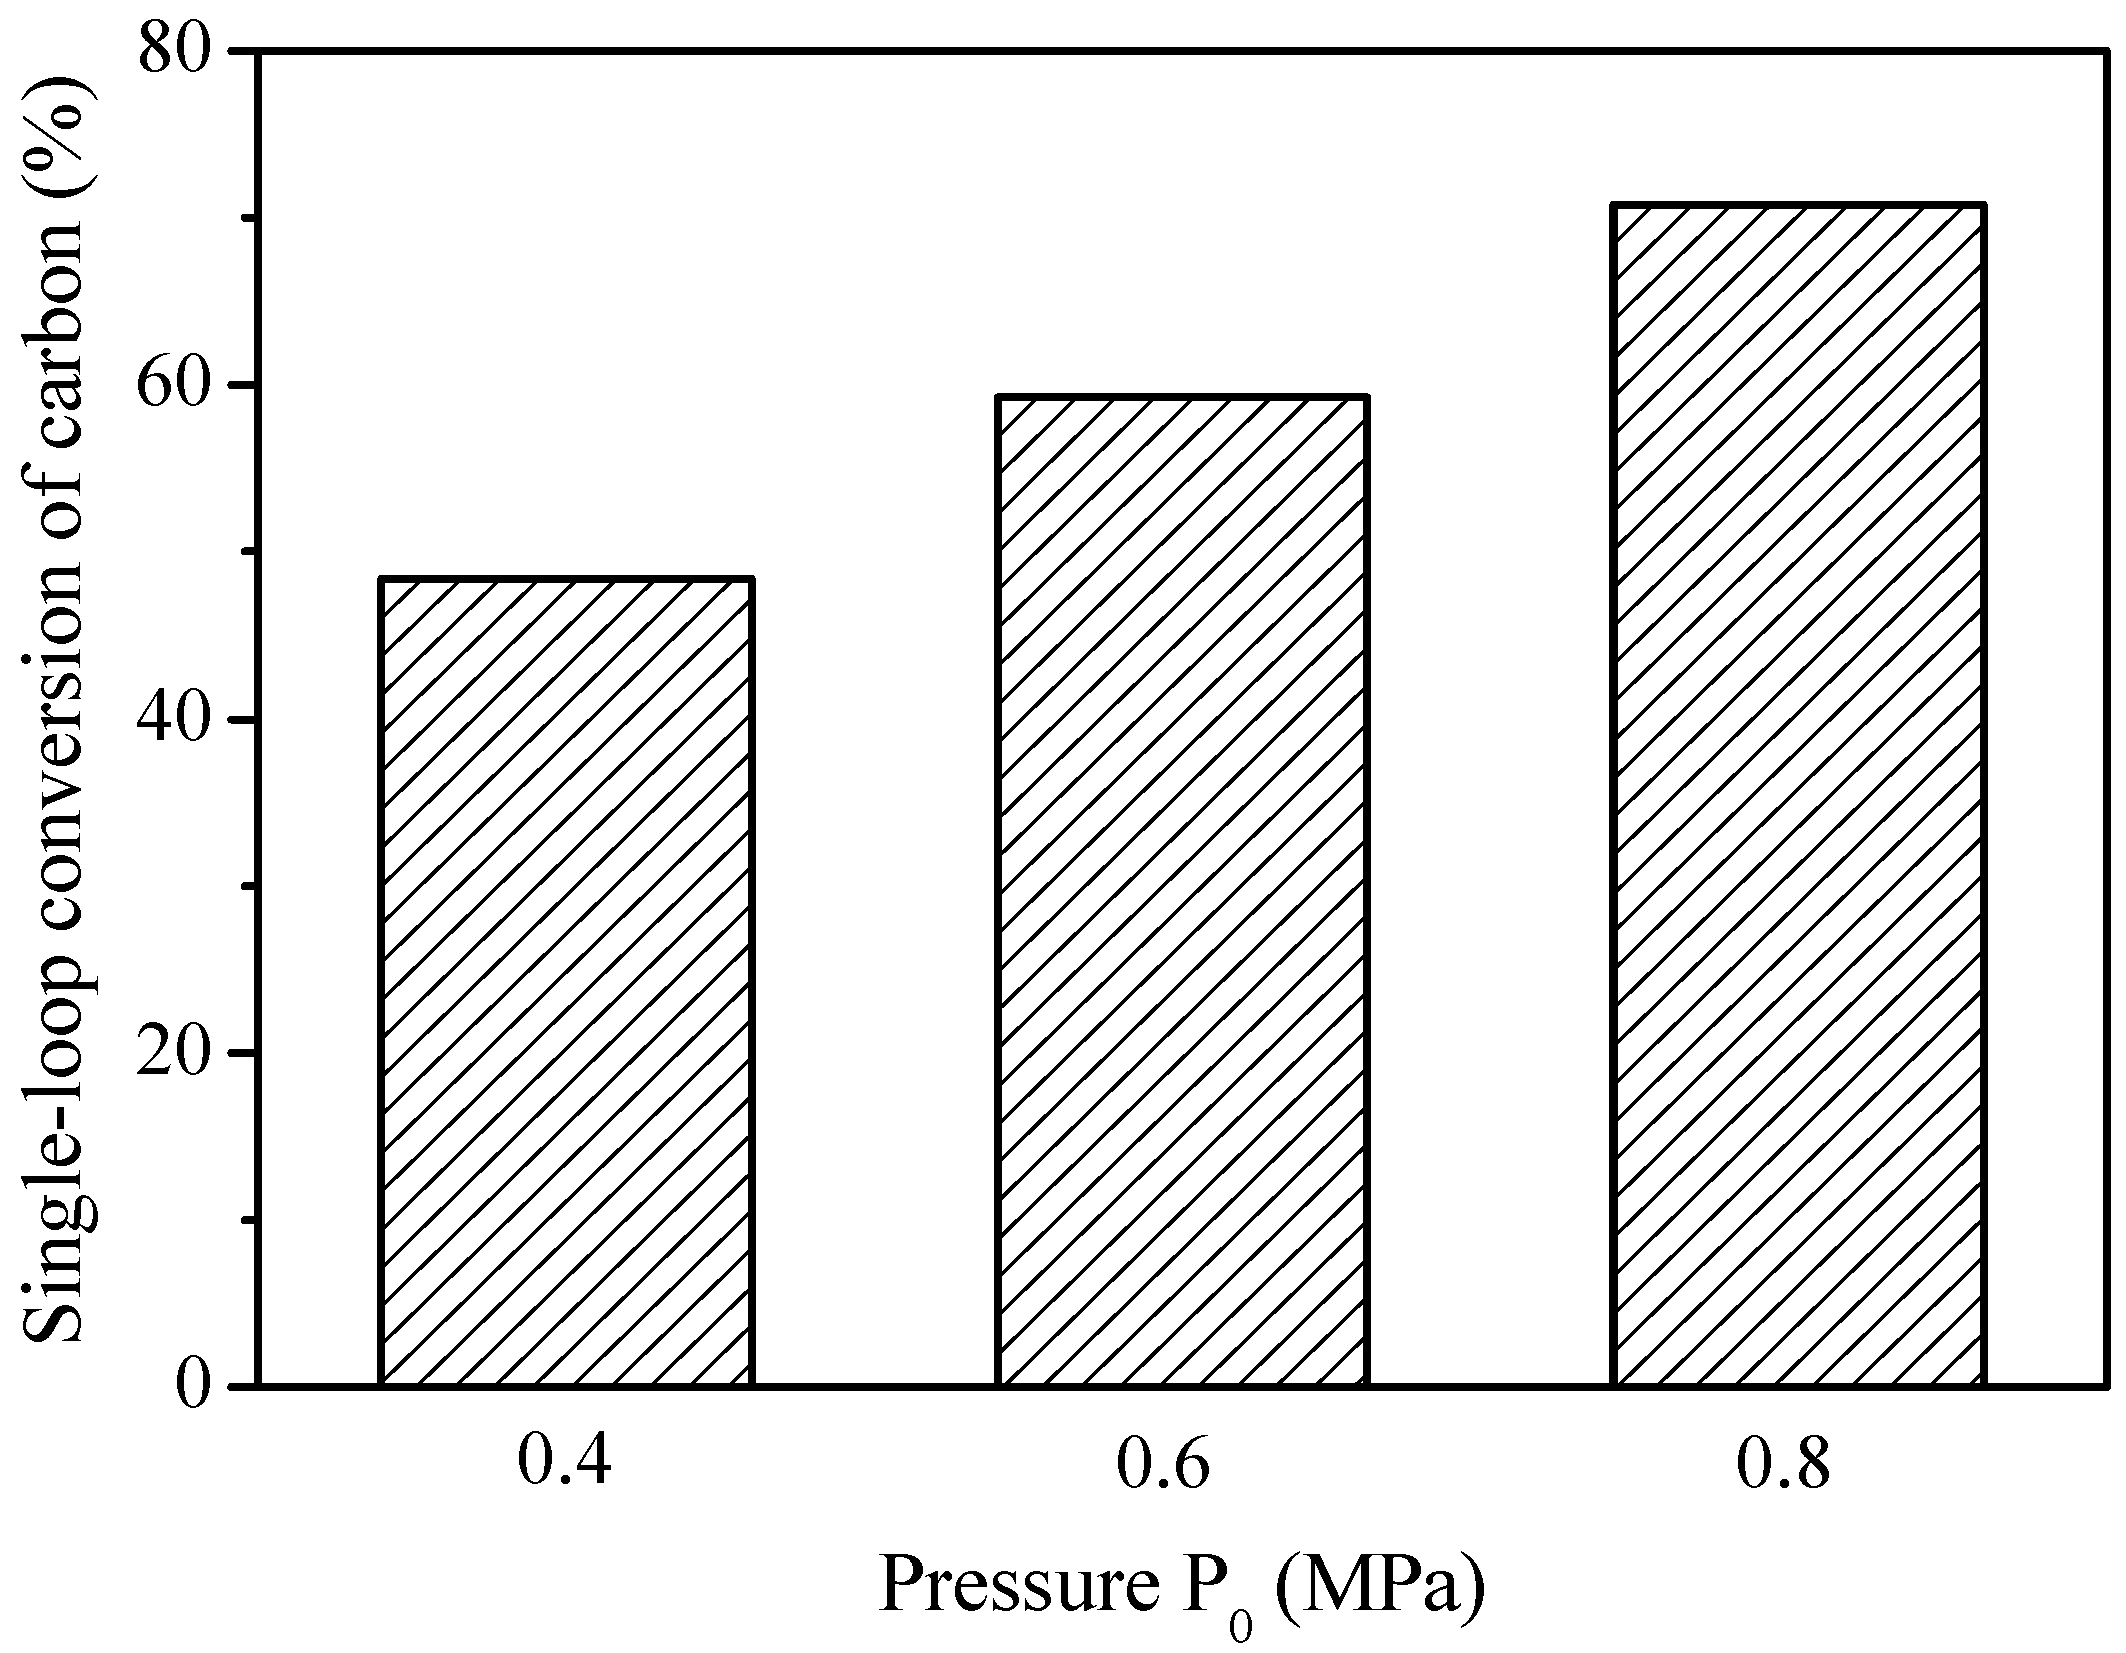
Figure 17.
Sketch and grids of the CFB fuel reactor.
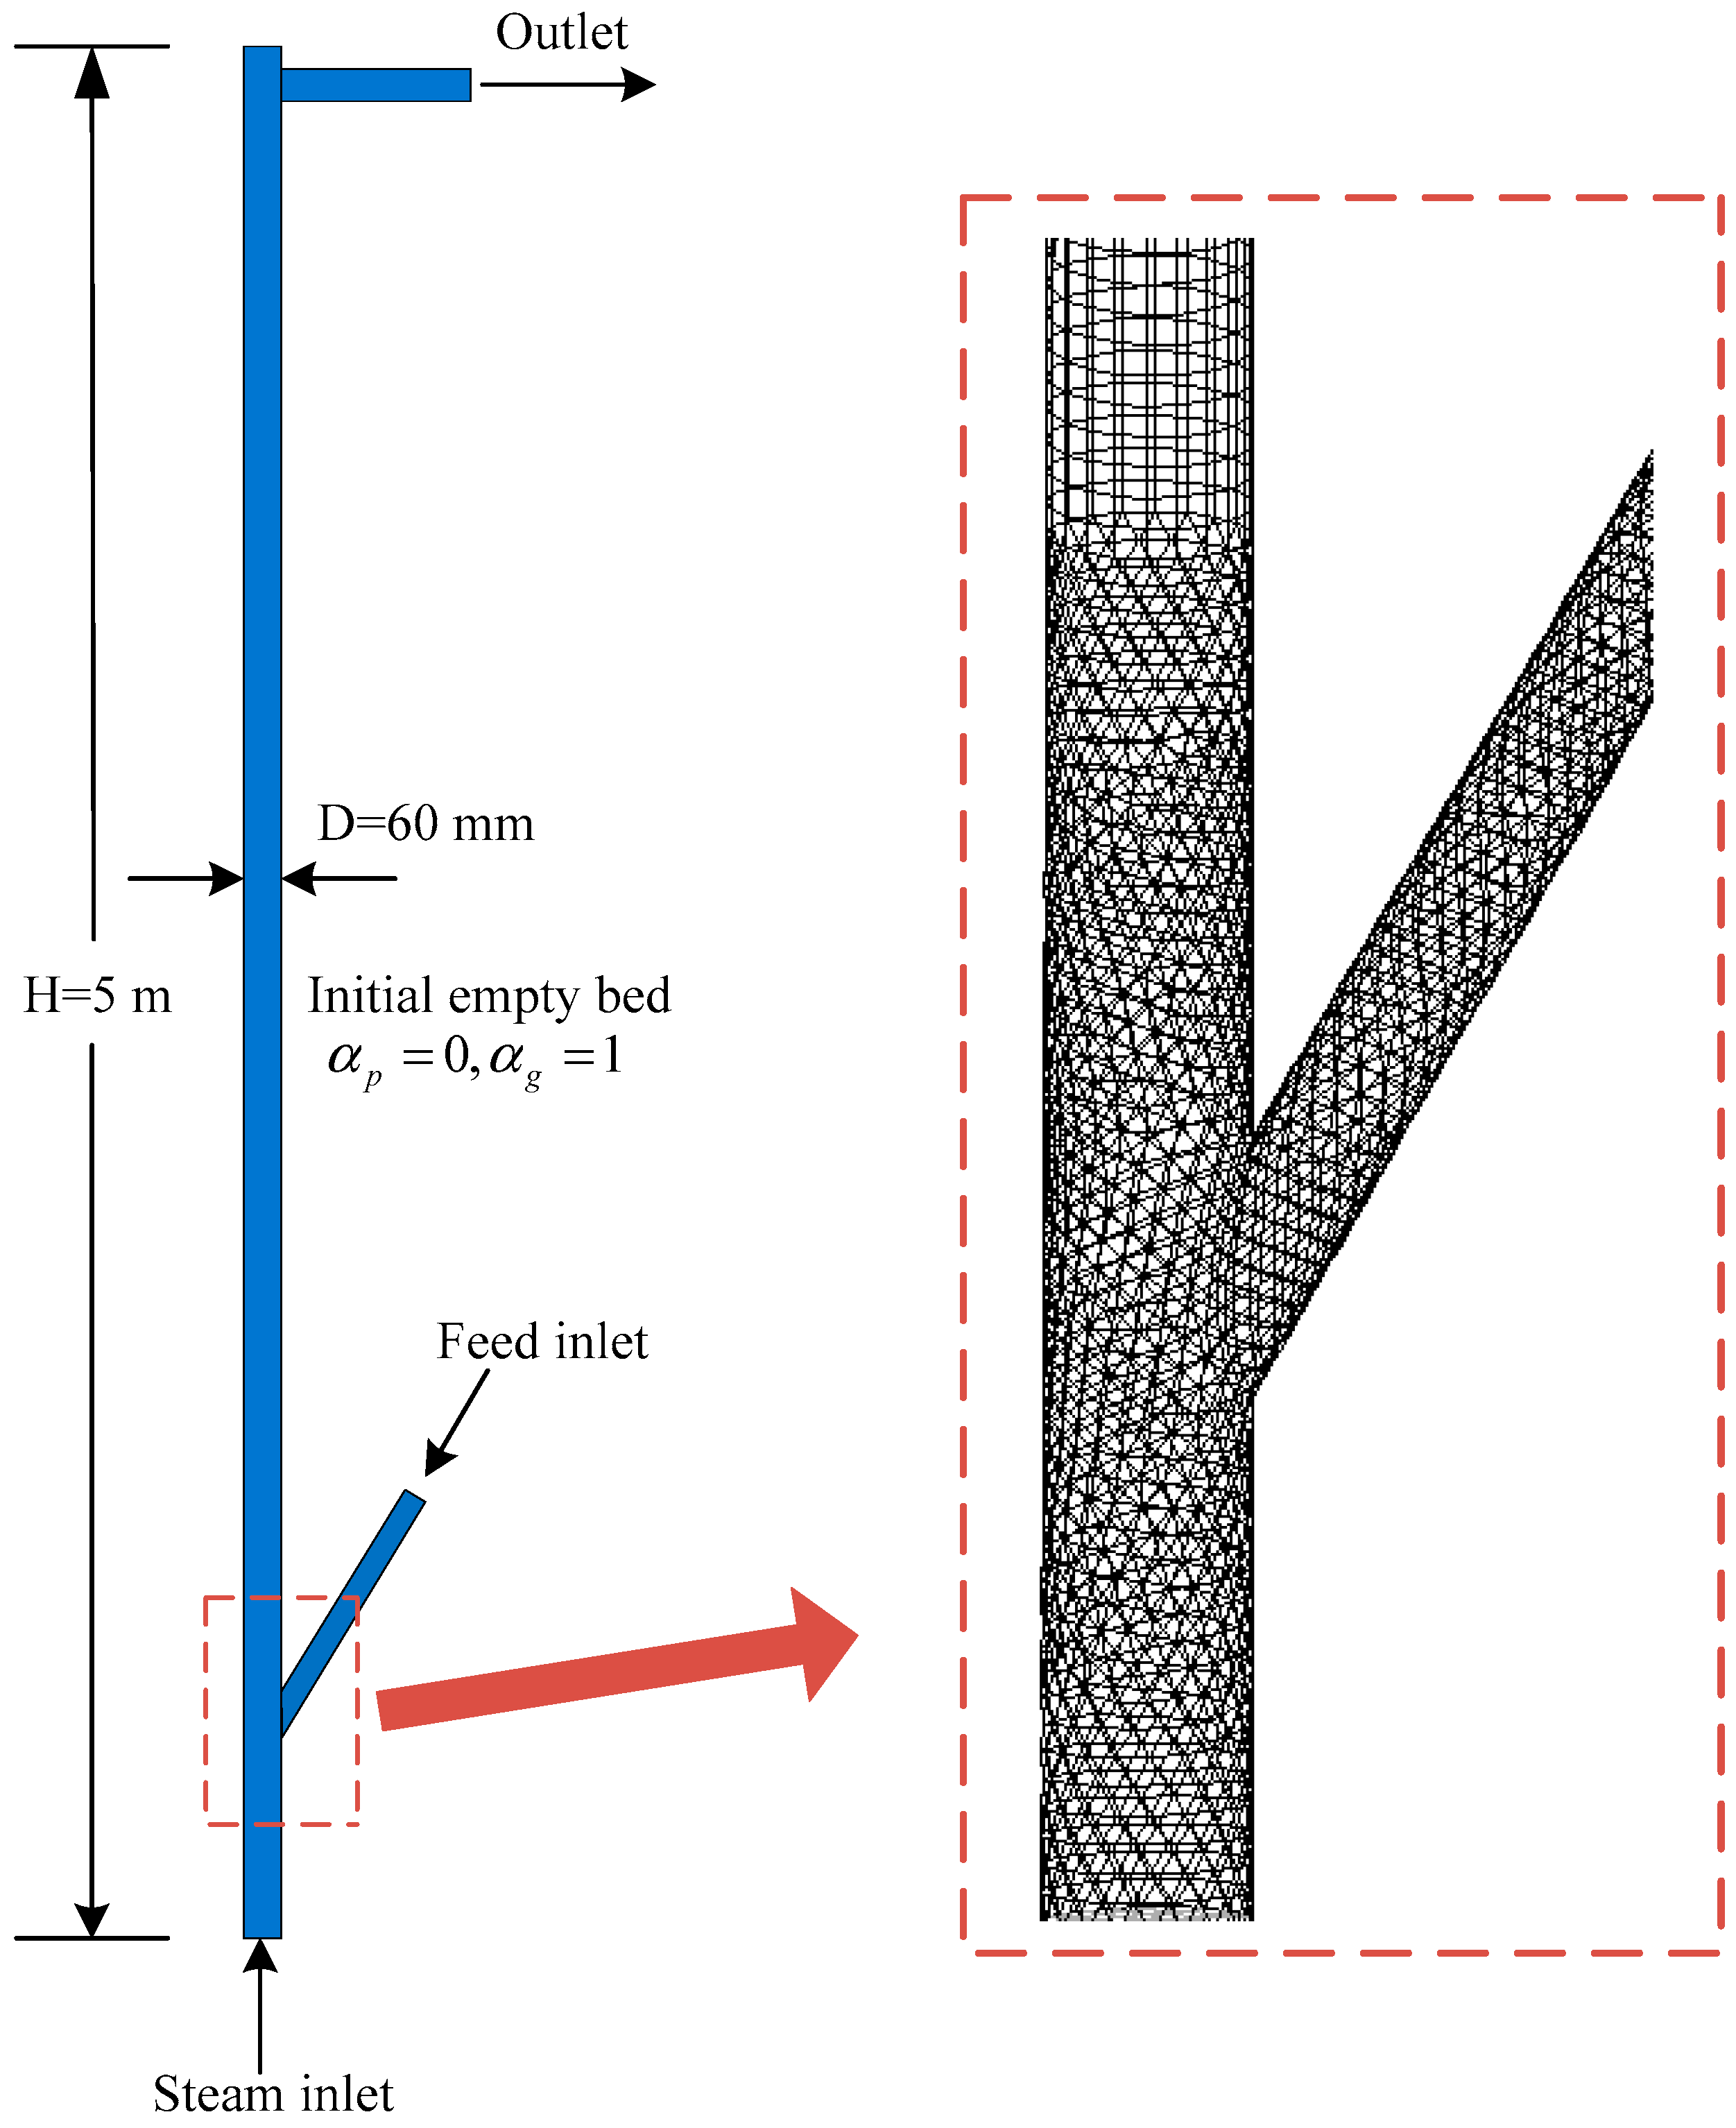
Figure 18.
Standard Gibbs free energy changes for reactions in the fuel reactor.

Table 1.
Main operating parameters used in simulations.
| Parameters | Value |
|---|---|
| Reactor diameter (mm) | 60 |
| Reactor height (m) | 5 |
| Coal feeding rate (kg/h) | 10 |
| Thermal Power (kWth) | ~60 |
| Reactor temperature (K) | 1273 |
Table 2.
Simulation cases and operating conditions.
| Case | Solids Flux, Gp (kg/m2·s) | Steam Flow, Qh (m3/h) | Operating Pressure, P0 (MPa) |
|---|---|---|---|
| 1–3 | 100–200–300 | 7.5 | 0.55 |
| 4–6 | 220 | 6–8–10 | 0.6 |
| 7–9 | 200 | 7 | 0.4–0.6–0.8 |
© 2018 by the authors. Licensee MDPI, Basel, Switzerland. This article is an open access article distributed under the terms and conditions of the Creative Commons Attribution (CC BY) license (http://creativecommons.org/licenses/by/4.0/).
Share and Cite
MDPI and ACS Style
Wang, X.; Jin, B.; Liu, H.; Zhang, B.; Zhang, Y. Prediction of In-Situ Gasification Chemical Looping Combustion Effects of Operating Conditions. Catalysts 2018, 8, 526. https://doi.org/10.3390/catal8110526
AMA Style
Wang X, Jin B, Liu H, Zhang B, Zhang Y. Prediction of In-Situ Gasification Chemical Looping Combustion Effects of Operating Conditions. Catalysts. 2018; 8(11):526. https://doi.org/10.3390/catal8110526
Chicago/Turabian StyleWang, Xiaojia, Baosheng Jin, Hao Liu, Bo Zhang, and Yong Zhang. 2018. "Prediction of In-Situ Gasification Chemical Looping Combustion Effects of Operating Conditions" Catalysts 8, no. 11: 526. https://doi.org/10.3390/catal8110526
Note that from the first issue of 2016, this journal uses article numbers instead of page numbers. See further details here.