Article

Experimental Evaluation of a Membrane Micro Channel Reactor for Liquid Phase Direct Synthesis of Hydrogen Peroxide in Continuous Flow Using Nafion® Membranes for Safe Utilization of Undiluted Reactants

Institute for Micro Process Engineering, KIT, 76344 Eggenstein-Leopoldshafen, Germany
*
Authors to whom correspondence should be addressed.
Catalysts 2018, 8(11), 556; https://doi.org/10.3390/catal8110556
Submission received: 28 October 2018 / Revised: 12 November 2018 / Accepted: 13 November 2018 / Published: 17 November 2018
(This article belongs to the Special Issue Direct Synthesis of Hydrogen Peroxide)

Abstract

:
In recent years, various modular micro channel reactors have been developed to overcome limitations in challenging chemical reactions. Direct synthesis of hydrogen peroxide from hydrogen and oxygen is a very interesting process in this regard. However, the complex triphasic process (gaseous reactants, reaction in liquid solvent, solid catalyst) still holds challenges regarding safety, selectivity and productivity. The membrane micro reactor system for continuous liquid phase H2O2 direct synthesis was designed to reduce safety issues by separate dosing of the gaseous reactants via a membrane into a liquid-flow channel filled with a catalyst. Productivity is increased by enhanced mass transport, attainable in micro channels and by multiple re-saturation of the liquid with the reactants over the length of the reaction channel. Lastly, selectivity is optimized by controlling the reactant distribution. The influence of crucial technical features of the design, such as micro channel geometry, were studied experimentally in relationship with varying reaction conditions such as residence time, pressure, reactant ratio and solvent flow rate. Successful continuous operation of the reactor at pressures up to 50 bars showed the feasibility of this system. During the experiments, control over the reactant ratio was found to be crucial in order to maximize product yield. Thereby, yields above 80% were achieved. The results obtained are the key elements for future development and optimization of this reactor system, which will hopefully lead to a breakthrough in decentralized H2O2 production.

Graphical Abstract

1. Introduction

In recent years, several modular micro channel reactors have been developed at the Institute for Micro Process Engineering at Karlsruhe Institute of Technology (KIT) to overcome kinetic, heat transfer and mass transfer limitations in challenging chemical reactions and processes [1]. Target applications are small scale and medium scale production of fuels and chemicals, energy storage, and utilization of renewable feed stocks. Direct synthesis of hydrogen peroxide from hydrogen and oxygen is a very interesting process in this regard. It is a promising green production route to enable decentralized on-site hydrogen peroxide production for immediate use, e.g., as green oxidizing or bleaching agent since water is the only oxidation by-product. Realization of a commercially viable process for direct H2O2 synthesis, therefore, has the potential to revolutionize the production from an environmental and green chemistry perspective [2]. However, there are three major challenges connected with the direct synthesis process: safety, selectivity and productivity. Most importantly, safety is an issue, because of the wide concentration range where H2 and O2 form an explosive mixture in the gas phase.
Right now hydrogen peroxide is produced on industrial scale by the anthraquinone (AQ) process. The AQ process is energy demanding and complex, consisting of hydrogenation, oxidation, recycling, extraction and distillation, and is therefore only viable on a very large scale, i.e., typically well beyond 50,000 tonnes per year. In addition, the large quantities of concentrated and highly reactive H2O2 solutions produced have to be transported and stored, and they are usually diluted at the point of use. On-site production for generating H2O2 solutions with the required concentration in a specified reaction medium and concentration is therefore highly desirable [3]. The process for direct synthesis of hydrogen peroxide, which was first patented in 1914 [4] is still not brought into industrial practice. The suggested process which received the highest interest lately in research and industry was developed and patented in 1985 by DuPont. The patent described the liquid phase production of concentrated hydrogen peroxide solutions using a palladium on carbon catalyst in aqueous solutions containing acids and halides at 25 °C and pressures up to 170 bars using an explosive hydrogen-oxygen gas mixture [5]. The research on this direct synthesis process however declined after explosion of a pilot-scale reactor at DuPont [6]. In 2006, Degussa AG (nowadays Evonik Industries AG) and Headwaters Incorporated patented a direct synthesis process utilizing a trickle bed outside the explosive regime [7,8] and a nanocatalyst with controlled surface coordination [9,10]. A demonstration plant with a production capacity of several kilotons per year of hydrogen peroxide in methanol was built in 2006 [11,12]. Even though successful operation of this demonstration unit [6] and commercialization plans for 2009 [13] were reported, no further actions became known since then [14]. In contrast, Evonik Industries AG opened a new plant in Jilin (China) with a capacity of 230,000 tons per year in 2014 [15] based on the conventional anthraquinone process [16].
Although the direct synthesis process was studied intensively in research [3,17,18,19,20] and industry [4,5,6,7,8,9,10,11,12,13,14,15,16], there is still no commercial production process. One main issue of direct H2O2 synthesis is low selectivity. H2O2 is a thermodynamically unfavored and highly reactive intermediate in the reaction network. Selectivity is diminished not only by competitive water formation as a side reaction, but also due to consecutive hydrogenation and decomposition of H2O2 to water, as shown in Equations 1–4. Several techniques were developed to increase the selectivity and yield and to stabilize the product including addition of sodium bromide as a promoter, addition of phosphoric and/or sulfuric acid to lower the pH value, passivation of steel equipment by acid treatment, and keeping the temperature below 50 °C to prevent auto decomposition [18,19].
  H 2 +   O 2     H 2 O 2  
  2   H 2   +   O 2     2   H 2 O  
  H 2 O 2   +   H 2     2   H 2 O  
  H 2 O 2   H 2 O +   0.5   O 2  
Catalysts studied for direct synthesis are mainly noble metals or noble metal alloys on a variety of inorganic supports, i.e., alumina, carbon, silica and titania [20]. Pd was found to be the most active for direct synthesis of H2O2, but also very active for subsequent hydrogenation and decomposition. It was reported that alloying Pd with Au, Sn or Te gives better performance by increasing the selectivity [21,22,23]. However, it remains an open question whether metallic or oxidic Pd favors H2O2 formation and how exactly acids and promoters are involved in the reaction [19,24]. Recent studies revealed that the reaction might take place at the interface between Pd and PdO, indicating the strong dependence on both phases [25,26]. Surface and subsurface impurities such as C, N and O and surface species such as PVA, CO2, SO42− were suggested to limit the uptake of hydrogen in Pd, thereby increasing the selectivity to H2O2 [27,28]. This also led to the conclusion that subsurface hydrogen might play a crucial role in direct synthesis of H2O2 [29]. Recently, it was shown that alpha palladium hydride is present during the reaction by operando X-ray Absorption Spectroscopy (XAS), proofing the existence of subsurface hydrogen in the formation of H2O2 [30]. Furthermore, Pd nanoparticles with a diameter of 1.4 nm achieved the best catalytic performance while single site Pd nanoparticles were inactive, further indicating an important interaction between surface and subsurface domains [31]. Lee et al. recently studied catalysts using Pd supported on ordered mesoporous carbon doped with heteropolyacids (HPA) and found increasing selectivity and productivity with increasing HPA content/acidity [32]. Similarly, another group reported that catalytic performance increases with acidity of the support with Pd supported on silica functionalized with aryl sulfonic, alkyl phosphonic and alkyl carboxylic groups [33]. Lastly, structural modifications of the support material are known to influence catalyst performance as well. Pd/TiO2 modified with heterogeneous carbon [34] and core-shell structured Pd/SiO2 with a microporous Si shell on silica beads [35] showed an increased catalytic performance with decreased adsorption of H2O2.
Studying the reaction mechanism of the direct synthesis of hydrogen peroxide is a difficult task because of the complex transport phenomena in the triphasic gas-liquid-solid system obscuring the intrinsic kinetics [17]. Usually it is studied through activity tests in autoclaves in order to generate defined reaction conditions. Thereby, it was proven that diatomic oxygen species adsorbed on Pd react to H2O2, whereas water formation takes places via oxygen dissociation [17]. Density Functional Theory (DFT) calculations on Pd clusters and Au clusters also showed that formation of adsorbed OOH* is the rate limiting step [36,37]. Furthermore, it was shown that Au blocks the dissociation of O2 in Pd/Au alloys leading to enhanced selectivity as observed experimentally [38]. It is common opinion in most kinetic studies that hydrogen also reacts from an adsorbed state following a Langmuir-Hinshelwood mechanism. However, Wilson et al. [39] recently showed that this mechanism was not able to describe their experimental data for direct synthesis of H2O2 on Pd clusters. Hence, their conclusion was that H2O2 is likely formed by reaction pathways that involve intermediates not present on the catalyst surface. Their explanation fits very well with the observations from several groups as described in the previous paragraph.
Besides the chemical challenges, the most important engineering problem in the direct synthesis of H2O2 is safety of the operation since H2 and O2 form explosive mixtures in the gas phase over a wide concentration range [40]. Dilution as a precaution, however, reduces solubility of the gases and thereby decreases productivity because of the triphasic gas-liquid-solid system. Hence, productivity is still a primary concern for continuous flow operation [14]. Yet, the reaction has to be run continuously in order to reduce contact time with the catalyst and thereby minimize hydrogenation and decomposition reactions [40]. As a consequence of the challenging aspects of the reaction, novel reaction engineering concepts aimed at enhancing process control, boosting H2O2 productivity, and offering safe operation were proposed in the literature. Biasi et al. studied different catalytic systems in a trickle bed reactor using diluted gas mixtures at a pressure of 10 bar [41,42,43]. Microchannel set ups were used by different groups since the small inner dimensions on the one hand prevent explosions and thereby explosive mixtures can be utilized, and on the other hand, they decrease liquid diffusion pathways by forcing favorable flow patterns [44,45,46,47,48,49,50,51,52,53]. Membrane reactors are especially interesting since gas phase contact of H2 and O2 can be prevented by introducing one or both reactants through a membrane into the liquid solvent containing the catalyst [54,55,56,57].
Recently, our group developed a new approach, namely the concept of alternating reactant dosage attempting to combine the benefits of reactant dosing through membranes and flow properties in microchannels [57]. Simulation results indicated an optimized concentration profile that should lead to high conversion and high selectivity in the liquid phase. An initial proof of concept has been achieved previously [57]. This work describes the first experimental evaluations of the membrane micro channel reactor with alternating reactant dosage.

2. Results and Discussion

2.1. Influence of Residence Time and Catalyst

The initial experiments were conducted using diluted Pd/C as catalyst in a fixed bed within the micro channel, performing the reaction in water as solvent (0.15 mM NaBr, 0.15 mM H2SO4) at 20 bars with undiluted reactant gases and solvent flow rates from 0.5 to 3 mLmin (Table 1, Exp.-Nr.: 1–12 and empty squares in Figure 1a). The H2O2 concentration was found to be increasing with decreasing solvent flow rate until a maximum concentration with a yield of 2% was reached. Further decrease of solvent flow rate led to decreasing product concentrations. The increase in concentration with decreasing flow rate at high solvent flow rates can be explained by a diffusion limitation introduced by the gas transport through the membrane and by liquid phase diffusion from the membrane to the bulk of the liquid. The decrease at lower solvent flow rates can only be caused by acceleration of H2O2 decomposition and hydrogenation since concentration of both reactants should increase equally. The acceleration of consecutive reactions can be a result of an unfavorable reactant concentration ratio caused by long residence times beneath the gas chambers and by longer catalyst contact times. For comparison, the 1 wt.-% Pd/TiO2 catalyst was prepared and tested at similar conditions as it had shown promising results in the literature [51]. Pd/TiO2 displayed the same behavior but was able to achieve a higher maximum concentration at a lower solvent flow rate with a maximum yield of 5%. Hence, acceleration of the consecutive reactions was not as severe as with the Pd/C catalyst but still limiting. In order to further stabilize the formed H2O2, the NaBr concentration was increased from 0.15 mM to 4 mM. With the increased NaBr concentration, it was possible to lift the yield to a maximum of 14% using the Pd/TiO2 catalyst. However, the behavior of accelerated consecutive reactions with decreasing solvent flow rate was also observed in this set of experiments.
The influence of catalyst mass was studied by using the membrane micro reactor just for gas dosage and applying the catalyst as a fixed bed in a tube at the exit of the reactor (Table 1, Exp.-Nr.: 38–45 and Figure 2). This set of experiments was conducted with water as solvent (5 mM NaBr, no acid) at 10 bars using undiluted reactant gases. A strong dependence on the amount of catalyst used was found. The highest H2O2 concentration was achieved with 100 mg of catalyst, indicating that the formation reaction was kinetically limited when 50 mg of catalyst was used and the consecutive reactions were dominating in the case of the experiments with 200 mg of catalyst. For the solvent flow rates tested, maximum yields of 12% for 100 mg, 8% for 50 mg and 4% for 200 mg were found. Only the set of experiments with 200 mg of catalyst showed a maximum similar to the experiments with the micro channel fixed bed discussed above.
The fixed bed after the reactor showed, in comparison with the micro channel fixed bed (Exp.-Nr.: 13–17), a lower H2O2 concentration at higher solvent flow rates, which could be a result from the reactant refeeding in the latter case. For the lowest flow rate tested, the H2O2 concentration achieved with the fixed bed after the reactor was higher for 50 and 100 mg of catalyst. Since acid was used in the micro channel fixed bed experiments, the increased concentration at higher solvent flow rates can not be solely attributed to the difference in catalyst arrangement. However, the maximum H2O2 concentration at 0.25 mL/min of both experiments with 200 mg of catalyst and the low product concentration at low flow rates further shows the sensibility of catalyst mass.

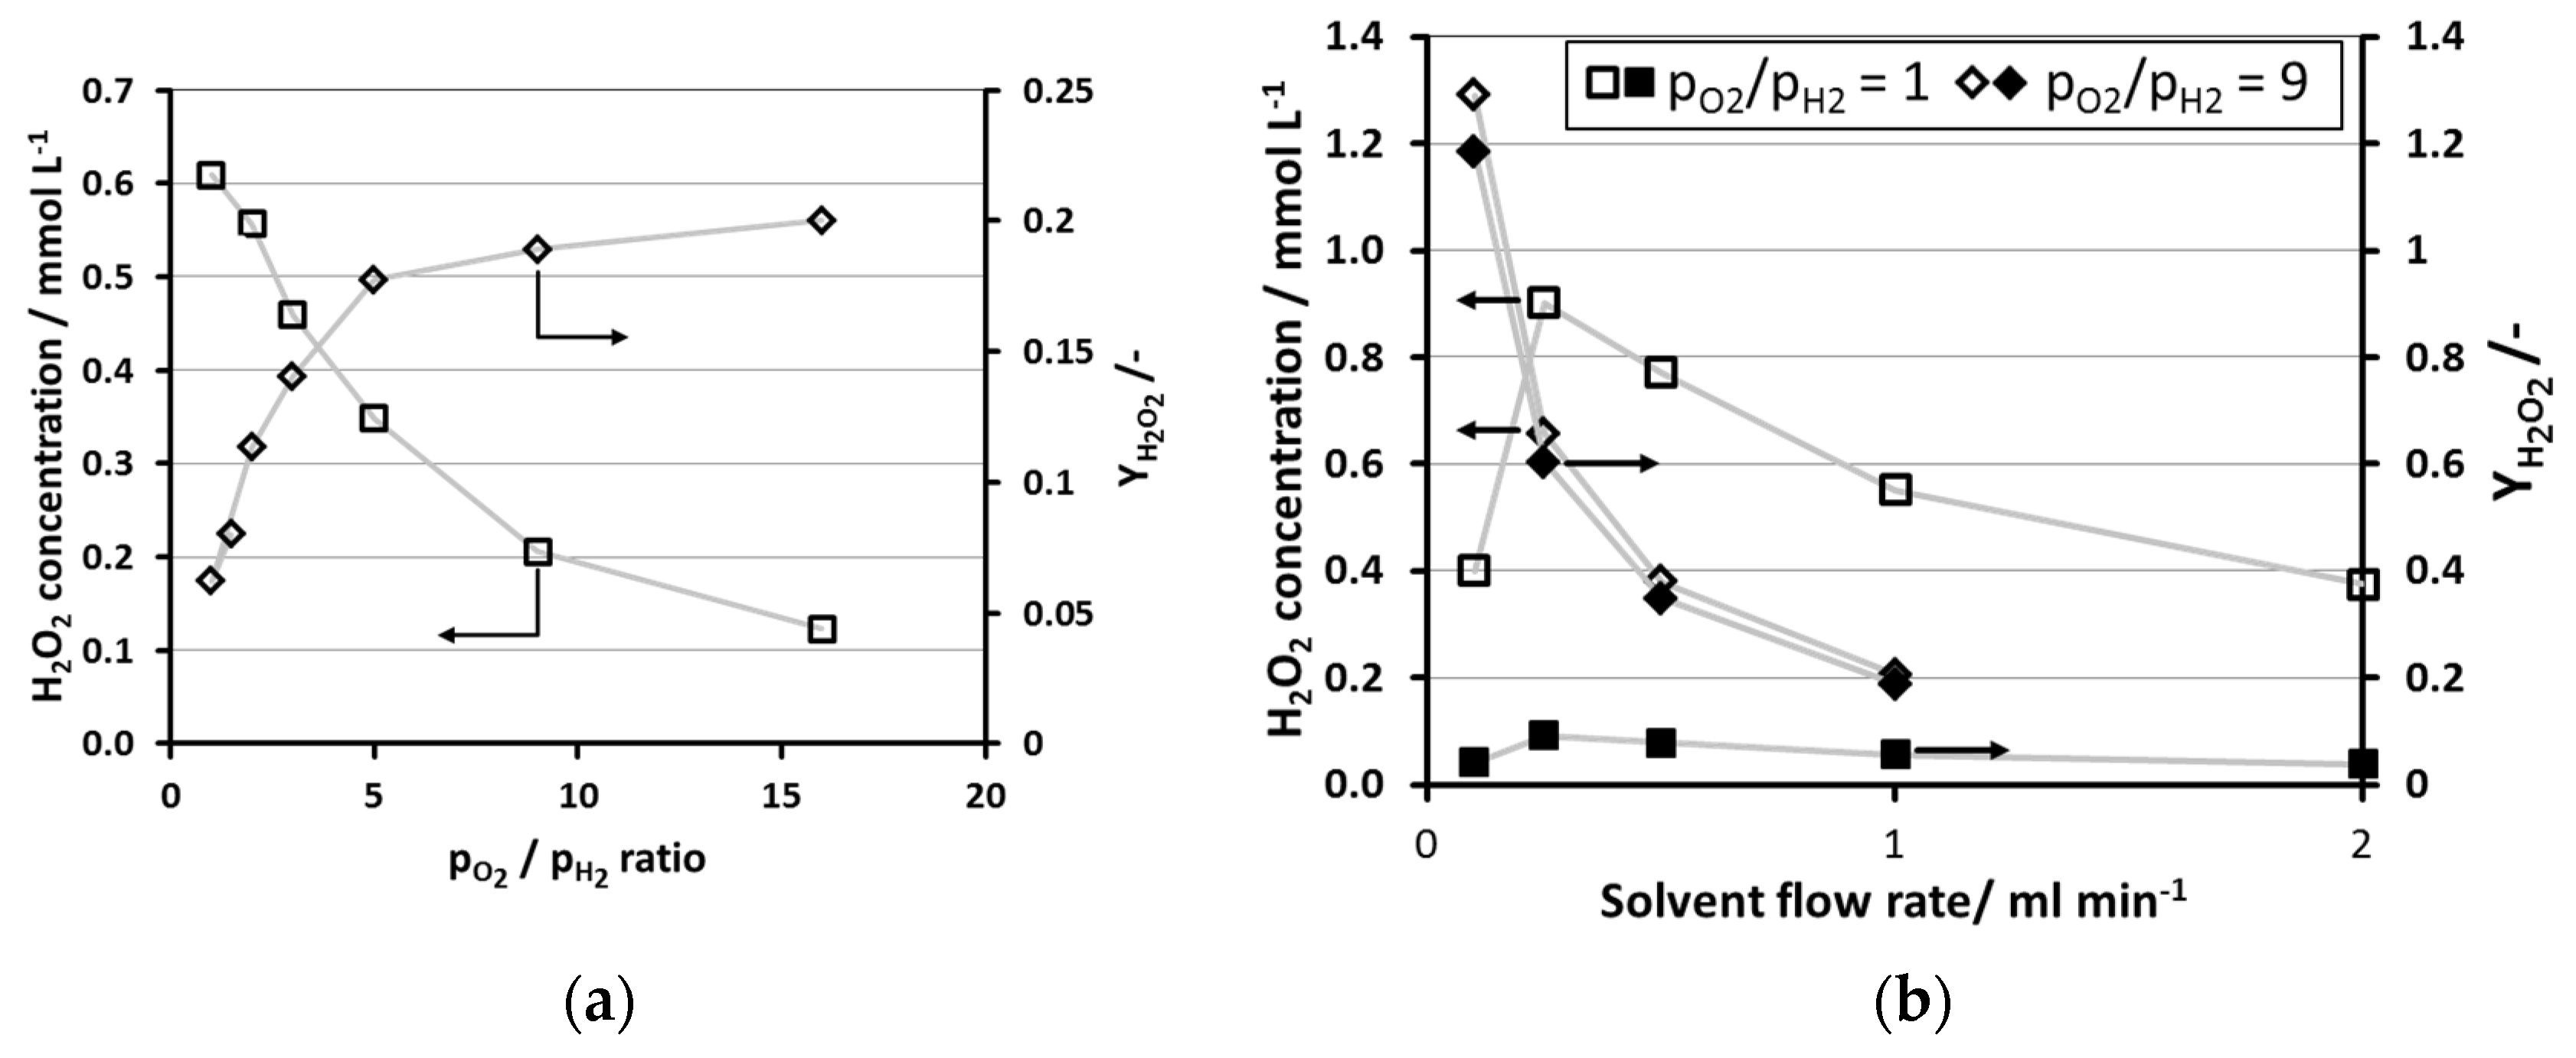
2.2. Influence of O2/H2-Ratio

The reactant concentration ratio is known to play a crucial role in the direct synthesis of H2O2. Even though the stoichiometry of the formation reaction should favor a reactant ratio of one, an excess of O2 favors the formation of H2O2. With the membrane micro reactor, the influence of the O2/H2-ratio on the synthesis was studied by diluting the H2 with N2 in the gas phase and thereby lowering its concentration in the liquid phase. This set of experiments was performed with a Pd/TiO2 catalyst as a fixed bed in the micro channel, varying the partial pressure ratio pO2/pH2 between 1 and 16 (Exp.-Nr.: 18–24 and Figure 3a). The H2O2 concentration is decreasing with increasing pO2/pH2 since less hydrogen is available for the formation reaction. The yield is increasing strongly from 5% to 18% when increasing the ratio from 1 to 5. Increasing the ratio further to 16 resulted in a weaker increase in yield to 20%. A residence time variation was then performed with a partial pressure ratio of 1 and 9, respectively (Exp.-Nr.: 13–17, 25–28 and Figure 3b). The typical relationship between H2O2 concentration and residence time was observed for equal reactant partial pressures with a maximum yield of 9%. In comparison, the H2O2 concentration and the yield are increasing linearly for a partial pressure ratio of 9. The maximum yield was 1.2 at the highest residence time tested. This indicates that a higher H2O2 concentration was achieved in comparison to the saturation concentration of H2 in water calculated with the H2 partial pressure in the H2 gas compartment according to Henry’s law. The linear increase in yield and product concentration further indicates that selectivity was almost unchanged even though the catalyst contact time was increased by a factor of 10. Therefore, excess O2 successfully slows down the consecutive reactions to water. Since excess O2 is present chemisorbed on the Pd surface during the reaction [30], it seems to be beneficial to have the Pd covered in O2 in order to prevent the catalyst from decomposing or hydrogenating the product.

2.3. Influence of System Pressure

The influence of the system pressure was studied using a Pd/TiO2 coating and by varying the pressure in the overall system between 10 and 50 bars at a partial pressure ratio of 1 (Exp.-Nr.: 29–33 and Figure 4). The Pd/TiO2 coating was used because of the easier implementation in the micro channel and the easier pressure control since pressure drop is lower in comparison to a fixed bed. The H2O2 concentration is increasing linearly with increasing pressure to a maximum of 6.5 mM at 50 bars. A yield between 15 and 18% for all pressures was observed. After 50 hours of operation, the activity of the catalyst started to decline until no more H2O2 was produced after 90 hours. To check for possible leaching or mechanical removal of particles, the experiment was repeated without additives (Exp.-Nr.: 34–37 and Figure 4). A linear dependence on the pressure and a stable yield was observed, similar to the experiment using stabilizers. A lower product concentration and a yield of 5 to 6% indicate a lower selectivity when no stabilizers are added to the solvent. Still, it was shown that keeping the partial pressure ratios constant and increasing the overall system pressure does not affect the catalyst selectivity as claimed in the literature by several research groups [40,47,49,58]. This shows that the productivity of our reactor can be scaled linearly with overall pressure and partial pressure of the reactants.

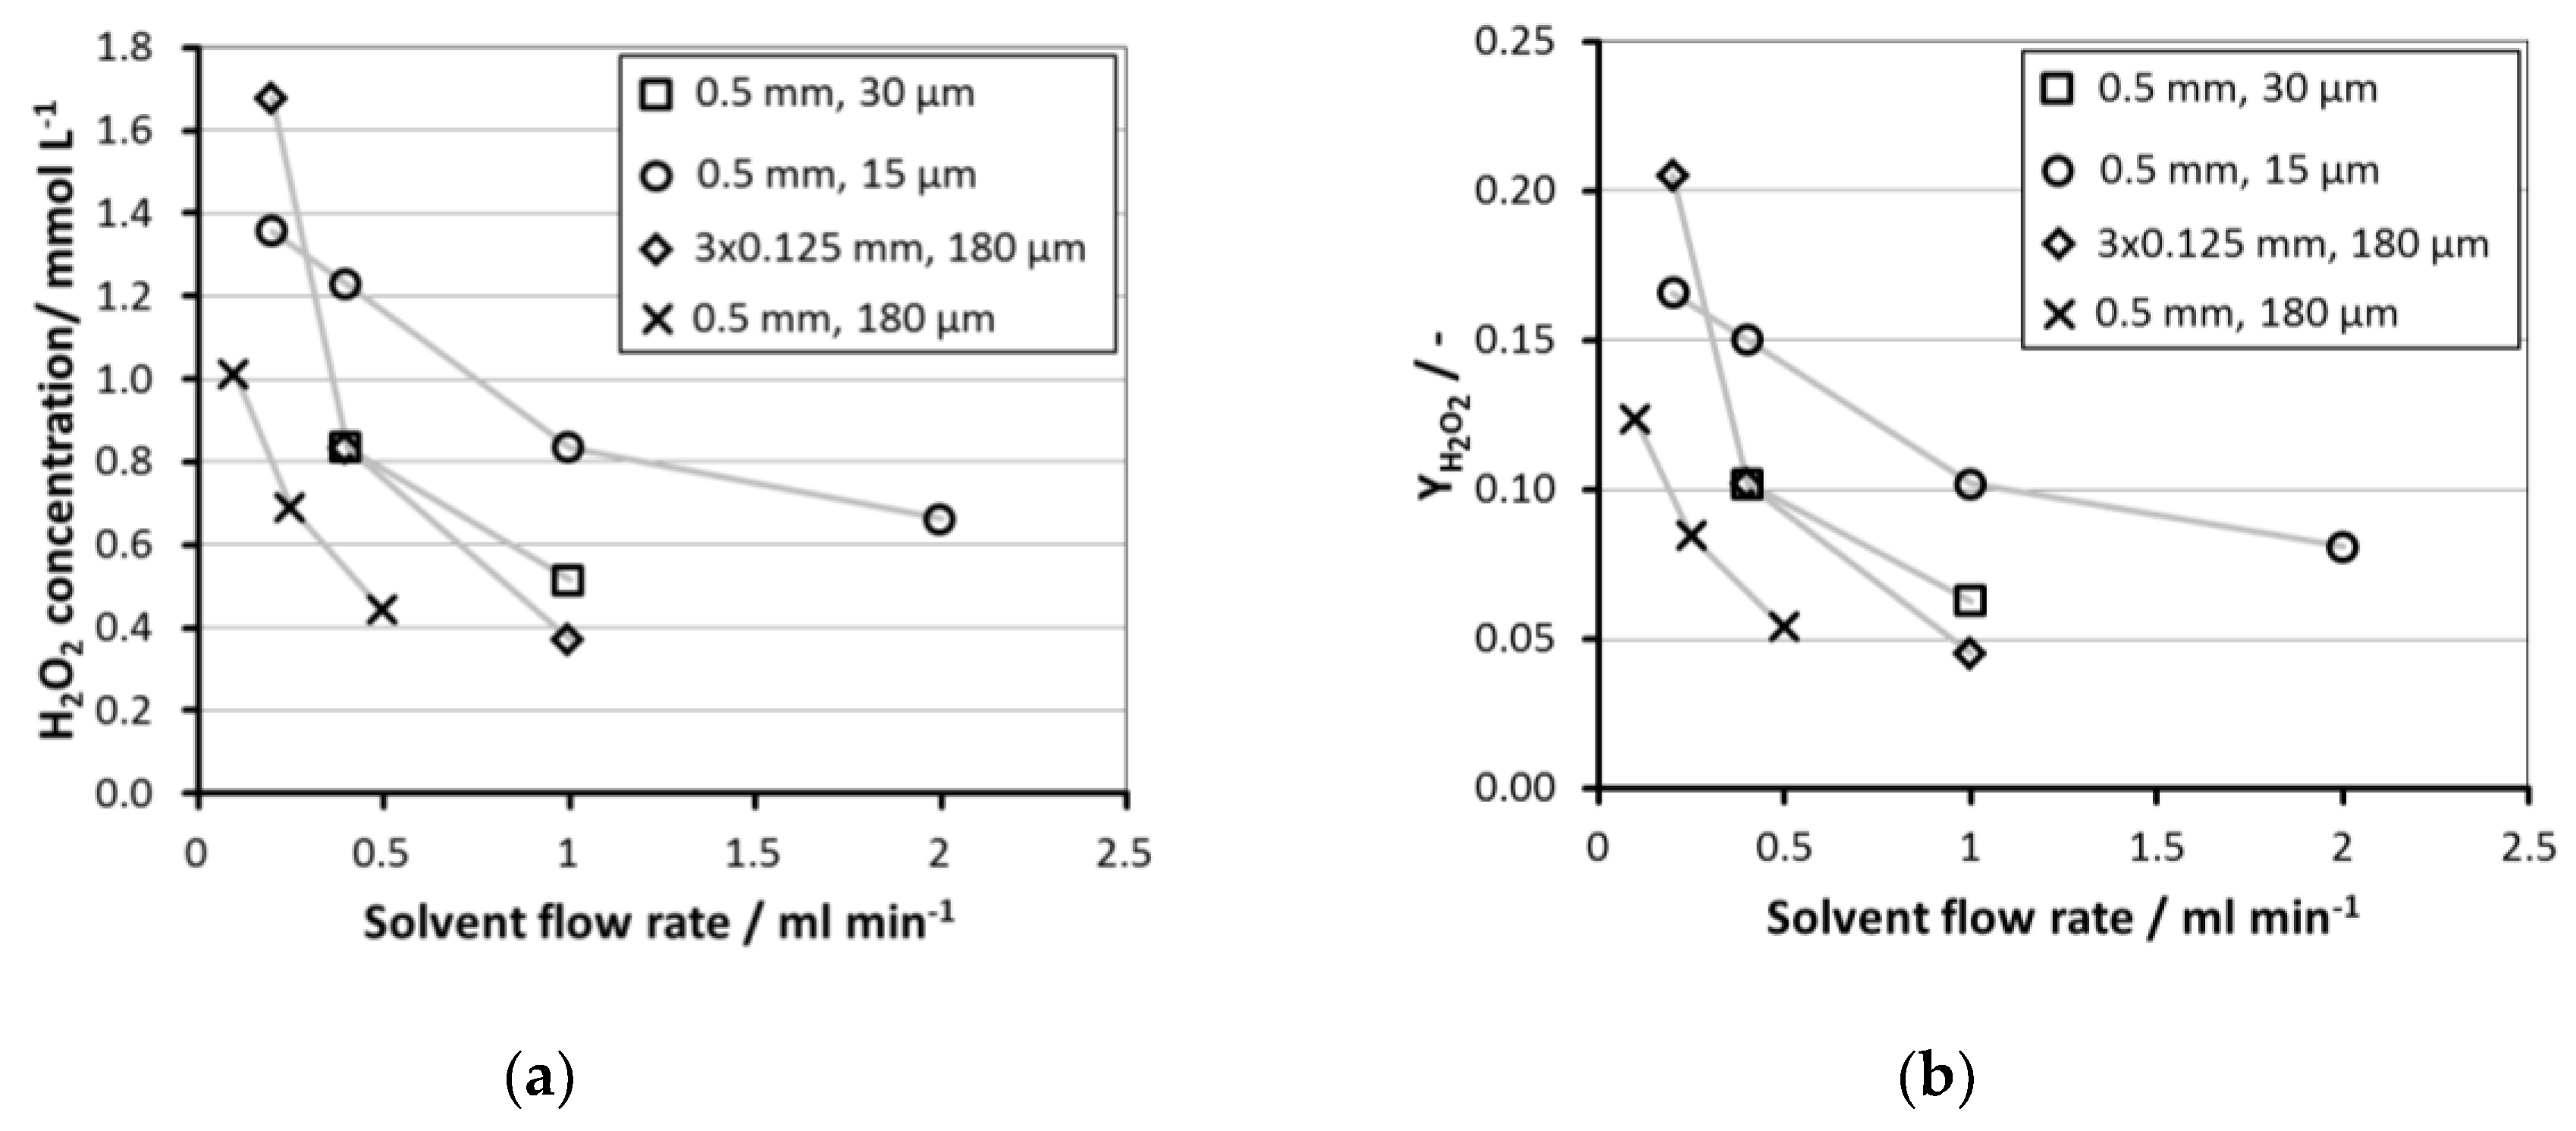
2.4. Influence of Micro Channel Depth and Membrane Thickness

At high flow rates it was shown that mass transfer through the membrane and transport within the channel are the limiting steps in the membrane micro reactor. In order to potentially increase mass transport, a plate with three parallel channels (depth of 0.125 mm) was manufactured and tested using Pd/TiO2 in a tubular fixed bed after the membrane micro device, equipped with the 180 μm thick membrane (Exp.-Nr.:46–48). In these experiments, the membrane micro reactor again only served as a saturator. The H2O2 concentration downstream the fixed bed was greatly increased in comparison to the micro channel with a depth of 0.5 mm (Exp.-Nr.: 38–40) at comparable conditions (Figure 5). This means that at the stated conditions saturation was not achieved at low residence times. The associated increase in yield from 8% for the 0.5 mm channel to 20% for the 3 × 0.125 mm channel at a similar flow rate of about 0.25 mL/min further indicates the limitations by mass transport within the channel since reactant partial pressures were maintained constant. The influence of mass transfer was studied by performing a set of experiments with two thinner Nafion® membranes with thicknesses of 15 and 30 μm in comparison to the 180 μm thick membrane with the 0.5 mm micro channel (Exp.-Nr.: 54–57, 63–64). As expected, the reduced thickness of the membrane also increased the H2O2 concentration and yield by increasing the mass transfer from the gas phase to the liquid phase. Therefore, the diffusivity of the reactant gases hydrogen and oxygen in the membrane material must be lower than in the free liquid phase. In the literature, permeabilities for hydrogen and oxygen through Nafion® membranes similar to the membrane used here are reported [59,60,61]. The permeability through Nafion® was found to increase linearly with humidity/water uptake, temperature and pressure [59]. Calculation of diffusion coefficients for hydrogen and oxygen for the membrane used based on the literature permeabilities leads to values between 1e−11 to 1e−10 m²/s at a pressure of 20 bars. Since liquid-phase diffusivity of gases is usually in the range of 1e−9 m²/s, diffusion through Nafion® is about one to two orders of magnitude slower in comparison with the free liquid phase. Theoretically, diffusion through Nafion® becomes faster than liquid phase diffusion at pressures above 100 bars. This indicates the feasibility of Nafion® in being able to improve the safety of H2O2 direct synthesis while delivering promising mass transfer properties for a membrane under these conditions.

2.5. Influence of Additives

Additives were found to play a crucial role in the direct synthesis reaction especially in a continuous system. Adding 5 mM NaBr to the solvent was found to be necessary to prevent hydrogenation of H2O2 in the presence of H2 in stainless steel equipment even after passivation with HNO3. Acids like H2SO4 and H3PO4 are also often used to further stabilize H2O2 and increase the yield of the reaction. The salts of sulfuric- and phosphoric acid certainly had a beneficial effect similar to NaBr. Furthermore, it is common belief that H+ has a positive effect in the formation of H2O2 [39] which, e.g., also motivated research on solid acids as catalyst supports to enhance selectivity [32,33]. To study the influence on our system, a set of experiments have been performed by controlling the pH value in the solvent via a sodium acetate buffer at pH 3 and comparing it to a solution with 5 mM H3PO4 and 25 mM H2SO4 to study the influence of H+ (Exp.-Nr. 46–53 and Figure 6). Addition of the sodium acetate buffer basically had no effect but addition of phosphoric and sulfuric acid showed an almost doubled H2O2 concentration (Exp.-Nr. 63–66 and Figure 6). From that experiment it is quite clear that H+ is less important for the selectivity of the reaction than the presence of stabilizing molecules. For further study of the addition of acids, a set of experiments was conducted; 5 mM H3PO4 and 25 mM H2SO4 were tested at 40 bars, and a stable H2O2 concentration of 6.5 mmol/L was measured at a H2 partial pressure of 10 bars over 4 hours resulting in a yield of 80%.

2.6. System Productivity

Comparing the two catalysts used for the reaction, the productivity of Pd/TiO2 was only slightly higher than of Pd/C, if production per mass of Pd is considered (Table 1 Exp.-Nr.: 1–9). Comparing experiments at the same conditions, both catalysts showed linearly increasing productivity with increasing solvent flow rate as also described by Biasi et al. [41,43], indicating the mass transfer limitation introduced by the membrane as found by other indicators in this work. A similar behavior was found for the PVC-tube fixed beds and the coating experiments. The productivity was also found to increase linearly with increasing system pressure. Hence, the highest productivity of 189 molH2O2/kgPd/h of the experiments conducted in this work was measured at 50 bar using a Pd/TiO2 coating (Table 1 Exp.-Nr.: 33). The second highest productivity of 110 molH2O2/kgPd/h of was achieved at 40 bars using a PVC-tube fixed bed and water with added H2SO4 and H3PO4 as solvent (Table 1 Exp.-Nr.: 67). In comparison with the literature, only Biasi et al. found similarly low productivities of 180 molH2O2/kgPd/h using methanol without additives as solvent in a trickle bed reactor. In continuous flow experiments, most of the groups found productivities between 1500 and 6000 molH2O2/kgPd/h [41,43,44,48,52,54,55,62]; only Kanungo et al. [46] stood out with achieving a productivity of 1,4300 molH2O2/kgPd/h by using coated microchannel capillaries. The reactors used in the literature were mostly trickle bed reactors, stirred autoclaves or microchannel trickle beds, and hence tri-phasic systems with the related safety issues. The increased gas-liquid mass transfer of these systems led to high productivities. Whereas, in this work, the gas-liquid mass transfer was limited by the Nafion® membranes used, which in return offered increased safety. Still, promising methods to further increase productivity of the system presented here were presented and discussed.

3. Materials and Methods

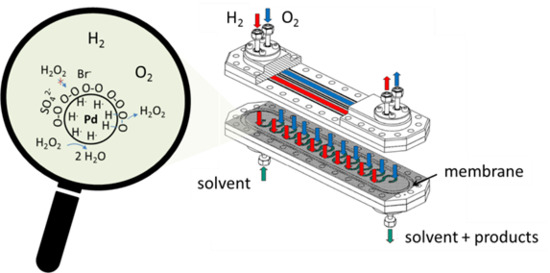
3.1. The Membrane Micro Channel Reactor

The reactor used in this work was designed to carry out the liquid phase direct synthesis of hydrogen peroxide in continuous mode. To achieve this, hydrogen and oxygen are fed separately and in an alternating fashion to the liquid solvent through a membrane along the reaction zone. The idea is to restore the concentration of the reactants while they are consumed by the reaction as well as to maintain the concentration ratio of the two reactants within a desired window even if they are not consumed according to the 1:1 stoichiometry of the target reaction. The gases are fed from two different gas chambers in the device to enable the usage of undiluted reactants at high pressures in order to increase their concentration in the liquid phase. The dissolved gases can then react with a catalyst present either in the micro channel or downstream. A scheme and a picture of the device have already been presented in Ref. [57] and are reproduced here in Figure 7. A frame holding the membrane is placed on top of a plate with a milled micro channel. The membrane frame and the gas chamber plate both have two longitudinal channels, one for each reactant gas. The frame enables thin and flexible membranes to be pressed against the micro channel plate. The meander-like form of the micro channel allows the liquid to switch the gas chambers beneath the membrane in order to alternately and repeatedly pick up both reactants on its way through the device. The liquid entry and exit is realized by holes at the ends of the channel leading to a bottom adapter plate. This design allows evaluation of different shapes of the micro channel to influence the residence time in the device and beneath each reactant gas chamber.
The meander shape was constructed by connecting twenty 275° circle segments with a diameter of 16 mm in the channel center to form a channel with a total length of 768 mm. From each circle segment, 180° is in contact with the membrane resulting in a membrane contact length per segment of 25 mm. Due to the wall between the gas chambers, a length of 13 mm is not in contact with the membrane between the circle segments. Channels with varying depth were used in this work: a single channel with a depth of 0.5 mm, a single channel with a depth of 0.125 mm and three parallel channels with depths of 0.125 mm. All channels had a total length of 768 mm and a width of 1 mm. The geometry is illustrated in Figure 8.
Membrane integration into the system is a crucial part of the reactor design. The requirements for the membrane are: chemical resistance, high resistance against liquid water breakthrough into the gas phase and high resistance against gas bubble breakthrough into the liquid phase. Nafion® was found to be suitable for this purpose. Nafion® is a sulfonated tetrafluoroethylene based on PTFE and is usually available as thin films or sheets. Integrating thin flexible sheets into the reactor design was solved by having two metal frames sandwiching one membrane sheet. Through the geometry of the metal frames, the membrane is pressed against the micro channel over two larger areas with a labyrinth seal (Figure 9a). The assembled membrane frame with a 15 μm thick Nafion® membrane after a test run in the system is shown in Figure 9b. Three membranes were used for the reaction experiments: a 180 μm thick reinforced Nafion® membrane (Fumasep F-101180-PTFE, Fumatech, Bietigheim-Bissingen, ‎Germany), a 30 μm reinforced Nafion® membrane (FUMAPEM® FS-930-RFS, Fumatech, Bietigheim-Bissingen, Germany) and a 15 μm non reinforced Nafion® membrane (FUMAPEM® FS-715-RFS, Fumatech, Bietigheim-Bissingen, Germany).

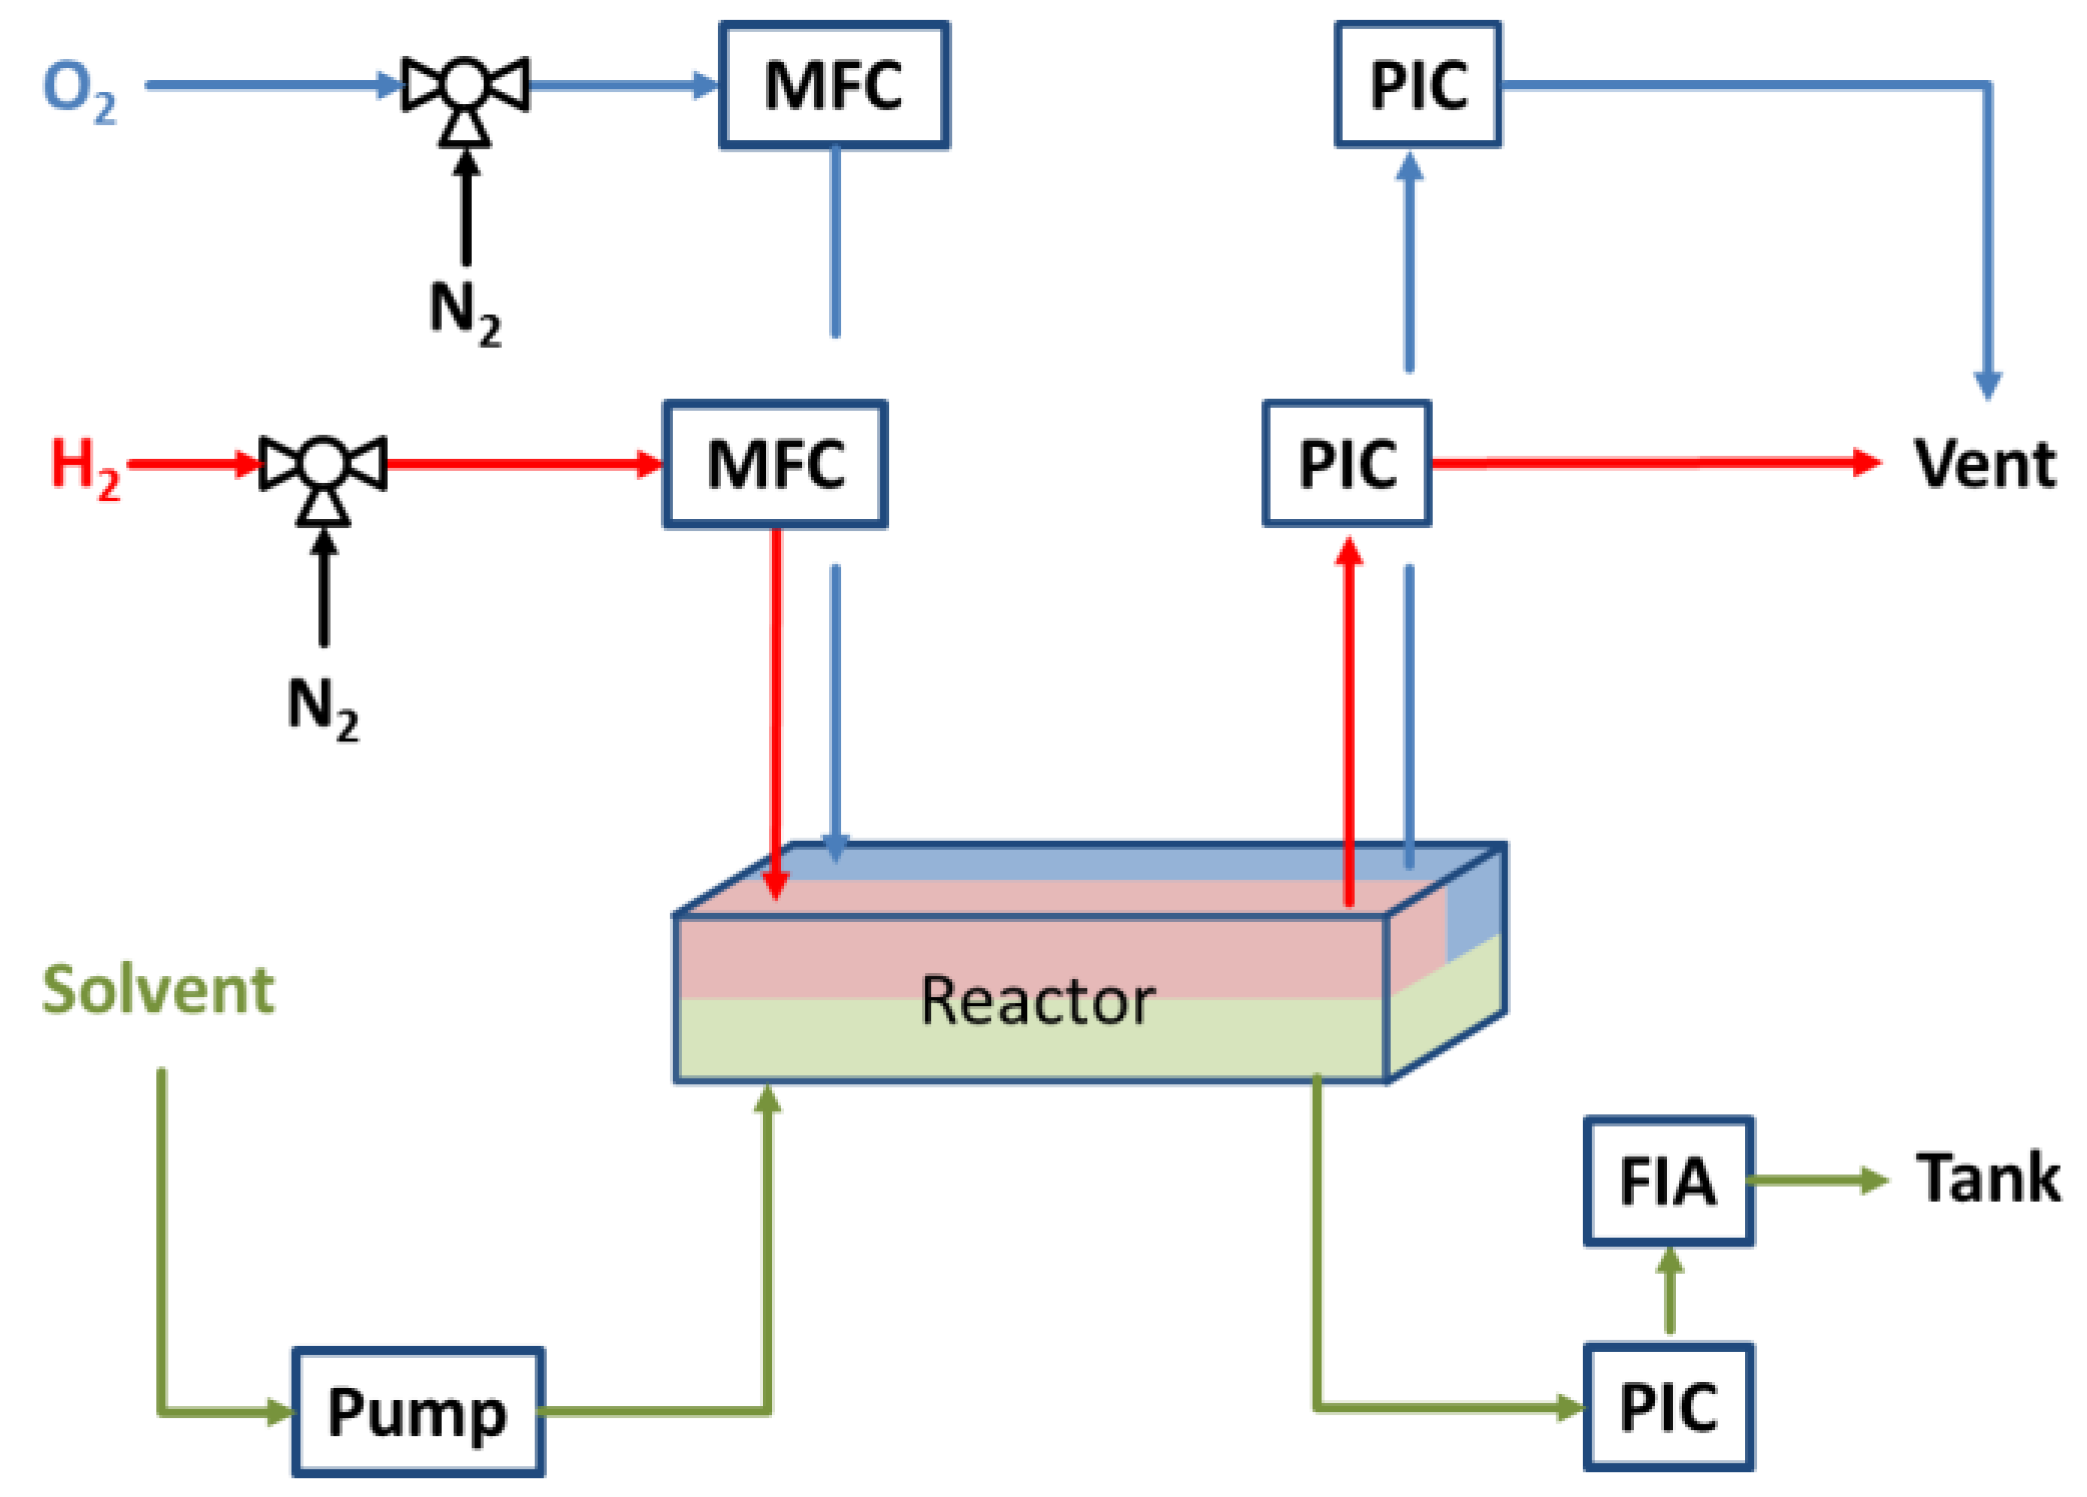
3.2. Experimental Setup for Direct Synthesis of Hydrogen Peroxide

The experimental setup to conduct the direct synthesis of hydrogen peroxide in continuous mode is schematically shown in Figure 10. The gaseous components, H2, O2 and N2 needed for start-up of the reactor as well as an optional diluent, were fed via mass flow controllers (EL-FLOW, Bronkhorst, Ruurlo, Netherlands) and the liquid solvent was introduced via a double syringe pump (Syrdos 2, Hitec Zang, Herzogenrath, Germany). System pressure was controlled with three automated backpressure controllers (EL-PRESS, Bronkhorst, Ruurlo, Netherlands), enabling a uniform and simultaneous pressure buildup of two gas streams and one liquid stream. At the exit of the system, the liquid solvent was analyzed for its H2O2 content. Therefore, it was either collected for cerimetric titration or fed to an automated flow injection analysis (FIA) in the later stages of the work. Stainless steel was used as tubing material in the setup and PEEK tubing was used for the FIA.
For cerimetric titration, several drops of Ferroin solution were added to acidified water (1:19 H2SO4/H2O wt.-%). The red solution was then titrated using a standardized 0.01 N cerium sulfate solution (prepared by dilution of 0.1 N CeSO4 solution (35066, Honeywell, Morristown, NJ, USA) with 1 mol/L H2SO4 in H2O) until the color changed to pale blue. At this point, the red Fe(II) was fully oxidized to blue Fe(III). In the next step, the hydrogen peroxide-containing solution was added. Subsequently, the color changed to purple or light red depending on the H2O2 concentration. By addition of the standardized cerium sulfate solution, the color changed first to a deeper red and then again to blue since 2 moles of Ce(IV) are needed to react H2O2 to oxygen and Ce(III). The reaction equation is shown in Equation 5 and the H2O2 concentration was calculated by Equation (6).
  2   C e ( I V )   +   H 2 O 2     2   C e ( I I I )   + 2   H + +   O 2  
  c H 2 O 2 = c C e S O 4 , s o l . · m s a m p l e · ρ C e S O 4 , s o l . 2 · m C e S O 4 , s o l . · ρ s a m p l e  
with: ρ C e S O 4 , s o l . = 1.11 kg/m3; ρ s a m p l e = 1 kg/m3.
The automated flow injection system (FIA) was based on a system first described by Pashkova et al. in 2009 [63]. In the FIA, H2O2 is contacted with titanium(IV) oxysulfate to form an orange-colored complex which is then detected by a UV-Vis spectrometer (“DT-MINI-2-GS” light source with “USB4000-UV-VIS” detector, Ocean Optics, Largo, FL, USA) measuring the absorbance at 409 nm. H2O2 concentration in the effluent can then be calculated based on a calibration curve.
The yield of hydrogen peroxide is defined as the ratio of the overall rate of hydrogen peroxide production delivered by the reactor divided by the hydrogen or the oxygen feed rate. In the present system, however, with separate dosage of the two gases and the solvent, a balance over the liquid phase only appears more meaningful. Unfortunately, this suffers from the difficulty of assessing the amount of the respective gas effectively introduced in the liquid via the membrane, e.g., from measurements of the gas flows into and out of the two gas compartments or from simultaneous measurements of the hydrogen peroxide and water production rates. The former is impeded by the fact that only a small amount of the gas supplied to the gas chamber enters into the liquid, whereas the latter is obviously not possible for aqueous solvents. For the same reasons, neither the conversion nor the selectivity can be assessed.
Therefore, a simplified hydrogen-based yield of hydrogen peroxide Y H 2 O 2 is introduced here by division of the H2O2 concentration measured at the reactor outlet c H 2 O 2   F I A by the H2 concentration in the liquid phase in contact with the gas via the membrane c H 2   s a t , assuming saturation of the liquid at the given partial pressure of hydrogen in the H2 gas chamber (Equation 7). The H2 concentration in the liquid was calculated from Henry’s law (Equation 8).
  Y H 2 O 2 = c H 2 O 2 c H 2   s a t  
  c H 2   s a t = p H 2   · H H 2 , H 2 O c p  
with: Henry constant in water H H 2 , H 2 O c p (taken from the DETHERM database [64]).
Note, that according to this definition, a hydrogen peroxide yield of one indicates that an amount of hydrogen peroxide has been formed which corresponds to saturation of the liquid phase under the conditions prevailing at the membrane interface between the hydrogen gas chamber and the liquid. Consequently, if re-saturation of the liquid occurs, then the hydrogen peroxide yield may reach values well above one.

3.3. Experimental Procedure

First, the membrane micro channel reactor was prepared and introduced into the laboratory set up without connecting the tubes for the liquid stream to prevent any unintentional liquid entry. Then nitrogen was fed to both gas chambers with a flow rate of 100 NmL/min and pressure was built up to 2 bars gauge. This forced the flexible membrane to be pressed against the micro channel plate, to ensure that the liquid followed the path of the micro channel. Afterwards, the tubes for the liquid flow were connected and the liquid feed was started, usually demineralized water with additives at a flow rate of 1 mL/min. After ensuring a constant liquid flow at the exit of the liquid pressure control valve, the pressure was increased in both gas phases and in the liquid phase, while always maintaining 2 bars differential pressure between gas and liquid. When the desired pressure was reached in the liquid phase, e.g., 10 bars, the gas phase pressures were reduced to give a differential pressure of 100 mbar between gas and liquid, e.g., 10.1 bar in both gas phases and 10 bar in the liquid phase. In order to always ensure a higher pressure in the gas phases, the liquid pressure was controlled using the pressure at the reactor inlet. If liquid pressure became greater than the gas phase pressure, the membrane was lifted off the channel top and the liquid was no longer following the micro channel. Finally, the gas feed was changed to hydrogen and oxygen in order to start the reaction.
Downstream of the reactor, the hydrogen peroxide concentration was determined. Cerimetric titration was applied for the earlier experiments (Table 1, Exp.-Nr.: 1–28). Samples of about 2 mL were collected and analyzed every 5 to 20 minutes and this was repeated until the titrated concentration was found to be stable over a period of 30 to 90 minutes depending on the flow rate of the liquid. For the latter experiments (Table 1, Exp.-Nr.: 29–66), each experiment was run for several hours, usually between 4 and 8 h, and one measurement was performed every 5 min with the FIA. The stable H2O2 concentration was then averaged over the time of the experimental run.
Commercial 5 wt.-% Pd/C (75992, Sigma-Aldrich, St. Louis, MO, USA) and self-prepared 1 wt.-% Pd/TiO2 were chosen as catalysts for the reaction since both had shown high selectivity and reaction rates according to the literature [51,55,65]. Pd/TiO2 was prepared according to a reported wet impregnation method [51]. The procedure as well as catalyst characterization was reported previously [30]. Three different catalyst arrangements were tested. The 5 wt.-% Pd/C was diluted with active carbon (242276 Sigma-Aldrich, St. Louis, MO, USA) in a ratio of 1:9, pressed, crushed and sieved to a fraction of 100 to 250 μm, and finally 200 mg of this mixture was filled in the micro channel to form a fixed bed. Also, 200 mg of Pd/TiO2 was sieved to 100 to 250 μm and tested as a fixed bed in the channel. Glass wool was placed in the tube leading to and from the micro channel to hold the catalysts in place. Pd/TiO2 was also tested as a coating. For this, Pd/TiO2 was ground, stirred in acetone, and then added to the micro channel using a pipette. After drying, the particles were stuck to the walls of the micro channel. Under experimental conditions, the layer was found to give stable reaction rates over a time period of 2 days, afterwards, particle discharge led to rapidly declining activity. Lastly, a tubular fixed bed was prepared by sandwiching 50, 100 and 200 mg of 1 wt.-% Pd/TiO2 sieved to 100 to 250 μm with glass wool in a 6 mm PVC tube. The tubular fixed bed was applied as a third option for catalyst integration since pressure control of the micro channel fixed bed was challenging and led to numerous membrane lift offs due to the high pressure drop, and catalyst discharge was found to occur when the catalyst coating was used. A photo or illustration of each catalyst arrangement is shown in Figure 11.
Residence time variations were performed by varying the flow rate of the liquid solvent between 0.1 and 3 mL/min. Pressure variations have been examined by varying the total system pressure between 10 and 50 bars. Furthermore, the influence of the O2/H2-ratio on the reaction has been examined by diluting H2 with N2 in the gas phase and thereby, varying the liquid phase concentration through the H2 partial pressure. The O2/H2-ratio was varied between 1 and 16. The influence of the permeability was studied by performing the reaction applying reinforced Nafion® membranes with a thickness of 180 μm and 30 μm. The influence of acids, their salts, and the pH value on the reaction was studied by performing the reaction with different additives in demineralized water: a sodium acetate buffer at pH 3 (60 mM CH3COOH, 1 mM CH3COONa) and a solution with 5 mM H3PO4 and 25 mM H2SO4. The reaction experiments performed in this work are summarized in Table 1 for an easier overview.
During the course of this work, it was found that stainless steel equipment and traces of catalyst can easily decompose H2O2. This was noted when feeding a solution of 7 mM H2O2 in water to the system and recording the H2O2 concentration at the exit of the system. Therefore, the setup was passivated by flushing all stainless steel parts with a HNO3 solution [66]. After passivation, a concentration of 5 mM NaBr in the feed was found to be sufficient to prevent any decomposition in stainless steel equipment even when H2 is present. The passivation procedure was applied and the setup was thoroughly cleaned once it had been found that catalyst traces were present after the coating experiments (Table 1, Exp.-Nr.: 29–37). Experiments affected by catalyst traces are obviously not shown in this work and are neither part of the experimental discussion.

4. Conclusions

This work reports for the first time an experimental evaluation of a membrane micro channel reactor designed to safely perform the direct synthesis of hydrogen peroxide at elevated pressure with undiluted reactants in a liquid solvent. The results revealed unknown relationships between reactor design and reaction conditions in a system of this kind. The Nafion® membranes used in this work were found to introduce a mass transfer resistance as shown by solvent flow rate variations and the influence on product concentration and productivity. Usage of Nafion® membranes with reduced thickness showed an increased mass transfer. In theory, by increasing system pressure, the mass transport can be increased to a point were liquid-phase diffusion becomes the rate-limiting step. Therefore, Nafion® can be considered suitable, as it performed great in regards to its technical properties. Even though Nafion® was found to limit the reaction, it was shown that reducing the depth of the micro channel still was able to further increase product formation.
The yield of the system was found to be greatly dependent on two factors, stabilizers and reactant ratio. A combination of NaBr, H2SO4 and H3PO4 was found to greatly increase product yield in comparison to other combinations. In contrast, addition of a sodium acetate buffer at pH 3 to the solvent containing 5 mM NaBr showed only minimal benefits. Hence, the salts of the stabilizers seem to be more relevant than the acidic function. A similar effect was found by varying the reactant ratio. Increasing the pO2/pH2 ratio to a value of 5 to 10 vastly increased the yield of the system. If hydrogen is the limiting reagent, then the Pd surface must be covered with oxygen. In conclusion, excess oxygen and stabilizers both prevent hydrogenation of the product, most probably by hindering the adsorption of hydrogen peroxide on the Pd surface.
Even with stabilizers, without increased pO2/pH2 ratio, the yield was limited to about 20%. With the introduction of excess oxygen it was possible to increase the yield to 80% in an experiment where the reactor was used only for gas dosage and reaction was performed downstream. In experiments where the catalyst was present within the micro channel it was possible to achieve hydrogen peroxide concentrations above the saturation concentration of hydrogen. This proves the ability of the reactor to feed the reactants continuously over the length of the micro channel without having the reactants in contact in the gas phase. Furthermore, linear dependency of productivity on pressure, adjustability of reactant ratio, several degrees of freedom in regards to the micro channel design, and exploitation of high pressures further proves the feasibility of the membrane microchannel reactor. The knowledge gained in this work provides the basis to enhance productivity and product concentration of this system in future studies.

Author Contributions

Conceptualization, M.S.; methodology, M.S., M.K. and R.D.; validation, M.S. and M.K.; investigation, M.S.; writing—original draft preparation, M.S.; writing—review and editing, M.K. and R.D.; visualization, M.S.; supervision, M.K. and R.D.; project administration, R.D.

Funding

We would like to thank the Helmholtz Association for funding within the program Science and Technology of Nanosystems (STN).

Acknowledgments

We acknowledge support by Deutsche Forschungsgemeinschaft and Open Access Publishing Fund of Karlsruhe Institute of Technology.

Conflicts of Interest

The authors declare no conflict of interest

References

  1. Dittmeyer, R.; Boeltken, T.; Piermartini, P.; Selinsek, M.; Loewert, M.; Dallmann, F.; Kreuder, H.; Cholewa, M.; Wunsch, A.; Belimov, M.; et al. Micro and micro membrane reactors for advanced applications in chemical energy conversion. Curr. Opin. Chem. Eng. 2017, 17, 108–125. [Google Scholar] [CrossRef]
  2. Anastas, P.T.; Warner, J.C. Green Chemistry: Theory and Practice; Oxford University Press: Oxford, UK, 2000; Volume 30. [Google Scholar]
  3. Edwards, J.K.; Freakley, S.J.; Lewis, R.J.; Pritchard, J.C.; Hutchings, G.J. Advances in the direct synthesis of hydrogen peroxide from hydrogen and oxygen. Catal. Today 2015, 248, 3–9. [Google Scholar] [CrossRef]
  4. Henkel, H.; Weber, W. Manufacture of Hydrogen Peroxide. U.S. Patent 1108752, 25 August 1914. [Google Scholar]
  5. Gosser, L.W. Catalytic Process for Making H2O2 from Hydrogen and Oxygen. U.S. Patent 4681751, 21 July 1987. [Google Scholar]
  6. Centi, G.; Perathoner, S.; Abate, S. Direct synthesis of hydrogen peroxide: Recent advances. Mod. Heterog. Oxid. Catal. Des. React. Charact. 2009, 253–287. [Google Scholar] [CrossRef]
  7. Haas, T.; Stochniol, G.; Rollmann, J. Direct Synthesis of Hydrogen Peroxide and Integration Thereof into Oxidation Processes. U.S. Patent 6764671, 20 July 2004. [Google Scholar]
  8. Haas, T.; Stochniol, G.; Rollmann, J. Direct Synthesis of Hydrogen Peroxide and Integration Thereof into Oxidation Processes. U.S. Patent 7005528, 28 February 2006. [Google Scholar]
  9. Parasher, S.; Rueter, M.; Zhou, B. Nanocatalyst Anchored onto Acid Functionalized Solid Support and Methods of Making and Using Same. U.S. Patent 7045481, 16 May 2006. [Google Scholar]
  10. Rueter, M.; Zhou, B.; Parasher, S. Process for Direct Catalytic Hydrogen Peroxide Production. U.S. Patent 7144565, 5 December 2006. [Google Scholar]
  11. BusinessWire Web Page. Available online: https://www.businesswire.com/news/home/20050309005685/en/DegussaHeadwaters-Pilot-Plant-Validates-New-Technology (accessed on 26 October 2018).
  12. Goor, G.; Glenneberg, J.; Jacobi, S. Hydrogen peroxide. In Ullmann’s Encyclopedia of Industrial Chemistry; Wiley-VCH: Weinheim, Germany, 2000. [Google Scholar]
  13. United States Environmental Protection Agency Web Page. Available online: https://www.epa.gov/greenchemistry/presidential-green-chemistry-challenge-2007-greener-reaction-conditions-award (accessed on 26 October 2018).
  14. García-Serna, J.; Moreno, T.; Biasi, P.; Cocero, M.J.; Mikkola, J.-P.; Salmi, T.O. Engineering in direct synthesis of hydrogen peroxide: Targets, reactors and guidelines for operational conditions. Green Chem. 2014, 16, 2320–2343. [Google Scholar] [CrossRef]
  15. Evonik Industries AG Web Page. Available online: https://corporate.evonik.com/en/media/press_releases/Pages/news-details.aspx?newsid=45021 (accessed on 25 October 2018).
  16. Ciriminna, R.; Albanese, L.; Meneguzzo, F.; Pagliaro, M. Hydrogen peroxide: A Key chemical for today’s sustainable development. ChemSusChem 2016, 9, 3374–3381. [Google Scholar] [CrossRef] [PubMed]
  17. Lunsford, J.H. The direct formation of H2O2 from H2 and O2 over palladium catalysts. J. Catal. 2003, 216, 455–460. [Google Scholar] [CrossRef]
  18. Samanta, C. Direct synthesis of hydrogen peroxide from hydrogen and oxygen: An overview of recent developments in the process. Appl. Catal. A Gen. 2008, 350, 133–149. [Google Scholar] [CrossRef]
  19. Dittmeyer, R.; Grunwaldt, J.-D.; Pashkova, A. A review of catalyst performance and novel reaction engineering concepts in direct synthesis of hydrogen peroxide. Catal. Today 2015, 248, 149–159. [Google Scholar] [CrossRef]
  20. Campos-Martin, J.M.; Blanco-Brieva, G.; Fierro, J.L. Hydrogen peroxide synthesis: An outlook beyond the anthraquinone process. Angew. Chem. Int. Ed. 2006, 45, 6962–6984. [Google Scholar] [CrossRef] [PubMed]
  21. Landon, P.; Collier, P.J.; Carley, A.F.; Chadwick, D.; Papworth, A.J.; Burrows, A.; Kiely, C.J.; Hutchings, G.J. Direct synthesis of hydrogen peroxide from H2 and O2 using Pd and Au catalysts. Phys. Chem. Chem. Phys. 2003, 5, 1917–1923. [Google Scholar] [CrossRef]
  22. Freakley, S.J.; He, Q.; Harrhy, J.H.; Lu, L.; Crole, D.A.; Morgan, D.J.; Ntainjua, E.N.; Edwards, J.K.; Carley, A.F.; Borisevich, A.Y. Palladium-tin catalysts for the direct synthesis of H2O2 with high selectivity. Science 2016, 351, 965–968. [Google Scholar] [CrossRef] [PubMed]
  23. Tian, P.; Xu, X.; Ao, C.; Ding, D.; Li, W.; Si, R.; Tu, W.; Xu, J.; Han, Y.-F. Direct and selective synthesis of hydrogen peroxide over palladium–tellurium catalysts at ambient pressure. ChemSusChem 2017, 10, 3342–3346. [Google Scholar] [CrossRef] [PubMed]
  24. Biasi, P.; Mikkola, J.-P.; Sterchele, S.; Salmi, T.; Gemo, N.; Shchukarev, A.; Centomo, P.; Zecca, M.; Canu, P.; Rautio, A.-R. Revealing the role of bromide in the H2O2 direct synthesis with the catalyst wet pretreatment method (CWPM). AIChE J. 2017, 63, 32–42. [Google Scholar] [CrossRef]
  25. Ouyang, L.; Tian, P.; Da, G.; Xu, X.-C.; Ao, C.; Chen, T.; Si, R.; Xu, J.; Han, Y.-F. The origin of active sites for direct synthesis of H2O2 on Pd/TiO2 catalysts: Interfaces of Pd and PdO domains. J. Catal. 2015, 321, 70–80. [Google Scholar] [CrossRef]
  26. Ouyang, L.; Da, G.; Tian, P.; Chen, T.; Xu, J.; Han, Y.-F. Insight into active sites of Pd–Au/TiO2 catalysts in hydrogen peroxide synthesis directly from H2 and O2. J. Catal. 2014, 311, 129–136. [Google Scholar] [CrossRef]
  27. Arrigo, R.; Schuster, M.E.; Xie, Z.; Yi, Y.; Wowsnick, G.; Sun, L.L.; Hermann, K.E.; Friedrich, M.; Kast, P.; Hävecker, M. Nature of the N–Pd interaction in nitrogen-doped carbon nanotube catalysts. ACS Catal. 2015, 5, 2740–2753. [Google Scholar] [CrossRef]
  28. Arrigo, R.; Schuster, M.E.; Abate, S.; Giorgianni, G.; Centi, G.; Perathoner, S.; Wrabetz, S.; Pfeifer, V.; Antonietti, M.; Schlögl, R. Pd supported on carbon nitride boosts the direct hydrogen peroxide synthesis. ACS Catal. 2016, 6, 6959–6966. [Google Scholar] [CrossRef]
  29. Plauck, A.; Stangland, E.E.; Dumesic, J.A.; Mavrikakis, M. Active sites and mechanisms for H2O2 decomposition over Pd catalysts. Proc. Natl. Acad. Sci. USA 2016, 113, E1973–E1982. [Google Scholar] [CrossRef] [PubMed]
  30. Selinsek, M.; Deschner, B.J.; Doronkin, D.E.; Sheppard, T.L.; Grunwaldt, J.-D.; Dittmeyer, R. Revealing the Structure and Mechanism of Palladium during Direct Synthesis of Hydrogen Peroxide in Continuous Flow Using Operando Spectroscopy. ACS Catal. 2018, 8, 2546–2557. [Google Scholar] [CrossRef]
  31. Tian, P.; Ouyang, L.; Xu, X.; Ao, C.; Xu, X.; Si, R.; Shen, X.; Lin, M.; Xu, J.; Han, Y.-F. The origin of palladium particle size effects in the direct synthesis of H2O2: Is smaller better? J. Catal. 2017, 349, 30–40. [Google Scholar] [CrossRef]
  32. Lee, J.W.; Kim, J.K.; Kang, T.H.; Lee, E.J.; Song, I.K. Direct synthesis of hydrogen peroxide from hydrogen and oxygen over palladium catalyst supported on heteropolyacid-containing ordered mesoporous carbon. Catal. Today 2017, 293, 49–55. [Google Scholar] [CrossRef]
  33. Blanco-Brieva, G.; Montiel-Argaiz, M.; Desmedt, F.; Miquel, P.; Campos-Martin, J.M.; Fierro, J.L.G. Effect of the Acidity of the Groups of Functionalized Silicas on the Direct Synthesis of H2O2. Top. Catal. 2017, 60, 1151–1155. [Google Scholar] [CrossRef]
  34. Tu, R.; Li, L.; Zhang, S.; Chen, S.; Li, J.; Lu, X. Carbon-modified mesoporous anatase/TiO2 (B) whisker for enhanced activity in direct synthesis of hydrogen peroxide by palladium. Catalysts 2017, 7, 175. [Google Scholar] [CrossRef]
  35. Seo, M.; Lee, D.-W.; Han, S.S.; Lee, K.-Y. Direct synthesis of hydrogen peroxide from hydrogen and oxygen over mesoporous silica-shell-coated, palladium-nanocrystal-grafted SiO2 nanobeads. ACS Catal. 2017, 7, 3039–3048. [Google Scholar] [CrossRef]
  36. Grabow, L.C.; Hvolbæk, B.; Falsig, H.; Nørskov, J.K. Search directions for direct H2O2 synthesis catalysts starting from Au 12 nanoclusters. Top. Catal. 2012, 55, 336–344. [Google Scholar] [CrossRef]
  37. Deguchi, T.; Iwamoto, M. Catalytic properties of surface sites on Pd clusters for direct H2O2 synthesis from H2 and O2: A DFT study. J. Phys. Chem. C 2013, 117, 18540–18548. [Google Scholar] [CrossRef]
  38. Staykov, A.; Kamachi, T.; Ishihara, T.; Yoshizawa, K. Theoretical study of the direct synthesis of H2O2 on Pd and Pd/Au surfaces. J. Phys. Chem. C 2008, 112, 19501–19505. [Google Scholar] [CrossRef]
  39. Wilson, N.M.; Flaherty, D.W. Mechanism for the direct synthesis of H2O2 on Pd clusters: Heterolytic reaction pathways at the liquid–solid interface. J. Am. Chem. Soc. 2015, 138, 574–586. [Google Scholar] [CrossRef] [PubMed]
  40. Yi, Y.; Wang, L.; Li, G.; Guo, H. A review on research progress in the direct synthesis of hydrogen peroxide from hydrogen and oxygen: Noble-metal catalytic method, fuel-cell method and plasma method. Catal. Sci. Technol. 2016, 6, 1593–1610. [Google Scholar] [CrossRef]
  41. Biasi, P.; Menegazzo, F.; Pinna, F.; Eränen, K.; Salmi, T.O.; Canu, P. Continuous H2O2 direct synthesis over PdAu catalysts. Chem. Eng. J. 2011, 176, 172–177. [Google Scholar] [CrossRef]
  42. Biasi, P.; Canu, P.; Menegazzo, F.; Pinna, F.; Salmi, T.O. Direct synthesis of hydrogen peroxide in a trickle bed reactor: Comparison of Pd-based catalysts. Ind. Eng. Chem. Res. 2012, 51, 8883–8890. [Google Scholar] [CrossRef] [Green Version]
  43. Biasi, P.; García-Serna, J.; Bittante, A.; Salmi, T. Direct synthesis of hydrogen peroxide in water in a continuous trickle bed reactor optimized to maximize productivity. Green Chem. 2013, 15, 2502–2513. [Google Scholar] [CrossRef]
  44. Paunovic, V.; Ordomsky, V.; D’angelo, M.F.N.; Schouten, J.C.; Nijhuis, T.A. Direct synthesis of hydrogen peroxide over Au–Pd catalyst in a wall-coated microchannel. J. Catal. 2014, 309, 325–332. [Google Scholar] [CrossRef]
  45. Paunovic, V.; Schouten, J.C.; Nijhuis, T.A. Direct synthesis of hydrogen peroxide using concentrated H2 and O2 mixtures in a wall-coated microchannel–kinetic study. Appl. Catal. A Gen. 2015, 505, 249–259. [Google Scholar] [CrossRef]
  46. Kanungo, S.; Paunovic, V.; Schouten, J.C.; Neira D’Angelo, M.F. Facile synthesis of catalytic AuPd nanoparticles within capillary microreactors using polyelectrolyte multilayers for the direct synthesis of H2O2. Nano Lett. 2017, 17, 6481–6486. [Google Scholar] [CrossRef] [PubMed]
  47. Freakley, S.J.; Piccinini, M.; Edwards, J.K.; Ntainjua, E.N.; Moulijn, J.A.; Hutchings, G.J. Effect of reaction conditions on the direct synthesis of hydrogen peroxide with a AuPd/TiO2 catalyst in a flow reactor. ACS Catal. 2013, 3, 487–501. [Google Scholar] [CrossRef]
  48. Voloshin, Y.; Halder, R.; Lawal, A. Kinetics of hydrogen peroxide synthesis by direct combination of H2 and O2 in a microreactor. Catal. Today 2007, 125, 40–47. [Google Scholar] [CrossRef]
  49. Voloshin, Y.; Lawal, A. Overall kinetics of hydrogen peroxide formation by direct combination of H2 and O2 in a microreactor. Chem. Eng. Sci. 2010, 65, 1028–1036. [Google Scholar] [CrossRef]
  50. Ratchananusorn, W.; Gudarzi, D.; Turunen, I. Catalytic direct synthesis of hydrogen peroxide in a novel microstructured reactor. Chem. Eng. Process. Process. Intensif. 2014, 84, 24–30. [Google Scholar] [CrossRef]
  51. Inoue, T.; Schmidt, M.A.; Jensen, K.F. Microfabricated multiphase reactors for the direct synthesis of hydrogen peroxide from hydrogen and oxygen. Ind. Eng. Chem. Res. 2007, 46, 1153–1160. [Google Scholar] [CrossRef]
  52. Inoue, T.; Kikutani, Y.; Hamakawa, S.; Mawatari, K.; Mizukami, F.; Kitamori, T. Reactor design optimization for direct synthesis of hydrogen peroxide. Chem. Eng. J. 2010, 160, 909–914. [Google Scholar] [CrossRef]
  53. Inoue, T.; Adachi, J.; Ohtaki, K.; Lu, M.; Murakami, S.; Sun, X.; Wang, D.F. Direct hydrogen peroxide synthesis using glass microfabricated reactor–Paralleled packed bed operation. Chem. Eng. J. 2015, 278, 517–526. [Google Scholar] [CrossRef]
  54. Pashkova, A.; Svajda, K.; Dittmeyer, R. Direct synthesis of hydrogen peroxide in a catalytic membrane contactor. Chem. Eng. J. 2008, 139, 165–171. [Google Scholar] [CrossRef]
  55. Pashkova, A.; Dittmeyer, R.; Kaltenborn, N.; Richter, H. Experimental study of porous tubular catalytic membranes for direct synthesis of hydrogen peroxide. Chem. Eng. J. 2010, 165, 924–933. [Google Scholar] [CrossRef]
  56. Pashkova, A.; Greiner, L.; Krtschil, U.; Hofmann, C.; Zapf, R. Direct synthesis of hydrogen peroxide over supported Pd catalysts: Turning to dense CO2 as an alternative solvent. Appl. Catal. A Gen. 2013, 464, 281–287. [Google Scholar] [CrossRef]
  57. Selinsek, M.; Bohrer, M.; Vankayala, B.K.; Haas-Santo, K.; Kraut, M.; Dittmeyer, R. Towards a new membrane micro reactor system for direct synthesis of hydrogen peroxide. Catal. Today 2016, 268, 85–94. [Google Scholar] [CrossRef]
  58. Moreno, T.; García-Serna, J.; Plucinski, P.; Sánchez-Montero, M.J.; Cocero, M.J. Direct synthesis of H2O2 in methanol at low pressures over Pd/C catalyst: Semi-continuous process. Appl. Catal. A Gen. 2010, 386, 28–33. [Google Scholar] [CrossRef]
  59. Broka, K.; Ekdunge, P. Oxygen and hydrogen permeation properties and water uptake of Nafion® 117 membrane and recast film for PEM fuel cell. J. Appl. Electrochem. 1997, 27, 117–123. [Google Scholar] [CrossRef]
  60. Chiou, J.S.; Paul, D.R. Gas permeation in a dry Nafion membrane. Ind. Eng. Chem. Res. 1988, 27, 2161–2164. [Google Scholar] [CrossRef]
  61. Mohamed, H.F.; Ito, K.; Kobayashi, Y.; Takimoto, N.; Takeoka, Y.; Ohira, A. Free volume and permeabilities of O2 and H2 in Nafion membranes for polymer electrolyte fuel cells. Polymer 2008, 49, 3091–3097. [Google Scholar] [CrossRef]
  62. Kim, J.; Chung, Y.-M.; Kang, S.-M.; Choi, C.-H.; Kim, B.-Y.; Kwon, Y.-T.; Kim, T.J.; Oh, S.-H.; Lee, C.-S. Palladium nanocatalysts immobilized on functionalized resin for the direct synthesis of hydrogen peroxide from hydrogen and oxygen. ACS Catal. 2012, 2, 1042–1048. [Google Scholar] [CrossRef]
  63. Pashkova, A.; Svajda, K.; Black, G.; Dittmeyer, R. Automated system for spectrophotometric detection of liquid phase hydrogen peroxide for concentrations up to 5% w/w. Rev. Sci. Instrum. 2009, 80, 055104. [Google Scholar] [CrossRef] [PubMed]
  64. DECHEMA Web Page. Available online: http://i-systems.dechema.de/detherm (accessed on 25 October 2018).
  65. Edwards, J.K.; Solsona, B.E.; Landon, P.; Carley, A.F.; Herzing, A.; Kiely, C.J.; Hutchings, G.J. Direct synthesis of hydrogen peroxide from H2 and O2 using TiO2-supported Au–Pd catalysts. J. Catal. 2005, 236, 69–79. [Google Scholar] [CrossRef]
  66. Solvay Chemicals Web Page. Available online: https://www.solvay.us/en/binaries/HH-056_Passivation-236794.pdf (accessed on 25 October 2018).
Figure 1. Hydrogen peroxide concentration over solvent flow rate using micro channel fixed beds in a 0.5 mm deep micro channel and a 180 μm Nafion® membrane at 20 bars system pressure with water as solvent: squares: Diluted Pd/C, solvent with 0.15 mM NaBr and 0.15 mM H2SO4 (Table 1 Exp.-Nr.: 1–4), circles: Pd/TiO2, solvent with 0.15 mM NaBr and 0.15 mM H2SO4 (Table 1 Exp.-Nr.: 5–9), diamonds: Pd/TiO2, solvent with 4 mM NaBr and 0.15 mM H2SO4 (Table 1 Exp.-Nr.: 10–12).
Catalysts 08 00556 g001
Figure 2. Hydrogen peroxide concentration over solvent flow rate for varying catalyst masses and catalyst arrangements using a 0.5 mm deep micro channel and a 180 μm Nafion® membrane at 10 bars system pressure with water with additives as solvent: squares: 200 mg Pd/TiO2 in a PVC-tube (Table 1 Exp.-Nr.: 41–43), circles: 100 mg Pd/TiO2 in a PVC-tube (Table 1 Exp.-Nr.: 38–40), diamonds: 50 mg Pd/TiO2 in a PVC-tube (Table 1 Exp.-Nr.: 44–45), crosses: 200 mg Pd/TiO2 in a micro channel fixed bed (Table 1 Exp.-Nr.: 13–17).
Catalysts 08 00556 g002
Figure 3. (a) Hydrogen peroxide concentration (squares) and hydrogen peroxide yield (diamonds) over partial pressure ratio of oxygen to hydrogen using Pd/TiO2 in a micro channel fixed bed in a 0.5 mm deep micro channel and a 180 μm Nafion® membrane at 10 bars system pressure with water with additives as solvent (Table 1 Exp.-Nr.: 18–24). (b) Hydrogen peroxide concentration and hydrogen peroxide yield over solvent flow rate using Pd/TiO2 in a micro channel fixed bed in a 0.5 mm deep micro channel and a 180 μm Nafion® membrane at 10 bars system pressure with water with additives as solvent: squares: pO2/pH2 = 1 (Table 1 Exp.-Nr.: 13–17), diamonds: pO2/pH2 = 9 (Table 1 Exp.-Nr.: 25–28).
Catalysts 08 00556 g003
Figure 4. Hydrogen peroxide concentration (empty symbols) and hydrogen peroxide yield (filled symbols) over system pressure using Pd/TiO2 in a micro channel fixed bed in a 0.5 mm deep micro channel and a 180 μm Nafion® membrane with a solvent flow rate of 0.5 mL/min and water as solvent: squares: 4 mM NaBr, 0.15 mM H2SO4 (Table 1 Exp.-Nr.: 29–33), diamonds: no additives (Table 1 Exp.-Nr.: 34–37).
Catalysts 08 00556 g004
Figure 5. (a) Hydrogen peroxide concentration and (b) yield over solvent flow rate using 100 mg Pd/TiO2 in a fixed bed in a PVC-tube at 10 bars system pressure with water with additives as solvent: squares: 0.5 mm deep microchannel, 30 μm Nafion® membrane (Table 1 Exp.-Nr.: 63–64), circles: 0.5 mm deep microchannel, 15 μm Nafion® membrane (Table 1 Exp.-Nr.: 54–57), diamonds: 3 × 0.125 mm deep microchannel, 180 μm Nafion® membrane (Table 1 Exp.-Nr.: 46–48), crosses: 0.5 mm deep microchannel, 180 μm Nafion® membrane (Table 1 Exp.-Nr.: 38–40).
Catalysts 08 00556 g005
Figure 6. (a) Hydrogen peroxide concentration and (b) yield over solvent flow rate using 100 mg Pd/TiO2 in fixed bed in a PVC-tube at 10 bars system pressure with water with additives as solvent: squares: 3 × 0.125 mm deep microchannel, 180 μm Nafion® membrane, 5 mM NaBr, NaAc buffer, pH 3 (Table 1 Exp.-Nr.: 49–50), diamonds: 3 × 0.125 mm deep microchannel, 180 μm Nafion® membrane, 5 mM NaBr (Table 1 Exp.-Nr.: 46–48), circles: 0.5 mm deep microchannel, 30 μm Nafion® membrane, 5 mM NaBr, 4 mM H3PO4, 25 mM H2SO4 (Table 1 Exp.-Nr.: 65–66), crosses: 0.5 mm deep microchannel, 30 μm Nafion® membrane, 5 mM NaBr (Table 1 Exp.-Nr.: 63–64).
Catalysts 08 00556 g006
Figure 7. Scheme of the microchannel membrane reactor (a) and photo of the plates forming the actual device (from left to right): liquid adapter plate, micro channel plate, membrane frame bottom, membrane frame top including gas chambers and gas adapter plate (b). Adapted from Ref. [57].
Catalysts 08 00556 g007
Figure 8. Top view scheme of the geometry of the meander-shaped micro channel and the relative position of the two membrane areas.
Catalysts 08 00556 g008
Figure 9. Schematic cross section of the membrane frame (a) and photo showing the assembled membrane frame with a 15 μm thick Nafion® membrane after a test run (an imprint of the meander-like micro channel can be seen on the surface of the clear membrane) (b).
Catalysts 08 00556 g009
Figure 10. Overview of the experimental setup for continuous direct synthesis of H2O2 with mass flow controller (MFC), pressure controller (PIC) and flow injection analysis (FIA).
Catalysts 08 00556 g010
Figure 11. Photos and illustrations of the different catalyst arrangements tested: Pd/C micro channel fixed bed (a), Pd/TiO2 micro channel fixed bed (b), catalyst arrangement with a tubular fixed bed (c) and Pd/TiO2 micro channel coating (d).
Catalysts 08 00556 g011aCatalysts 08 00556 g011b
Table 1. Reaction conditions of the experiments performed in this work.
Exp.-Nr.Micro ChannelCat.mcat, mgConfig. 1MembraneSolvent Flow Rate, mL/minp, barpO2/pH2Additives
1–40.5 mmPd/C200mfb180 μm3/2/1/0.52010.15 mM NaBr, 0.15 mM H2SO4
5–90.5 mm Pd/TiO2200mfb180 μm1/0.75/0.5/0.4/0.252010.15 mM NaBr, 0.15 mM H2SO4
10–120.5 mmPd/TiO2200mfb180 μm1/0.5/0.252014 mM NaBr, 0.15 mM H2SO4
13–170.5 mmPd/TiO2200mfb180 μm2/1/0.5/0.25/0.11014 mM NaBr, 0.15 mM H2SO4
18–240.5 mmPd/TiO2200mfb180 μm1101/1.5/2/3/5/9/164 mM NaBr, 0.15 mM H2SO4
25–280.5 mmPd/TiO2200mfb180 μm1/0.5/0.25/0.11094 mM NaBr, 0.15 mM H2SO4
29–330.5 mmPd/TiO2100coating180 μm0.510/20/30/40/5014 mM NaBr, 0.15 mM H2SO4
34–370.5 mmPd/TiO2100coating180 μm0.510/20/30/401no Additives
38–400.5 mmPd/TiO2100fb180 μm0.5/0.25/0.11015 mM NaBr
41–430.5 mmPd/TiO2200fb180 μm0.5/0.25/0.11015 mM NaBr
44–450.5 mmPd/TiO250fb180 μm0.5/0.11015 mM NaBr
46–483 × 0.125 mmPd/TiO2100fb180 μm1/0.4/0.21015 mM NaBr
49–503 × 0.125 mmPd/TiO2100fb180 μm1/0.4/0.21015 mM NaBr, Sodium acetate buffer, pH 3
51–533 × 0.125 mmPd/TiO2100fb180 μm1/0.4/0.21015 mM NaBr
54–570.5 mmPd/TiO2100fb15 μm2/1/0.4/0.21015 mM NaBr
58–590.5 mmPd/TiO2100coating30 μm110/4015 mM NaBr
60–620.5 mmPd/TiO2100coating30 μm1/0.4/0.24015 mM NaBr
63–640.5 mmPd/TiO2100fb30 μm1/0.41015 mM NaBr
65–660.5 mmPd/TiO2100fb30 μm1/0.41015 mM NaBr, 4 mM H3PO4, 25 mM H2SO4
67–690.5 mmPd/TiO2100fb30 μm1/0.4/0.24015 mM NaBr, 4 mM H3PO4, 25 mM H2SO4
700.5 mmPd/TiO2100fb30 μm0.14045 mM NaBr, 4 mM H3PO4, 25 mM H2SO4
1: mfb: microchannel fixed bed, fb: PVC-tube fixed bed.

