Article

In Situ Regeneration of Alumina-Supported Cobalt–Iron Catalysts for Hydrogen Production by Catalytic Methane Decomposition

1
Chemical Engineering Department, College of Engineering, King Saud University, P.O. Box 800, Riyadh 11421, Saudi Arabia
2
Laboratoire Matériaux Catalytiques et Catalyseen Chimie Organique (LMCCCO), USTHB BP.32 El Alia, Bab Ezzouar, Algiers 16111, Algeria
3
King Abdulaziz City for Science and Technology, P.O. Box 6086, Riyadh 11421, Saudi Arabia
*
Authors to whom correspondence should be addressed.
Catalysts 2018, 8(11), 567; https://doi.org/10.3390/catal8110567
Submission received: 1 October 2018 / Revised: 13 November 2018 / Accepted: 16 November 2018 / Published: 21 November 2018
(This article belongs to the Special Issue Catalysts for Syngas Production)

Abstract

:
A novel approach to the in situ regeneration of a spent alumina-supported cobalt–iron catalyst for catalytic methane decomposition is reported in this work. The spent catalyst was obtained after testing fresh catalyst in catalytic methane decomposition reaction during 90 min. The regeneration evaluated the effect of forced periodic cycling; the cycles of regeneration were performed in situ at 700 °C under diluted O2 gasifying agent (10% O2/N2), followed by inert treatment under N2. The obtained regenerated catalysts at different cycles were tested again in catalytic methane decomposition reaction. Fresh, spent, and spent/regenerated materials were characterized using X-ray powder diffraction (XRD), transmission electron microscopy (TEM), laser Raman spectroscopy (LRS), N2-physisorption, H2-temperature programmed reduction (H2-TPR), thermogravimetric analysis (TGA), and atomic absorption spectroscopy (AAS). The comparison of transmission electron microscope and X-ray powder diffraction characterizations of spent and spent/regenerated catalysts showed the formation of a significant amount of carbon on the surface with a densification of catalyst particles after each catalytic methane decomposition reaction preceded by regeneration. The activity results confirm that the methane decomposition after regeneration cycles leads to a permanent deactivation of catalysts certainly provoked by the coke deposition. Indeed, it is likely that some active iron sites cannot be regenerated totally despite the forced periodic cycling.

1. Introduction

The reduction of catalytic activity over time is an issue of considerable and continuing concern in industrial practices of catalytic processes. Catalyst replacement and process shutdown could cost the industry very large financial resources every year. The catalyst deactivation changes extensively; for example, in the case of catalytic methane decomposition, catalyst deterioration may be on the scale of seconds, whereas in NH3 synthesis the Fe-catalyst may stay for 5–10 years. Nevertheless, it is unavoidable that all catalysts drop their activities.
Hydrogen is a pure fuel source which can replace fossil fuels. It can be utilized to run numerous devices like fuel cells, engines, vehicles, and electric devices [1]. Subsequently, the attention given to hydrogen production has been progressively growing these past years. H2 can be obtained from several sources and methods, for example, reforming of hydrocarbons, biomass, electrolysis, and photo-splitting of water, in addition to water-gas shift reaction [2,3,4,5,6]; however, the steam reforming reaction is the main conventional method for hydrogen production. The high H2/CO ratio of the saturated hydrocarbons, particularly CH4, makes them the major feedstock for H2 production by reforming reactions. For example, partial oxidation, if properly controlled, is a more suitable method to produce hydrogen than the dry-reforming process because the H2/CO ratio is 2 and the reaction is mildly exothermic, whereas dry-reforming being endothermic is energy-intensive with a low ratio: H2/CO = 1 [7]. The graphene hydro/dehydrogenation process might be used as an active and eco-friendly device to yield and store hydrogen from water. Its mechanisms involve water decomposition at the graphene/metal interface at room temperature to hydrogenate the graphene sheet, which is buckled and decoupled from the metal substrate. Likewise, thermal programmed reaction experiments demonstrate that molecular hydrogen can be released upon heating the water-exposed graphene/metal interface above 400 K [8].
The endothermic catalytic methane decomposition (CMD) reaction [9] could provide a promising substitute for the conventional processes, like steam reforming, partial oxidation, and autocatalysis of methane, used for hydrogen production [10,11,12]. The CMD process produces pure hydrogen and valuable carbon (i.e., free carbon nanotubes) [13,14,15,16]. The formation of carbon nanotubes (CNT) can be of high economic interest; it enjoys many applications, such as catalysts, catalyst-support, H2 storage, electronic components, and polymer additives [17,18,19,20]. Transition metals such as Ni, Co, and Fe supported on different oxides, such as MgO, Al2O3, and SiO2, are often used for CMD reaction [21,22,23,24]. Furthermore, it has been stated that the properties of a single metal catalyst can be improved by introducing a second metal to form a bimetallic catalyst [24,25,26,27,28]. Numerous articles have been lately published on bimetallic catalytic systems for CMD reaction [29,30,31,32,33,34].
The utilization of supported bimetallic Ni–Fe, Ni–Co, and Fe–Co catalysts was examined for catalytic methane decomposition by several researchers such as Awadallah et al. [35]. The catalytic data showed that the bimetallic catalyst exhibited remarkably higher activity and stability and a higher yield of multi-walled carbon nanotubes. The Fe and Co play the role of active metal in the catalyst; they are cheap and abundant compared to noble metals and Ni. The catalytic activity of 30 wt % Fe and 15 wt % Co bimetallic catalyst, reduced at 500 °C and operated at 700 °C, showed excellent performance among all the tested catalysts which comprised Fe/Al2O3, Co–Fe/Al2O3, Ni–Fe/Al2O3 with different amounts of Co and Ni loading [13]. The present work underscores the features of catalyst regeneration performance in activity and stability.
Pudukudy et al. [34] investigated the direct decomposition of CH4 over SBA-15-supported Ni-, Co- and Fe-based bimetallic catalysts. Their results specified that all of the bimetallic catalysts were highly active and stable for the reaction at 700 °C even after 300 min of time on stream. Co–Fe/SBA-15 catalyst revealed high catalytic stability [34]. Bimetallic Ni–Fe, Ni–Co, and Fe–Co supported on MgO catalysts with a total metal content of 50 wt % were examined for CMD by Awadallah et al. [35]. The catalytic data exhibited that the bimetallic 25%Fe–25%Co/MgO catalyst displayed remarkably higher activity and stability up to ~10 h of time on stream and a higher yield of multi-walled carbon nanotubes [35]. The deactivation of heterogeneous catalysts due to carbon deposition is a global issue that causes a reduction in catalytic activity with time. Various types of carbon and coke that change in morphology and reactivity are created. The more reactive, amorphous forms of carbon created at low temperatures are transformed into less reactive, graphitic forms at high temperatures over a period of time [36]. Normally, catalyst regeneration is considered to restore catalytic activity by removing carbon, poisons, and site blockage [37]. Hazzim et al.; studied the regeneration for CMD using an activated carbon catalyst [38]. They found that the activity at the start and the final mass gain of the catalyst increased as the reaction temperatures rose from 850 to 950 °C. However, at 850 and 950 °C reaction temperatures, the activity and mass gain declined after each regeneration step. The decrease was slower under severe regenerating conditions [38].
In this work, a cobalt–iron supported on alumina catalyst (noted 15%Co–30%Fe) was synthesized for catalytic methane decomposition (CMD) reaction (CH4 → C + 2H2:ΔH° = 75:6 KJ/mol). The effect of the catalyst regeneration was evaluated by using different oxidizing forced periodic cycling. The regenerated catalysts were tested again in CMD reaction for coproduction of hydrogen and carbon nanomaterials. This study focused on identifying the nature of the carbon deposits formed after each CMD testing that precedes the regeneration cycles; also in addition, the obtained yields of hydrogen were quantified to understand the reaction’s mechanism.

2. Results and Discussion

Because of the materials’ complexity, structural and textural properties and morphology of spent/regenerated catalysts (referred to as SP-180 min, SP-360 min, and SP-720 min) were examined using X-ray diffraction (XRD), transmission electron microscopy (TEM), laser Raman spectroscopy (LRS), N2-physisorption, hydrogen temperature programmed reduction (H2-TPR), and thermogravimetric analysis (TGA), and the carbon amount was evaluated by atomic absorption spectrometry (AAS). For each of these three samples, the oxidative regeneration process was performed every 90 min of the test. For comparison, the un-regenerated SP-90 min was used as a reference.

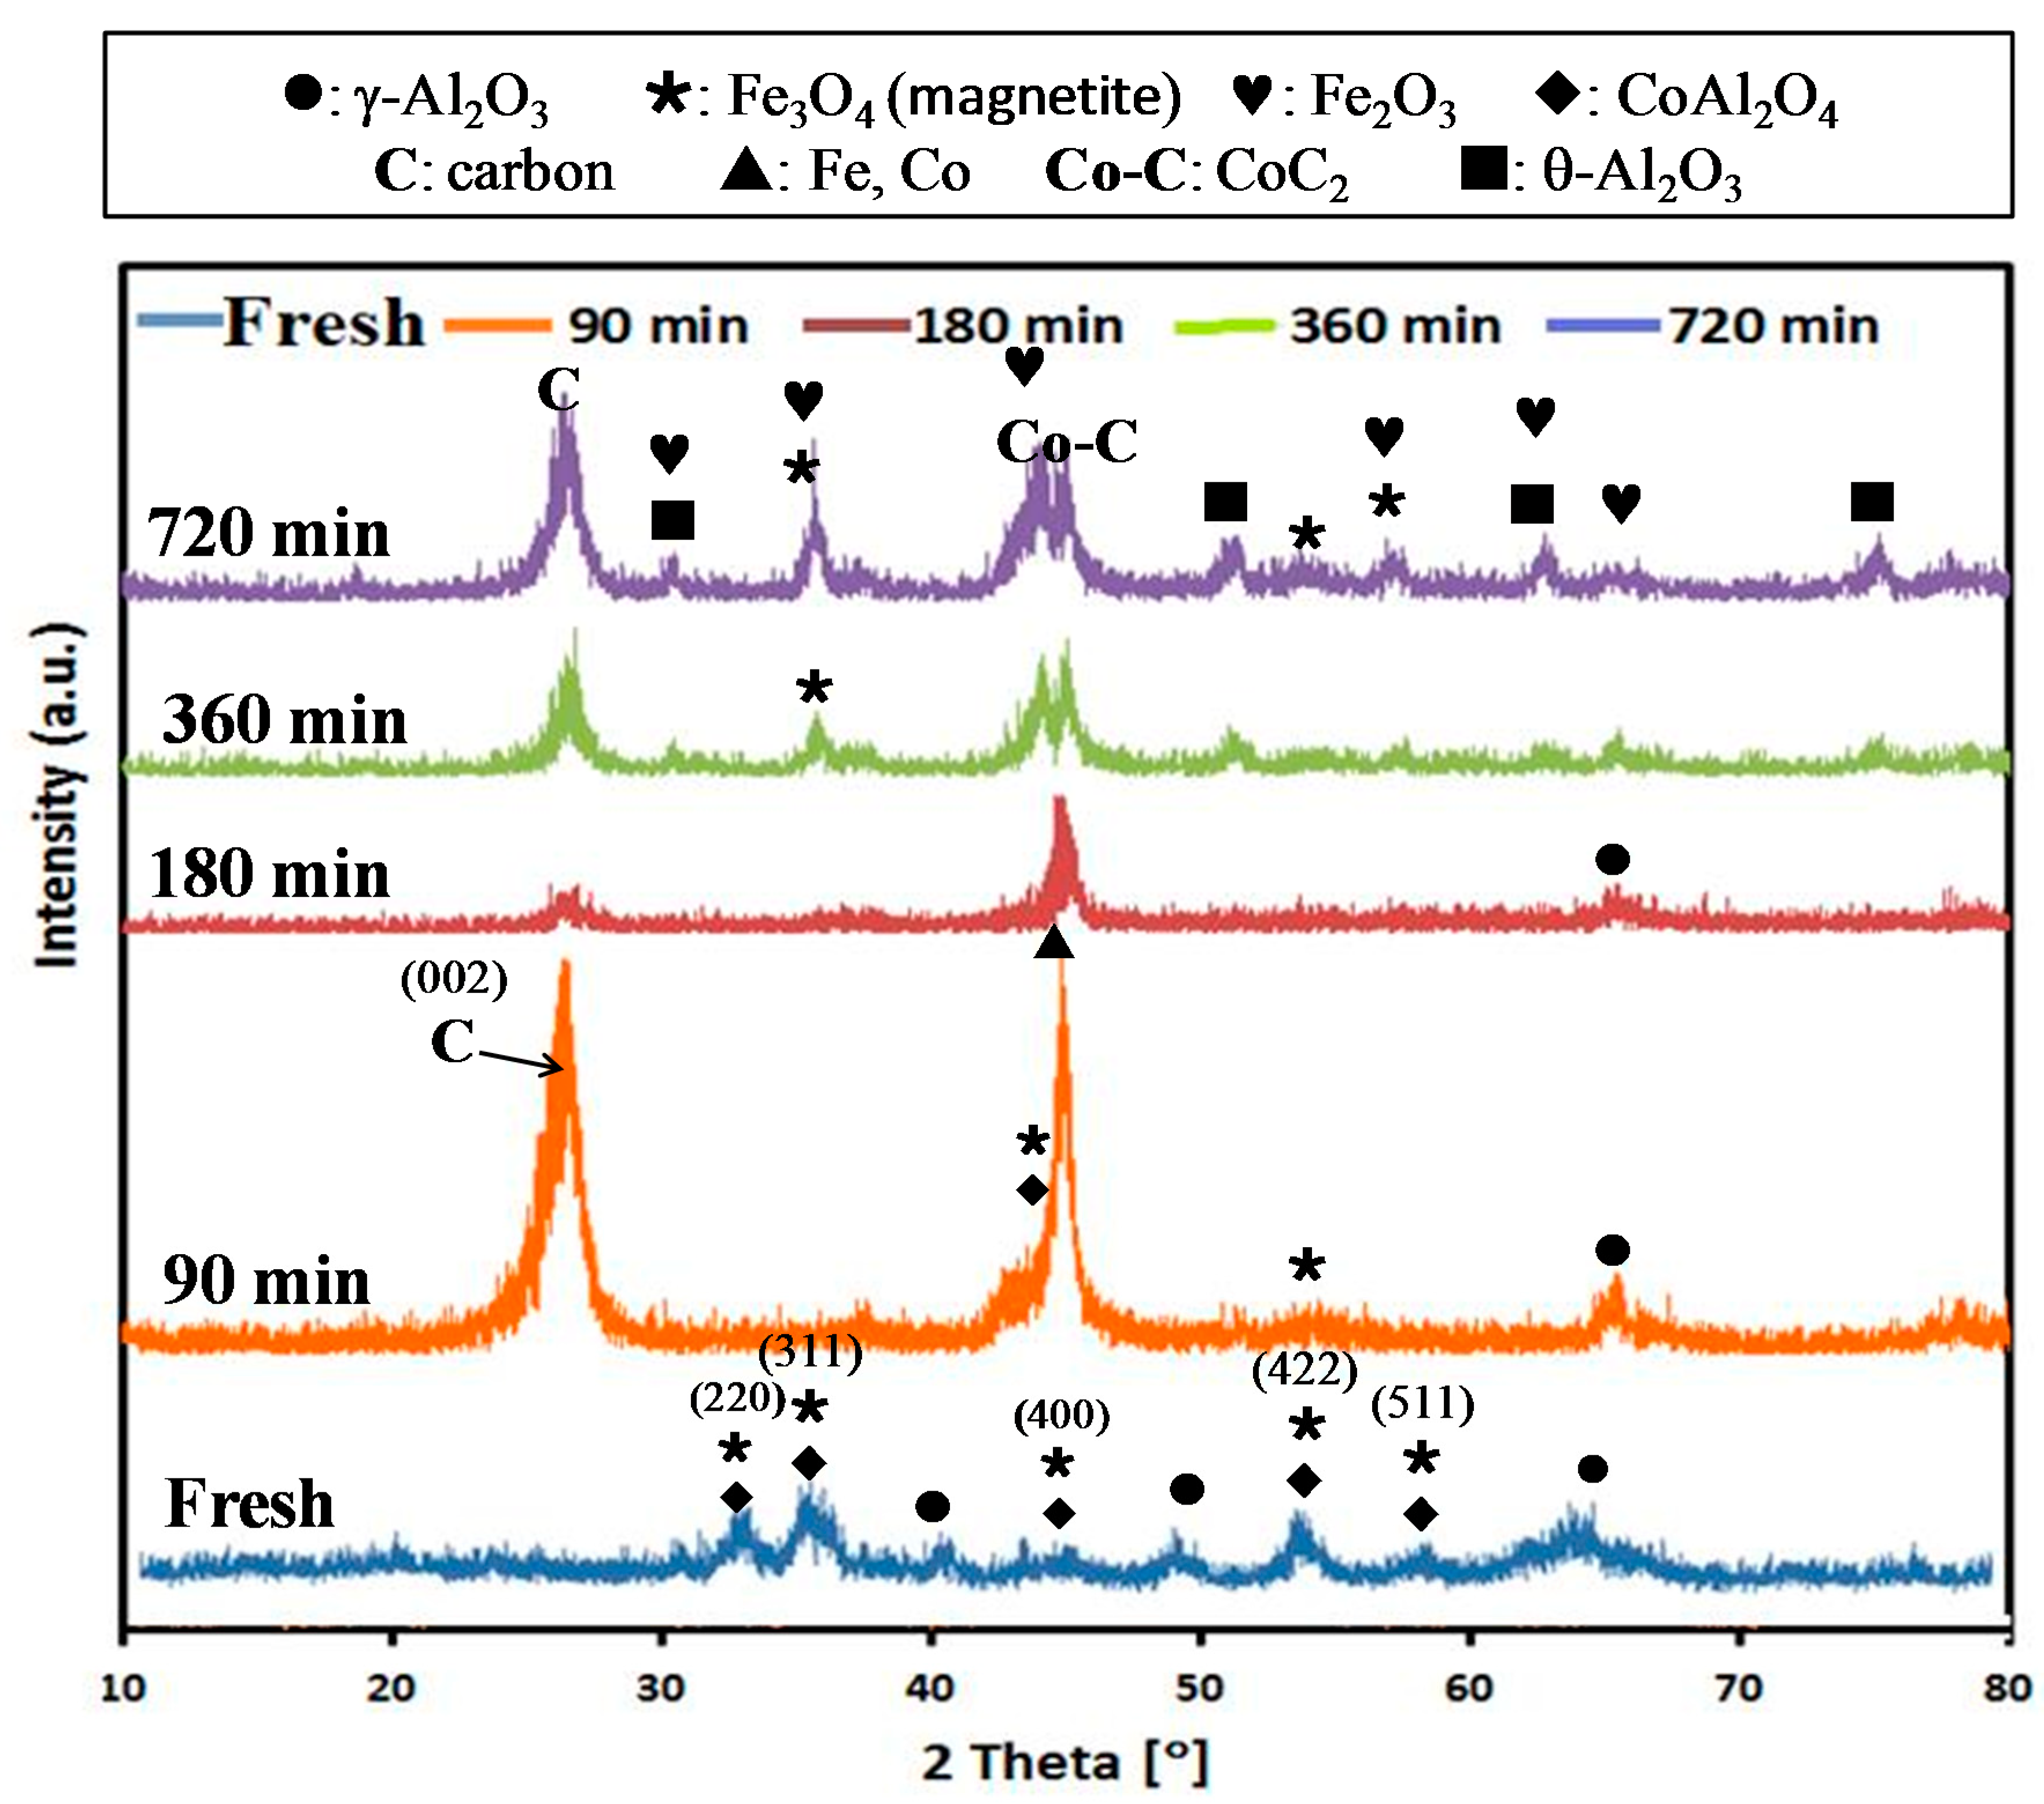
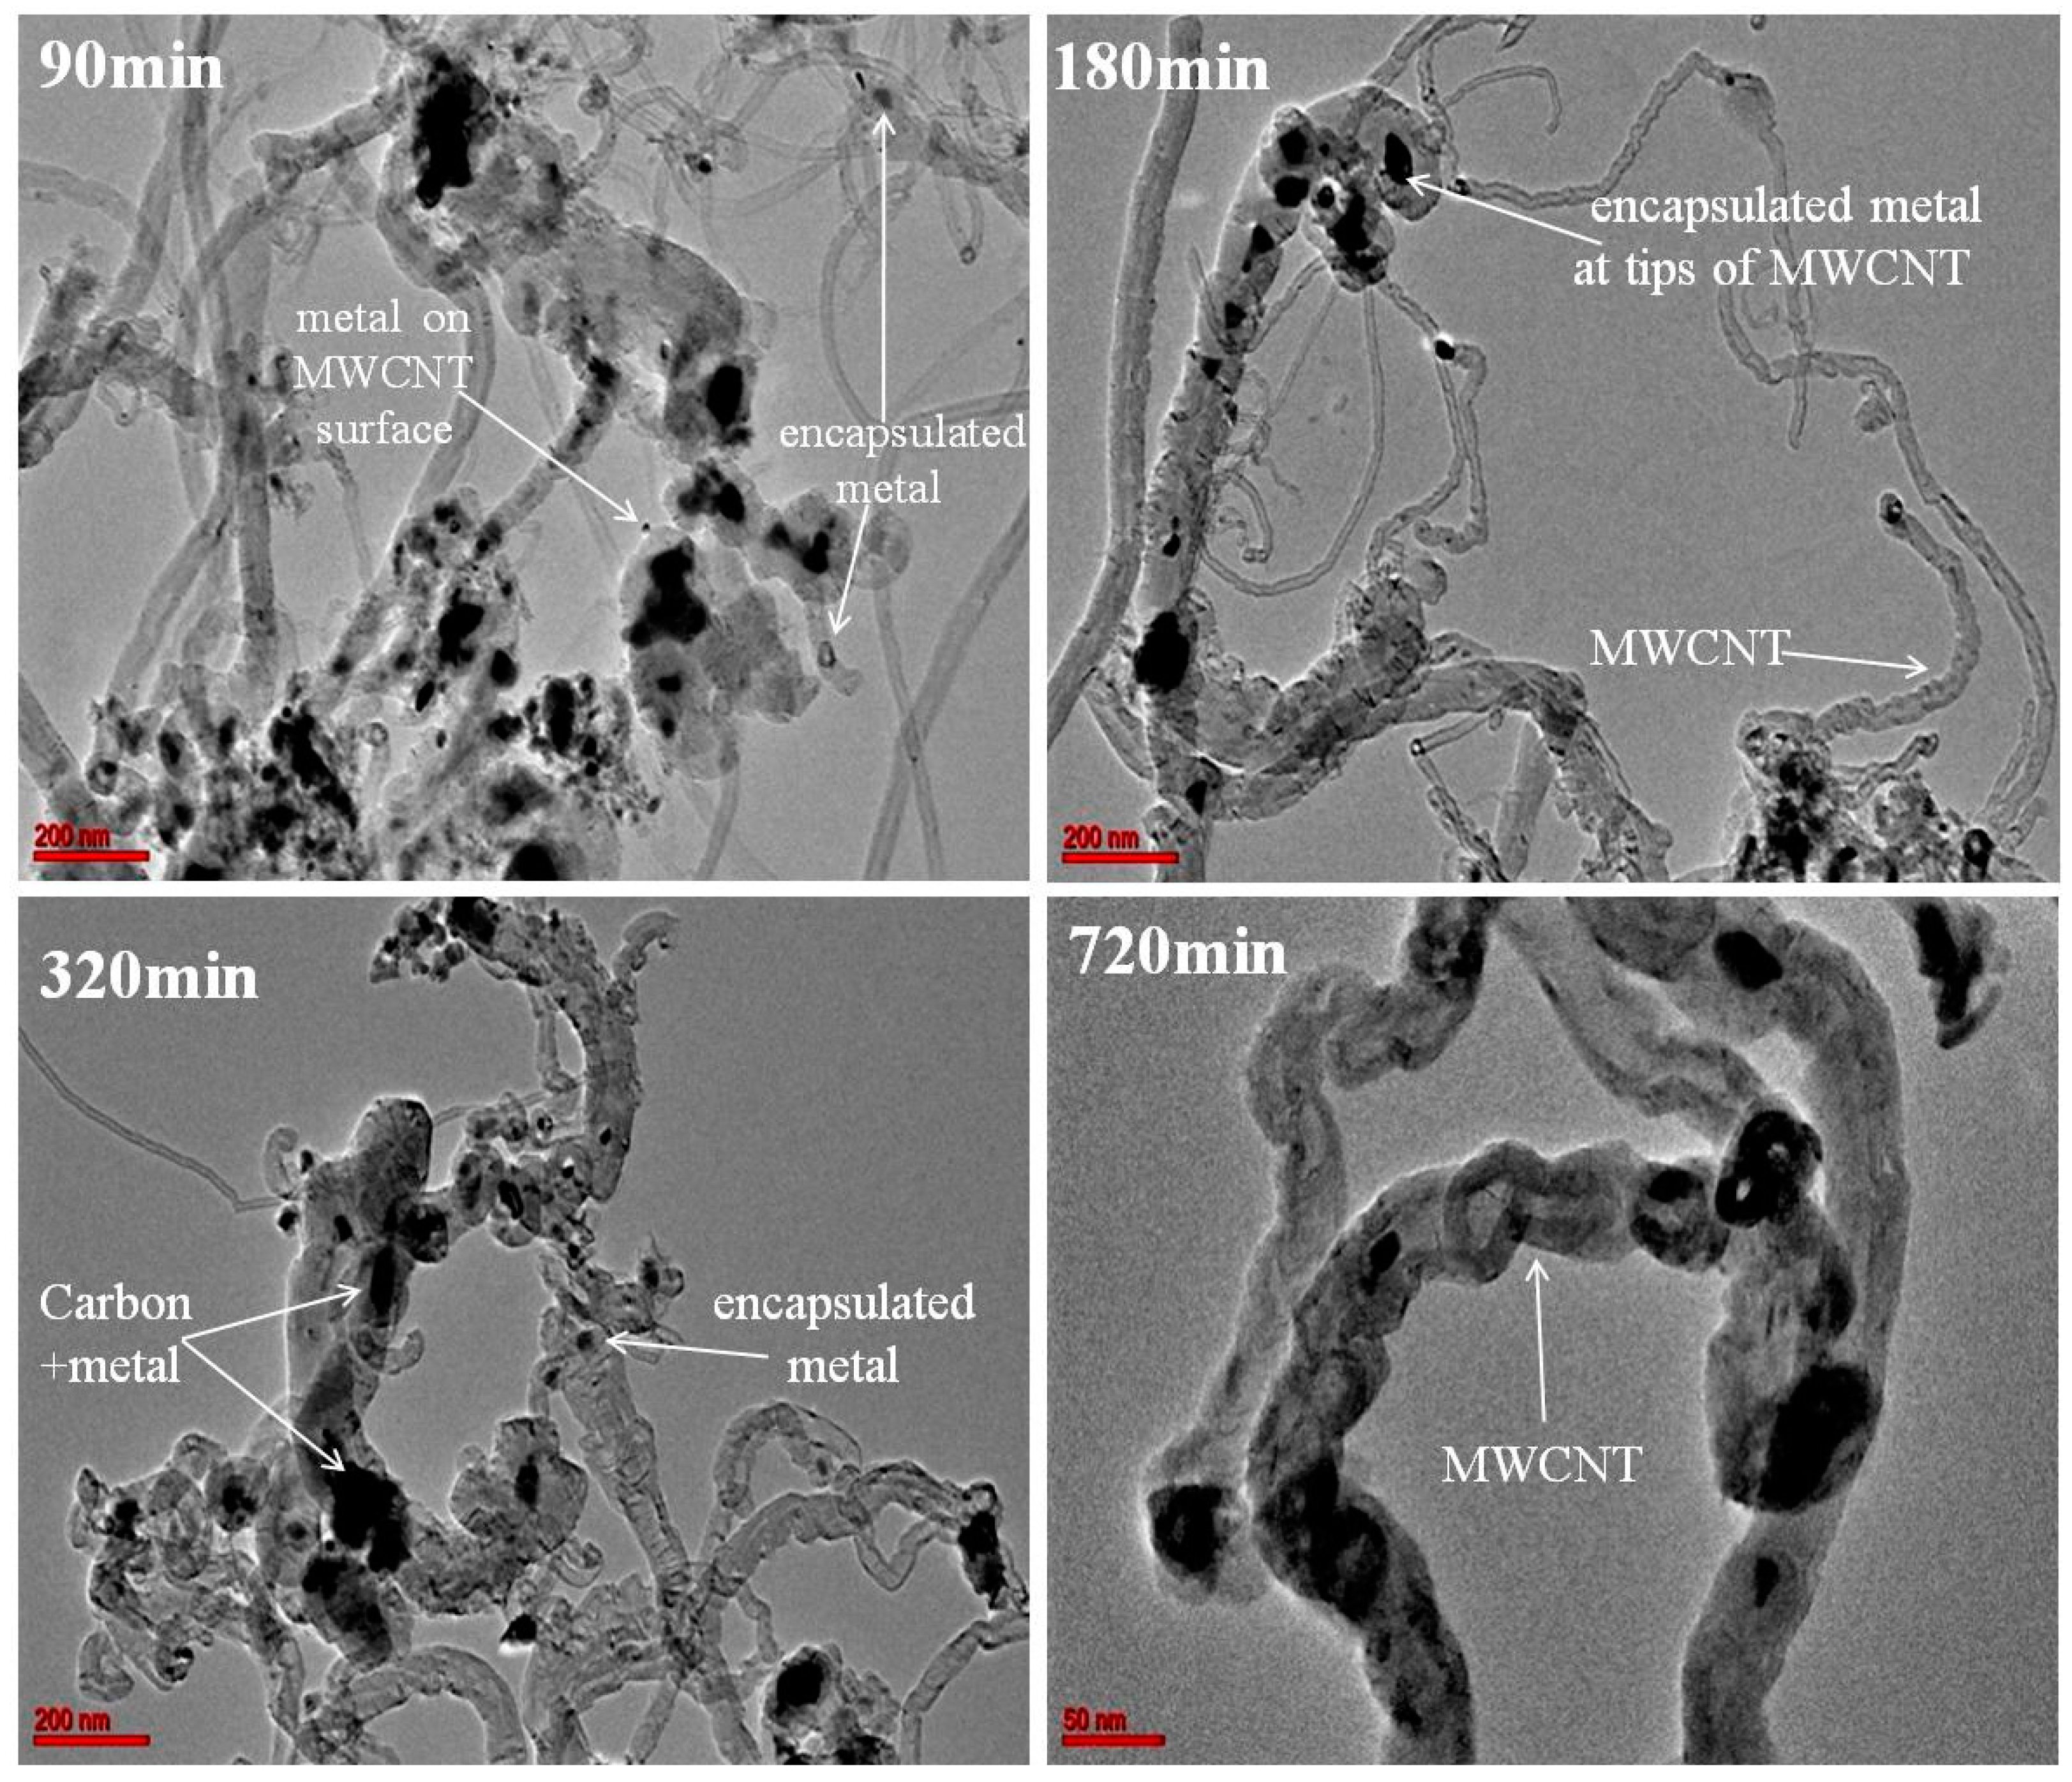
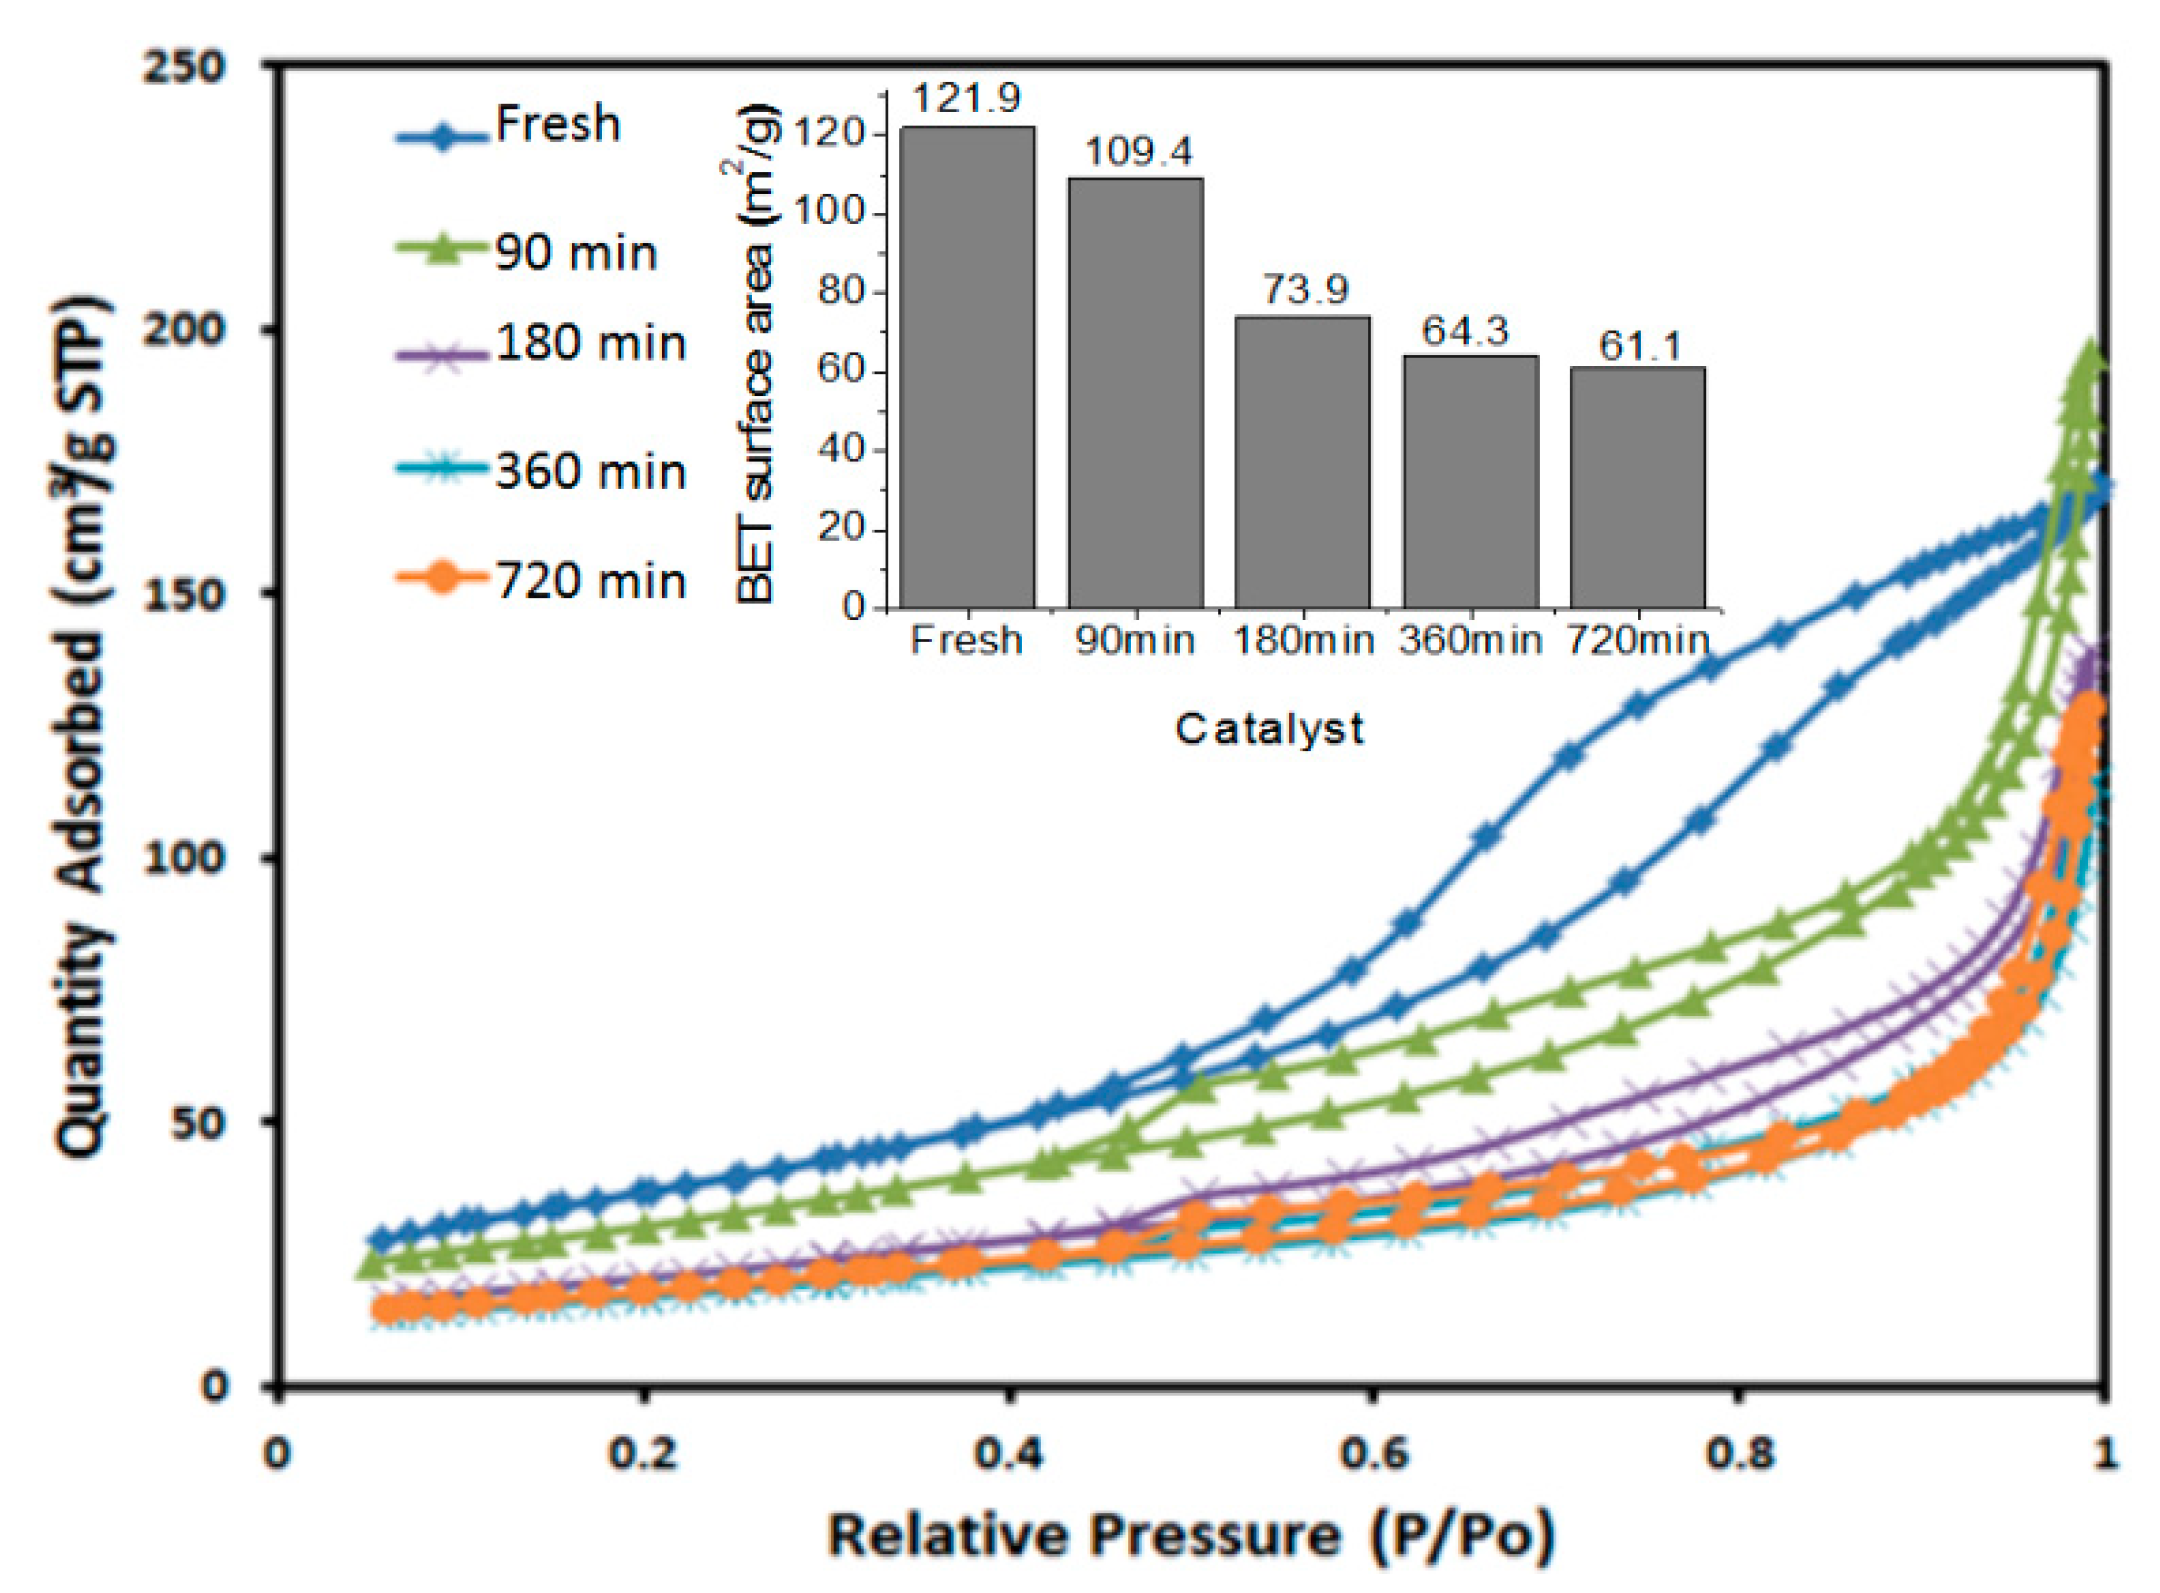
2.1. Structure and Morphology

XRD patterns of fresh catalyst (15Co–30Fe/Al2O3), SP-90 min, and three spent/regenerated samples are shown in Figure 1. As mentioned previously [39], the diffractogram of the fresh solid showed the presence of γ-Al2O3 phase at 2θ ca. 40°, 49°, and 64° in accordance with (ICDD# 004-0875) lines. In this sample, additional peaks related to Fe3O4 magnetite were found at 2θ ca. 32°, 35.5°, 45°, 55°, and 60° according to (ICDD# 04-006-6550), whereas Fe2O3 hematite was not observed at 2θ: 32°, 35° (most intense) and 25°, 50°, 54° (less intense) in accordance with (ICDD# 089-0598). Peaks observed at 2θ ca. 32°, 37°, 45°, 56°, 59°, and 66° correspond to CoAl2O4 spinel (ICDD#44-0160). The formation of CoAl2O4 was ascribed to the strong interactions between cobalt species and γ-Al2O3 lattice during the synthesis process. No peak corresponding to Co–Fe mixed oxides like CoFe2O4 spinel was observed; this was plausibly due to a stronger interaction between cobalt and alumina which have more pronounced acidic properties than that of iron oxides.
The XRD pattern of spent SP-90 min was completely different from that of the fresh catalyst; it was dominated by the reflection of (200) planes observed in 2θ = 20°–30° range, attributed to carbon species with a graphite-like structure. No reflections corresponding to CoAl2O4 spinel, Fe3O4 magnetite, or Fe2O3 hematite phases were detected. The presence of γ-Al2O3 phase was not clearly ascertained. However, a close inspection of this diffractogram revealed the presence of the common reflection of cobalt and iron chemically in the oxidation state zero, indicating the reduction under the reaction mixture. Part of CoAl2O4 and Fe3O4 directly forms Co and Fe metallic species or probably Co–Fe alloy. The authors supposed that the reduction of CoAl2O4 and Fe3O4 was incomplete under CH4 atmosphere. The presence of unreduced species CoAl2O4 spinel and Fe3O4 could not be clearly checked because their lines are probably overlapped by those of the Co and Fe metallic species.
In the case of the SP-180 min sample, the pattern performed after the oxidative regeneration process was similar to that of SP-90 min, but the intensity of the peaks was different. The SP-180 min pattern revealed the presence of graphitic carbon with very low-intensity peaks due to the removal of surface carbon in the form of CO2. Cobalt and iron were always observed in the metallic form, that is, no cobalt and iron oxides were observed after oxidative treatment. From these results, it might be inferred that filamentous carbon stabilized the cobalt and iron in oxidation state zero.
In the SP-360 min and SP-720 min samples, the intensity of the carbon lines increased with the time of CMD reaction due to an additional deposit of carbon in well-structured forms that is difficult to eliminate during the regeneration process. The presence of Fe0 metallic species was always ascertained, but that of Co0 is unlikely. However, the diffractogram revealed the presence of a new phase attributed to CoC2 cobalt carbide and identified after Rietveld refinement; this identification is observed by a slight peak splitting situated at 2θ ≈ 45° (ICDD#44-0962). No reflections corresponding to iron carbide species (like Fe5C2 or Fe3C) could be observed in these samples.
Nevertheless, with a refinement scan, some traces of Fe3O4 magnetite and Fe2O3 hematite were identified indicating the re-oxidation of iron during the regeneration process. Unlike the spent/regenerated sample SP-180 min, the SP-360 min and SP-720 min samples revealed the presence of a new phase recorded as θ-Al2O3 observed at 2θ positions of 29.8°, 41.0°, 44.2°, 50.81°, 61.8°, 67.9°, and 79.1° in accordance of (ICDD#086-1410). From these results, it could be inferred that the θ-Al2O3 would probably help to make and stabilize more iron species at the surface of SP-360 min and SP-720 min samples [40,41].
Transmission electron microscopy (TEM) was performed in order to get more information on the carbon morphology detected by XRD. TEM micrographs of the spent and spent/regenerated catalysts are shown in Figure 2. In all cases, the formation of filamentous-type carbon was confirmed. It is known that the fibers of carbon nanotubes (CNTs) are composed of two kinds: (1) single-walled carbon nanotubes (SWCNTs) which consist of a single tube of graphite and (2) multi-walled carbon nanotubes (MWCNTs). Generally, in TEM analysis, it is difficult to establish the length of nanotubes to compare them. However, it is well known that nanotube diameters can range from just a few nanometers for SWCNTs to several tens of nanometers for MWCNTs. In their study, Jorio et al. [42] demonstrated by TEM that diverse SWCNT diameters varied between 0.7 and 3.0 nm. On the other hand, Hou et al. [43], using the same technique, found that MWCNT were generally in the diameter range from 10 to 200 nm. In this work, only MWCNT fibers with 27–53 nm diameters were identified (Figure 2). Similarly, in an earlier report [39] of CMD on SP-90 min, the lengths of the produced carbon (CNT) at 90 min of CMD (observed by TEM) varied between 14.09 and 72.0 nm, which were the characteristics of MWCNTs.
For all spent and spent/regenerated samples, TEM micrographs showed large amounts of graphitic carbon layers around the Co metal particles. In fact, these Co particles were mostly encapsulated within CNTs; on the other hand, the Fe particles clung to the CNT surface in accordance with XRD analysis, which showed, after oxidative regeneration, a re-oxidation of iron metallic species in Fe3O4 magnetite or in Fe2O3 hematite (according to XRD observations); it however showed no oxidized form of cobalt which was encapsulated and stabilized with filamentous carbon. According to the literature [44], a metal encapsulated into the CNTs was not very accessible to reactants and therefore resistive to any oxidative regeneration process. Besides metal particles encapsulated (Co) and metallic particles located on top of nanocarbons (Fe), all TEM images (Figure 2) showed agglomerate black particles clearly observed in the tips of MWCNTs and dispersed on the CNT surface. These black particles are more numerous on the unregenerate sample (SP-90 min) and are attributed to condensation of carbon nanoparticles. These black particles could be easily removed in CO2 form ( C CO 2 ) during the regeneration process.
Table 1 summarizes the average size of carbon crystallites determined by XRD and obtained by TEM. The crystallite size (XRD) was estimated using the Debye–Scherrer formula [45] for the most intense (002) peak of carbon and using the equation τ   = 0.94   ×   λ FWHM   ×   Cos ( 2 θ 2 ) , where λcu = 1.5406 Å, τ (Å) is the carbon crystallite size, 2θ (radian) is the diffraction peak position, and Full width at half maximum (FWHM) (radian) is full width at half maximum describing the width measurement of carbon peak. In TEM, the calculation of sizes was realized using the ImageJ software package (1.52 h, National Institutes of Health, Madison, WI, USA, 2018). Except for SP-720 min (with instrumental broadening ×50 against ×200), the TEM investigation displays homogeneous distribution of carbon species with a particle size 52.31, 49.28, and 53.23 nm for 90, 180, and 360 min samples, respectively. Similar trends were observed by XRD for these three samples (49.74 and 42.63 Å). In the case of the SP-720 min, the crystallite sizes (XRD or TEM) were the smallest as compared to those of other catalysts because of the removal of amorphous carbon species from the MWCNT surface (loss of carbon C → CO2) [46].
As a conclusion, XRD and TEM measurements are complementary techniques, but not comparable: XRD involves some heterogeneity properties such as crystalline structures, types (carbon, carbide, etc.), and amorphous regions, whereas TEM gives information on the particle organization of carbon (homogeneous distribution), dispersion, and distribution of metals.
To confirm the carbon nature and structure observed by XRD, laser Raman spectroscopy (LRS) was applied to provide useful information about material crystallinity, phase transition, and structural disorder. The spectra of the spent and spent/regenerated samples are shown in Figure 3. The single band observed between 1000 and 2000 cm−1 could be associated with different carbon bonds; it revealed the presence of a carbon graphite structure on the molecular level. According to previous reports [47], this band with a maximum at 1363.6 cm−1 was attributed to the D-band of sp2 carbon material. Deconvolution of this band revealed two components (Figure 3); the second component, centered at 1580.54 cm−1 is associated with the G-band. According to Ferrari [48], the Raman G-band was a characteristic of graphite with high crystallinity and the D-band was attributed to defects and lattice distortions in the carbon structures; an increase in the intensity of the D-band reflected an increase in the disorder of the carbon atoms and thus a restructuring of the nanotubes. Therefore, the ratio of D-band intensity on G-band intensity (ID/IG) gave an indication of defects or graphitic order. In Figure 3, the ratio ID/IG was calculated after deconvolution. The ID/IG ratios, which varied in the order of 1.84 (360 min) > 1.75 (180 min) >1.66 (720 min) > 1.51 (90 min), indicated the formation of new phases detected by XRD in spent/regenerated samples, which could be directly responsible for the higher level of lattice distortion in the carbon graphite structures. However, the values (ID/IG = 1.66–1.84), obtained after regeneration, had slightly increased compared to that of SP-90 min (ID/IG ~ 1.51), which means that with the oxidative treatment, the structure of the nanotubes was disturbed but not totally damaged.

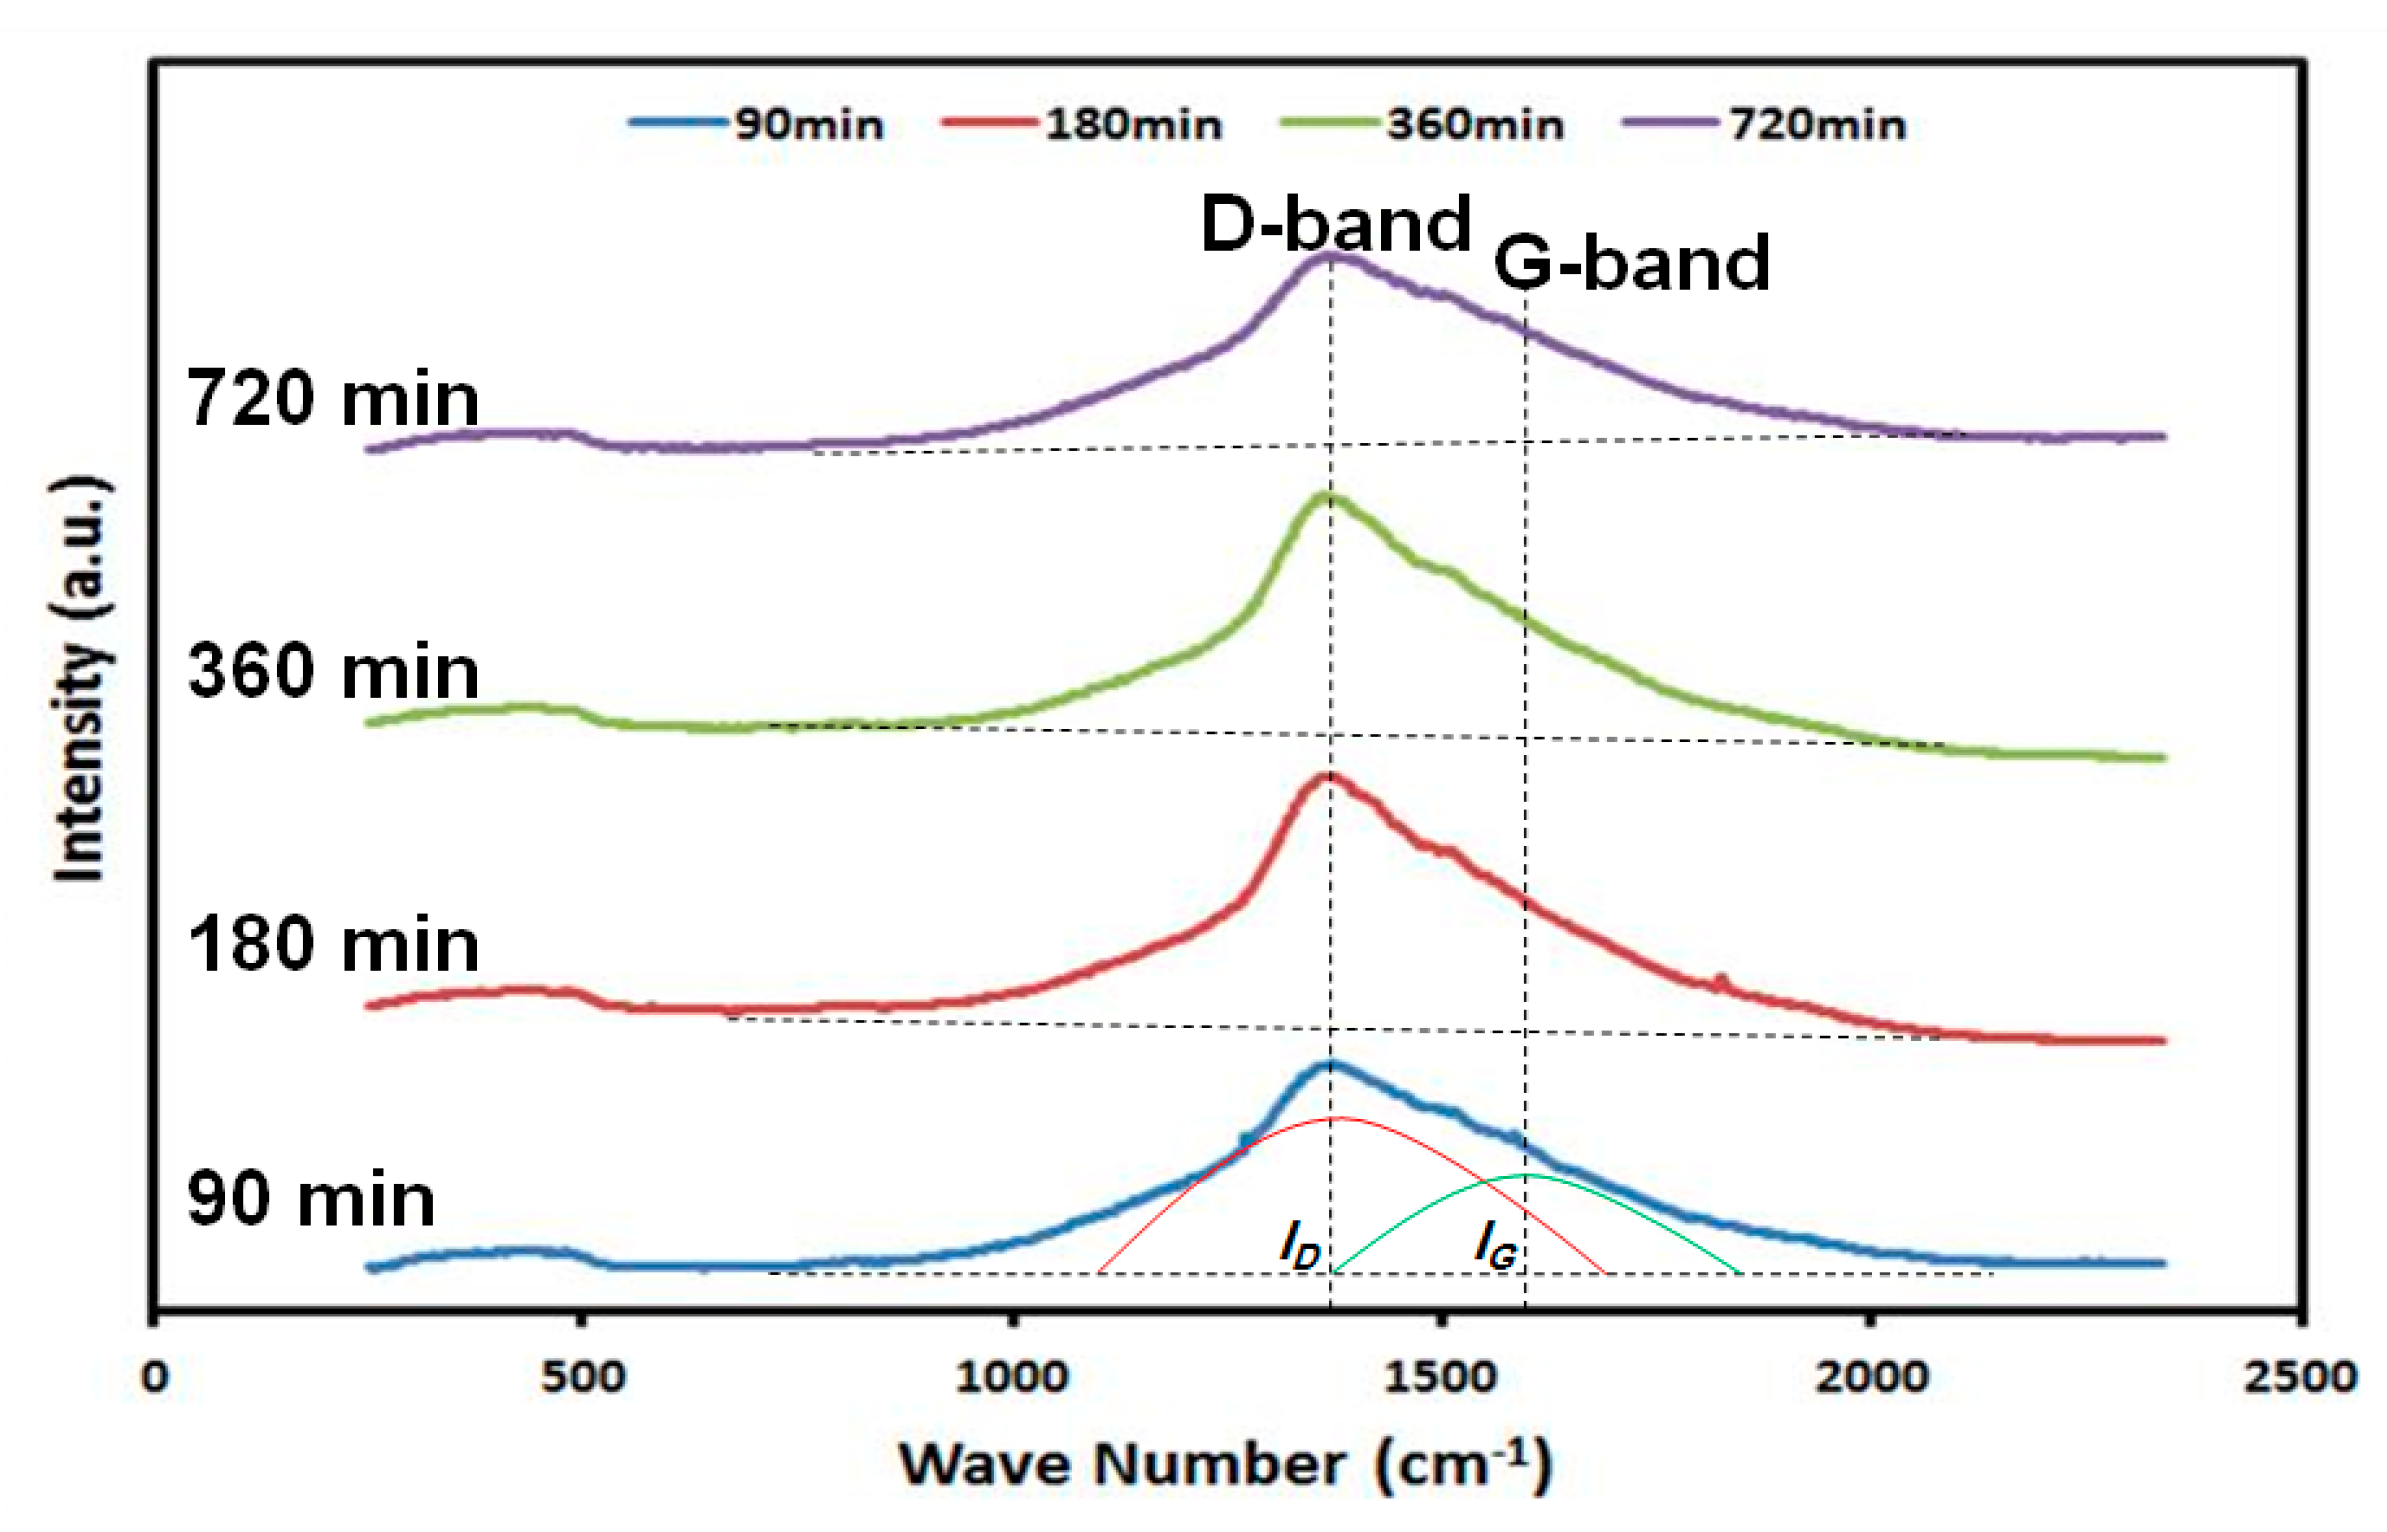
2.2. Surface Characterization

The Brunauer–Emmett–Teller BET surface areas were determined by nitrogen adsorption-desorption at 77 K. All nitrogen adsorption–desorption isotherm curves and variations of the specific surface areas are depicted in Figure 4. According to the International Union of Pure and Applied Chemistry (IUPAC) standard, the catalysts exhibited the IV type isotherm showing that the materials were essentially mesoporous. The fresh sample exhibited H4 hysteresis loop which corresponded to the narrow slit-like pores, whereas the hysteresis loops of spent (90 min) and spent/regenerated (SP-180, 360, and 720 min) samples had the characteristic of a type H3 loop. Compared to fresh and not regenerated samples, the spent/regenerated samples showed a lower amount of nitrogen adsorbed at the high relative pressure (P/P0 = 1), which suggests a strong decrease in the mesoporosity because of the aggregated pores between the CNTs. In addition, as is shown in Figure 4, the displacement of the hysteresis loops toward the lower partial pressures is an indication of the porosity’s evolution.
BET surface areas of spent and spent/regenerated samples were relatively small compared to that of the fresh sample. They decreased linearly with the time of CMD reaction in the following order: fresh-sample (122 m2/g) > SP-90 min (109 m2/g) > SP-180 min (74 m2/g) > SP-360 min (64 m2/g) > SP-720 min (61 m2/g). During the CMD reaction or oxidative regeneration process, the formation of new phases (such as Co and Fe metallic species, CoCx, carbon, and θ-Al2O3, etc.) caused the blocking of the pores with the subsequent loss of surface area as evidenced by XRD analysis. This result was consistent with AAS findings, which showed an increase in the mass of carbon deposited with the number of reaction cycles. The decline in catalyst activity might be related to the reduction in porosity which occurred during the decomposition process.

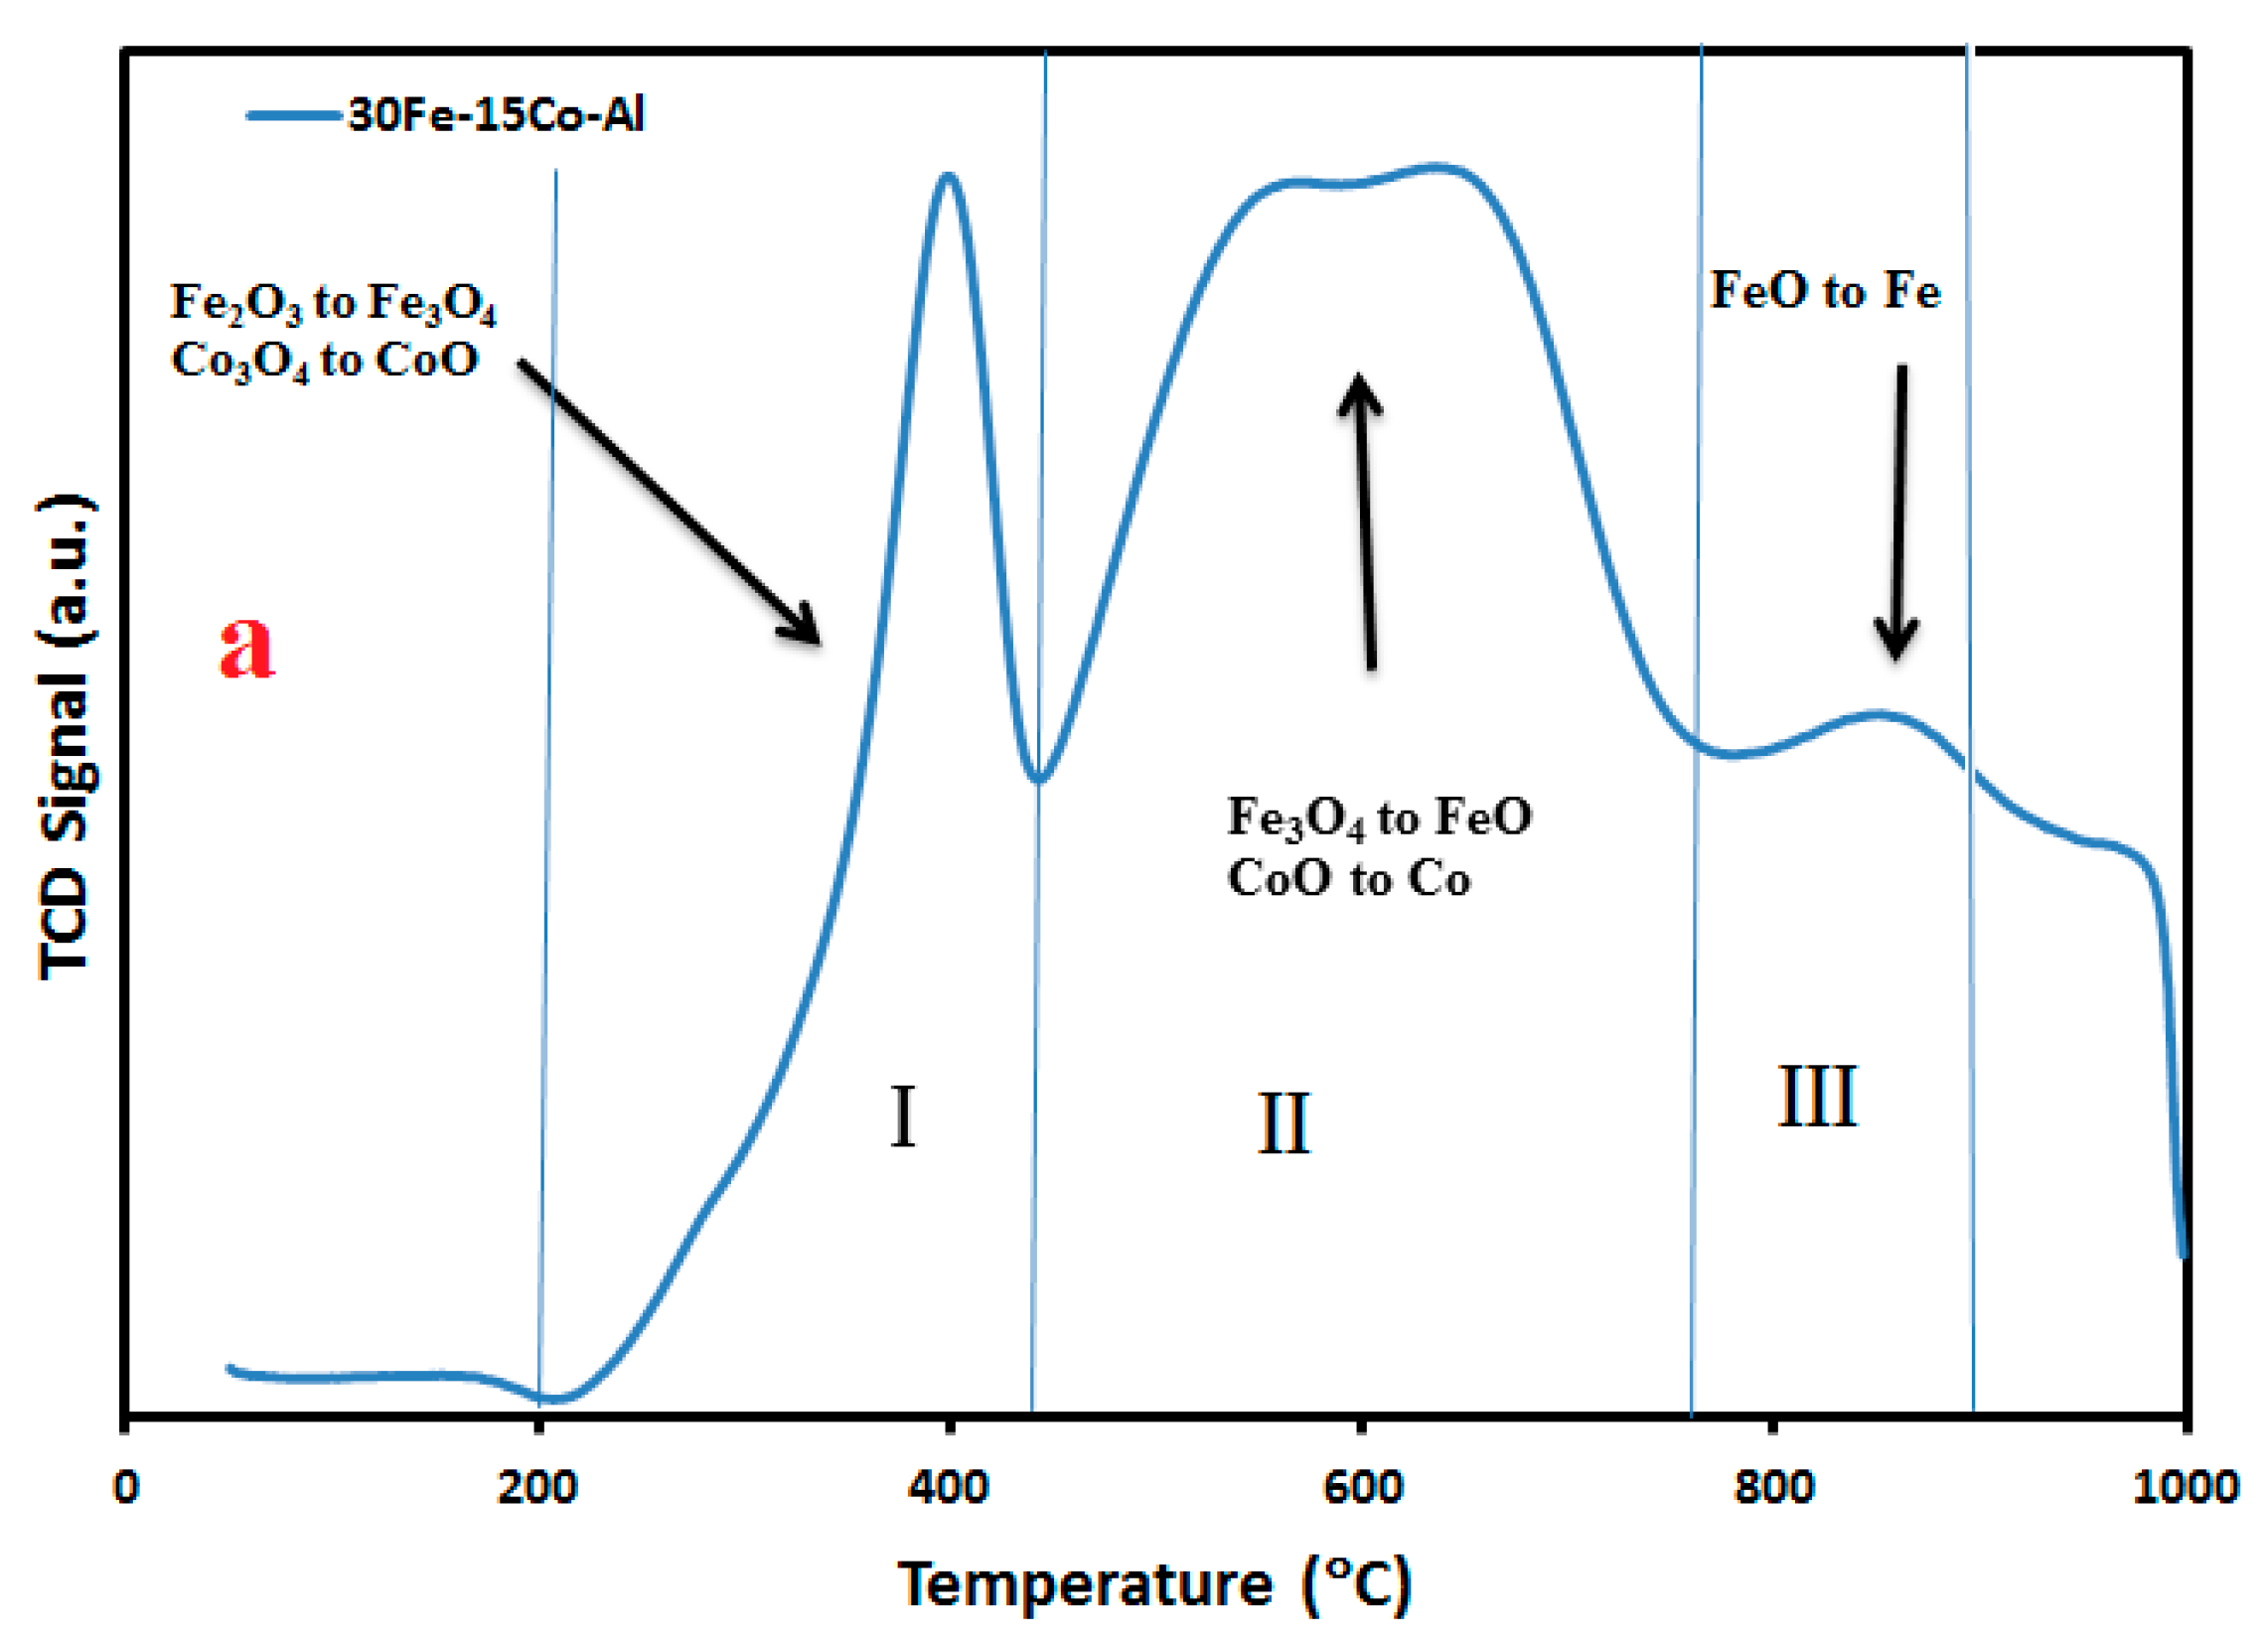
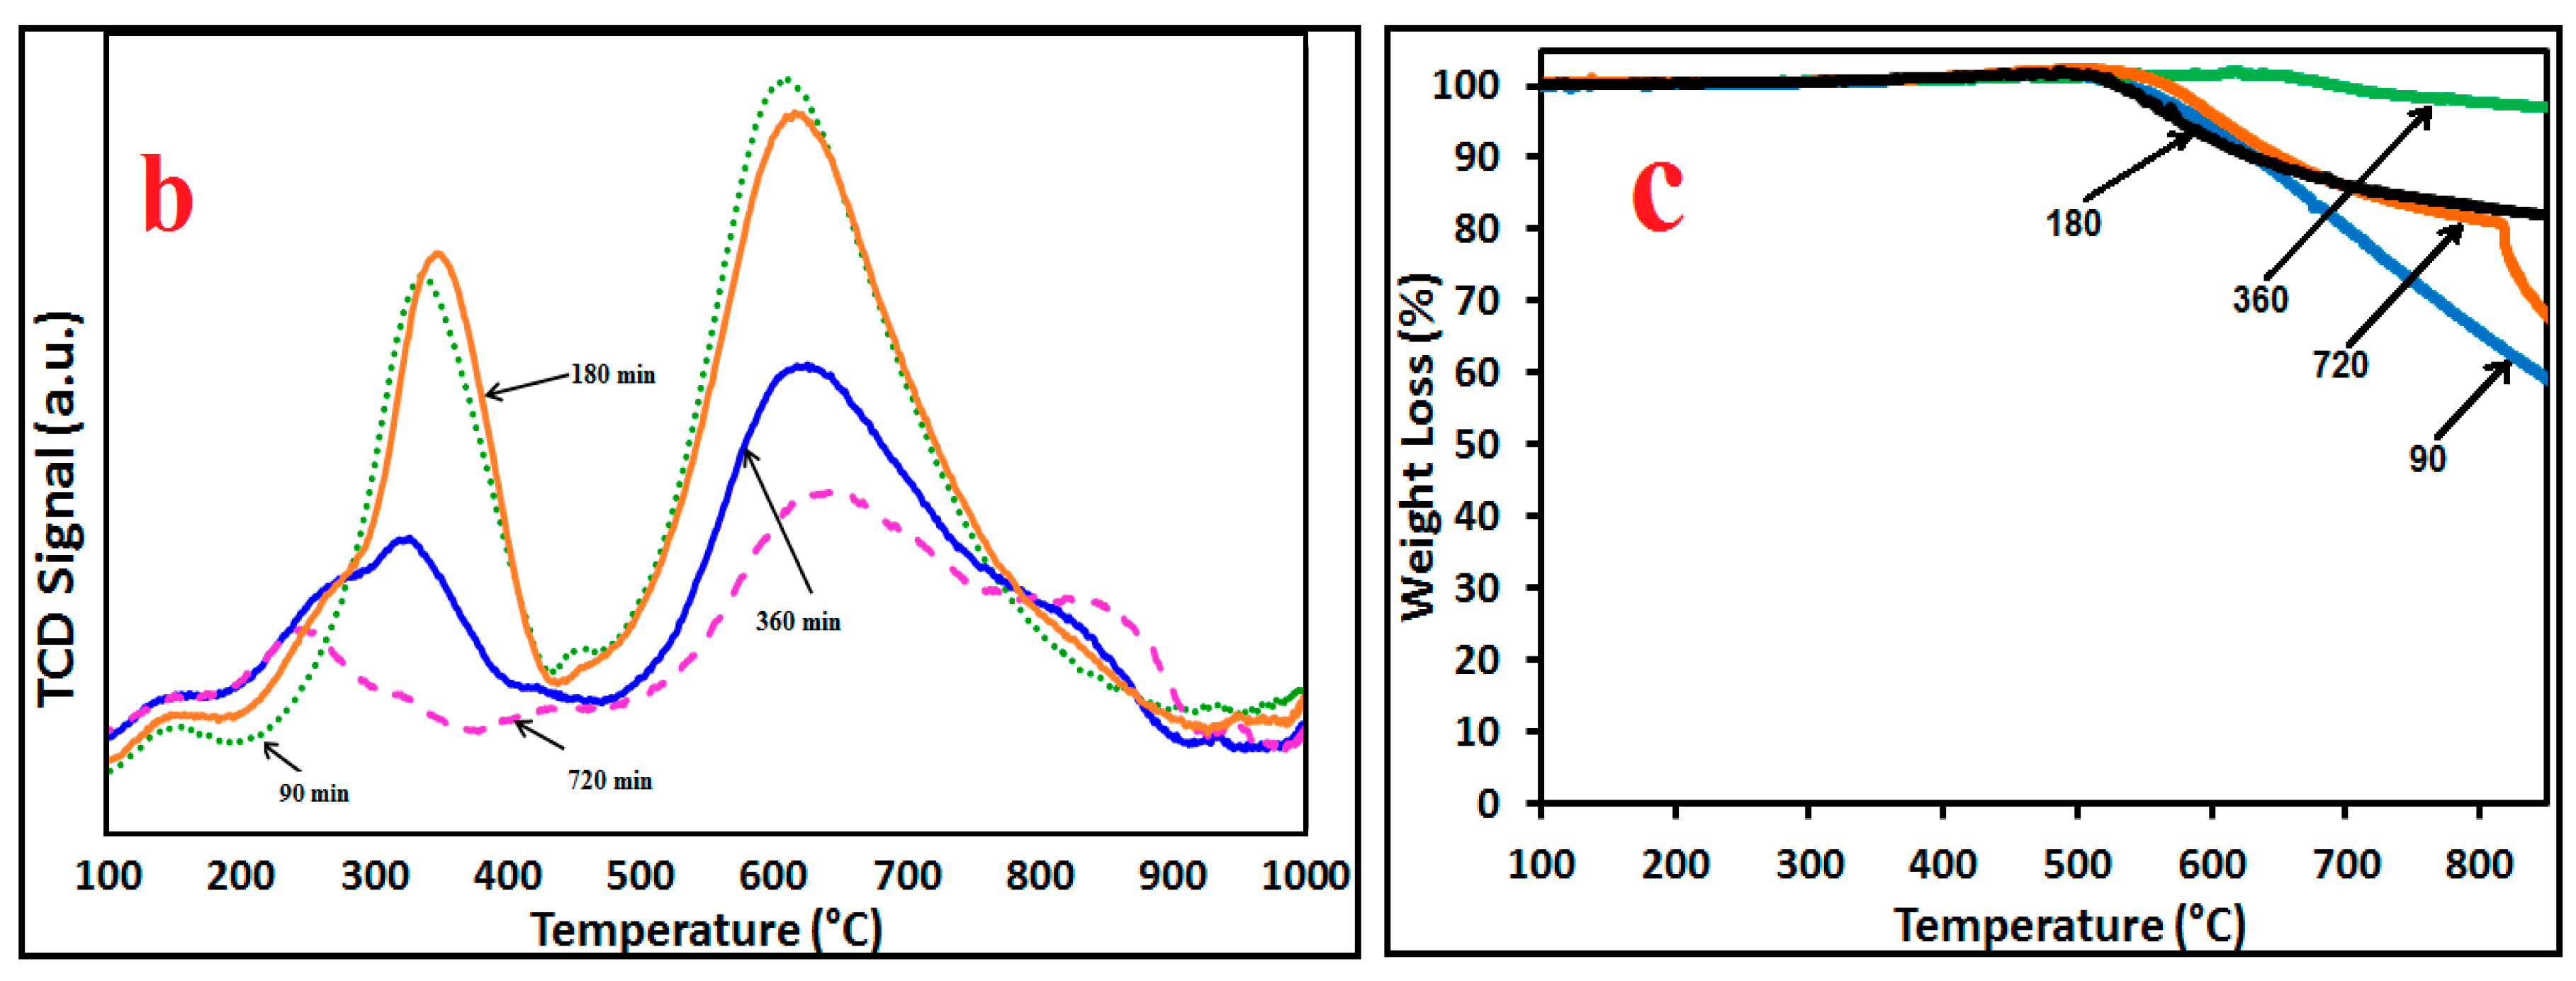
2.3. H2-TPR and TG Analysis

Hydrogen temperature programmed reduction experiments were carried out in 100 to 1000 °C temperature range under a hydrogen atmosphere. H2-TPR profiles of fresh, spent, and spent/regenerated 15Co–30Fe/Al2O3 samples are shown in Figure 5a,b. Figure 5a is for fresh catalyst, whereas Figure 5b is for the spent catalyst. The reduction profiles can be classified into three regions. In region I (200–450 °C), the reduction of hematite (Fe2O3) to Fe3O4 and the reduction of Co3O4 to CoO take place. In region II (450–710 °C), the reduction of Fe3O4 to FeO and the reduction of CoO to Co occur. In region III (710–900 °C), the reduction FeO to Fe happens. Similar results were observed by other investigators [49,50,51].
From the XRD analysis, the possible reducible phases in fresh sample were the following: Fe3O4, CoAl2O4 spinel, and probably some amorphous (or highly dispersed) Fe2+ and Co2+ species which could not be detected easily by XRD. Al2O3 was non-reducible under this work’s conditions due to the high binding energy between Al and O. Large differences in H2-TPR profiles were observed that depended on the time of reaction and the number of decomposition-oxidation cycles. However, for all samples, the reduction peaks observed below 450 °C were ascribed to the reduction of Co2+ species to nanoparticles of metallic cobalt, whereas the peaks observed between 450 and 900 °C were ascribed to the reduction of Fe3+ species of metallic iron. In the case of the SP-360 min and SP-720 min samples compared to other samples, several reduction peaks were observed at low and high temperatures; they could be ascribed to successive steps of the reduction to cobalt and iron species and/or to the presence of various types of Co and Fe species of different interactions with the support or with different particle size. Indeed, it is well known that the increase in the degree of the agglomeration and consequently the size of metal oxide particles could cause a decrease in the metal-support interaction and make reduction easier. From H2-TPR results, it should be pointed out that the H2 consumption decreased with the increasing reaction time (or the number of decomposition-regeneration cycles), probably because of the increase in the encapsulation rate of metallic particles in a zero-valence state that makes their oxidative regeneration difficult due to their inaccessibility to hydrogen molecules. This could justify the lower reducibility of both SP-360 min and SP-720 min samples. During the H2-TPR process, a hydrogasification of carbon deposits could also happen at temperatures above 700 °C by releasing methane (C(s) + 2H2 → CH4). An analysis of gaseous effluents (using, for example, mass spectrometry) is however necessary to assess this hypothesis.
TGA results of spent and spent/regenerated catalysts are shown in Figure 5c that shows a weight change in the temperature range 100–850 °C. All samples displayed weight loss (WL) from 500 to 850 °C which was related to the combustion of different kinds of carbon (cobalt carbide amorphous carbon and carbon nanotubes). The TGA curves showed that the weight loss decreased in the order WL(SP-90 min) > WL(SP-720 min) > WL(SP-360 min) > WL(SP-180 min). As expected, the highest weight loss was observed in the spent and not regenerated sample (SP-90 min). Comparing the regenerated samples, it was found that SP-180 min exhibited the lowest weight loss, indicating that the accumulation of encapsulating carbon deposition (difficult to remove) increased with the increasing number of decomposition-oxidation cycles. This result corresponded to the XRD finding which exhibited a more intense peak of carbon for samples having undergone several decomposition–regeneration cycles. In the case of SP-720 min, a change was noticed in the slope of the TGA curve, which suggested two kinds of coke deposit may be related to the more abundant presence of cobalt carbide over this catalyst.

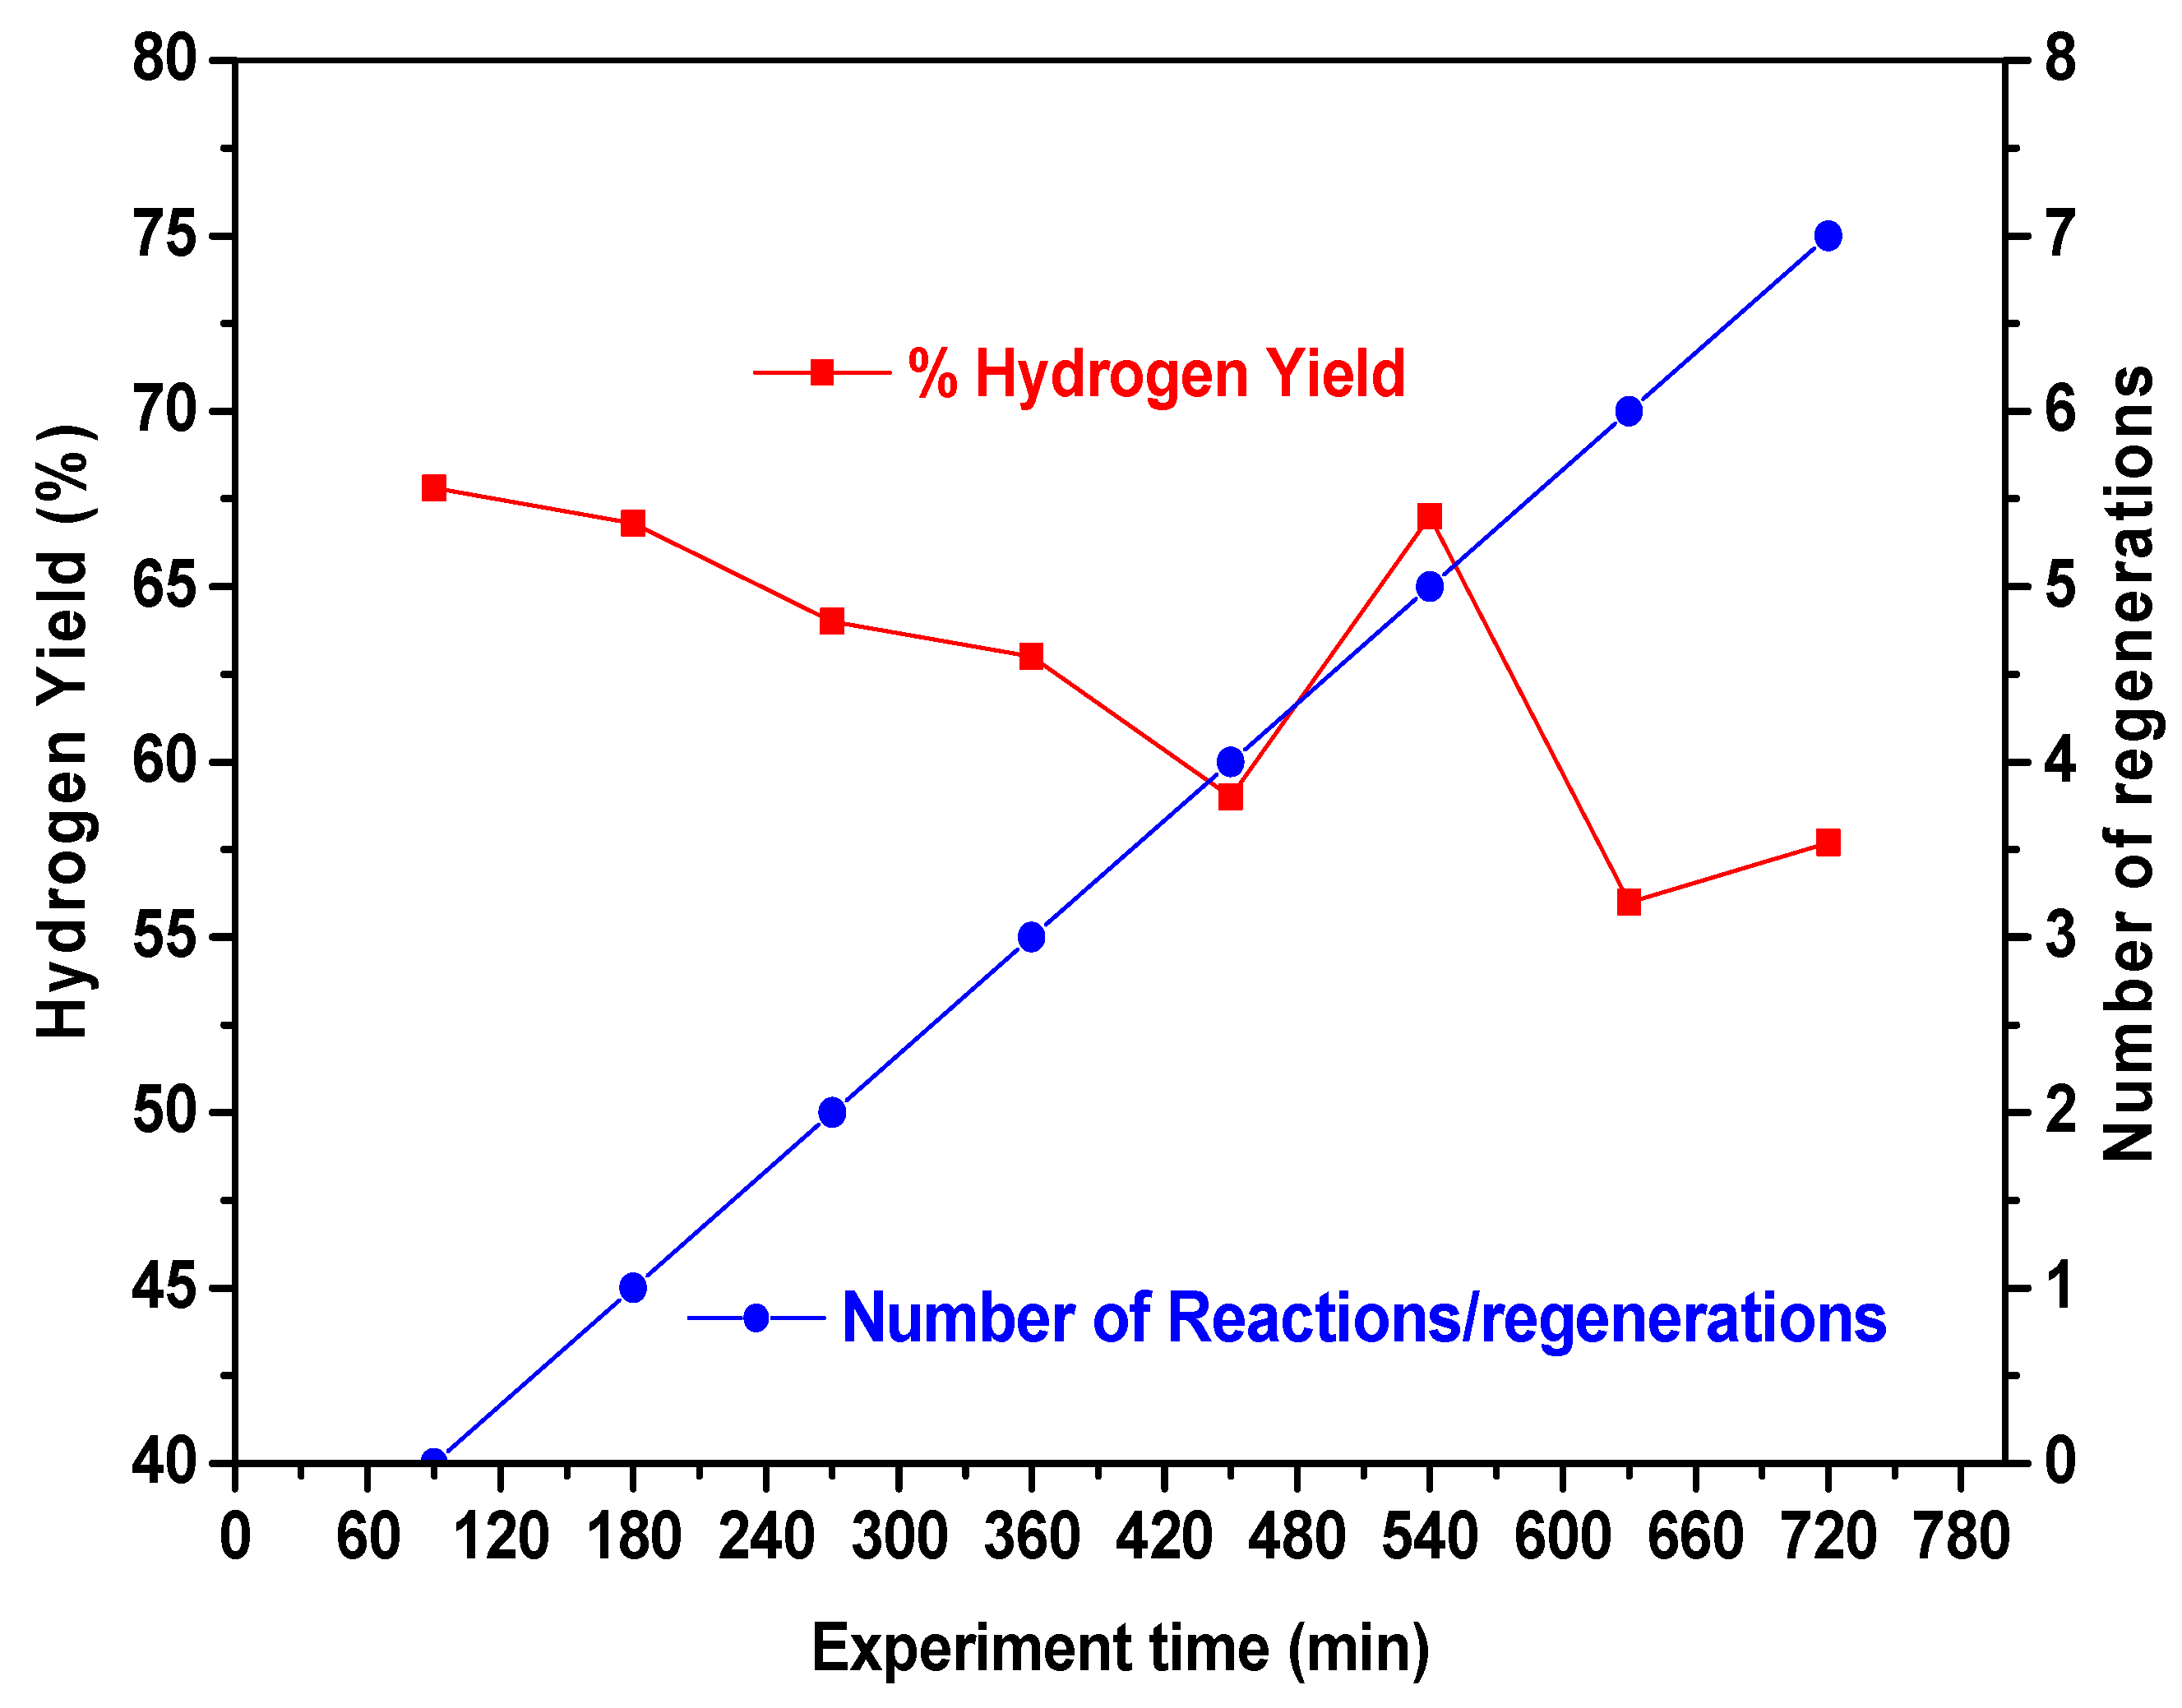
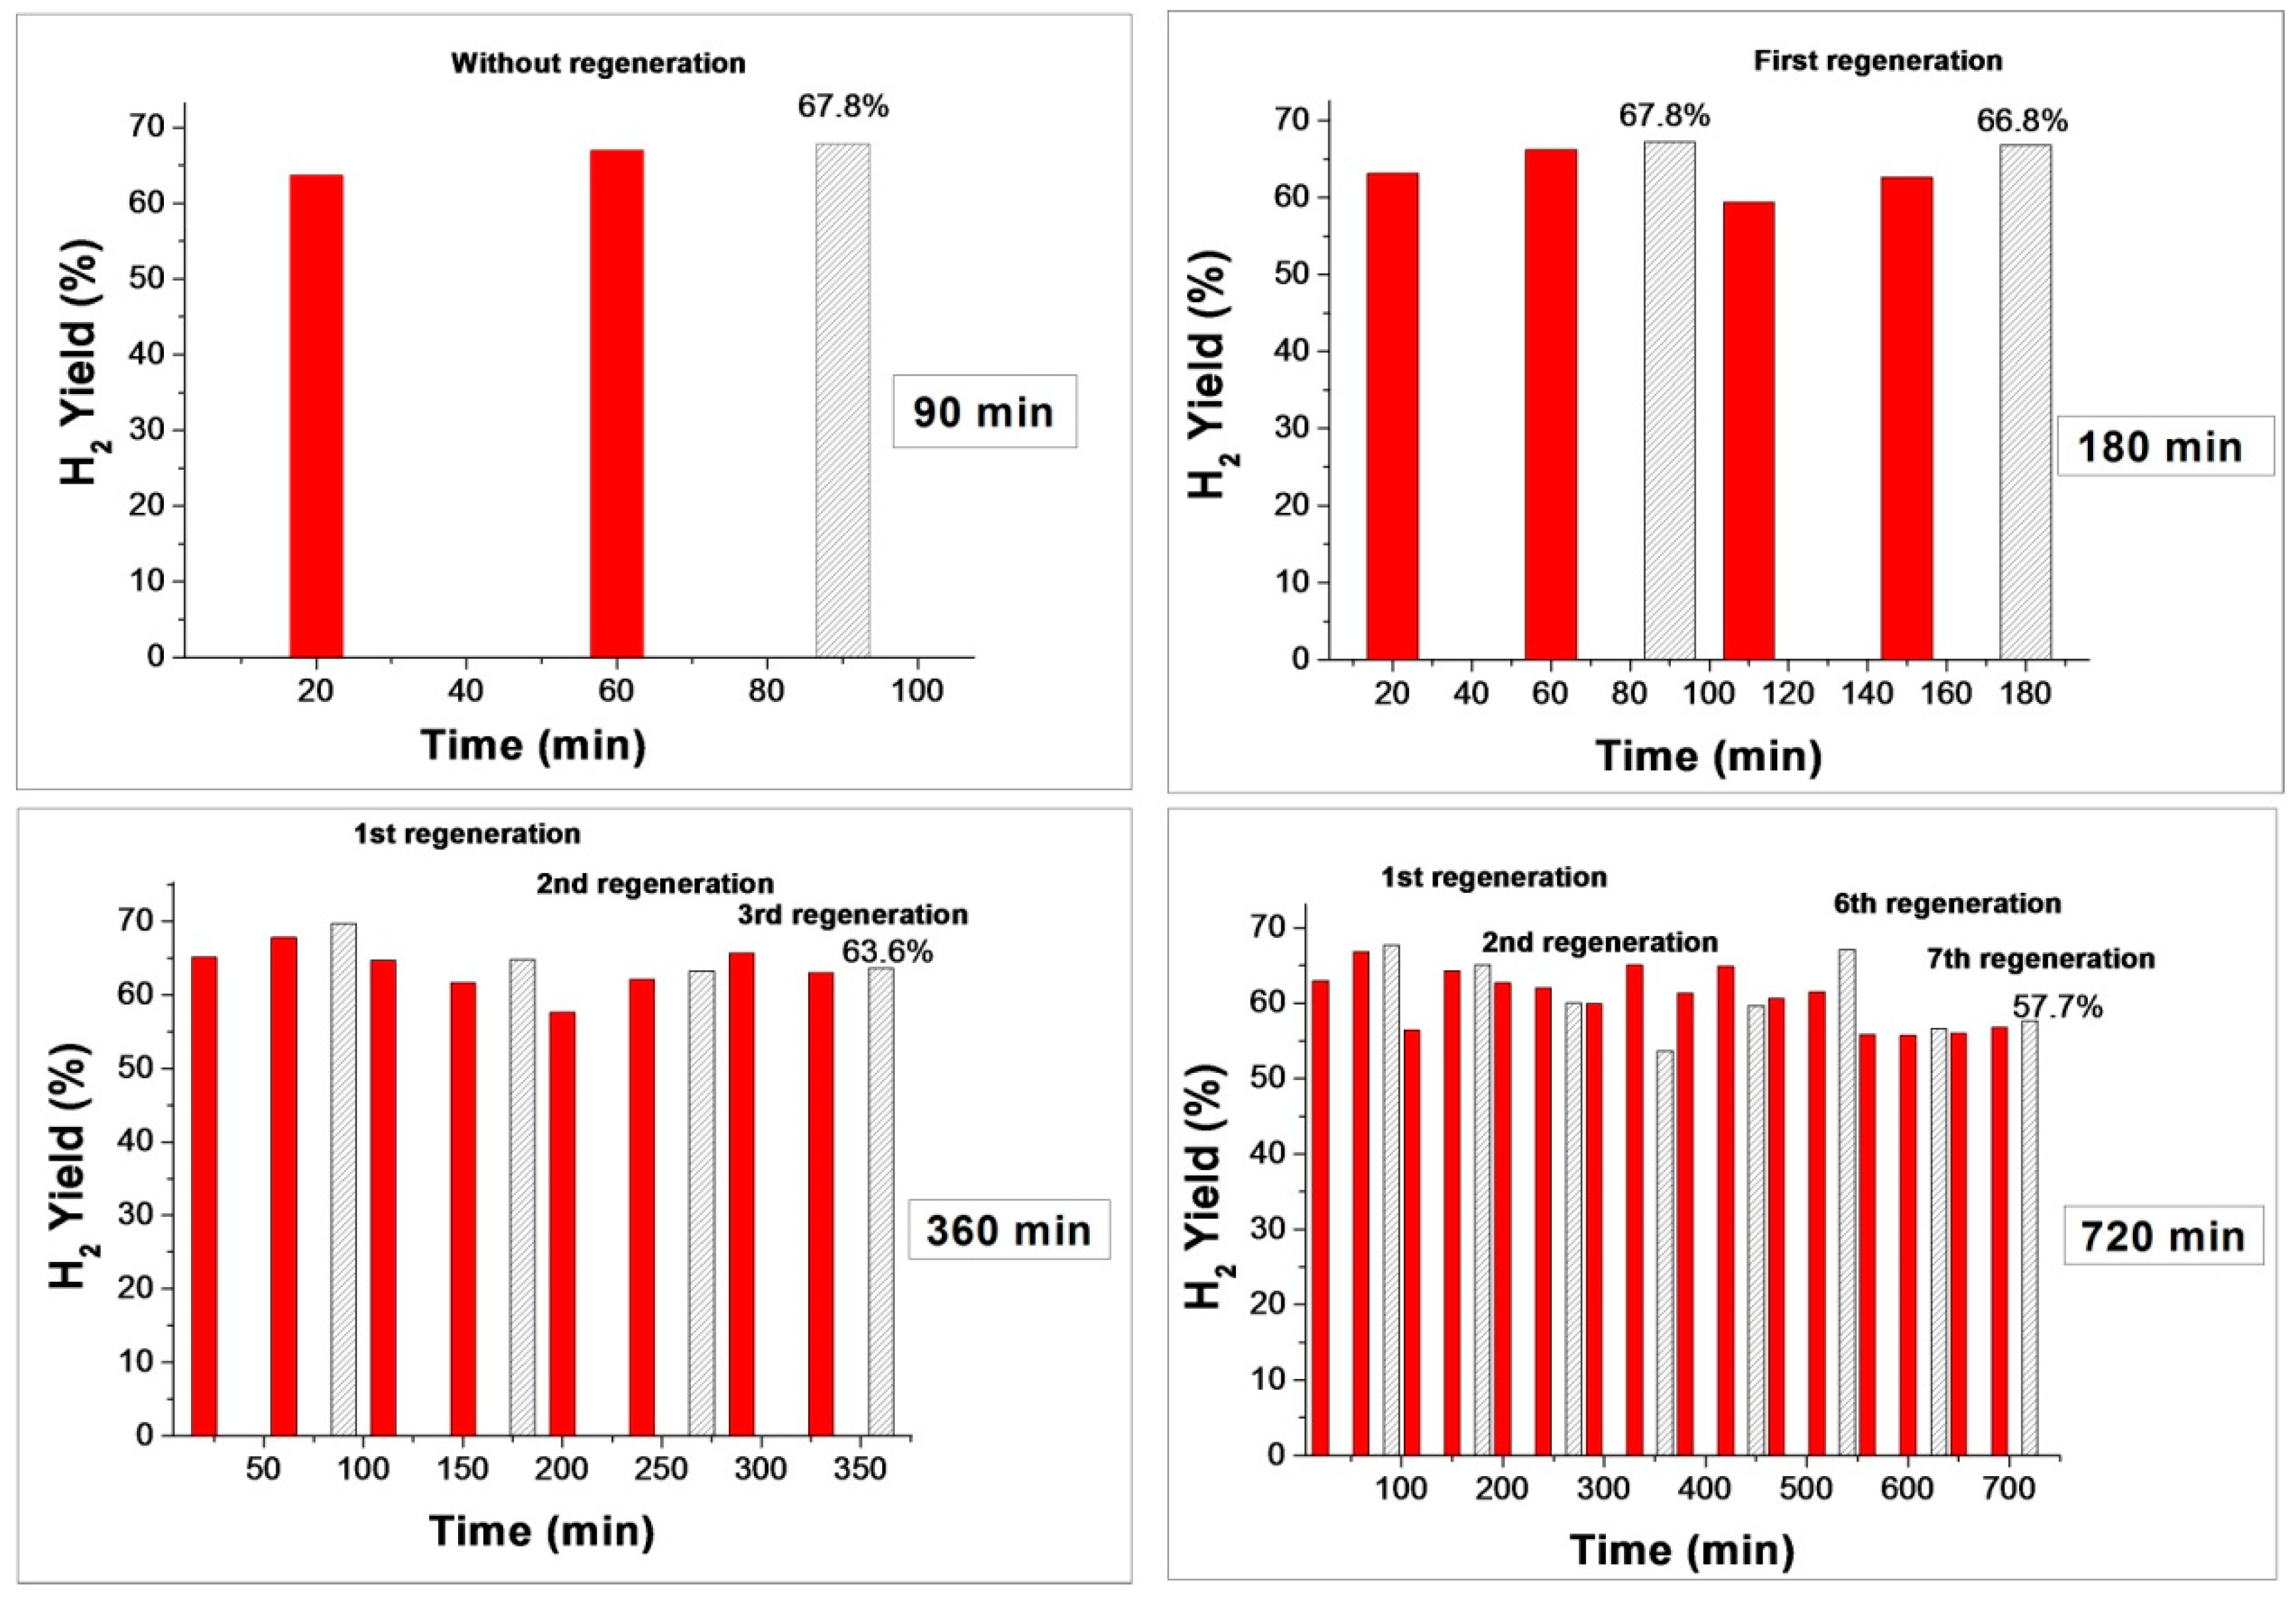
2.4. Catalysts Behavior under CMD-Regeneration Cycles

In most cases, during CMD reaction, carbon encapsulates the active sites and this carbon accumulation is responsible for catalyst deactivation. To increase the catalyst lifetime, regeneration cycles by gasification using oxygen as an oxidizing agent was introduced as has been described before. The regeneration step obviously required the interruption of the production process for 10 min. The catalytic activity of catalysts was determined by evaluating methane conversion and hydrogen yield obtained during the CMD process. In the present work, Weight hourly space velocity (WHSV) is calculated from the feed gas consisting of 15 mL/min of CH4 and 10 mL/min of N2 and weight of catalyst 0.3 g, as follows:
WHSV = ( 15 + 10 )   mL / min   ×   60   min / h 0.3  g-cat = 25   ×   60   mL /   ( h ) 0.3   ( g-cat ) = 5000   mL / ( h · g-cat. )
The methane conversion obtained here for regenerated catalysts is above 60%. Zhou et al. conducted an Fe catalyst for CMD and investigated the effect of space velocity on the methane conversion. When a space velocity (3750 mL/g-cat/h), close to the one used in the present work (5000 mL/g-cat/h), was considered, they found a methane conversion of about 38% [52].
Figure 6 compared the evolution, with time of stream (TOS), of the methane conversion obtained over the fresh catalyst and the spent catalysts subjected to successive cycles of CMD/regeneration. As can be seen, the results were not the same after the regeneration cycles. Only the points on the curve at 90, 180, 360, and 720 min corresponding to the samples SP-(90, 180, 360, 720 min) were considered. As is shown, the methane conversion decreased, as the reaction time was increased, in the order of 68% (90 min, zero cycle) > 63% (180 min, after two cycles) > 62% (360 min, after four cycles) > 56% (720 min, after eight cycles). This degradation of catalytic activity and loss of stability of the catalysts (about Δ% = 12% from 90 to 720 min of TOS) was due probably to irreversible deactivation caused by covering and encapsulating of active sites by deposited carbon. The same trend was observed in the BET surface area which decreased when the number of decomposition/regeneration cycles was increased, as is shown in Figure 3. On the other hand, it was shown that the reducibility of catalysts decreased when the number of decomposition/oxidation cycles was increased; this was attributed to the blocking of metallic particles (in the oxidation state zero) by the formation of encapsulating carbon species, consequently leading to the loss of active sites and catalyst deactivation. From these results, it could be concluded that the degradation of physicochemical and catalytic properties was essentially related to carbon formation that was not completely removed after repetitive oxidative regeneration steps. Therefore, the higher the amount of carbon deposited, the lower the catalytic activity.
Through this study’s experiments, the authors were able to verify that significant catalyst deactivation occurred toward higher regeneration times (involving a succession of cycles) despite a very interesting catalytic formulation. The formation of cobalt carbide CoC2 may then complicate the regeneration of metal catalysts (Figure 1), as reported in the literature [52].
Figure 6, Figure 7 and Figure 8 present, respectively, the evolution with time on stream (TOS) of H2 yield and the coproduced carbon on SP-(90, 180, 360, 720 min) samples. The hydrogen production by 67.8% (90 min) > 66.8% (180 min) > 63.7% (320 min) > 57.7% (720 min) followed the same evolution as the methane conversion. Similar to the conversion of methane, the hydrogen yield was affected by the number of regeneration cycles. It decreased with the increase in the regeneration number, but to a lesser extent. On the other hand, in the case of the carbon deposit, an increasing trend of carbon with the increase in the regeneration number was observed: 1.2 (180 min) < 1.5 (320 min) < 3.2 (720 min).
As reported by some authors [53], the catalyst deactivation mechanism rests on progressive pore blocking by carbon deposition. The carbon formation involved in the first step is the dissociative adsorption of methane on the metal surface (iron and cobalt) producing hydrogen and carbon atoms. The adsorbed carbon atoms could dissolve and diffuse through the metal. Those on the surface form, thereby encapsulating carbon, blocking the access of methane to the active sites, and causing a reduction of activity, as proposed by the following steps. During CMD reaction, the carbon may chemisorb firmly as a monolayer or physically adsorb in multilayers while releasing hydrogen [54]. In either case, this blocks the reactants from reaching the metal surface. The behavior is complex, because the carbon threads may grow from the top surface of the metal particles or the carbon may spread into the metal and form bulk carbides (e.g., formation of CoC2), as observed in the study’s XRD. According the H2-TPR conclusions, it can be stated that methane molecules may be formed through the reaction between carbon encapsulating particles and chemisorbed hydrogen gases.
The formation of encapsulating carbon on the metallic surface could be limited by Cads + H2 → CH4 reverse reaction (with H2 produced by reaction or added to the feed). This step was favored in the presence of a high hydrogen concentration in the feed which depended on the methane conversion. Besides coke deposition, the sintering of metallic active phase (Co, Fe) occurred during CMD reaction and oxidative regeneration process and was the second factor responsible for catalyst deactivation. Similar to carbon deposition, sintering brings about the loss of surface area and porosity. Despite the coke deposits and many oxidative treatments, the present catalysts remained active with a methane conversion and hydrogen yield exceeding 56% and 58%, respectively (after eight reaction cycles). Further tests were needed to optimize the regeneration step to eliminate quantitatively the carbon deposits and improve the catalytic performance.

3. Experimental Section

3.1. Preparation of Fresh Catalyst

A wet-impregnation technique was used to prepare a combined 15%Co–30%Fe supported on alumina catalyst. The synthesis steps are described as follows:
Alumina (γ-Al2O3; SA6175) were obtained from Norton Chemical Company (Short Hills, NJ, USA). The alumina were disintegrated into tiny particles before being employed as a ultimate support material. A first solution was prepared from a certain volume of double-distilled water and stoichiometric ferric nitrate amount (Fe(NO3)3·9H2O, Ass. ≥ 99%, Sigma-Aldrich, Taufkirchen, Germany). Dissolving a certain mass of cobalt nitrate (Co(NO3)3·9H2O, Ass. ≥ 99%, Sigma-Aldrich, Taufkirchen, Germany) in double-distilled water, a second solution was obtained. As in a typical wet-impregnation procedure, the two solutions of Co2+ and Fe3+ were simultaneously impregnated on the γ-Al2O3 support. The mixture was stirred at 80 °C for 3 h. After the stirring/heating step, more than 50% of the water contained in the mixture–solution evaporated. The final mixture was dried at 120 °C for 12 h (without washing) and followed by calcination at 450 °C for 3 h under air atmosphere. The mixed catalyst was designated as 15Co–30Fe/Al2O3.

3.2. Characterization Methods

XRD: X-ray powder diffraction (XRD) was carried out using a Rigaku (Miniflex) diffractometer (Rigaku, Bahrain, Saudi Arabia). The unit was set, using a Cu Kα radiation run at 40 kV and 40 mA, to investigate the diffraction peaks of the catalysts before and after the reaction. The 2θ step and the scanning range were set at 0.02° and 10–85°, respectively. The instrumental raw data was analyzed via X’pert HighScore Plus software (3.0.5, Malvern Panalytical Ltd, Malvern, UK, 2017). An ASCII file of the peak intensity was produced at granularity 8, bending factor 5, minimum, peak significance 1, minimum peak width 0.40, maximum tip width 1, and peak base width 2 by minimum second derivatives. Additional dissimilar phases with their marks were accorded using the JCPDS data bank (N.B.S*AIDS83, International Center for Diffraction Data, Newtown Square, PA, USA, 1980) and X’pert HighScore Plus software.
TEM: Samples were arranged for transmission electron microscopy (TEM) investigation by crushing the powders between clean glass slides and then scattering them onto a lacey carbon film held on a Cu mesh grid. Bright-field transmission electron microscopy (BF-TEM) and selected area electron diffraction (SAED) experiments were performed using a JEOL 2000FX microscope (JEOL, Peabody, MA, USA) fitted with a thermionic LaB6 source working at 200 kV.
LRS: Laser Raman spectroscopy apparatus was represented by a highly sensitive CCD Q15 spectrograph (Thorlabs, Munich, Germany) having two 215 excitation lasers of 532 and 785 nm with CCD cooling temperature reaching up to 60 °C and high-throughput laboratory fiber optic probes. Moreover, the scanning was fixed between 250 and 2350 cm−1.
N2-physisorption: The distribution of the pore size and the specific surface area of the catalysts were computed from N2 adsorption–desorption data. Measurements of the BET surface area were conducted by nitrogen adsorption at −196 °C using a Micromeritics Tristar II 3020 (Micromeritics, Riyadh, Saudi Arabia) surface area and porosity analyzer. In each test, 300 mg of catalyst was degassed at 300 °C for 3 h to remove the wetness and adsorbed gases from the catalyst surface. Pore size distribution was computed via the Barrett-Joyner-Halenda (BJH) technique.
H2-TPR: Micromeritics Auto Chem II apparatus (Micromeritics, Riyadh, Saudi Arabia) was employed in the temperature programmed reduction (TPR) to examine the reducibility by taking 0.07 g for each test. High purity argon flow was first passed thought the samples at 150 °C for 30 min. Then, the samples were brought to 25 °C. Lastly, the furnace temperature was set to 1000 °C at a 10 °C/min rate while running 40 mL/min flow rate of H2/Ar mixture that had 10 vol % of H2. A thermal conductivity detector (TCD) checked the H2 consumption signals.
TGA: The quantitative investigation of coke formation on the used catalysts after the duration of 90, 180, 360, and 720 min reaction at 700 °C was conducted using thermogravimetric analysis (TGA) in the presence of air via a Shimadzu TGA (Thermo-gravimetric/Differential) analyzer (Shimadzu, Jebel Ali Free Zone, Dubai). The temperature of the spent catalysts weighing 10–15 mg was increased from 25 °C to 1000 °C at a heating rate of 20 °C/min, and the mass reduction was recorded.
AAS: Atomic absorption spectrometry was employed to examine samples of Fe and Co components in the catalysts. The AAS analyses were conducted using a Model 951 AA/AE (Berkeley Nucleonics corporation, San Rafael, CA, USA) spectrophotometer with graphite furnace and Model 254 Auto sampler. The composition of Co and Fe in catalysts were theoretically determined and compared to those experimentally obtained by AAS.

3.3. Activity Test (Regeneration Procedure)

CMD activity tests were done in a fixed-bed quartz reactor (id = 9 mm). Before the CMD reaction, 0.3 g of the catalyst was reduced in situ under hydrogen flow (40 mL/min) at 500 °C for 60 min. Then 20 min of N2 flushing was carried out. Subsequently, the reactor temperature was raised to 700 °C under N2. For all runs, a fixed feed gas composed of 15 mL of CH4 and 10 mL of N2 was used.
The regeneration cycles were performed in situ at 700 °C under diluted O2 gasifying agent (10%O2/N2), followed by inert treatment under N2. The obtained regenerated catalyst was tested again in CMD reaction. First, the CMD reaction was carried out for 90 min in CMD reaction. Then, the spent catalyst (labeled SP-90 min) was removed for characterization as a reference. Then, the reactor was charged with fresh catalyst and the above steps were repeated for each of the following experiments:
In the first regeneration experiment: the CMD reaction was performed for 90 min. At this point, 10 mL/min of O2 was added to the system for 10 min. Then, the reactor was fed with N2 at a rate of 20 mL/min for 20 min and the CMD reaction was continued for another 90 min to finally obtain 180 min (= 2 × 90 min). Then, the spent/regenerated catalyst (noted as SP-180 min) was removed for characterization.
In the last regeneration experiment: the reactor was again recharged with a fresh catalyst. The CMD reaction was allowed to run for 90 min. Then, 10 mL/min of O2 was used to regenerate the catalyst for 10 min. Then, 20 mL/min of N2 was used to flush the reactor for 20 min and the reaction was continued for another 90 min. After that, the above addition of O2 and N2 was periodically repeated for eight cycles to give a total time of reaction/regeneration of 720 min (= 8 × 90 min). Then, the spent/regenerated catalyst (labeled as SP-720 min) was removed for characterization.
Finally, in this work, three regenerations of periodic cycling (with 2×, 4×, and 8× of 90 min) were chosen and the spent samples at 180, 360, and 720 min were removed for characterizations.
The CH4 reactant and H2 product were evaluated using an online GC (Alpha MOS PR 2100, Alpha MOS, Toulouse, France,) fitted with a sampling valve and two thermal conductivity detectors for examining heavier and lighter gases. CH4 conversion and H2 yield were computed using Equations (1) and (2):
CH 4   conversion ( % ) = CH 4 in CH 4 out CH 4 in   ×   100 ,
H 2 Yield ( % ) =   H 2 out 2   ×   CH 4   converted   ×   100 .

4. Conclusions

In this work, an alumina-supported cobalt–iron sample (15Co–30Fe/Al2O3) was prepared and used in the catalytic methane decomposition and regeneration process. In situ regeneration of spent catalysts was performed with different oxidizing forced periodic cycling at 180, 360, and 720 min. The X-ray powder diffraction results showed the presence of γ-Al2O3 phase, Fe3O4 magnetite and CoFe2O4 spinel in fresh catalyst, whereas SP-90 min spent catalyst provided only graphite, Fe0 and CoC2 reflections. The X-ray powder diffraction profile of SP-720 min spent/regenerated catalyst exhibited a new allotropic phase identified as θ-Al2O3. Transmission electron microscopy of spent and spent/regenerated samples indicated the formation of filamentous multi-walled carbon nanotubes; these nanotubes were formed by large amounts of encapsulating carbon on the surface which played an important role in the explanation of the reaction mechanism. Furthermore, different carbon bonds, detected by laser Raman spectroscopy, revealed the presence of graphite carbon structure on the molecular level. The reduction peaks were ascribed to the reduction of Co2+ species to nanoparticles of Co0 (below 450 °C) and Fe3+ → Fe2+ → Fe0 (between 450 and 900 °C). The catalytic activities of spent/regenerated catalysts exhibited lower activity at a higher cycle number. Hydrogen yield was affected by the oxidizing regeneration number (same trend as methane conversion); on the other hand, carbon deposit (calculated by atomic absorption spectroscopy) followed the reverse trend. Indeed, the formation of carbon encapsulating on the metallic surface could be limited by the Cads + H2 → CH4 reverse reaction. This observation has been confirmed by the hydrogasification of carbon deposit (in H2-TPR toward 700 °C) by releasing methane (C(s) + 2H2 → CH4). The authors believe that the main factors responsible for the catalyst deactivation are coke deposition and weak sintering of the metallic active phase (Co–Fe) which occurred during the catalytic methane decomposition reaction and regeneration process.

Author Contributions

A.S.A.-F., A.H.F., A.A.I., and A.E.A. carried out all experiments and characterization tests as well as shared in the analysis of the data and shared in the writing of the manuscript. Both S.B. and A.B. wrote the paper and shared data analysis. R.-L.A.-O. performed TGA measurements as well as sharing in the writing of the manuscript.

Funding

This research was funded by the Deanship of Scientific Research at King Saud University, Project No. RG-1435-078.

Acknowledgments

The authors would like to express their sincere appreciation to the Deanship of Scientific Research at King Saud University for its funding for this research group Project No. RG-1435-078.

Conflicts of Interest

The authors declare no conflict of interest.

References

  1. Dodds, P.E.; Staffell, I.; Hawkes, A.D.; Li, F.; Grunewald, P.; McDowall, W.; Ekins, P.D. Hydrogen and fuel cell technologies for heating: A review. Int. J. Hydrog. Energy 2015, 40, 2065–2083. [Google Scholar] [CrossRef]
  2. Deng, J.; Lv, X.; Gao, J.; Pu, A.; Li, M.; Sun, X.; Zhong, J. Facile synthesis of carbon-coated hematite nanostructures for solar water splitting. Energy Environ. Sci. 2013, 6, 1965–1970. [Google Scholar] [CrossRef]
  3. Lima, S.M.; Cruz, I.O.; Jacobs, G.; Davis, B.H.; Mattos, L.V.; Noronha, F.B. Steam reforming, partial oxidation, and oxidative steam reforming of ethanol over Pt/CeZrO2 catalyst. J. Catal. 2008, 257, 356–368. [Google Scholar]
  4. Siriwardane, R.; Tian, H.; Fisher, J. Production of pure hydrogen and synthesis gas with Cu-Fe oxygen carriers using combined processes of chemical looping combustion and methane decomposition/reforming. Int. J. Hydrog. Energy 2015, 40, 1698–1708. [Google Scholar] [CrossRef]
  5. Al-Fatesh, S.A.; Ibrahim, A.A.; Abu-Dahrieh, J.K.; Al-Awadi, A.S.; El-Toni, A.M.; Fakeeha, A.H.; Abasaeed, A.E. Gallium-Promoted Ni Catalyst Supported on MCM-41 for Dry Reforming of Methane. Catalysts 2018, 8, 229. [Google Scholar] [CrossRef]
  6. Osman, A.I.; Abu-Dahrieh, J.K.; Cherkasov, N.; Fernandez-Garcia, J.; Walker, D.; Walton, R.I.; Rooney, D.W.; Rebrov, E. A highly active and synergistic Pt/Mo2C/Al2O3 catalyst for water-gas shift reaction. Mol. Catal. 2018, 455, 38–47. [Google Scholar] [CrossRef]
  7. Osman, A.I.; Meudal, J.; Laffir, F.; Thompson, J.; Rooney, D. Enhanced catalytic activity of Ni on η-Al2O3 and ZSM-5 on addition of ceria zirconia for the partial oxidation of methane. App. Catal. B Environ. 2017, 212, 68–79. [Google Scholar] [CrossRef]
  8. Politano, A.; Cattelan, M.; Boukhvalov, D.W.; Campi, D.; Cupolillo, A.; Gnoli, S.; Apostol, N.G.; Lacovig, P.; Lizzit, S.; Far, D.; et al. Unveiling the Mechanisms Leading to H2 Production Promoted by Water Decomposition on Epitaxial Graphene at Room Temperature. ACS Nano 2016, 10, 4543–4549. [Google Scholar] [CrossRef] [PubMed]
  9. Abbas, H.F.; Daud, W.M.A. Hydrogen production by methane decomposition: A review. Int. J. Hydrog. Energy 2010, 35, 1160–1190. [Google Scholar] [CrossRef]
  10. Diehm, C.; Deutschmann, O. Hydrogen production by catalytic partial oxidation of methane over staged Pd/Rh coated monoliths: Spatially resolved concentration and temperature profiles. Int. J. Hydrog. Energy 2014, 39, 17998–18004. [Google Scholar] [CrossRef]
  11. Vigneault, A.; Grace, J.R. Hydrogen production in multi-Channel membrane reactor via steam methane reforming and methane catalytic combustion. Int. J. Hydrog. Energy 2015, 40, 233–243. [Google Scholar] [CrossRef]
  12. Wang, Y.; Peng, J.; Zhou, C.; Lim, Z.-Y.; Wu, C.; Ye, S.; Wang, G. Effect of Pr addition on the properties of Ni/Al2O3 catalysts with an application in the autothermal reforming of methane. Int. J. Hydrog. Energy 2014, 39, 778–787. [Google Scholar] [CrossRef]
  13. Fakeeha, A.H.; Khan, W.U.; Al-Fatesh, A.S.; Abasaeed, A.E.; Naeem, M.A. Production of hydrogen and carbon nanofibers from methane over Ni-Co-Al catalysts. Int. J. Hydrog. Energy 2015, 40, 1774–1781. [Google Scholar] [CrossRef]
  14. Al-Hassani, A.A.; Abbas, H.F.; Wan Daud, W.M.A. Production of COx-free hydrogen by the thermal decomposition of methane over activated carbon: Catalyst deactivation. Int. J. Hydrog. Energy 2014, 39, 14783–14791. [Google Scholar] [CrossRef]
  15. Anjaneyulu, C.; Kumar, S.N.; Kumar, V.V.; Naresh, G.; Bhargava, S.K.; Chary, K.V.R.; Venugopal, A. Influence of La on reduction behavior and Ni metal surface area of Ni-Al2O3 catalysts for COx free H2 by catalytic decomposition of methane. Int. J. Hydrog. Energy 2015, 40, 3633–3641. [Google Scholar] [CrossRef]
  16. Al-Hassani, A.A.; Abbas, H.F.; Wan Daud, W.M.A. Hydrogen production via decomposition of methane over activated carbons as catalysts: Full factorial design. Int. J. Hydrog. Energy 2014, 39, 7004–7014. [Google Scholar] [CrossRef]
  17. Pereira, M.F.R.; Figueiredo, J.L.; Órfão, J.J.M.; Serp, P.; Kalck, P.; Kihn, Y. Catalytic activity of carbon nanotubes in the oxidative dehydrogenation of ethylbenzene. Carbon 2004, 42, 2807–2813. [Google Scholar] [CrossRef]
  18. Serp, P.; Corrias, M.; Kalck, P. Carbon nanotubes and nanofibers in catalysis. Appl. Catal. A Gen. 2003, 253, 337–358. [Google Scholar] [CrossRef]
  19. Iijima, S. Helical microtubes of graphitic carbon. Nature 1991, 354, 56–58. [Google Scholar] [CrossRef]
  20. Lee, M.S.; Lee, S.Y.; Park, S.J. Preparation and characterization of multi-walled carbon nanotubes impregnated with polyethyleneimine for carbon dioxide capture. Int. J. Hydrog. Energy 2015, 40, 3415–3421. [Google Scholar] [CrossRef]
  21. Takenaka, S.; Ishida, M.; Serizawa, M.; Tanabe, E.; Otsuka, K. Formation of carbon nanofibers and carbon nanotubes through methane decomposition over supported cobalt catalysts. J. Phys. Chem. B 2004, 108, 11464–11472. [Google Scholar] [CrossRef]
  22. Li, D.; Chen, J.; Li, Y. Evidence of composition deviation of metal particles of a NieCu/Al2O3 catalyst during methane decomposition to COx-free hydrogen. Int. J. Hydrog. Energy 2009, 34, 299–307. [Google Scholar] [CrossRef]
  23. Jana, P.; de la Pena, V.A.; Shea, O.; Coronado, J.M.; Serrano, D.P. Cobalt based catalysts prepared by pechini method for CO2-free hydrogen production by methane decomposition. Int. J. Hydrog. Energy 2010, 35, 10285–10294. [Google Scholar] [CrossRef]
  24. Pinilla, J.L.; Utrilla, R.; Lazaro, M.J.; Moliner, R.; Suelves, I.; García, A.B. Ni- and Fe-based catalysts for hydrogen and carbon nanofilament production by catalytic decomposition of methane in a rotary bed reactor. Fuel Process. Technol. 2011, 92, 1480–1488. [Google Scholar] [CrossRef]
  25. Politano, A.; Chiarello, G. Unveiling the Oxidation Processes of Pt3Ni(111) by Real-Time Surface Core-Level Spectroscopy. ChemCatChem 2016, 8, 713–718. [Google Scholar] [CrossRef]
  26. Ren, H.; Humbert, M.P.; Carl, A.; Menning, C.A.; Chen, J.G.; Shu, Y.; Singh, U.G.; Cheng, W.C. Inhibition of coking and CO poisoning of Pt catalysts by the formation of Au/Pt bimetallic surfaces. Appl. Catal. A 2010, 375, 303–309. [Google Scholar] [CrossRef]
  27. Baraldi, A.; Bianchettin, L.; Gironcoli, S.D.; Vesselli, E.; Lizzit, S.; Petaccia, L.; Comelli, G.; Rosei, R. Enhanced chemical reactivity of under-coordinated atoms at Pt-Rh bimetallic surfaces: A spectroscopic characterization. J. Phys. Chem. C 2011, 115, 3378–3384. [Google Scholar] [CrossRef]
  28. Nilekar, A.U.; Xu, Y.; Zhang, J.; Vukmirovic, M.B.; Sasaki, K.; Adzic, R.; Mavrikakis, M. Bimetallic and Ternary Alloys for Improved Oxygen Reduction Catalysis. Top. Catal. 2007, 46, 276–284. [Google Scholar] [CrossRef]
  29. Reshetenko, T.V.; Avdeeva, L.B.; Ushakov, V.A.; Moroz, E.M.; Shmakov, A.N.; Kriventsov, V.V.; Kochubey, D.I.; Pavlyukhin, Y.T.; Chuvilin, A.L.; Ismagilov, Z.R. Coprecipitated iron-containing catalysts (Fe-Al2O3, Fe-Co-Al2O3, Fe-Ni-Al2O3) for methane decomposition at moderate temperatures. Part II: Evolution of the catalysts in reaction. Appl. Catal. A 2004, 270, 87–99. [Google Scholar] [CrossRef]
  30. Shen, W.; Huggins, F.E.; Shah, N.; Jacobs, G.; Wang, Y.; Shi, X.; Huffman, G.P. Novel Fe–Ni nanoparticle catalyst for the production of CO- and CO2-free H2 and carbon nanotubes by dehydrogenation of methane. Appl. Catal. A 2008, 351, 102–110. [Google Scholar] [CrossRef]
  31. Avdeeva, L.B.; Reshetenko, T.V.; Ismagilov, Z.R.; Likholobov, V.A. Iron-containing catalysts of methane decomposition: Accumulation of filamentous carbon. Appl. Catal. A 2002, 228, 53–63. [Google Scholar] [CrossRef]
  32. Latorre, N.; Cazana, F.; Martínez-Hansen, V.M.; Royo, C.; Romeo, E.; Monzón, A. Ni-Co-Mg-Al catalysts for hydrogen and carbonaceous nanomaterials production by CCVD of methane. Catal. Today 2011, 172, 143–151. [Google Scholar] [CrossRef]
  33. Shah, N.; Panjala, D.; Huffman, G.P. Hydrogen production by catalytic decomposition of methane. Energy Fuels 2001, 15, 1528–1534. [Google Scholar] [CrossRef]
  34. Pudukudy, M.; Yaakob, Z.; Zubair, Z.; Akmal, S. Direct decomposition of methane over Pd promoted Ni/SBA-15 catalysts. Appl. Surf. Sci. 2015, 353, 127–136. [Google Scholar] [CrossRef]
  35. Awadallah, A.E.; Aboul-Enein, A.A.; El-Desouki, D.S.; Aboul-Gheit, A.K. Catalytic thermal decomposition of methane to COx-free hydrogen and carbon nanotubes over MgO supported bimetallic group VIII catalysts. Appl. Surf. Sci. 2014, 296, 100–107. [Google Scholar] [CrossRef]
  36. Bartholomew, C.H. Carbon deposition in steam reforming and methanation. Catal. Rev. Sci. Eng. 1982, 24, 67–112. [Google Scholar] [CrossRef]
  37. Hartenstein, H.U.; Hoffman, T. Method of Regeneration of SCR Catalyst. U.S. Patent 7723251B2, 25 May 2010. [Google Scholar]
  38. Hazzim, F.; Abbas, W.M.A.; Wan, D. Thermocatalytic decomposition of methane for hydrogen production using activated carbon catalyst: Regeneration and characterization studies. Int. J. Hydrog. Energy 2009, 34, 8034–8045. [Google Scholar]
  39. Al-Fatesh, A.S.; Fakeeha, A.H.; Khan, W.U.; Ibrahim, A.A.; He, S.; Seshan, K. Production of hydrogen by catalytic methane decomposition over alumina supported mono-, bi- and tri-metallic catalysts. Int. J. Hydrog. Energy 2016, 41, 22932–22940. [Google Scholar] [CrossRef]
  40. Osman, A.I.; Abu-Dahrieh, J.K.; McLaren, M.; Laffir, F.; Rooney, D.W. Characterization of Robust Combustion Catalyst from Aluminum Foil Waste. ChemistrySelect 2018, 3, 1545–1550. [Google Scholar] [CrossRef]
  41. Zárate, J.; Rosas, G.; Pérez, R. Structural Transformations of the Pseudo boehmite to a-Alumina. Adv. Technol. Mater. Mater. Process. J. 2005, 1. [Google Scholar] [CrossRef]
  42. Jorio, A.; Saito, R.; Hafner, J.H.; Lieber, C.M.; Hunter, M.; McClure, T.; Dresselhaus, G.; Dresselhaus, M.S. Structural (n, m) determination of isolated single-wall carbon nanotubes by resonant Raman scattering. Phys. Rev. Lett. 2001, 86, 1118–1121. [Google Scholar] [CrossRef] [PubMed]
  43. Hou, P.X.; Xu, S.T.; Ying, Z.; Yang, Q.H.; Liu, C.; Cheng, H.M. Hydrogen adsorption/desorption behavior of multi-walled carbon nanotubes with different diameters. Carbon 2003, 41, 2471–2476. [Google Scholar] [CrossRef]
  44. Miners, S.A.; Rance, G.A.; Khlobystov, A.N. Chemical reactions confined within carbon nanotubes. Chem. Soc. Rev. 2016, 45, 4727–4746. [Google Scholar] [CrossRef] [PubMed]
  45. Cullity, B.D. Elements of X-ray Diffractions; Addison-Wesley: New York, NY, USA, 1956. [Google Scholar]
  46. Al-Fatesh., A.S.; Barama, S.; Ibrahim, A.A.; Barama, A.; Khan, W.U.; Fakeeha, A. Study of Methane Decomposition on Fe/MgO-Based Catalyst Modified by Ni, Co, and Mn Additives. Chem. Eng. Commun. 2017, 204, 739–749. [Google Scholar] [CrossRef]
  47. Al-Fatesh, A.S.; Amin, A.; Ibrahim, A.A.; Khan, W.U.; Soliman, M.A.; AL-Otaibi, R.L.; Fakeeha, A.H. Effect of Ce and Co Addition to Fe/Al2O3 for Catalytic Methane Decomposition. Catalysts 2016, 6, 40. [Google Scholar] [CrossRef]
  48. Ferrari, A.C. Raman spectroscopy of graphene and graphite: Disorder, electron–phonon coupling, doping and non-adiabatic effects. Solid State Commun. 2007, 143, 47–57. [Google Scholar] [CrossRef]
  49. Shi, B.; Zhang, Z.; Zha, B.; Liu, D. Structure evolution of spinel Fe-MII (M=Mn, Fe, Co, Ni) ferrite in CO hydrogeneration. Mol. Catal. 2018, 456, 31–37. [Google Scholar] [CrossRef]
  50. Khan, A.; Smirniotis, P.G. Relationship between temperature-programmed reduction profile and activity of modified ferrite-based catalysts for WGS reaction. J. Mol. Catal. A Chem. 2008, 280, 43–51. [Google Scholar] [CrossRef]
  51. Jo, S.B.; Chae, H.J.; Kim, T.Y.; Lee, C.H.; Oh, J.U.; Kang, S.-H.; Kim, J.W.; Jeong, M.; Lee, S.C.; Kim, J.C. Selective CO hydrogenation over bimetallic Co-Fe catalysts for the production of light paraffin hydrocarbons (C2-C4): Effect of H2/CO ratio and reaction temperature. Catal. Commun. 2018, 117, 74–78. [Google Scholar] [CrossRef]
  52. Zhou, L.; Enakonda, L.R.; Harb, M.; Saih, Y.; A-Tapiaa, A.; Ould-Chikh, S.; Hazemann, J.L.; Li, J.; Wei, N.; Gary, D.; et al. Fe catalysts for methane decomposition to produce hydrogen and carbon nano materials. Appl. Catal. B Environ. 2017, 208, 44–59. [Google Scholar] [CrossRef]
  53. Muradov, N.; Chen, Z.; Smith, F. Fossil hydrogen with reduced CO2 emission: Modeling thermocatalytic decomposition of methane in a fluidized bed of carbon particles. Int. J. Hydrog. Energy 2005, 30, 1149–1158. [Google Scholar] [CrossRef]
  54. Moliner, R.; Suelves, I.; Lázaro, M.J.; Moreno, O. Thermo-catalytic decomposition of methane over activated carbons: Influence of textural properties and surface chemistry. Int. J. Hydrog. Energy 2005, 30, 293–300. [Google Scholar] [CrossRef]
Figure 1. X-ray diffraction (XRD) patterns of fresh, spent, and spent/regenerated catalysts.
Catalysts 08 00567 g001
Figure 2. Top surface transmission electron microscopy (TEM) micrographs of spent and spent/regenerated 15Co–30Fe/Al2O3 catalysts obtained after different times (90, 180, 320, and 720 min).
Catalysts 08 00567 g002
Figure 3. Laser Raman spectra of SP samples (90, 180, 360, and 720 min).
Catalysts 08 00567 g003
Figure 4. N2 adsorption-desorption isotherms and variation of specific surface areas for fresh, spent, and spent/regenerated catalysts at different reaction times.
Catalysts 08 00567 g004
Figure 5. (a) H2-TPR for fresh catalyst, (b) H2-TPR for used catalyst, and (c) thermogravimetric (TG) profiles, of 30Fe-15Co/Al2O3 catalysts at different regeneration temperatures.
Catalysts 08 00567 g005aCatalysts 08 00567 g005b
Figure 6. Time on stream (TOS) yield of hydrogen versus different regeneration times with 15%Co–30%Fe/Al2O3 spent-catalyst. TOS conditions: Tregeneration-activation = 500 °C; Treaction = 700 °C; (WHSV = 5000 mL/H·g-cat), total flow rate = 25 mL/min and CH4/N2 = 1.5.
Catalysts 08 00567 g006
Figure 7. Comparison of different H2 yields (%) obtained from 90, 180, 360, and 720 min of reaction (the white bar is a limit between each regeneration cycle).
Catalysts 08 00567 g007
Figure 8. Carbon yields obtained after 90, 180, 360, and 720 min of reaction.
Catalysts 08 00567 g008
Table 1. Estimation of carbon crystallite size using XRD and TEM techniques.
Samples (SP)Crystallite Size (*)
of Carbon Graphite (Å)
Average Size (**)
of Carbon Particles (nm)
90 min49.752.3
180 min42.649.3
360 min59.653.2
720 min39.727.5
(*): XRD calculations with Debye–Scherrer formula on the (002) most intense reflection; (**): TEM calculations from 05–08 zones of each micrograph.

