Article

Reduced Graphene Oxide/TiO2 Nanocomposite: From Synthesis to Characterization for Efficient Visible Light Photocatalytic Applications

1
School of Science and Technology, Chemistry Division, University of Camerino, Via S. Agostino 1, 62032 Camerino, Italy
2
School of Science and Technology, Physics Division, University of Camerino, Via Madonna delle Carceri 9, 62032 Camerino, Italy
*
Authors to whom correspondence should be addressed.
Catalysts 2018, 8(12), 598; https://doi.org/10.3390/catal8120598
Submission received: 26 October 2018 / Revised: 19 November 2018 / Accepted: 22 November 2018 / Published: 1 December 2018
(This article belongs to the Special Issue Environmental Applications of Photocatalytic Processes)

Abstract

:
In this study, a green and facile thermal reduction of graphene oxide using an eco-friendly system of d-(+)-glucose and NH4OH for the preparation of reduced graphene oxide was described. The obtained reduced graphene oxide dispersion was characterized by SEM, Dynamic Light Scattering, Raman and X-Ray Photoelectron Spectroscopy. TiO2 nanoparticles and reduced graphene oxide nanocomposites were successively prepared and used in the preparation of heterogeneous photocatalysts that were characterized by Atomic Force Microscopy and Photoluminescence Spectroscopy and subsequently tested as visible light photocatalysts for the photodegradation of Alizarin Red S in water as target pollutant. Obtained results of photocatalytic tests regarding the visible light photocatalytic degradation of Alizarin Red S demonstrated that the use of reduced graphene oxide in combination with TiO2 led to a significant improvement for both adsorption of Alizarin Red S on the catalyst surface and photodegradation efficiencies when compared to those obtained with not doped TiO2.

Graphical Abstract

1. Introduction

Since the discovery by Fujishima and Honda of the photochemical water splitting in presence of TiO2 [1], heterogeneous photocatalysis has been widely studied for its environmental applications [2,3]. Many compounds present in effluents are not degradable by traditional biological and physical methods, and TiO2 photocatalysis represent a new technology to treat and remove these compounds in wastewaters [4,5]. In recent years, TiO2 has received considerable attention for various applications such as solar energy conversion [6,7] and environmental photocatalysis [8,9]. This is due to the features of this semiconductor, such as its high efficiency for the decomposition of organic pollutants, its non-toxicity, its biological and chemical inertness, its photochemical stability, its low cost and its transparency to visible light [10]. TiO2 is a semiconductor material characterized by an electronic band structure in which the lowest occupied energy band, the valence band (VB), and the highest empty band, the conduction band (CB), are separated by a band gap. When TiO2 is irradiated by UV light with energy greater than its band gap, an electron from the VB is promoted to the CB living a hole in the VB. These electron-hole pairs allow the formation of active species such as hydroxyl radicals and superoxide radical anions that are involved in the degradation of pollutants [11]. However, despite the potential of TiO2 as photocatalyst, there are two limitations in its application. The first is that TiO2 is not photoactive under visible light because of its wide band gap (3.2 eV); the second is the fast recombination rate of electron-hole pairs that decreases the efficiency of photocatalytic reactions [12]. A possible solution for these limitations is doping with various species, such as graphene [13,14,15,16]. Graphene is a 2D carbon material with unique physical, chemical, and magnetic properties [17]. In particular, graphene is an ideal nanomaterial for doping TiO2 thanks to its large specific surface area and high transparency, and to the formation of Ti–O–C bonds that extend the visible light absorption of the semiconductor. Furthermore, electrons are easily transported from TiO2 to graphene sheets, and the electron-hole recombination is considerably reduced, enhancing the photocatalytic efficiency [18]. Thus, graphene/TiO2 combination is a promising route to obtain excellent absorptivity, transparency, and conductivity, which could facilitate the photodegradation of pollutants [19].
In recent years, the production of graphene is an ongoing challenge in the scientific community due to its remarkable properties and its great promise for application in devices or composites [20]. Various procedures have been developed for graphene preparation, such as mechanical or ultrasonic exfoliation of graphite [18,21], chemical vapor deposition [22], epitaxial growth [23], and chemical or thermal reduction of graphene oxide [24]. Exfoliation of graphite, chemical vapor deposition, and epitaxial growth are not suitable for bulk-scale applications due to their low yield of production, while graphene oxide (GO) reduction has become a promising route for large-scale graphene preparation.
The three main synthetic routes for the GO preparation are the Brodie [25], Staudenmaier [26] or Hummers methods [27] and their variations; all these involve the graphite oxide synthesis by chemical oxidation, followed by the mechanical exfoliation of the produced graphite oxide. The Brodie method provides the mixing of graphite with potassium chloride solubilized in fumic nitric acid. The Staudenmaier method is a modification of Brodie’s method in order to improve the quality of the material, in which sulfuric acid is added to the mixture to increase the acidity. The most used is the Hummers method, where potassium permanganate is added to the graphite in the presence of sodium nitrate as catalyst and sulfuric acid. All the methods introduced oxygen on the graphene structure as oxygenated functional groups: –O–, –OH, –COOH, and because their polar character renders GO hydrophilic, the dispersion and exfoliation in many solvents is favorable, particularly in water solutions [28,29].
Chemical methods for GO reduction require reducing agents like hydrazine or sodium borohydride, which are toxic and of hazardous nature. This approach often involves highly toxic chemicals, requires long reduction time, or requires high temperature treatment, and produces reduced graphene oxide (rGO) with a relatively high oxygen content to give rise to high sheet resistance [30]. It is therefore highly desirable to develop new chemical reduction methods that involve less- or non-toxic chemicals for the production of rGO with low oxygen content. Therefore, new and eco-friendly approaches for graphene synthesis are required [31]. During last few years, environmentally friendly methods for producing reduced graphene oxide from graphene oxide have been reported using various biomolecules [32,33].
In this work, the synthesis of rGO was made applying a thermal reduction method to GO, using as reducing agent an eco-friendly system of d-(+)-glucose and NH4OH solutions. As prepared rGO dispersion was utilized for the preparation of rGO/TiO2 nanocomposites supported on polypropylene (PP@rGO-TiO2). These nanocomposites were successively tested as visible light photocatalysts for the photodegradation of Alizarin Red S (ARS), a refractory dye, in water as target pollutant. Obtained results were discussed and compared with those derived from our previous study [34]. The use of PP@rGO-TiO2 demonstrated that the presence of rGO led to a significant improvement for both ARS adsorption on the catalyst surface and photodegradation efficiencies under visible light irradiation when compared to only TiO2.

2. Results

2.1. Reduced Graphene Oxide
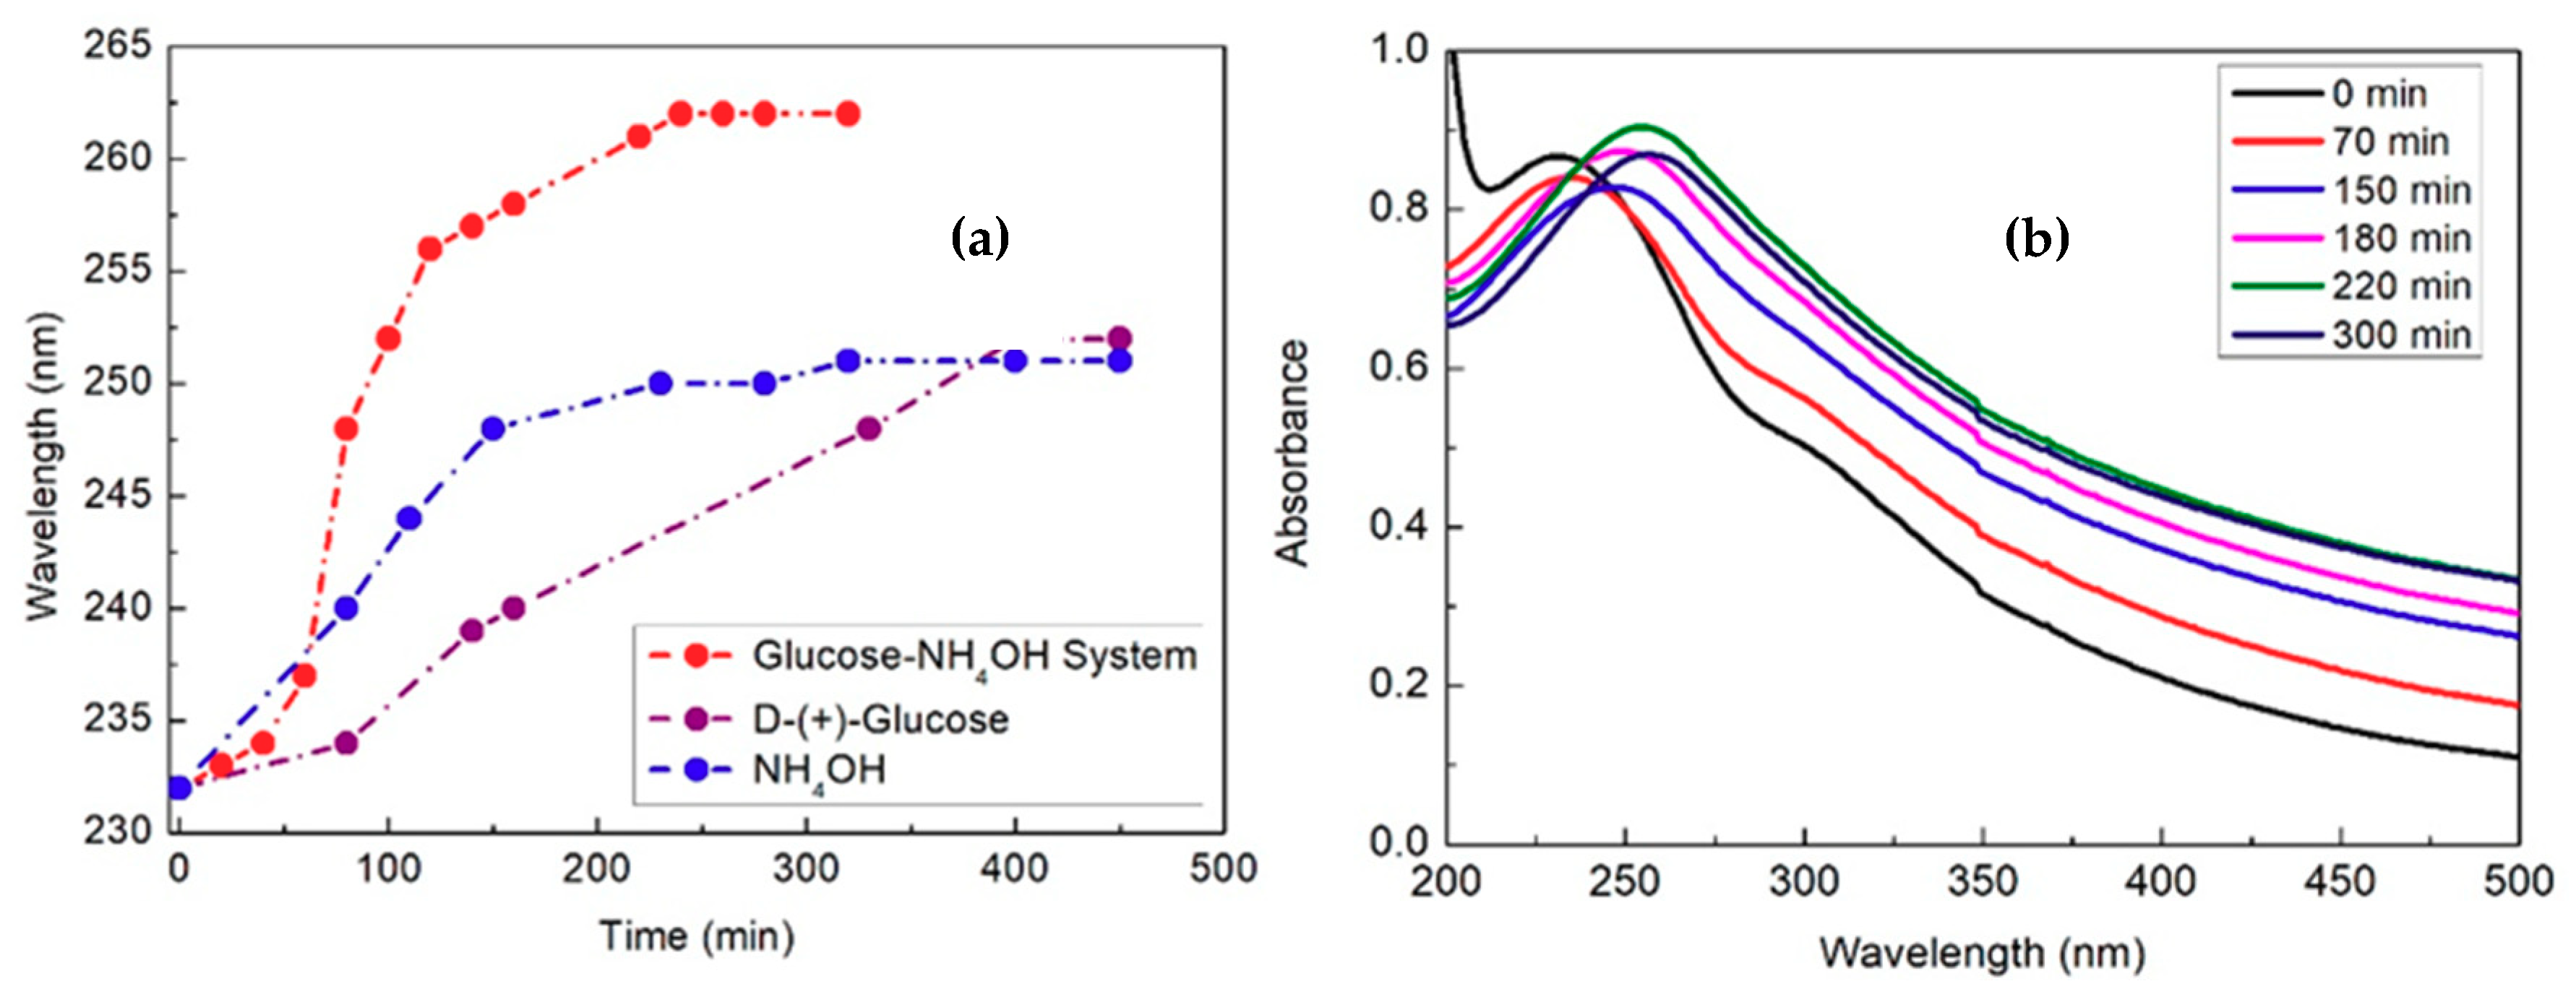
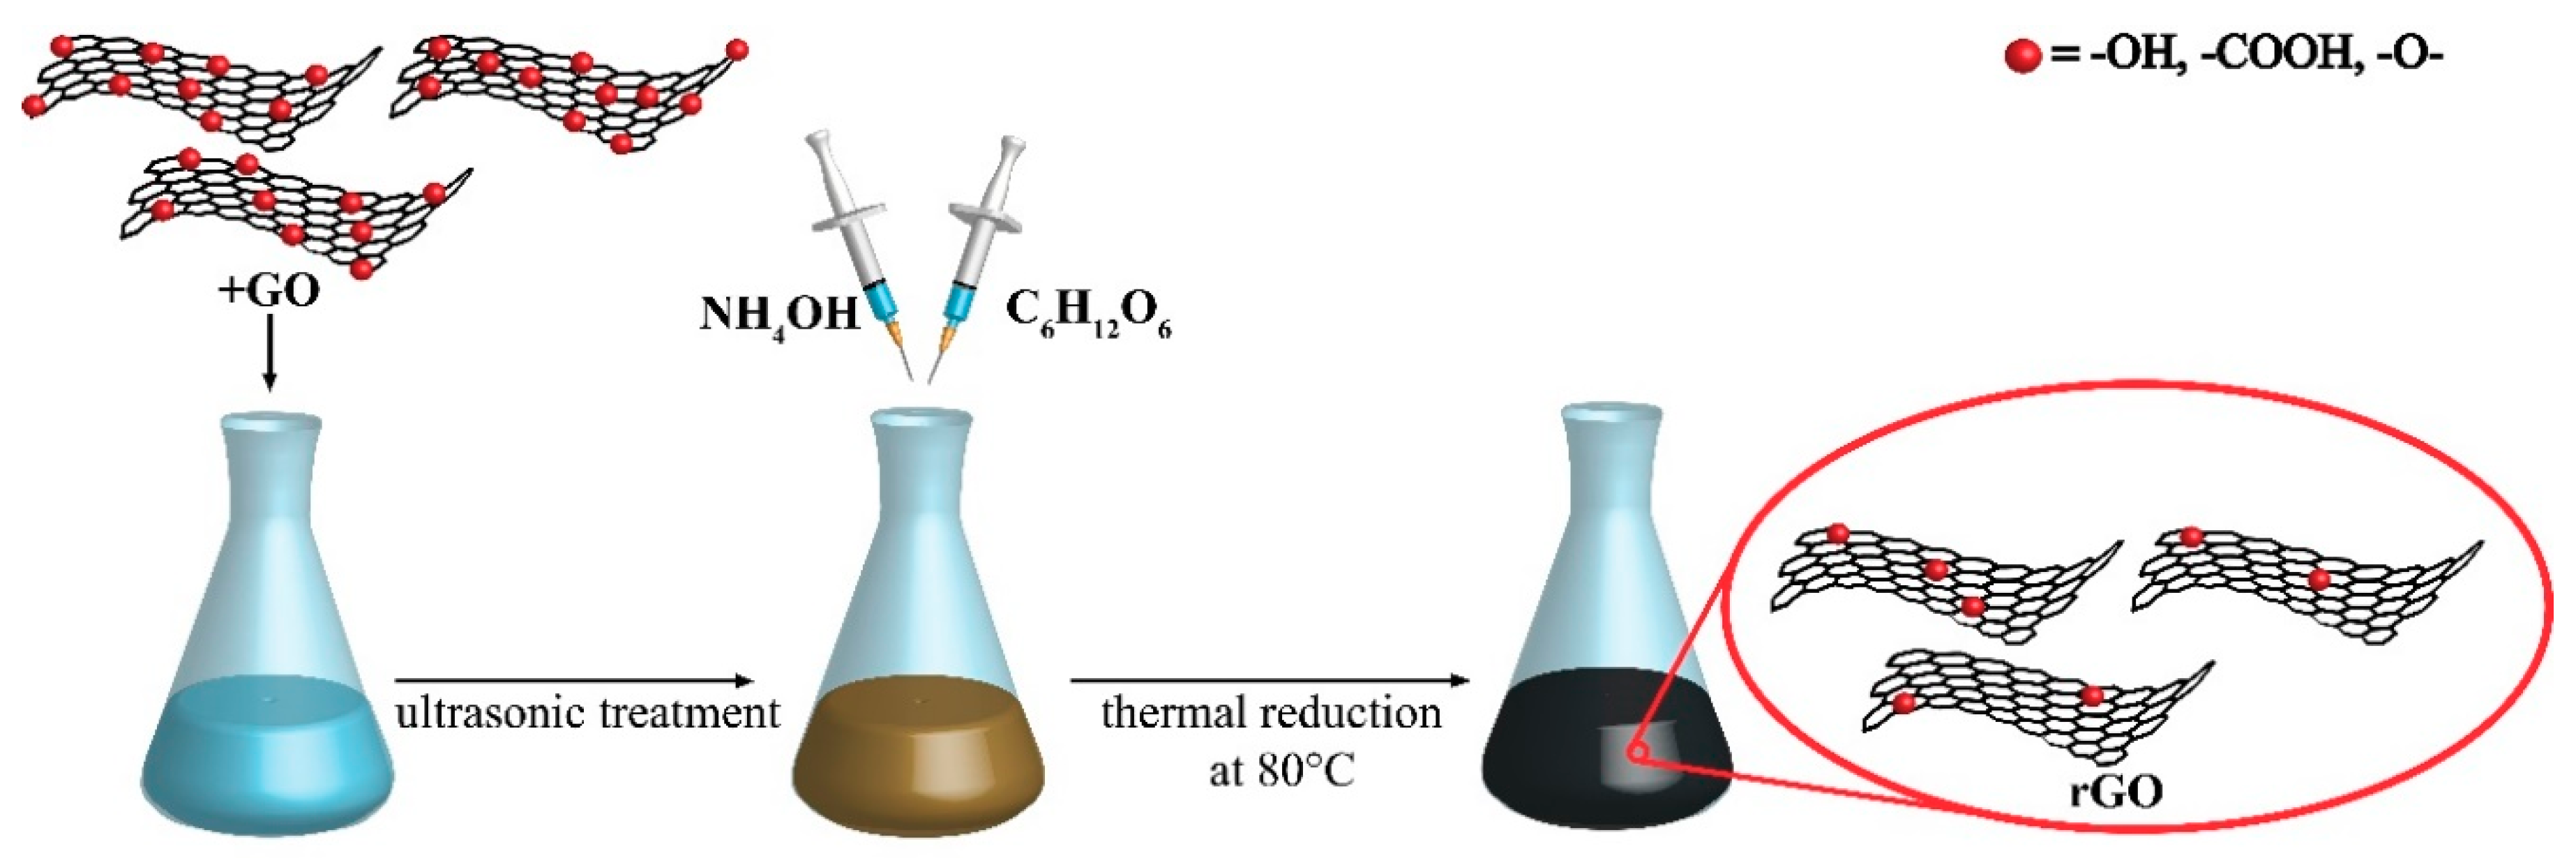
2.1.1. Synthesis

The GO dispersion in water was clear and homogeneous, with a yellow-brown color. The obtained rGO dispersion appeared different because of its distinct structural and physicochemical properties [35,36]. The aqueous rGO dispersion showed a distinct color change from yellow-brown to black after thermal reduction. After the visibility check, the progress of GO reduction was monitored, measuring in time the change of the UV-Vis spectrum.
As reported in Figure 1, water GO dispersion presents a maximum at around 230 nm, attributed to π→π* transitions of aromatic C=C bonds, and a shoulder at around 300 nm ascribed to n→π* transition of aromatic C=O bonds [32]. During the reduction, in the rGO spectrum the shoulder at 300 nm gradually disappeared due to the progressive oxygen removal, while the maximum peak at 230 nm gradually redshifts to around 270 nm for the formation of rGO with the increase of absorbance over time [37], suggesting the restoration of the electronic conjugation within the graphene sheets.
The thermal reduction operated only with glucose or ammonia solution in air showed only a partially reduced GO, and that proceeded very slowly and failed to reach completion. In addition, the use of a glucose-NH4OH system with a condensation column, which hinders the evaporation of water and ammonia solutions, the change of pH value and, at the same time, allowed an efficient and speedy reduction, provided an increase of the reaction rate in the GO deoxygenation. In particular, Figure 2a shows the change of wavelength as function of time, comparing the thermal reduction for all the investigated operative conditions. From the plots it is possible to observe that in both processes, with only glucose and only NH4OH, the reduction was not complete with a wavelength shift from 232 nm to around 251 nm even after 450 min. On the other hand, with the glucose-NH4OH system the shift was from 232 nm to around 262 nm and the reaction was complete after around 250 min. Figure 2b shows the spectral changes during rGO formation with the glucose-NH4OH system.

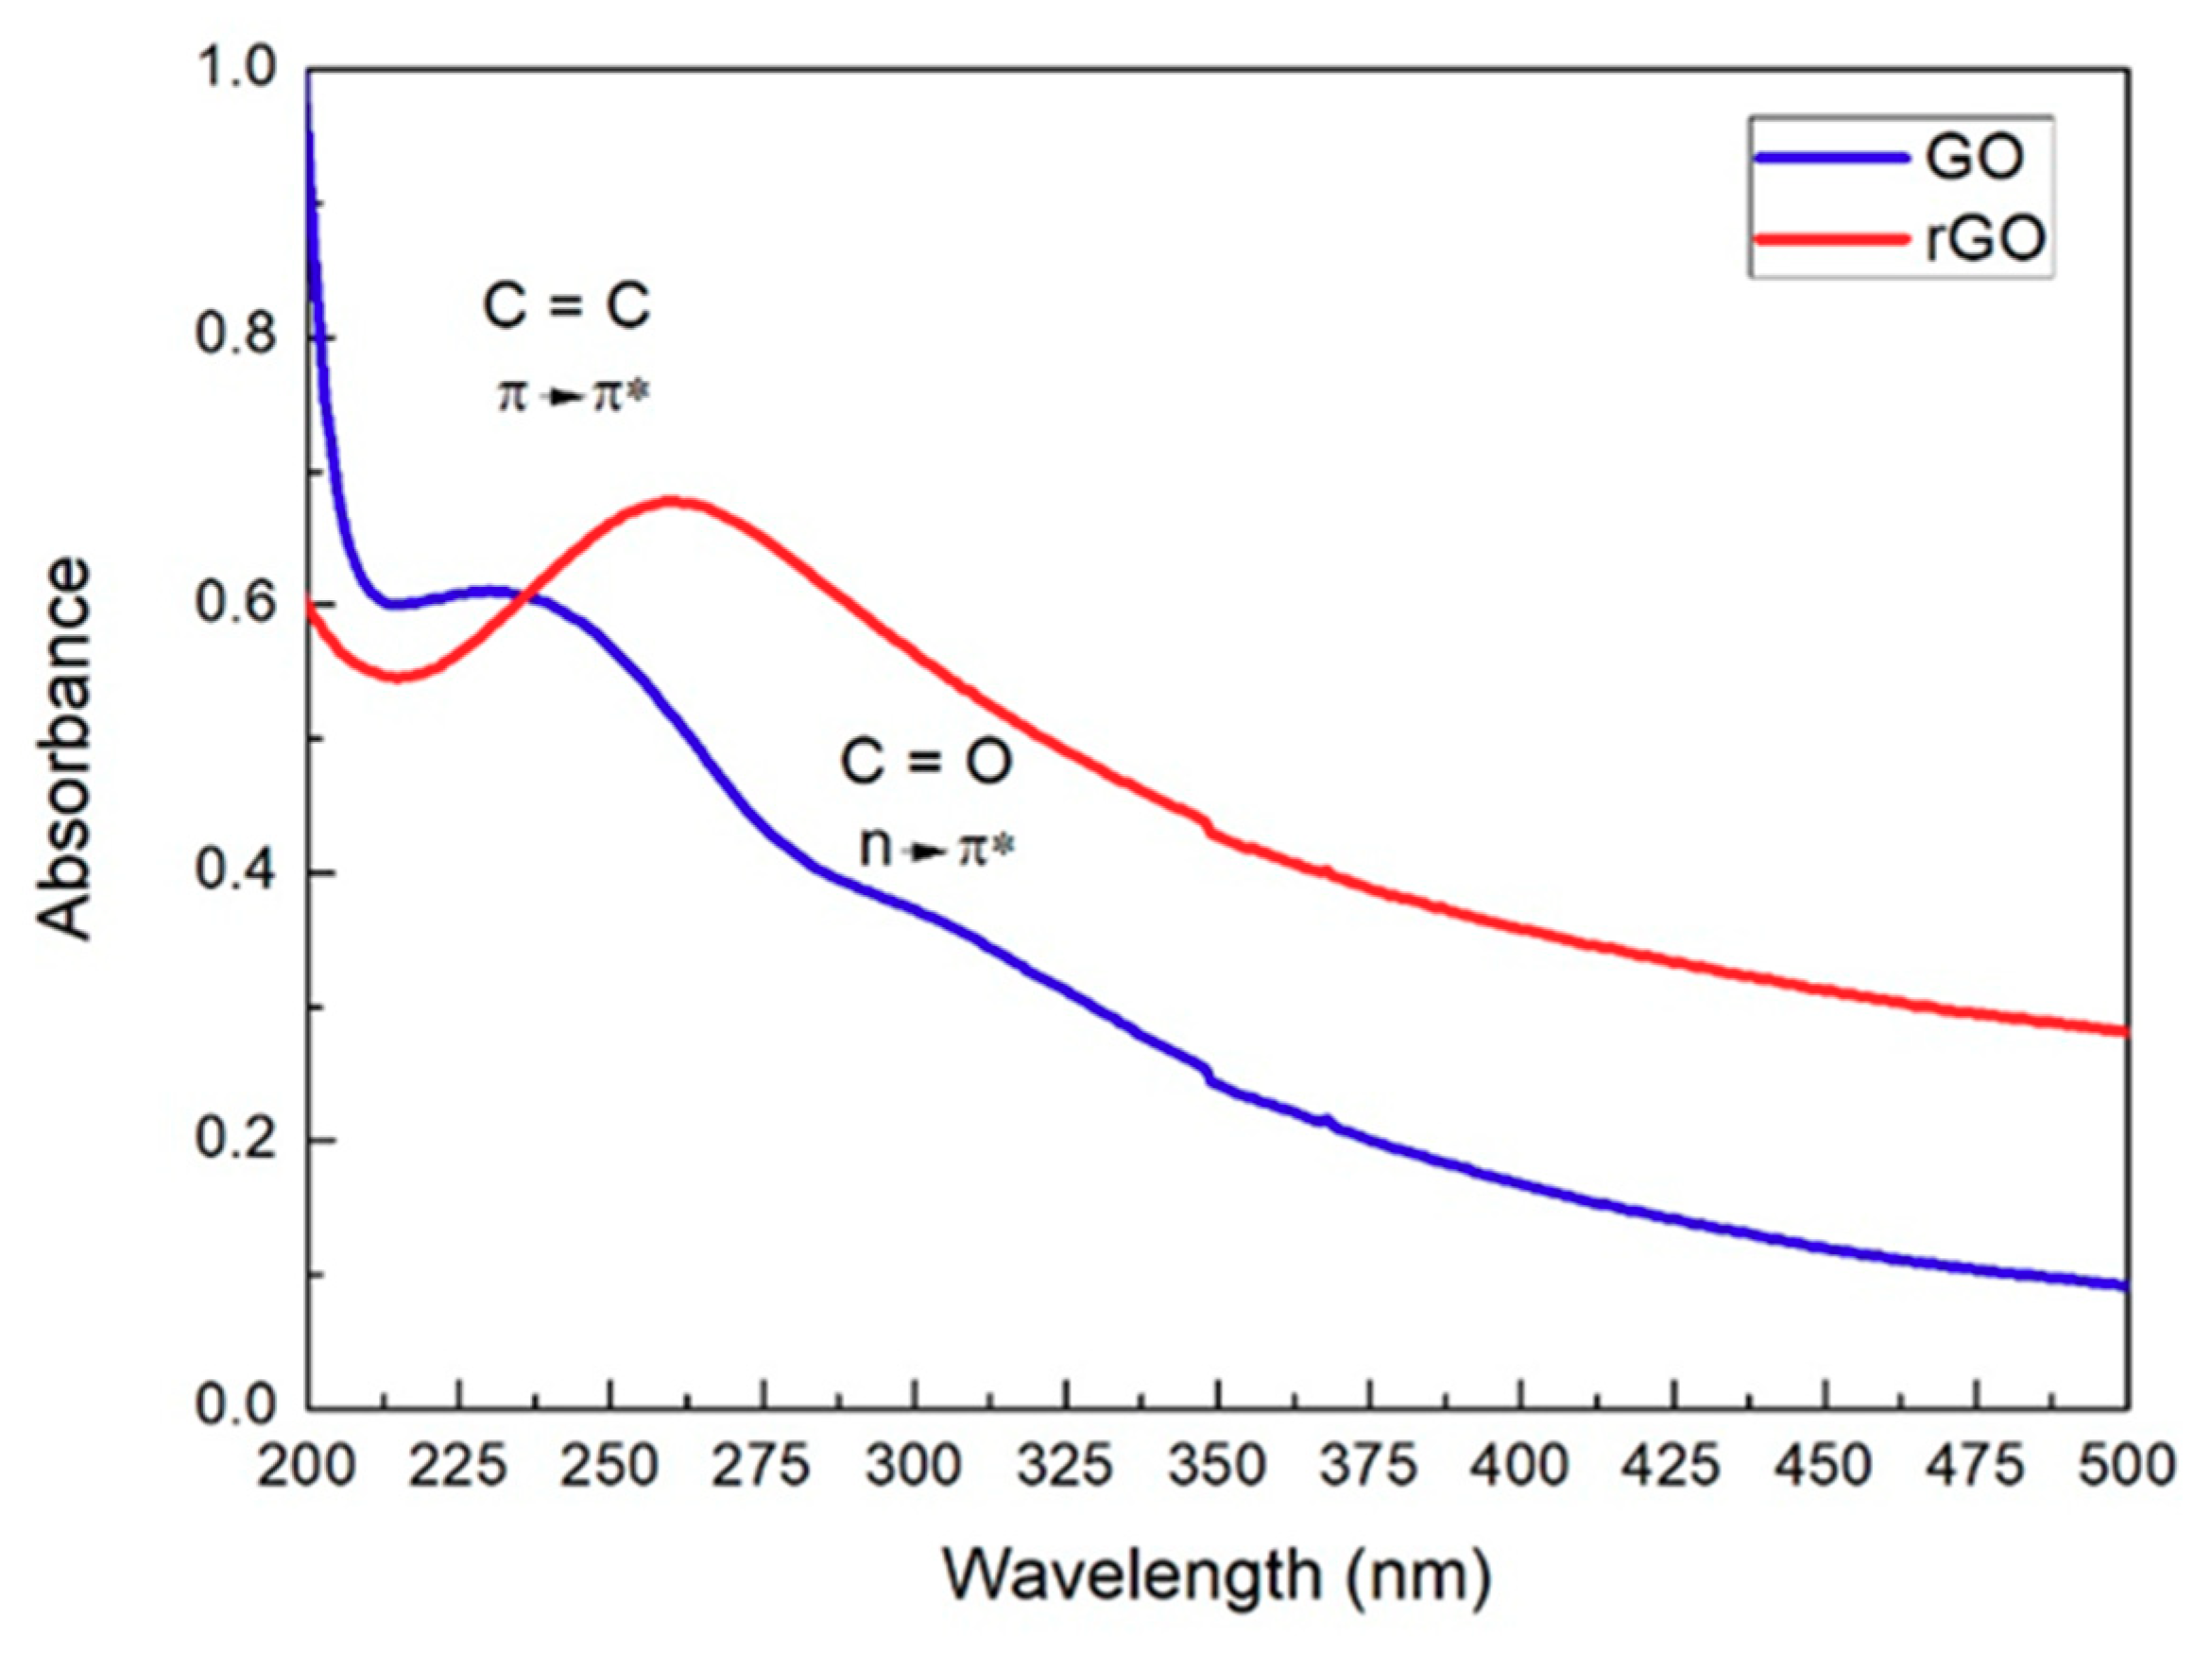
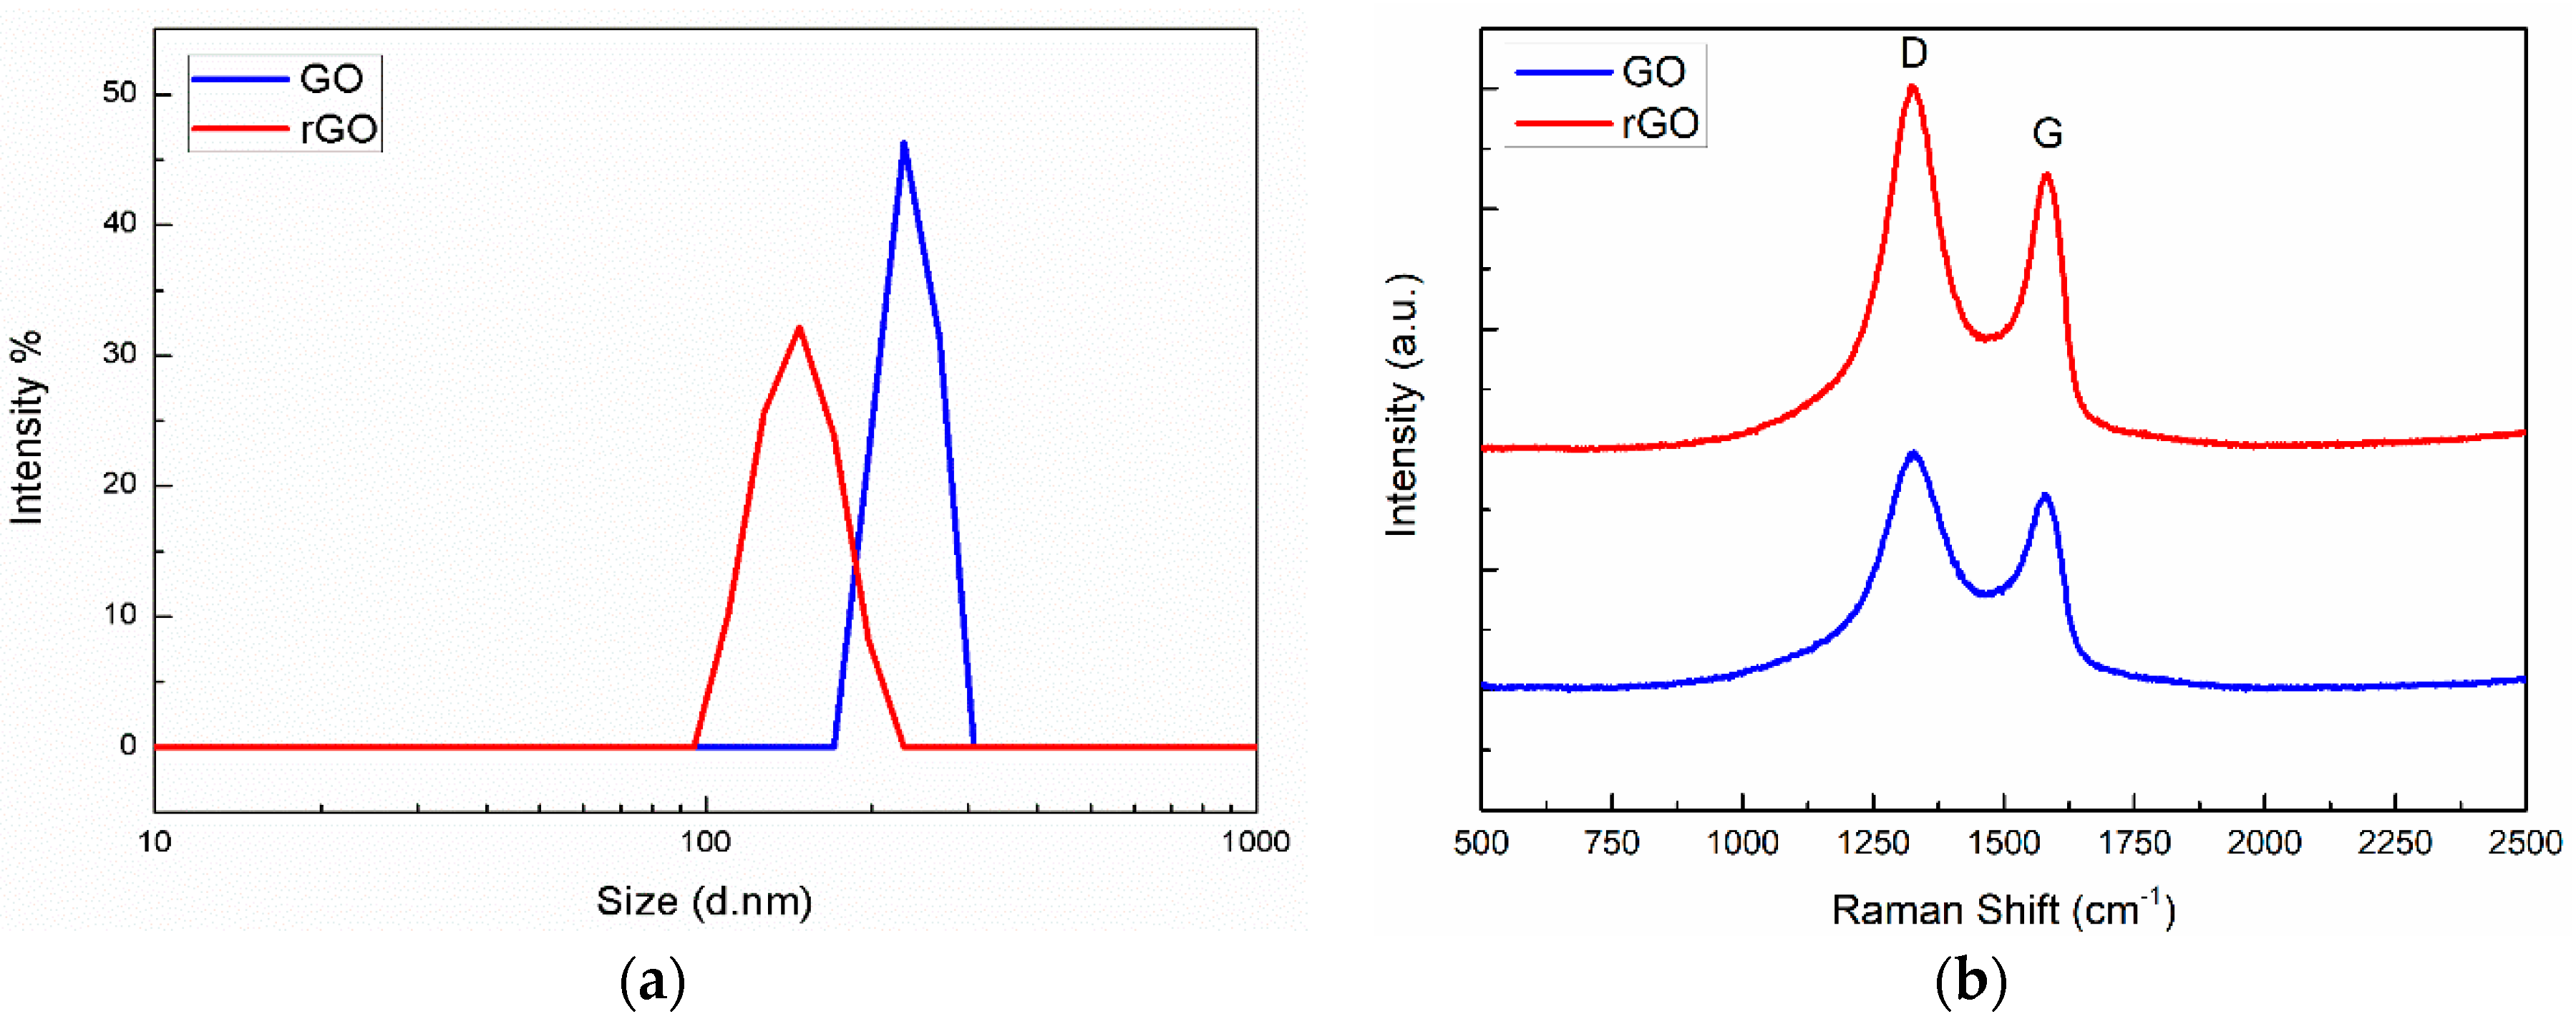
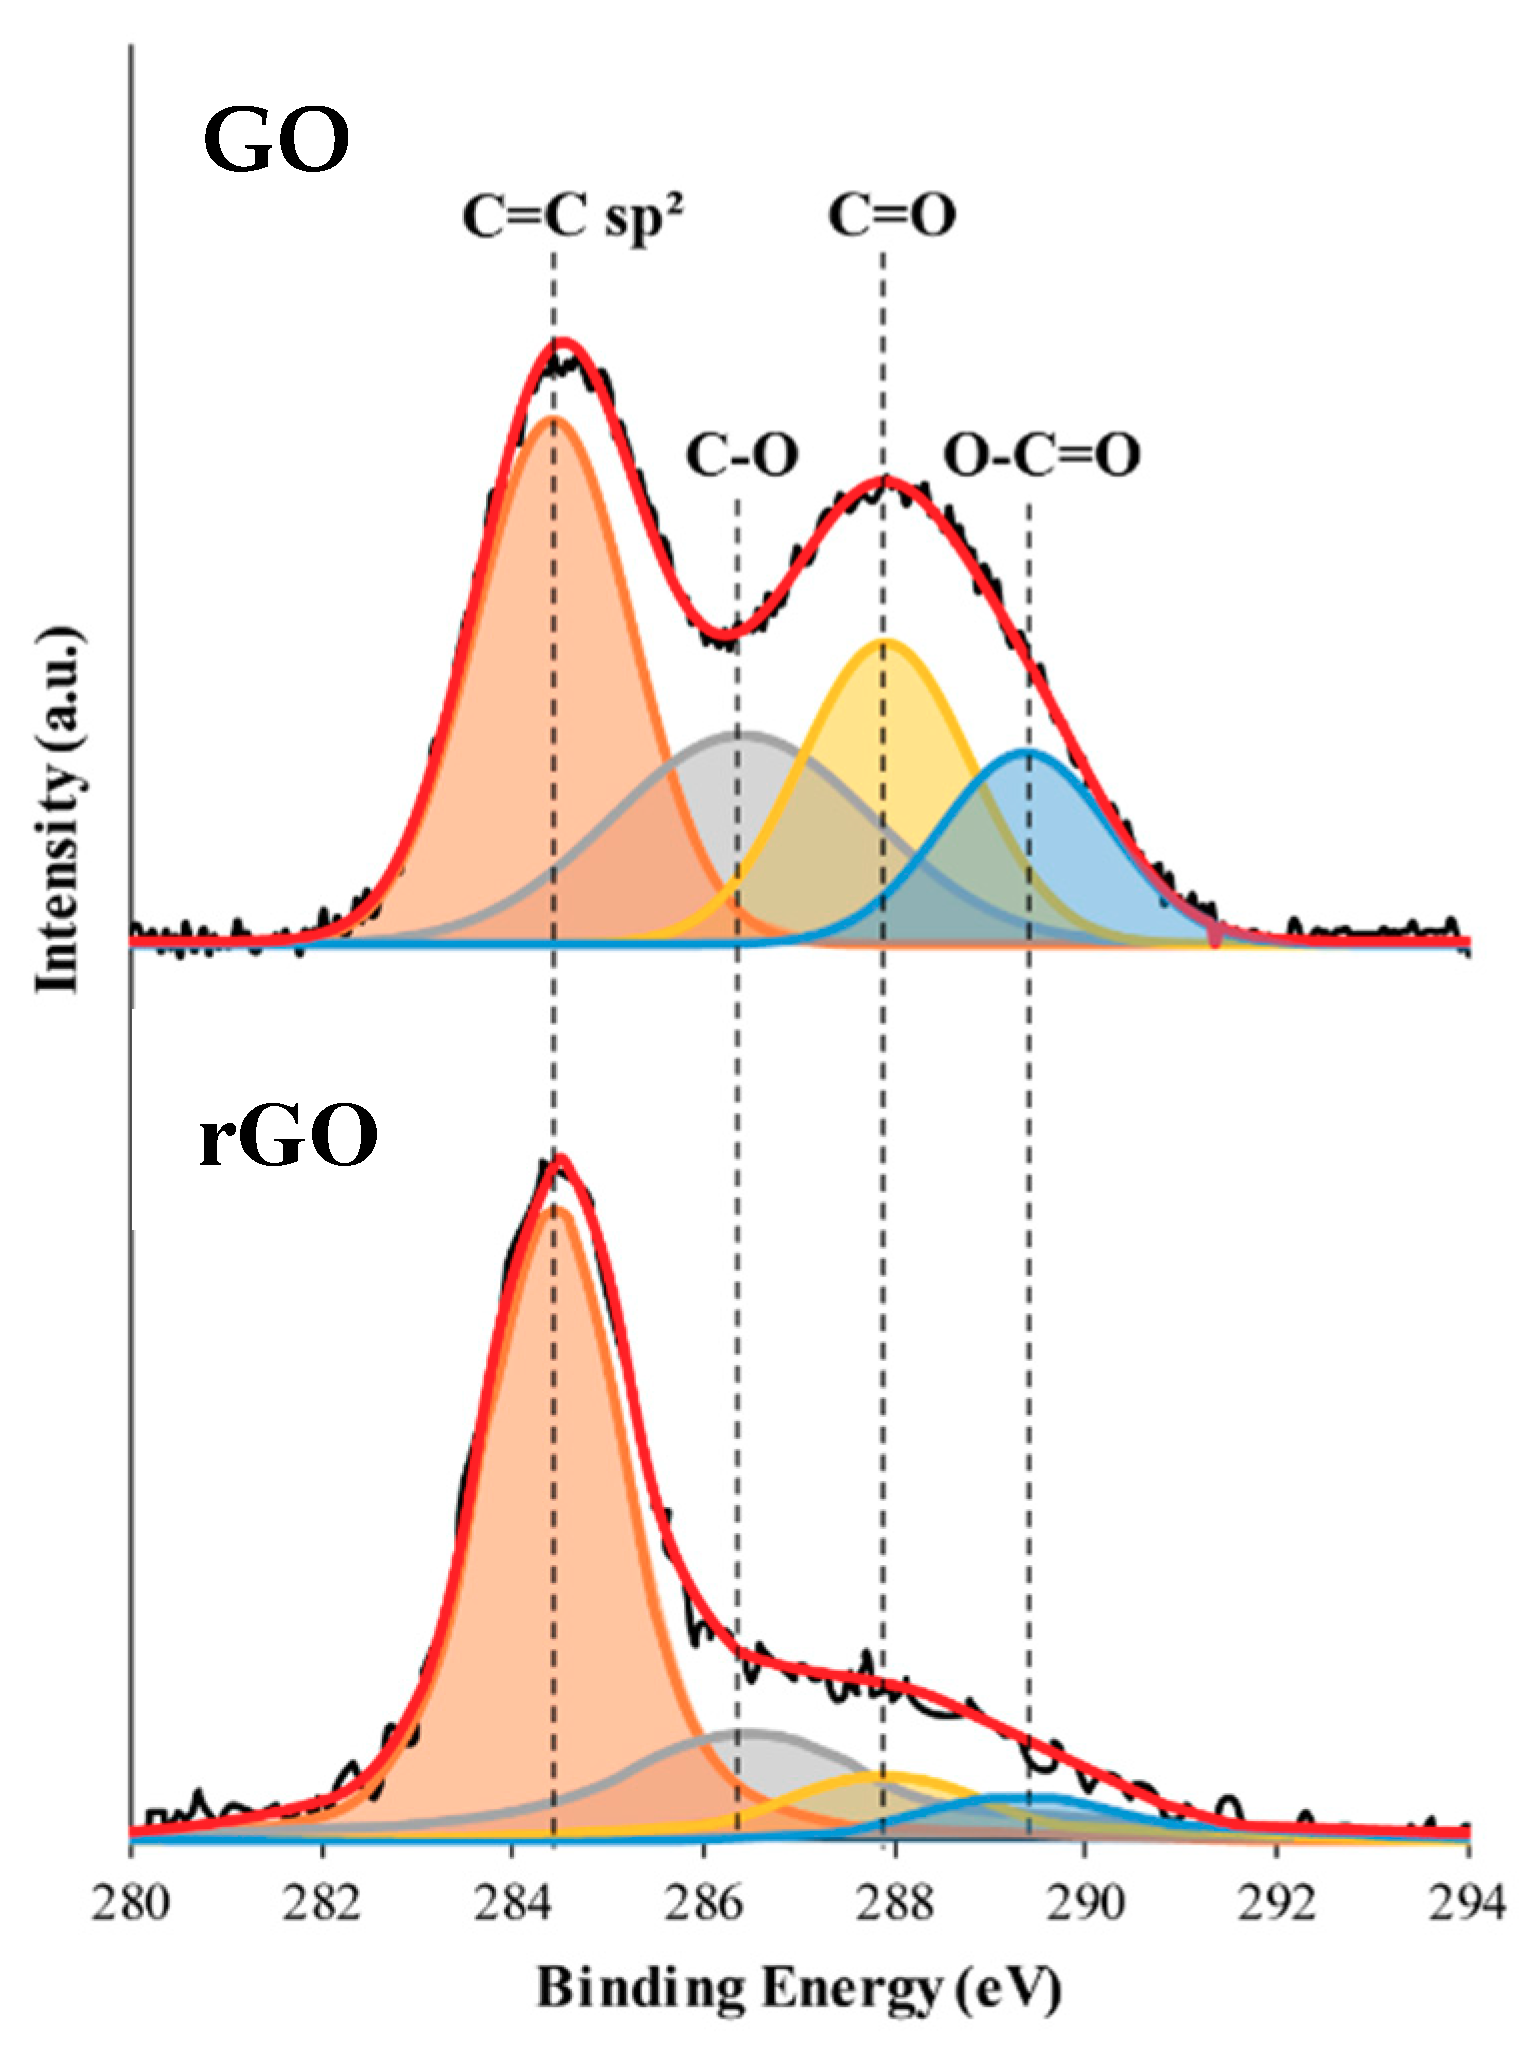
2.1.2. Reduced Graphene Oxide Characterization

In Figure 3a are reported the size distributions of GO and rGO dispersion determined by Dynamic Light Scattering (DLS) analysis that demonstrate differences on particle sizes. From the spectra it is possible to observe that GO showed a bigger diameter with respect to the reduced form; in particular, the spherical approximate dimensions of GO are in the range of 198–265.5 nm, with a maximum intensity at 229.3 nm, while those relative of rGO are in the range of 110.1–198 nm, with a maximum intensity at 147.7 nm. It is reasonable therefore to attribute the decrease of size to the progressive deoxygenation of GO during the reduction process that led to a decrease of size, further confirming the effective reduction by the Glucose-NH4OH system.
Crystal structure, disorder, and defects in GO and rGO were monitored with Raman measurements where the reduction process of GO is manifested by the relative intensity changes of two main peaks; D and G peaks, located at 1327.53 and 1582.79 cm−1 respectively, are shown in the graphs of Figure 3b. The G peak is attributable to the in plane stretching modes between the sp2-carbons, and the D band is identified as the disordered band due to the structural defects, edge effects and dangling sp2 carbon bonds that break the symmetry [38]. From the spectra is possible to calculate the intensity ratio (ID/IG) that measures the disorder degree and is inversely proportional to the average size of the sp2 domains [39]. The increasing of the calculated ID/IG ratio from 1.22 for GO to 1.31 for rGO confirmed the successful oxidation of the graphene oxide. The higher value of ID/IG is due to an increase of D-band intensity derived from the oxygen removal and to the formation of new or more graphitic domains, with subsequent increasing of the sp2 clusters number after the reduction process [40], proving an effective GO reduction using a glucose-NH4OH system. After filtration of the obtained dispersion, the rGO film was dried in vacuum and characterized by X-Ray photoelectron spectroscopy (XPS) (Figure 4). XPS gives important information about the chemical and electronic state of the element present on surface and, in that case, is useful to investigate the efficiency of the thermal reduction by the glucose-NH4OH system; in Figure 4 are reported the C1s XPS spectra of GO and rGO. From the XPS spectrum of graphene oxide, a high degree of oxidation is clearly visible, and four components relative to different functional groups can be detected: The sp2 carbon at 284.4 eV, the carbon in the single bond C–O at 286.4 eV of epoxide and hydroxyl moieties, the C in carbonyl group (C=O) at 287.9 eV, and finally, the carbon relative to the carboxylate group (O–C=O) at 289.3 eV [41,42]. On the other hand, the C1s spectrum of rGO shows the same peak, but in this case, the intensity peaks relative to the oxygen functional groups are much weaker, demonstrating the efficient oxygen removal by thermal reduction with glucose as the reducing agent in presence of NH4OH.
SEM images in Figure 5 show that the morphology of the samples was affected by thermal reduction. Graphene oxide (GO) reported in Figure 5a,b shows a smooth surface and a compact structure, while the rGO sample showed (Figure 5c,d) folded sheets with distinct edges, thin and aggregated with each other in a random way and forming a structured irregular conformation; this analysis is another confirmation of the efficient reduction of GO.

2.2. PP@rGO-TiO2 Photocatalyst

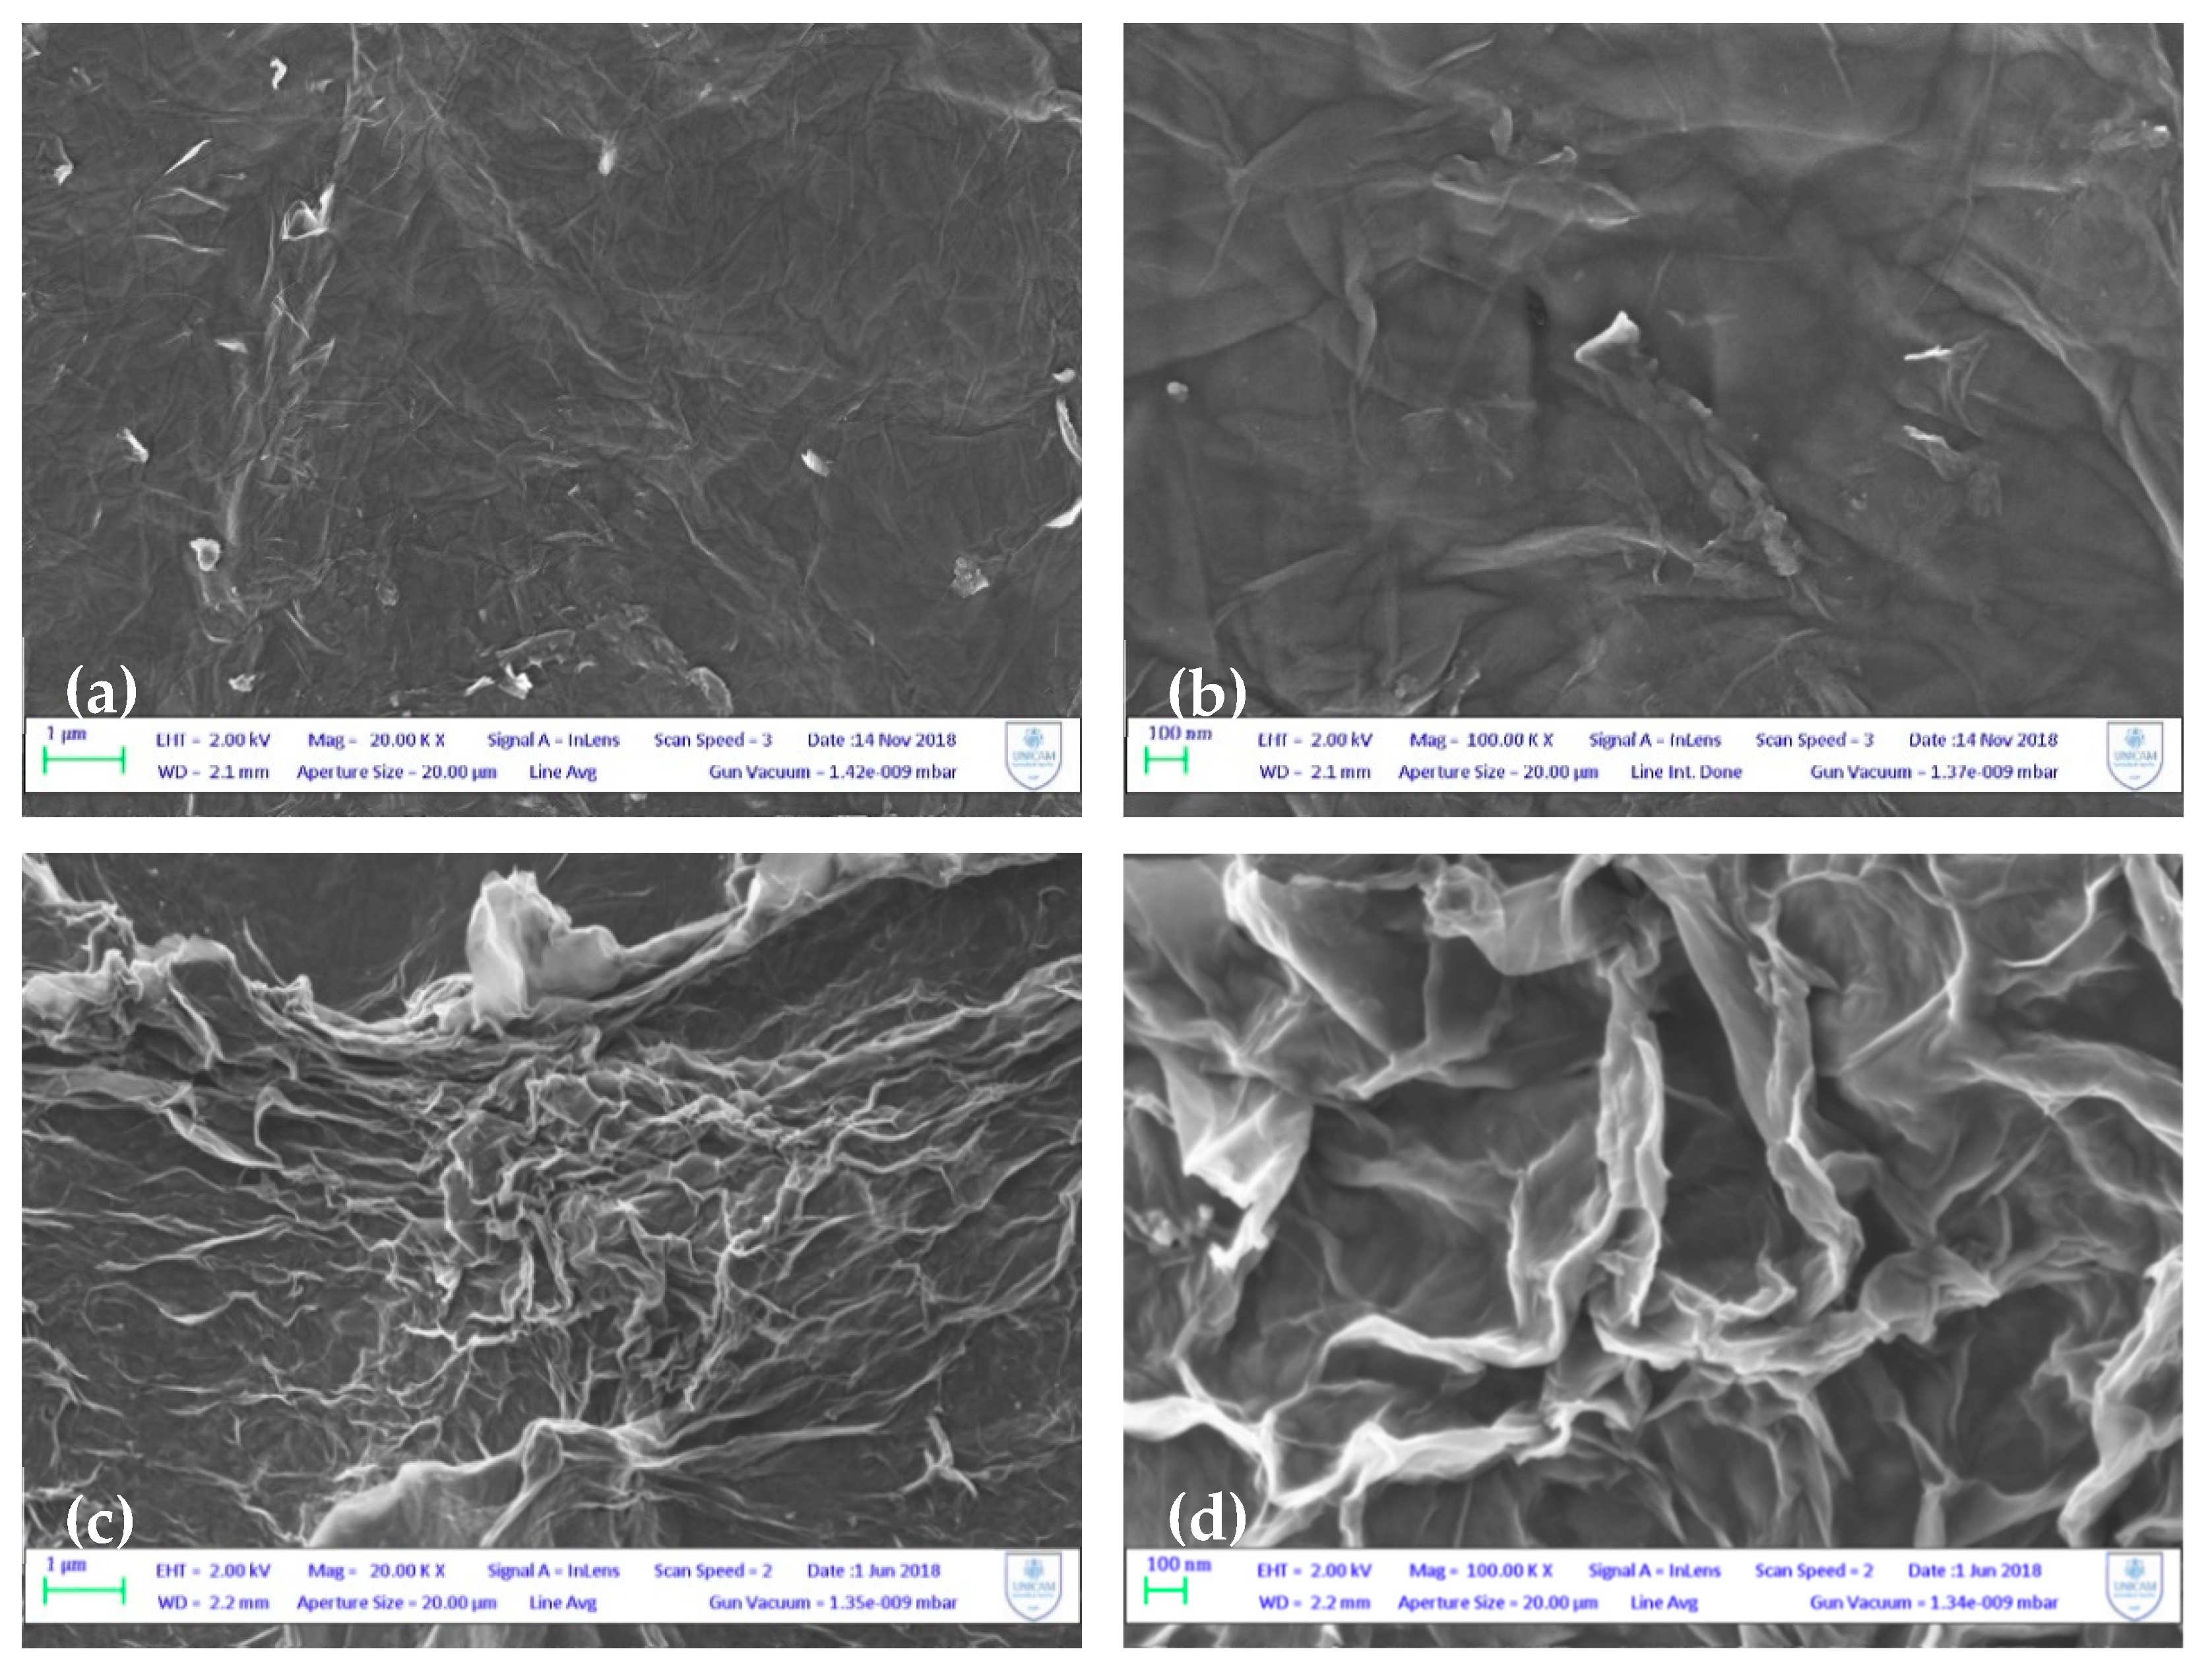
2.2.1. Characterization

In order to investigate the surface topography and morphology of PP@rGO-TiO2 with the possibility to control the morphological aspects of layers, several studies were carried out by Atomic Force Microscopy (AFM) analysis. For this purpose, surface roughness analysis was evaluated by mean roughness (Ra) and undulating height (Wmax) in order to notice differences with and without the presence of rGO. Figure 6a,b reports 3D images of PP@TiO2 and PP@rGO-TiO2 strips respectively, while Table 1 reports Ra and Wmax values for both photocatalysts.
AFM images indicated important differences between PP@TiO2 and PP@rGO-TiO2; these differences were also noticeable when comparing the Ra and Wmax values of Table 1. In the presence of rGO, photocatalysts presented a greater granular structure and a greater undulating surface with respect to PP@TiO2 and, at the same time, Ra and Wmax values increased, demonstrating that the addition of rGO led to a higher surface area for the PP@rGO-TiO2 photocatalyst. From this behavior it is possible to suppose that the PP@rGO-TiO2 layer could exhibit a higher adsorption capacity as compared to PP@TiO2.
A powerful demonstration of enhanced charge transposition and separation properties derived from the recombination of photoinduced charge transportation can be obtained from the study of PL signals. PL emission represents the recombination between holes and the excited electrons, and a lower PL intensity emission is probably due to a lower recombination rate under the light irradiation [43]. For this reason, photoluminescence analysis was used to characterize and, at the same time, to compare PP@TiO2 and PP@rGO-TiO2 photocatalysts. Figure 7 reports the PL spectra under excitation at 320 nm, where it is possible to observe that both photocatalysts show a PL peak at 387 nm with a shoulder at 370 nm, attributed to the band gap transitions [43]. The intensity emission of PP@rGO-TiO2 considerably decreased with respect to the PP@TiO2, demonstrating that, in the presence of rGO, the recombination between electrons and holes is effectively reduced on the PP@rGO-TiO2 surface.
In particular, the PL emission quenching observed in the PL spectrum of PP@rGO-TiO2 can be explained by the transfer of photogenerated electrons from the excited TiO2 to rGO sheets with effective charge carrier separation. Under light irradiation, electrons are excited to the conduction band of TiO2, leaving positive holes in the valence band. At the same time, these electrons will undergo a fast transition to the valence band owing to the instability of excited states, resulting in a low photocatalytic activity. In the case of PP@rGO-TiO2, there is a formation of a heterojunction at the interface in a space-charge separation region and electrons tend to flow from the higher to the lower Fermi level to adjust energy levels. Since the work function of graphene is 4.42 eV and the conduction band position of TiO2 is around 4.21 eV, rGO can accept photo-excited electrons from the conduction band of TiO2 [44,45]. This hinders the electron-hole pairs recombination that can therefore lead to an increase of the photocatalytic activity as in the case of a metal with a higher work function than the n-type semiconductor.

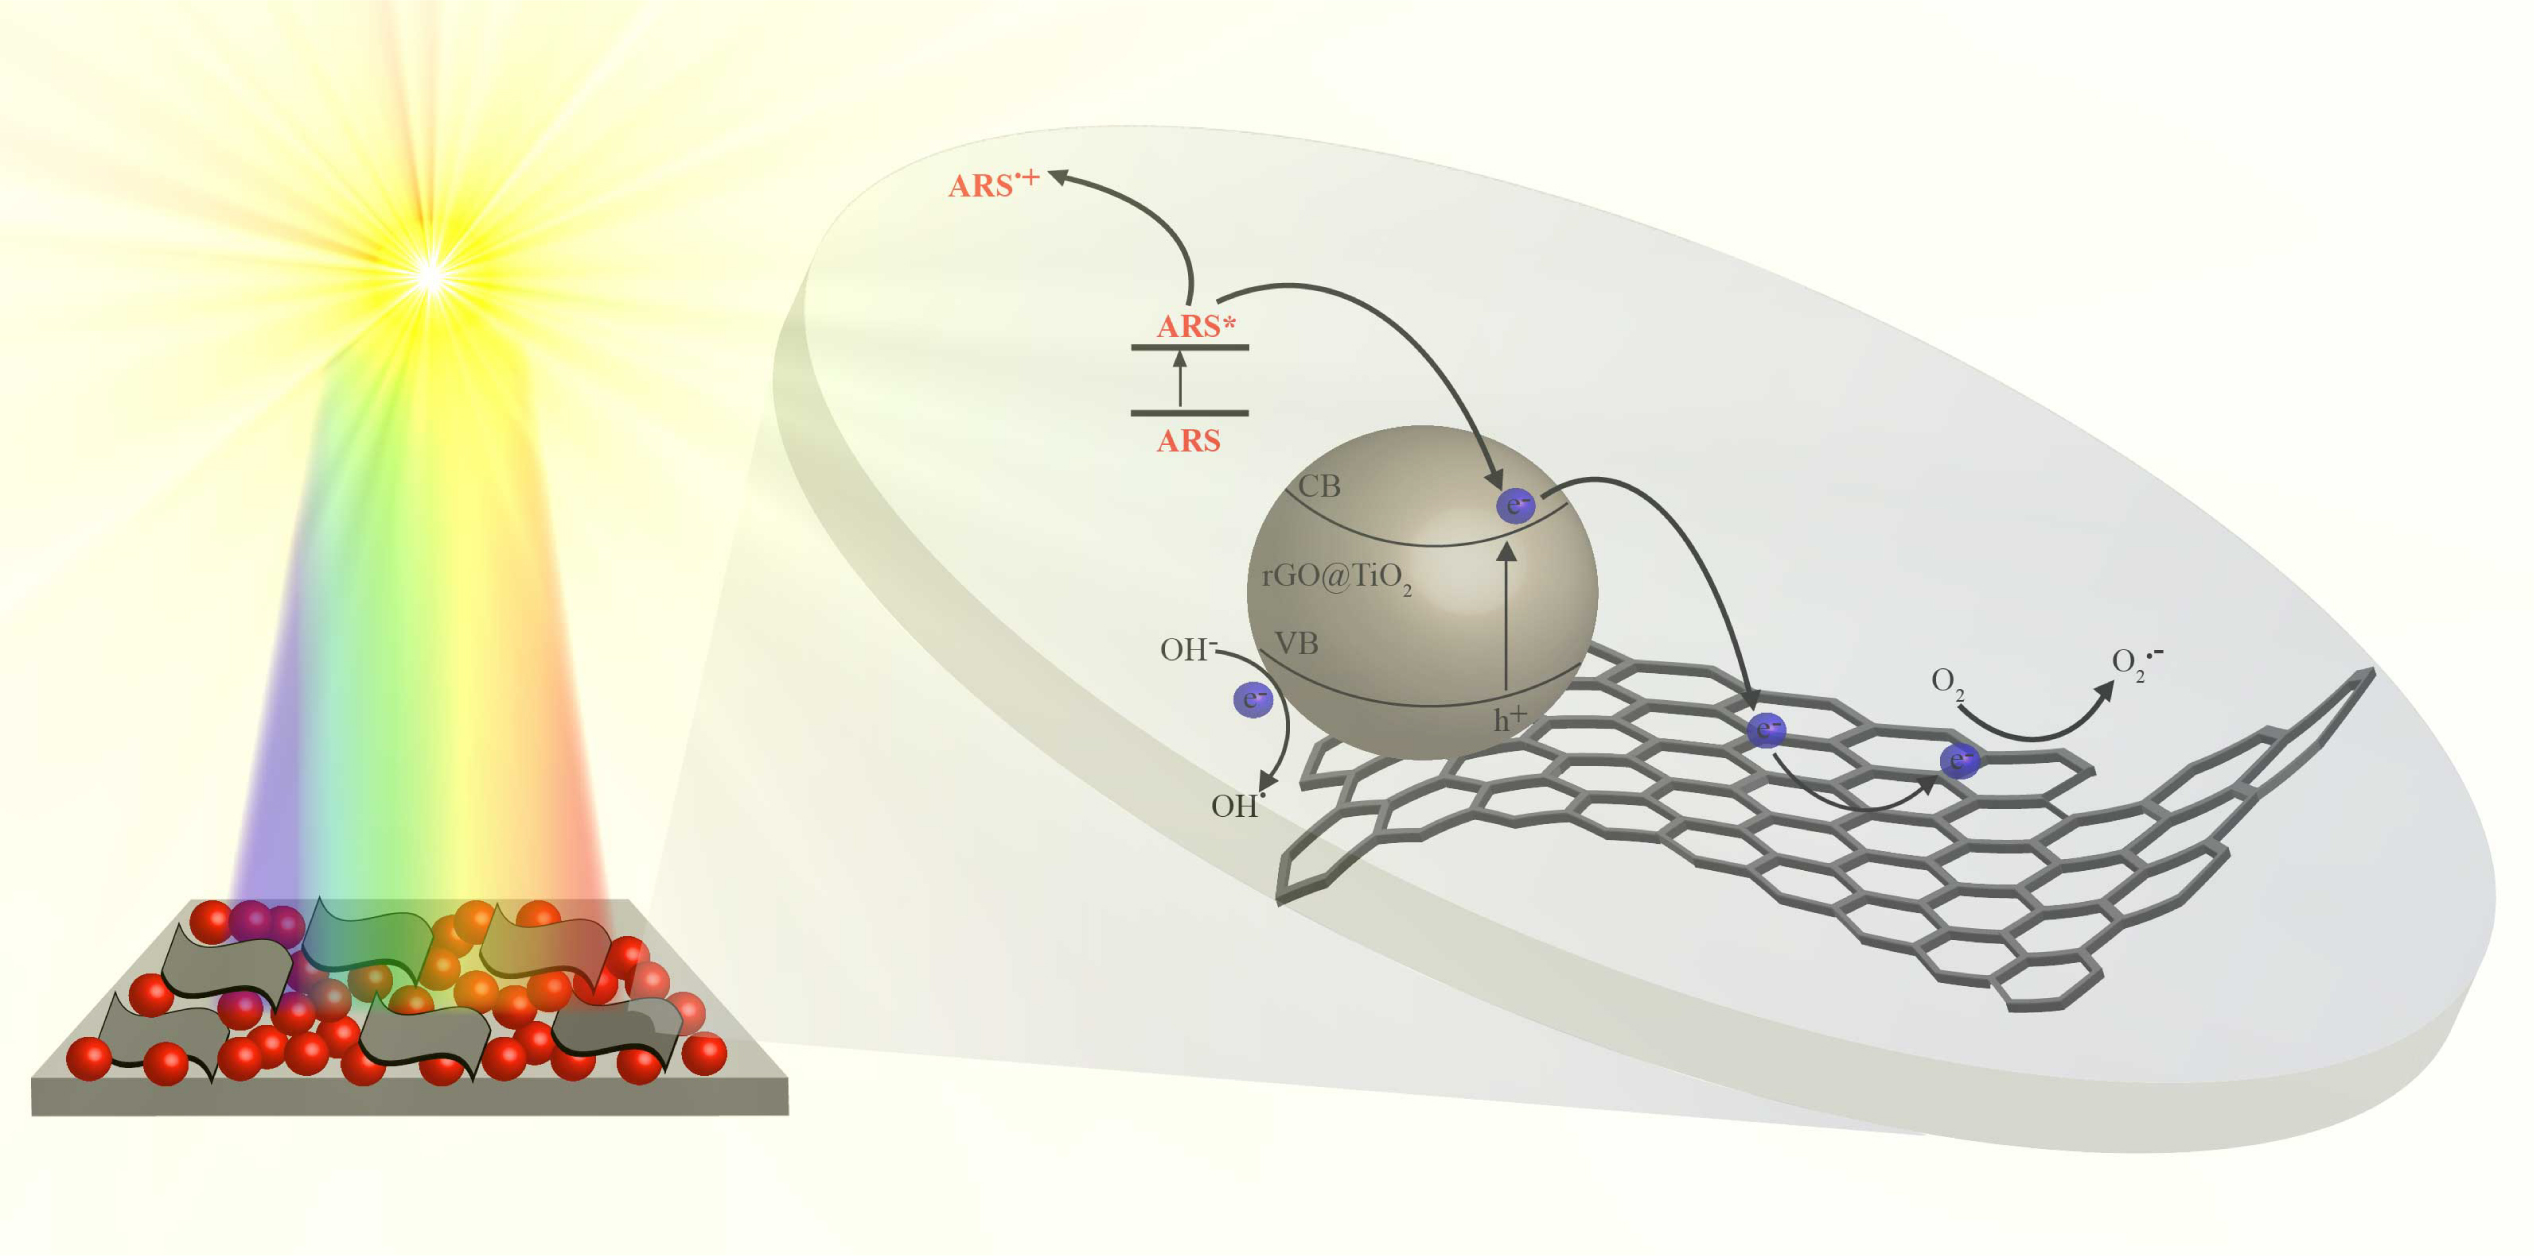
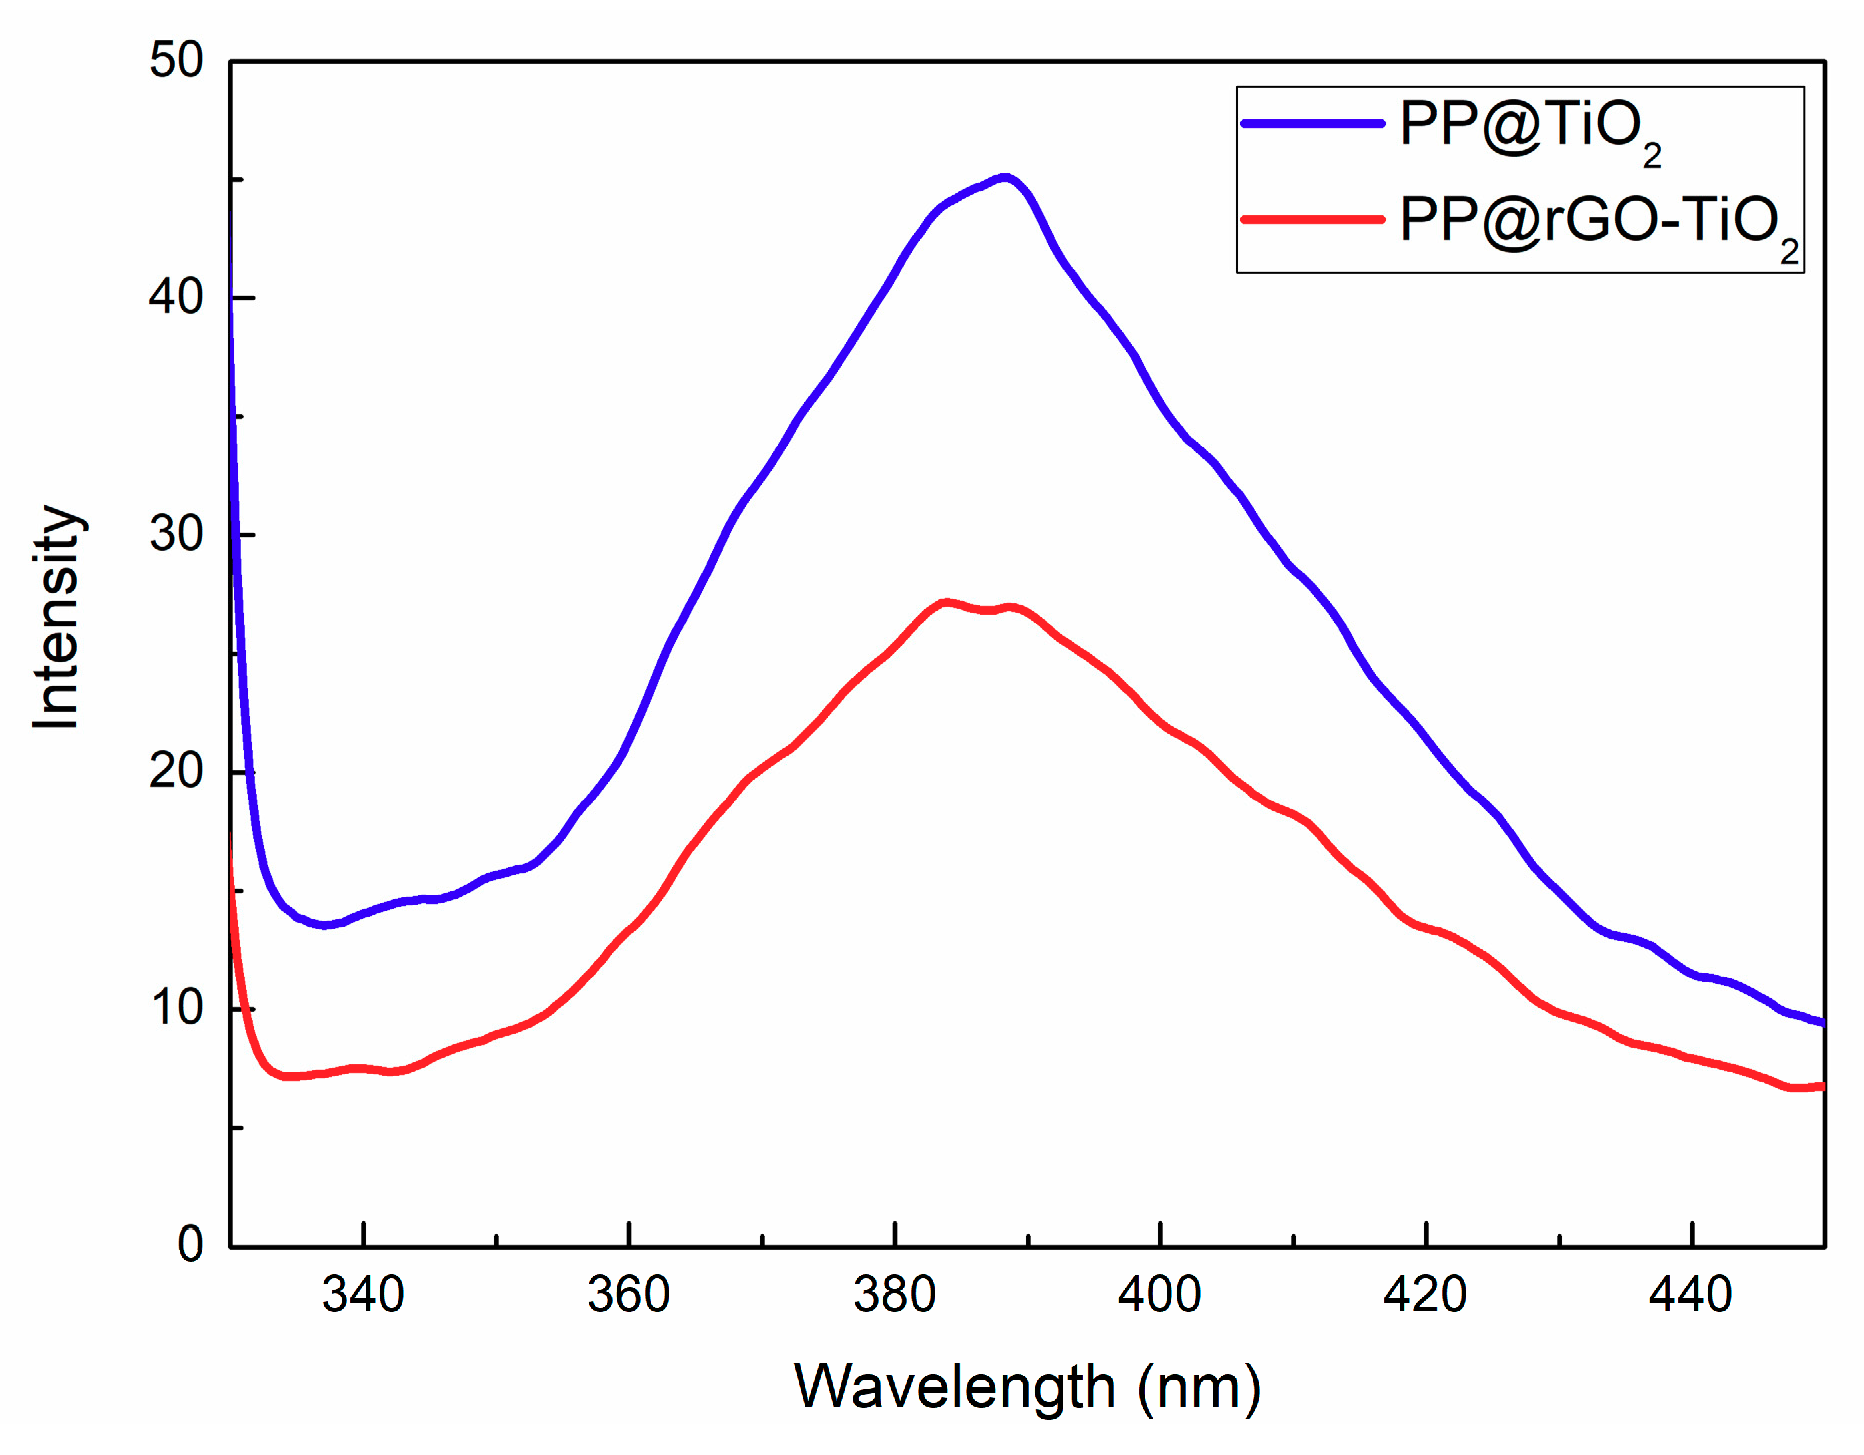
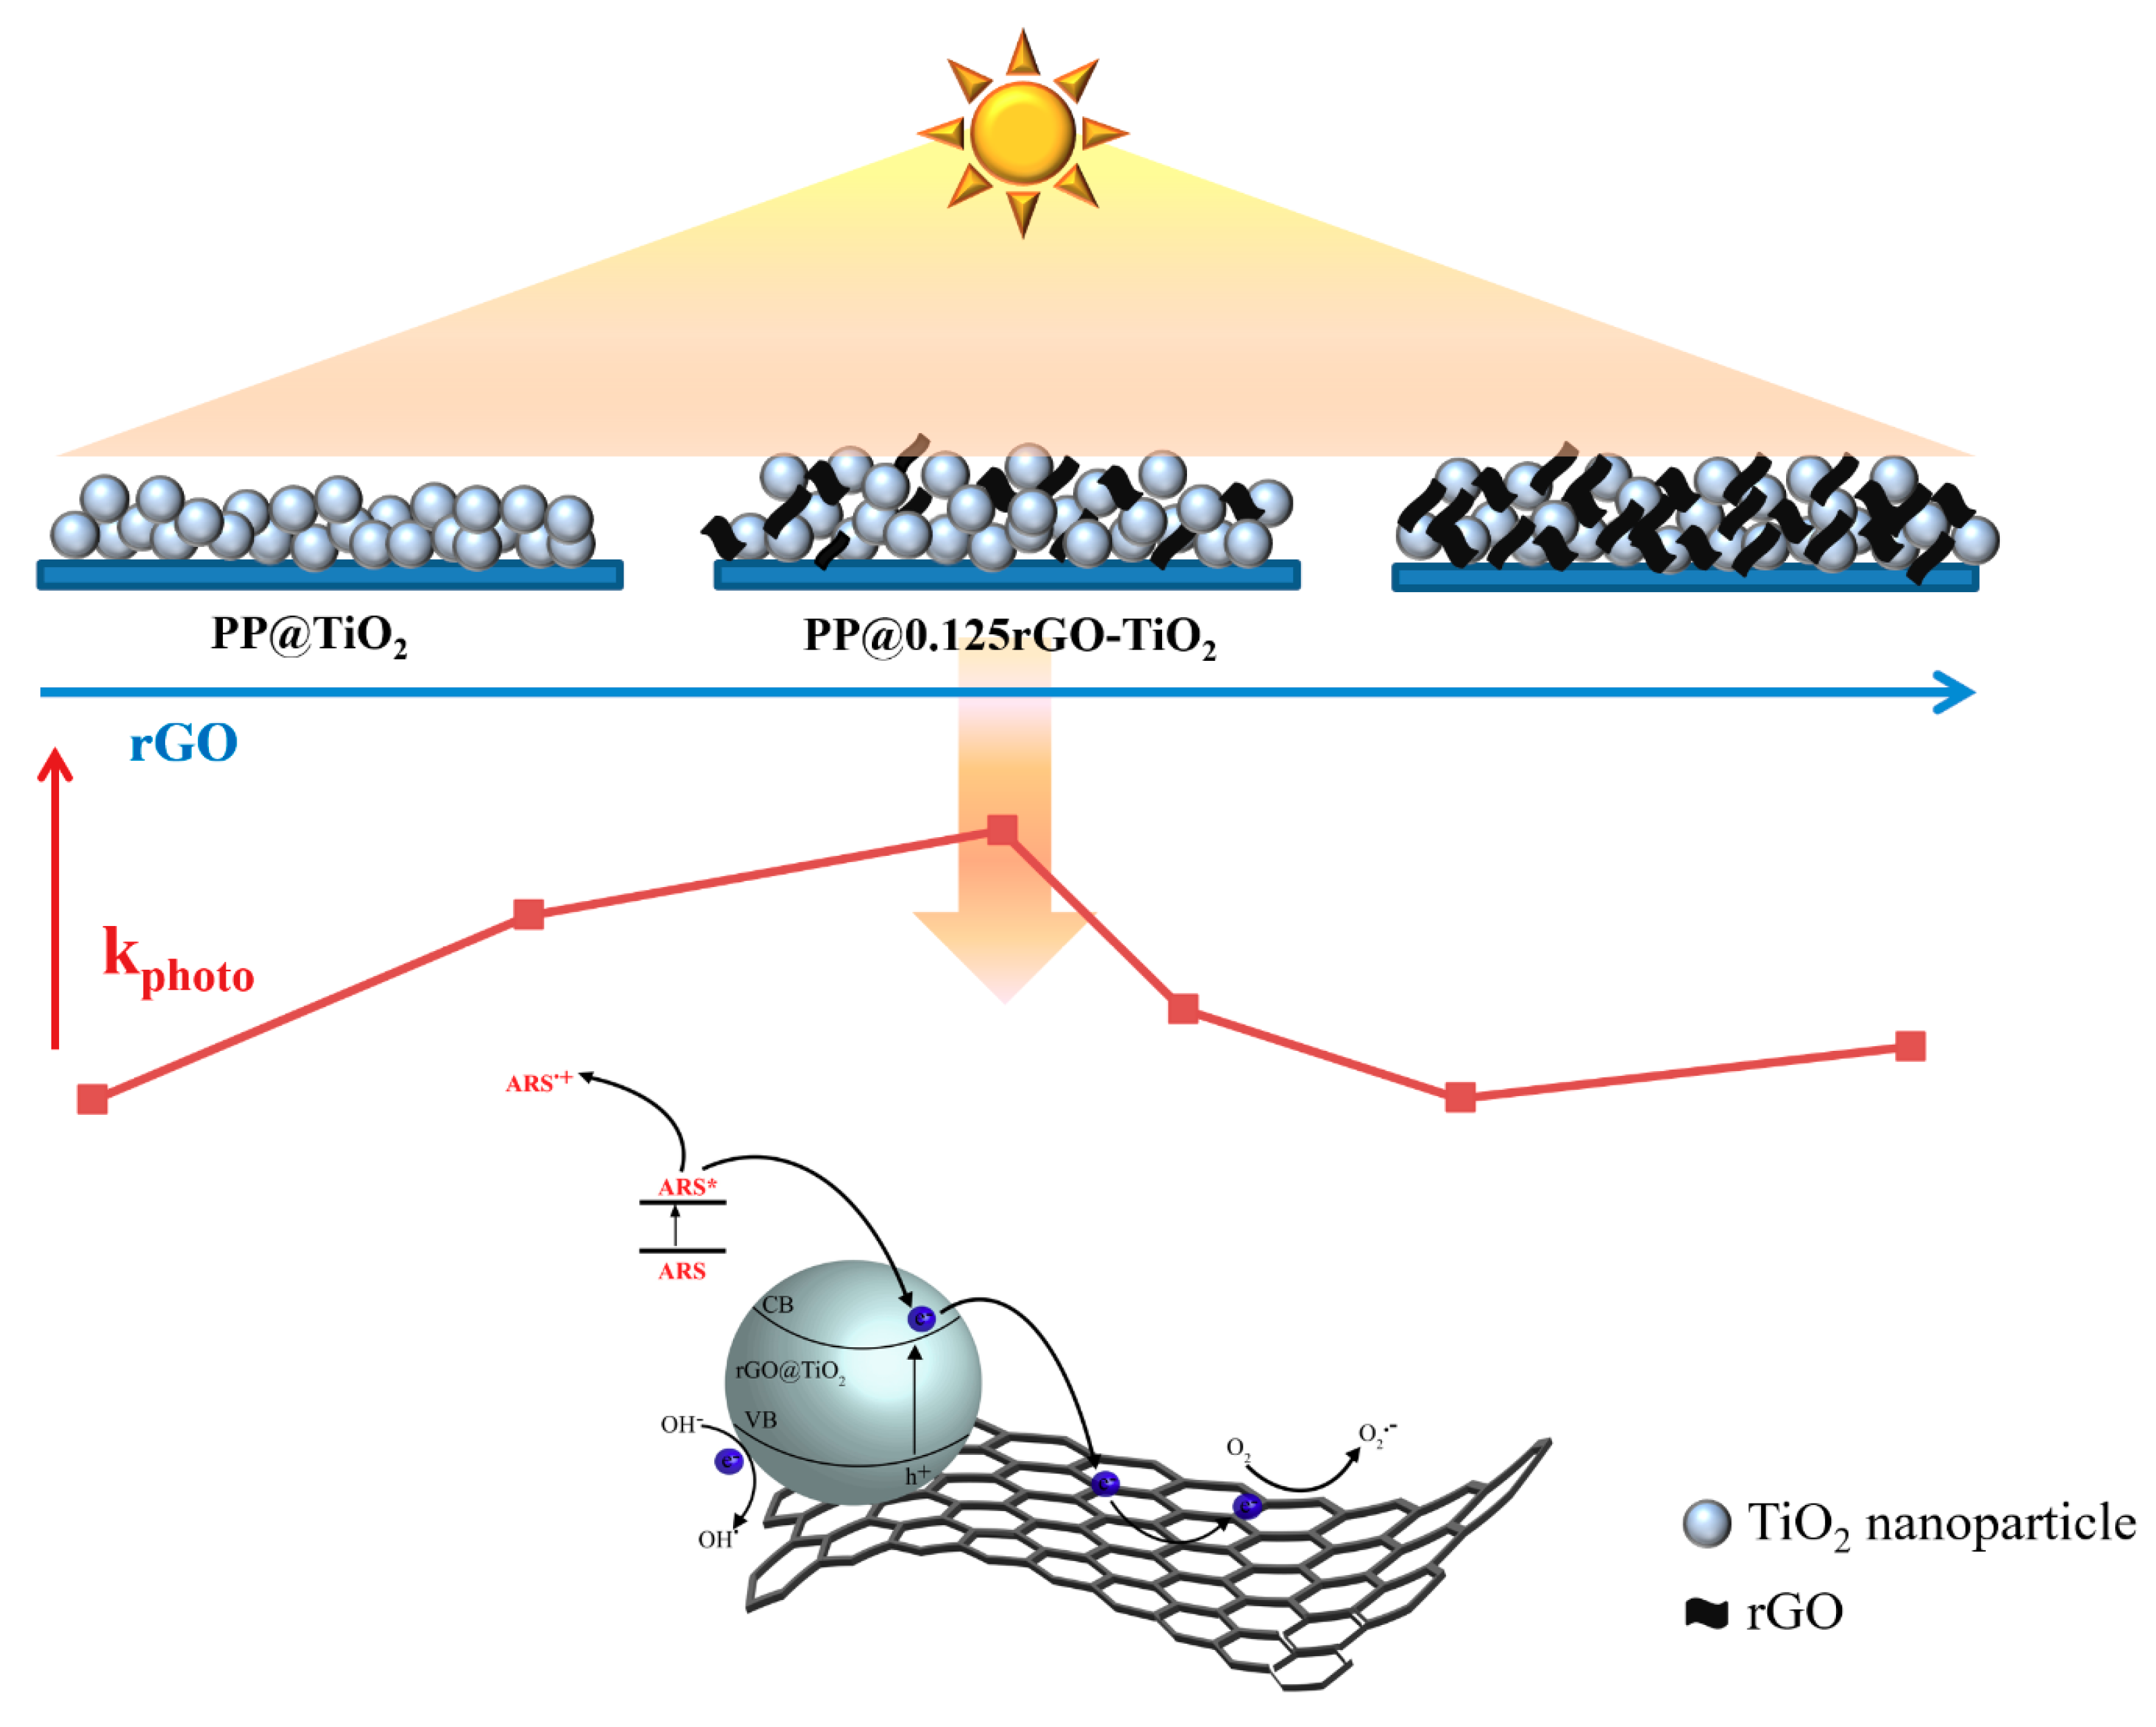
2.2.2. Photocatalytic Activity

The absorbance changes during the ARS adsorption process in dark conditions, monitored at 424 nm for all ARS concentrations ranging from 2.92 × 10⁻⁵ to 8.77 × 10⁻⁵ mol L−1, showed that this process occurred according to Freundlich adsorption isotherm described by the equation Q e = k F C e 1 n . In this relation, Ce is the ARS concentration in solution, Qe is the adsorbed ARS concentration on PP@rGOTiO2 at the equilibrium, kF is a constant value that represents the ability of adsorption, and 1/n is the adsorption intensity. The plot in Figure 8 confirms that the PP@rGOTiO2 photocatalyst fit very well with the Freundlich adsorption isotherm (Pearson’s r = 0.9973, R2 = 0.9929, kF = 6.0842 and 1/n = 0.5957) and demonstrates that, in the ARS adsorption process on PP@rGOTiO2, a multilayer adsorption mechanism can occur due to a highly rough surface, like in the case of PP@TiO2 [34].
In addition, to obtain information about the adsorption and photocatalytic performance of PP@rGO-TiO2 photocatalysts containing different rGO amounts, kinetic measurements of ARS adsorption and photodegradation using the ARS concentration of 5.84 × 10⁻⁵ mol L−1 were performed. For this purpose, to characterize the adsorption kinetic, experimental data were compared with different kinetic models, and it has been found that a pseudo-first order kinetic, expressed by equation ln [ ( Q e Q t ) / Q e ] = k ads t , well describes the obtained results. In this case, Qt is the amount of adsorbed ARS at time t and Qe is the equilibrium concentration in solution, while kads is the pseudo first order adsorption rate constant. The kads values were obtained by the slopes of optimal straight lines derived from the plot of the logarithm term versus time of the pseudo-first order kinetic equation. The graphical calculation of kads and the respective values for all studied PP@rGOTiO2 photocatalysts are reported in Figure 9a and Table 2, respectively.
When comparing the obtained kads values reported in Table 2, is possible to observe that the presence of rGO in PP@rGOTiO2 positively influenced the ARS adsorption kinetics, with respect to the same with PP@TiO2, and with an increase of kads values also demonstrating a disproportional effect in relation to the increase of rGO amount in the composites. This phenomenon is probably due to a concomitant change of the PP@rGOTiO2 adsorption surface and to ARS adsorption on rGO thanks to its π-π interactions between the aromatic region of rGO and the dye molecules [13].
Similarly, in the kinetic of the ARS photodegradation process, experimental data were compared with different kinetic models, and it has been found that a first order kinetic well describes the obtained results [18,33]. According to the equation ln ( C / C 0 ) = k photo t ; C0 and C are the initial concentration of ARS and at time t in solution, respectively, while kphoto is the related first order rate constant.
Table 2 reports the calculated values of kphoto for all PP@rGOTiO2 photocatalysts, while Figure 9b reports the ARS photodegradation versus time for the different PP@rGOTiO2 photocatalysts. From the plots it is possible to deduce that the presence of rGO influenced in a positive way the photodegradation kinetics, with the best performance obtained by using [email protected]2. The increase in photocatalytic activity with this photocatalyst can be therefore attributed to the increase in the adsorption kinetic due to the presence of rGO, and to the simultaneous interaction between rGO sheets and TiO2 in which photogenerated electrons in the conduction band of TiO2 are easily transferred on rGO, inhibiting the electron-hole pairs recombination. Using higher rGO amounts, only slight improvements of kphoto were observed, which were close to the value of PP@TiO2. This was probably due to an excessive rGO amount that, compacting TiO2 nanoparticles, caused a decrease of the light active surface without causing appreciable and positive effects on the photocatalytic activity.

3. Materials and Methods

3.1. Reagents

Graphene oxide powder, d-(+)-Glucose powder, Titanium (IV) dioxide Anatase nano powdered (size < 25 nm), Alizarin Red S, NH4OH solution 28%, hydrochloric acid volumetric standard 1.0 N and acetyl acetone were Sigma Aldrich (St. Louis, MO, USA) products. Triton X-100 was purchased from Merck (Kenilworth, NJ, USA). All of chemicals used were of analytical grade. Catalyst support is polypropylene 2500 material obtained from 3 M (Maplewood, MN, USA). Deionized water was prepared by Osmo Lab UPW 2 laboratory deionizer (Gamma 3 ecologia, Italy).

3.2. Methods

3.2.1. Synthesis and Characterization of Reduced Graphene Oxide

rGO was synthesized by GO thermal reduction. Three different procedures are performed for the reduction of GO: using only NH4OH (1), using only d-(+)-Glucose (2), or with the use of glucose-NH4OH (3). For all the procedures, GO dispersion with a concentration of 0.25 g L−1 was prepared and sonicated for 30 minutes with ultrasonic cleaner Ney 300 Ultrasonik in order to obtain a homogenous dispersion. In procedures (1) and (2) in an open flask with GO dispersion, ammonia solution or d-(+)-Glucose was added drop by drop respectively and stirred at 80 °C for 6 hours. In procedure (3), NH4OH solution was added to the GO dispersion in order to raise the pH value to 11 and the dispersion was made to rest for one night. After that, a glucose solution with a concentration of 8 g L−1 was added to the GO dispersion and stirred for 30 min. At this point, the temperature was increased up to 80 °C and stirred for 3 h. In this case the reduction was performed with a condensation column which hinders the evaporation of water and ammonia solutions. The thermal reduction progress was monitored by UV-Vis spectroscopy with a Cary 8454 Diode Array System spectrophotometer (Agilent Technologies Measurements, Santa Clara, CA, USA).
GO and rGO dispersions were characterized with Dynamic Light Scattering (DLS) measurements performed using a Malvern Zetasizer Nano S (Malvern instrument Worcestershire, Malvern, UK) equipped with a back-scattered light detector operating at 173°. rGO dispersion filtered, washed and dried in a vacuum oven (Vismara Srl Scientific™, Milan, Italy, 65) at 40 °C was analyzed by Raman spectroscopy by using an iHR320 micro-Raman spectrometer (Horiba, Kyoto, Kyoto Prefecture, Japan). The samples were excited with a green laser (λ = 532 nm) emitting at room temperature and the objective outlet was 50x.
The filtered dried rGO was deposited on aluminum stabs using self-adhesive carbon and the morphology of the obtained rGO was examined by Field Emission Scanning Electron Microscopy (FE-SEM, Sigma Family, Zeiss, Oberkochen, Germany) operated at 2 kV.
X-Ray Photoelectron (XPS, VG Scientific Ltd., East Grinstead, UK) analysis of GO and rGO materials was performed by using an un-monochromatized X-ray source (Al Kα) and a CLAM IV hemispherical spectrometer with a passing energy of 50 eV for an overall lower than 1 eV half width at half-maximum (HWHM). The deconvolution study of the XPS spectrum was carried out by Fityk software (Microsoft, GitHub, San Francisco, CA, USA) using Voigt functions.

3.2.2. Photocatalysts Preparation and Characterization

Different amounts of rGO dispersion, containing 0.060, 0.125, 0.150, 0.188 and 0.250 mg of rGO were added to TiO2 during photocatalyst preparation by using TiO2 anatase, water, acetyl acetone and Triton X-100. The obtained pastes were supported on polypropylene strips of 18 cm2 through a dip coating technique, dried and cleaned with HCl obtaining PP@rGO-TiO2 photocatalysts.
PP@rGO-TiO2 photocatalysts were characterized by Atomic Force Microscopy (AFM) and Photoluminescence Spectroscopy (PL). AFM images were obtained with an AFM Veeco 5000 Dimension (Plainview, NY, USA) working in tapping mode. PL spectra were carried out with Perkin-Elmer LS 45 luminescence spectrometer (Waltham, MA, USA) equipped with a pulsed Xe flash lamp using an excitation wavelength of 320 nm in the range from 300–900 nm.

3.2.3. Photocatalytic Application

ARS adsorption and its photodegradation were investigated at acidic pH and at 25 °C by using a thermostated photo-reactor [29]. Nine PP@rGO-TiO2 photocatalysts were immersed into ARS solution with concentration of 5.84 × 10⁻⁵ mol L−1. Adsorption phase was performed for 2 h in dark conditions and, successively, the system was exposed to visible light (tubular JD lamp, LYVIA, Arteleta International S.p.A., Milano, Italy); 80 W, 1375 Lumen) for the photodegradation phase. Adsorption and photodegradation processes were monitored in real time mode by a Cary 8454 Diode Array System UV-Vis spectrophotometer (Agilent Technologies Measurements, Santa Clara, CA, USA) using a quartz cuvette in continuous flux (Hellma Analytics, Mühlheim, Germany; 178.710-QS, light path 10 mm) connected to the photo reactor through a Gilson Miniplus 3 peristaltic pump (Middleton, WI, USA). Kinetic studies for adsorption and photodegradation processes of ARS were carried out, monitoring during time the decrease of absorbance at a maximum wavelength of 424 nm.

4. Conclusions

rGO dispersions were prepared by using three different eco-friendly thermal reduction procedures: With only d-(+)-Glucose, with only NH4OH, and by the glucose-NH4OH system utilizing GO as starting material. The thermal reduction of GO was monitored in time by UV-Vis spectroscopy, and the best result is the reduction method that uses glucose with NH4OH, as schematically summarized in Figure 10.
DLS analysis showed that the GO diameter was bigger than that of rGO, confirming the progressive removal of oxygen content during the reduction process with consequent size decrease. In addition, the ID/IG ratio obtained from Raman spectra increased for rGO with respect to GO, probably because new or more graphitic domains were formed and the sp2 clusters number increased after the reduction process, showing a good reduction efficiency of GO to rGO. Similarly, XPS measurements confirmed the thermal reduction success with a considerably decrease of oxygen functional groups intensity peaks in the rGO sample.
When the obtained rGO dispersion was used to prepare PP@rGO-TiO2 nanocomposite supported on polypropylene, AFM images showed that the average Ra and average Wmax values of PP@rGO-TiO2 were higher than those of PP@TiO2, while PL spectroscopy demonstrated that the presence of rGO provided a good spatial condition for charge transport from TiO2 to rGO via interfaces, decreasing the recombination process between electrons and holes on PP@rGO-TiO2.
The application of PP@rGO-TiO2 as photocatalytic material for the ARS degradation in water solutions showed that, for both adsorption and photodegradation processes, the presence of rGO in TiO2 influences positively the kinetics with respect to PP@TiO2. While the increase in the ARS adsorption kinetic was probably due to the surface increase and to rGO π-π interactions with the dye, the higher photocatalytic performances can be explained not only by the increase in the adsorption kinetic but also by additional interactions between rGO sheets and TiO2.
In this case, the non-correspondence in the behavior between kads and kphoto in relation of rGO amounts explains that, while the range of rGO amounts in the PP@rGO-TiO2 composites is not such as to be related to the kinetic results of ARS absorption process, a prominent effect is instead found in the presence of rGO on the photocatalytic process. This effect is twofold; in fact, rGO amount affects both the active surface of TiO2 to light, but also the electron hole recombination process, as demonstrated by PL measurements. In fact, due to the presence of rGO, the photogenerated electrons in the conduction band of TiO2 were transferred on rGO, which acted as electron acceptor, inhibiting the electron-hole pairs recombination.
Figure 11 reports a schematic representation regarding characteristics and properties of PP@rGO-TiO2 photocatalysts. The rGO amount in [email protected]2 is clearly the best that permits both TiO2 nanoparticles separation with an increase of light active TiO2 surface, favoring the light penetration with the optimal photocatalytic performances.

Author Contributions

M.Z., R.G. (Rita Giovannetti), and E.R. proposed and designed the experiments; E.R. and C.A.D. performed the experiments; M.M., R.G. (Roberto Gunnella) and M.Z. analyzed the data; R.G. (Rita~Giovannetti), S.F. and A.D.C. contributed to reagents, materials, analysis tools; M.Z., R.G. (Rita Giovannetti) and E.R. wrote the paper. All the authors participated in discussions of the research.

Funding

Financial support provided by FAR project 2015-2017 of University of Camerino.

Acknowledgments

The authors gratefully acknowledge University of Camerino for the financial support of the FAR project 2015-2017 and kindly acknowledge School of Science and Technology for the support and the technical resources such as FE-SEM and micro-Raman spectroscopy equipment.

Conflicts of Interest

The authors declare no conflict of interest.

References

  1. Fujishima, A.; Honda, K. Electrochemical Photolysis of Water at a Semiconductor Electrode. Nature 1972, 238, 37–38. [Google Scholar] [CrossRef] [PubMed]
  2. Hoffmann, M.R.; Martin, S.T.; Choi, W.; Bahneman, D.W. Environmental Applications of Semiconductor Photocatalysis. Chem. Rev. 1995, 95, 69–96. [Google Scholar] [CrossRef]
  3. Lijuan, J.; Yajun, W.; Changgen, F. Application of photocatalytic technology in environmental safety. Procedia Eng. 2012, 45, 993–997. [Google Scholar] [CrossRef]
  4. Hashimoto, K.; Irie, H.; Fujishima, A. TiO2 Photocatalysis: A Historical Overview and Future Prospects. Jpn. J. Appl. Phys. 2005, 44, 8269–8285. [Google Scholar] [CrossRef]
  5. Nakata, K.; Fujishima, A. TiO2 photocatalysis: Design and applications. J. Photochem. Photobiol. C 2012, 13, 169–189. [Google Scholar] [CrossRef]
  6. Grätzel, M. Dye-sensitized solar cells. J. Photochem. Photobiol. C 2003, 4, 145–153. [Google Scholar] [CrossRef]
  7. Grätzel, M. Solar Energy Conversion by Dye-Sensitized Photovoltaic Cells. Inorg. Chem. 2005, 44, 6841–6851. [Google Scholar] [CrossRef] [PubMed]
  8. Bhatkhande, D.S.; Pangarkar, V.G.; Beenackers, A.A.C.M. Photocatalytic degradation for environmental applications—A review. J. Chem. Technol. Biotechnol. 2001, 77, 102–116. [Google Scholar] [CrossRef]
  9. Fujishima, A.; Rao, T.N.; Tryk, D.A. Titanium dioxide photocatalysis. J. Photochem. Photobiol. C 2000, 1, 1–21. [Google Scholar] [CrossRef]
  10. Ibhadon, A.O.; Fitzpatrick, P. Heterogeneous Photocatalysis: Recent Advances and Applications. Catalysts 2013, 3, 189–218. [Google Scholar] [CrossRef] [Green Version]
  11. Linsebigler, A.L.; Lu, G.; Yates, J.T. Photocatalysis on TiO2 Surfaces: Principles, Mechanisms, and Selected Results. Chem. Rev. 1995, 95, 735–758. [Google Scholar] [CrossRef]
  12. Qian, W.; Greaney, P.A.; Fowler, S.; Chiu, S.K.; Goforth, A.M.; Jiao, J. Low-Temperature Nitrogen Doping in Ammonia Solution for Production of N-Doped TiO2-Hybridized Graphene as a Highly Efficient Photocatalyst for Water Treatment. ACS Sustain. Chem. Eng. 2014, 2, 1802–1810. [Google Scholar] [CrossRef]
  13. Zhang, H.; Lv, X.; Li, Y.; Wang, Y.; Li, J. P25-Graphene Composite as a High Performance Photocatalyst. ACS Nano 2010, 4, 380–386. [Google Scholar] [CrossRef] [PubMed]
  14. Zhao, D.; Sheng, G.; Chen, C.; Wang, X. Enhanced photocatalytic degradation of methylene blue under visible irradiation on graphene@TiO2 dyade structure. Appl. Catal. B 2012, 111–112, 303–308. [Google Scholar] [CrossRef]
  15. Khalid, N.R.; Ahmed, E.; Hong, Z.; Sana, L.; Ahmed, M. Enhanced photocatalytic activity of graphene-TiO2 composite under visible light irradiation. Curr. Appl. Phys. 2013, 13, 659–663. [Google Scholar] [CrossRef]
  16. Gu, Y.; Xing, M.; Zhang, J. Synthesis and photocatalytic activity of graphene based doped TiO2 nanocomposites. Appl. Surf. Sci. 2014, 319, 8–15. [Google Scholar] [CrossRef]
  17. Rao, C.N.R.; Sood, A.K.; Subrahmanyam, K.S.; Govindaraj, A. Graphene: The New Two-Dimensional Nanomaterial. Angew. Chem. Int. Ed. 2009, 48, 7752–7777. [Google Scholar] [CrossRef]
  18. Giovannetti, R.; Rommozzi, E.; Zannotti, M.; D’Amato, C.A.; Ferraro, S.; Cespi, M.; Bonacucina, G.; Minicucci, M.; Di Cicco, A. Exfoliation of graphite into graphene in aqueous solution: an application as graphene/TiO2 nanocomposite to improve visible light photocatalytic activity. RSC Adv. 2016, 6, 93048–93055. [Google Scholar] [CrossRef]
  19. Chen, B.T.H.; Peng, H.; Wang, Z.; Huang, W. Graphene Modified TiO2 Composite Photocatalysts: Mechanism, Progress and Perspective. Nanomaterials 2018, 8, 105. [Google Scholar] [CrossRef]
  20. Wang, Y.; Shi, Z.X.; Yin, J. Facile Synthesis of Soluble Graphene via a Green Reduction of Graphene Oxide in Tea Solution and Its Biocomposites. ACS Appl. Mater. Interfaces 2011, 3, 1127–1133. [Google Scholar] [CrossRef]
  21. Yi, M.; Shen, Z. A review on mechanical exfoliation for the scalable production of graphene. J. Mater. Chem. A 2015, 3, 11700–11715. [Google Scholar] [CrossRef]
  22. Zhang, Y.; Zhang, L.; Zhou, C. Review of Chemical Vapor Deposition of Graphene and Related Applications. Acc. Chem. Res. 2013, 46, 2329–2339. [Google Scholar] [CrossRef] [PubMed]
  23. Tetlow, H.; Posthuma de Boer, J.; Ford, I.J.; Vvedensky, D.D.; Coraux, J.; Kantorovich, L. Growth of epitaxial graphene: Theory and experiment. Phys. Rep. 2014, 542, 195–295. [Google Scholar] [CrossRef] [Green Version]
  24. Gao, W. The Chemistry of Graphene Oxide; Springer: Cham, Switzerland, 2015; ISBN 978-3-319-15500-5. [Google Scholar]
  25. Brodie, C. Sur le poids atomique du graphite. Ann. Chim. Phys. 1860, 59, 466–472. [Google Scholar]
  26. Staudenmaier, L. Verfahren zur Darstellung der Graphitsäure. Ber. Deut. Chem. Ges. 1898, 31, 1481–1487. [Google Scholar] [CrossRef]
  27. Hummers, W.S.; Offeman, R.E. Preparation of Graphitic Oxide. J. Am. Chem. Soc. 1958, 80, 1339. [Google Scholar] [CrossRef]
  28. Paredes, J.I.; Villar-Rodil, S.; Martinez-Alonso, A.; Tascon, J.M.D. Graphene Oxide Dispersions in Organic Solvents. Langmuir 2008, 24, 10560–10564. [Google Scholar] [CrossRef] [PubMed]
  29. Zhu, Y.; Murali, S.; Cai, W.; Li, X.; Suk, J.W.; Potts, J.R.; Ruoff, R.S. Graphene and Graphene Oxide: Synthesis, Properties, and Applications. Adv. Mater. 2010, 22, 3906–3924. [Google Scholar] [CrossRef]
  30. Dreyer, D.R.; Park, S.; Bielawski, C.W.; Ruoff, R.S. The chemistry of graphene oxide. Chem. Soc. Rev. 2010, 39, 228–240. [Google Scholar] [CrossRef]
  31. Maddinedi, S.B.; Mandal, B.K.; Vankayala, R.; Kalluru, P.; Pamanji, S.R. Bioinspired reduced graphene oxide nanosheets using Terminalia chebula seeds extract. Spectrochim. Acta Part A 2015, 145, 117–124. [Google Scholar] [CrossRef]
  32. Zhu, C.; Guo, S.; Fang, Y.; Dong, S. Reducing Sugar: New Functional Molecules for the Green Synthesis of Graphene Nanosheets. ACS Nano 2010, 4, 2429–2437. [Google Scholar] [CrossRef] [PubMed]
  33. Fan, X.; Peng, W.; Li, Y.; Li, X.; Wang, S.; Zhang, G.; Zhang, F. Deoxygenation of Exfoliated Graphite Oxide under Alkaline Conditions: A Green Route to Graphene Preparation. Adv. Mater. 2008, 20, 4490–4493. [Google Scholar] [CrossRef]
  34. Giovannetti, R.; D’ Amato, C.A.; Zannotti, M.; Rommozzi, E.; Gunnella, R.; Minicucci, M.; Di Cicco, A. Visible light photoactivity of Polypropylene coated Nano-TiO2 for dyes degradation in water. Sci. Rep. 2015, 5, 17801. [Google Scholar] [CrossRef] [PubMed]
  35. Stankovich, S.; Dikin, D.A.; Piner, R.D.; Kohlhaas, K.A.; Kleinhammes, A.; Jia, Y.; Wu, Y.; Nguyen, S.B.T.; Ruoff, R.S. Synthesis of graphene-based nanosheets via chemical reduction of exfoliated graphite oxide. Carbon 2007, 45, 1558–1565. [Google Scholar] [CrossRef]
  36. Liu, S.; Zeng, T.H.; Hofmann, M.; Burcombe, E.; Wei, J.; Jiang, R. Antibacterial activity of graphite, graphite oxide, graphene oxide, and reduced graphene oxide: membrane and oxidative stress. ACS Nano 2011, 5, 96971–96980. [Google Scholar] [CrossRef] [PubMed]
  37. Saxena, S.; Tyson, T.A.; Shukla, S.; Negusse, E.; Chen, H.; Bai, J. Investigation of structural and electronic properties of graphene oxide. Appl. Phys. Lett. 2011, 99, 013104. [Google Scholar] [CrossRef]
  38. Dubale, A.A.; Su, W.N.; Tamirat, A.G.; Pan, C.J.; Aragaw, B.A.; Chen, H.M.; Chen, C.H.; Hwang, B.J. The synergetic effect of graphene on Cu2O nanowire arrays as a highly efficient hydrogen evolution photocathode in water splitting. J. Mater. Chem. A 2014, 2, 18383–18397. [Google Scholar] [CrossRef]
  39. Sobon, G.; Sotor, J.; Jagiello, J.; Kozinski, R.; Zdrojek, M.; Holdynski, M.; Paletko, P.; Boguslawski, J.; Lipinska, L.; Abramski, K.M. Graphene Oxide vs. Reduced Graphene Oxide as saturable absorbers for Er-doped passively mode-locked fiber laser. Opt. Express 2012, 20, 19463–19473. [Google Scholar] [CrossRef]
  40. Sadhukhan, S.; Ghosh, T.K.; Rana, D.; Roy, I.; Bhattacharyya, A.; Sarkar, G.; Chakraborty, M.; Chattopadhyay, D. Studies on synthesis of reduced graphene oxide (RGO) via green route and its electrical property. Mater. Res. Bull. 2016, 79, 41–51. [Google Scholar] [CrossRef]
  41. Pei, S.; Cheng, H.M. The reduction of graphene oxide. Carbon 2012, 50, 3210–3228. [Google Scholar] [CrossRef]
  42. Li, X.; Wang, H.; Robinson, J.T.; Sanchez, H.; Diankov, G.; Dai, H. Simultaneous Nitrogen Doping and Reduction of Graphene Oxide. J. Am. Chem. Soc. 2009, 131, 15939–15944. [Google Scholar] [CrossRef] [PubMed] [Green Version]
  43. Wu, Y.; Liu, H.; Zhang, J.; Chen, F. Enhanced Photocatalytic Activity of Nitrogen-Doped Titania by Deposited with Gold. J. Phys. Chem. C 2009, 113, 14689–14695. [Google Scholar] [CrossRef]
  44. Dubey, P.K.; Tripathi, P.; Tiwari, R.S.; Sinha, A.S.K.; Srivastava, O.N. Synthesis of reduced graphene oxideeTiO2 nanoparticle composite systems and its application in hydrogen production. Int. J. Hydrog. Energy 2014, 39, 16282–16292. [Google Scholar] [CrossRef]
  45. Woan, K.; Pyrgiotakis, G.; Sigmund, W. Photocatalytic Carbon-Nanotube–TiO2 Composites. Adv. Mater. 2009, 21, 2233–2239. [Google Scholar] [CrossRef]
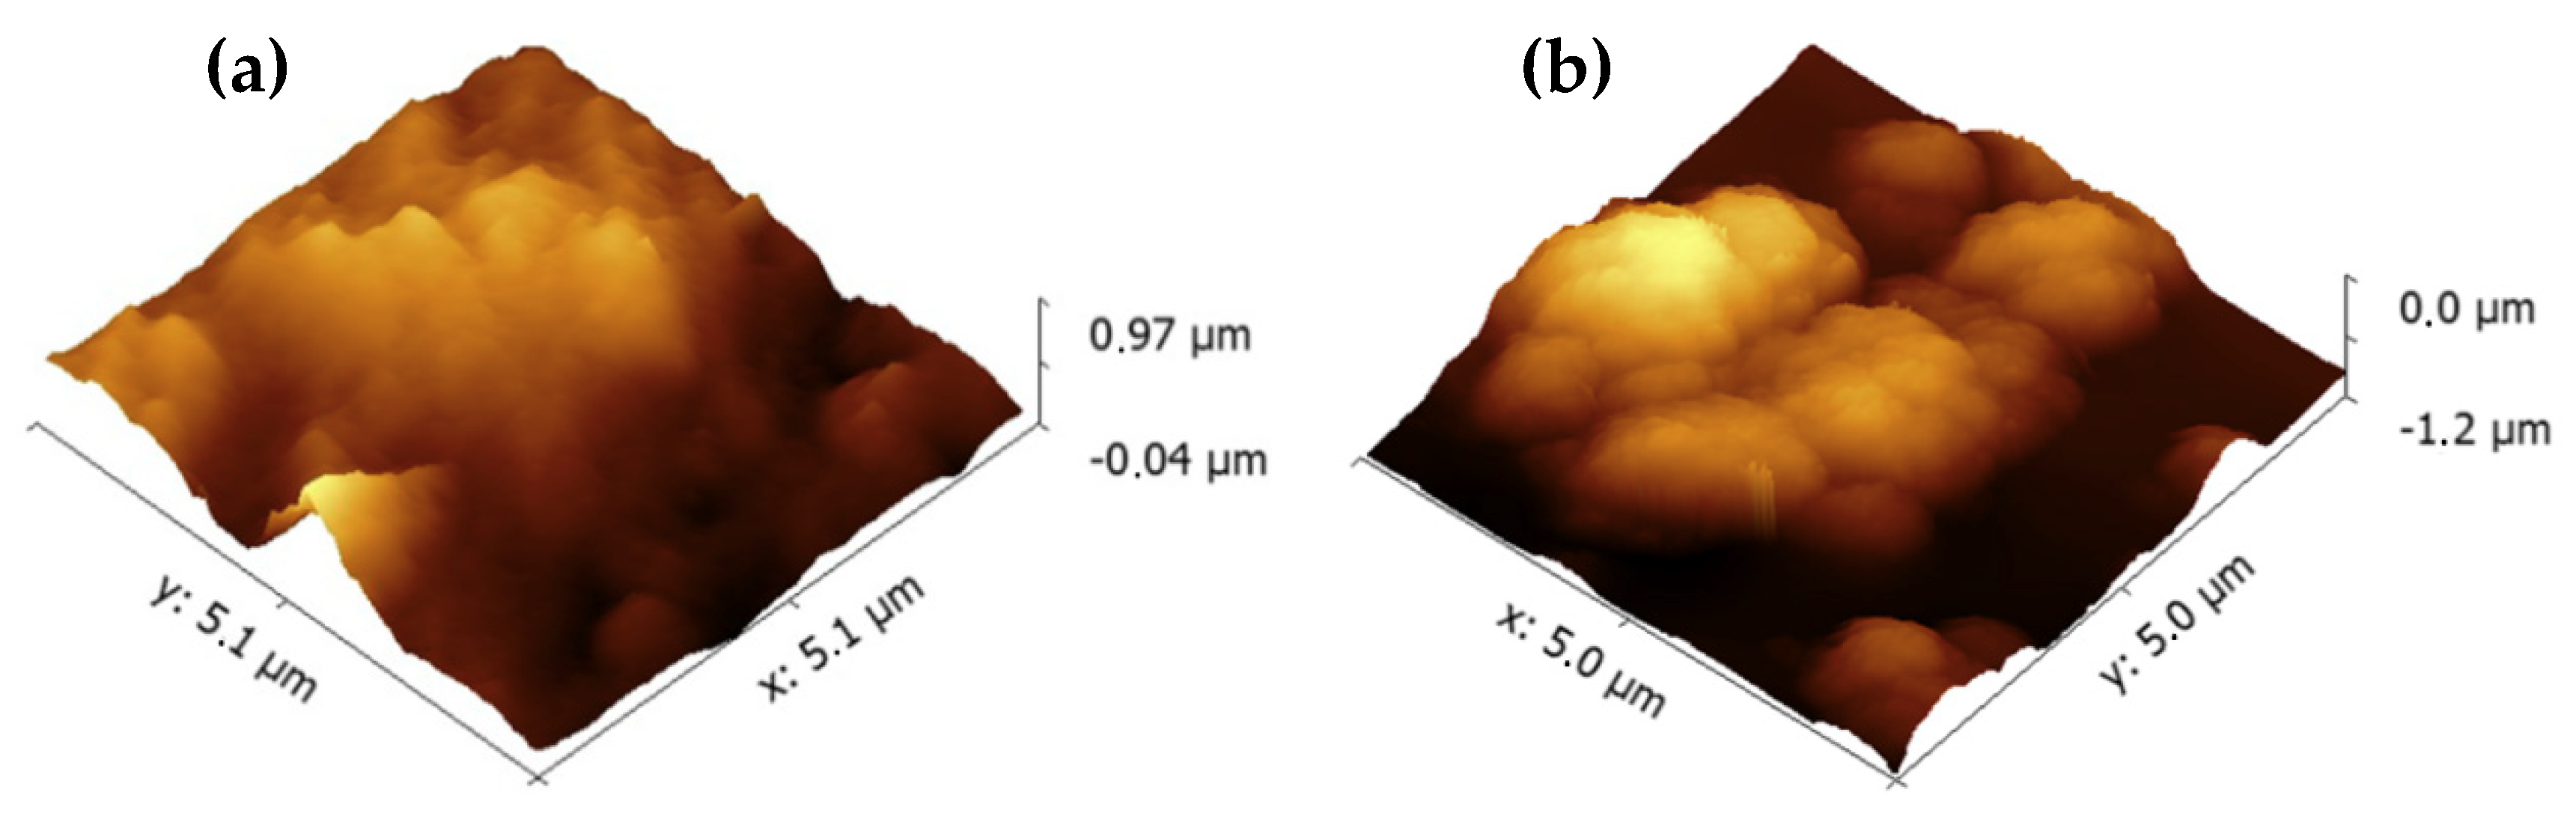
Figure 1. UV-Vis Spectra of graphene oxide (GO) and reduced graphene oxide (rGO).
Catalysts 08 00598 g001
Figure 2. (a) Wavelength changes of the maximum peak in the three different operative conditions and (b) Uv-Vis spectral change during the reduction of graphene oxide in the glucose-NH4OH system, as function of reaction time.
Catalysts 08 00598 g002
Figure 3. GO and rGO; (a) Dynamic Light Scattering (DLS) analysis of dispersion; (b) Raman spectra.
Catalysts 08 00598 g003
Figure 4. XPS spectra of GO and rGO.
Catalysts 08 00598 g004
Figure 5. SEM images with different magnifications of GO (a,b) and rGO (c,d) sheets.
Catalysts 08 00598 g005
Figure 6. 3D images of PP@TiO2 (a) and PP@rGO-TiO2 (b) photocatalysts.
Catalysts 08 00598 g006
Figure 7. PL spectra of PP@TiO2 and PP@rGO-TiO2 photocatalysts containing 0.125 mg of rGO.
Catalysts 08 00598 g007
Figure 8. Linear regression analysis of data using the Freundlich adsorption isotherm.
Catalysts 08 00598 g008
Figure 9. (a) Graphical calculation of kads; (b) effect of time in the Alizarin Red S (ARS) photodegradation.
Catalysts 08 00598 g009
Figure 10. Schematic representation of glucose-NH4OH thermal reduction of GO to rGO.
Catalysts 08 00598 g010
Figure 11. Schematic representation of PP@rGO-TiO2 photocatalysts: characteristics and properties.
Catalysts 08 00598 g011
Table 1. Ra and Wmax values for PP@TiO2 and PP@rGO-TiO2 photocatalysts.
Ra (nm)Wmax (nm)
PP@TiO233.899.11
PP@rGOTiO241.40136.40
Table 2. kads and kphoto values with R2 for all photocatalysts.
Catalyst Namekads × 102R2adskphoto × 103R2photo
PP@TiO22.540.99637.700.9960
[email protected]23.930.996510.100.9889
[email protected]23.780.997811.200.9971
[email protected]23.540.99798.890.9994
[email protected]23.860.99407.730.9939
[email protected]23.660.99648.410.9937

